Article

The Carbon Sequestration Potential of Silky Oak (Grevillea robusta A.Cunn. ex R.Br.), a High-Value Economic Wood in Thailand

by
Teerawong Laosuwan
1,*,
Yannawut Uttaruk
2,
Satith Sangpradid
3,
Chetphong Butthep
4 and
Smith Leammanee
5
1
Department of Physics, Faculty of Science, Mahasarakham University, Maha Sarakham 44150, Thailand
2
Department of Biology, Faculty of Science, Mahasarakham University, Maha Sarakham 44150, Thailand
3
Department of Geoinformatics, Faculty of Informatics, Mahasarakham University, Maha Sarakham 44150, Thailand
4
Space Technology and Geoinformatics Research Unit, Faculty of Science, Mahasarakham University, Maha Sarakham 44150, Thailand
5
Wave BCG Co., Ltd., 2445/19 Tararom Business Tower 14th Floor, New Petchaburi Rd, Bang Kapi, Huai Khwang, Bangkok 10310, Thailand
*
Author to whom correspondence should be addressed.
Forests 2023, 14(9), 1824; https://doi.org/10.3390/f14091824
Submission received: 16 August 2023 / Revised: 27 August 2023 / Accepted: 28 August 2023 / Published: 7 September 2023
(This article belongs to the Special Issue Impact of Climate Change on Tree Growth)

Abstract

:
Silky Oak or Silver Oak (Grevillea robusta A.Cunn. ex R.Br.) is classified as a high-value economic wood in Thailand, it is also considered to be a plant that can grow rapidly, and it has the potential to efficiently reduce greenhouse gases emitted into the atmosphere. This research aimed to study and develop an allometric equation to evaluate the biomass of F1 Silky Oak, which was imported to Thailand from Australia, and grown in Thailand’s economic woods in Silky Oak sites in Pak Chong District, Nakhon Ratchasima Province. The sample group consisted of trees of different ages (i.e., of 2 years, 3–4 years, and 7 years). An allometric equation was used to determine the tree biomass, based on mathematical models that describe the relationship between tree biomass and diameter at breast height (DBH). It was developed in the form of a quadratic equation by multiplying the square DBH by the total height (DBH2 × Ht). Subsequently, the equation was separated into different components, which corresponded with different parts of the tree (i.e., stem, branches, leaves, and roots). The following equations were obtained for the stem: Ws = 0.0721 (D2H) 0.8297 R2 = 0.998. The following equations were obtained for the branches: Wb = 0.0772 (D2H) 0.7027 R2 = 0.977. The following equations were obtained for the leaves, Wl = 0.2085 (D2H) 0.4313 R2 = 0.990. The following equations were obtained for the roots: Wr = 0.3337 (D2H) 0.4886 R2 = 0.957. The results of a laboratory elemental analysis of the carbon sequestration in the biomass, using a CHN elemental analyzer, showed that the mean percentage of carbon content in the stems, branches, leaves, and roots was 45.805. Applying the developed allometric equation for evaluating carbon sequestration, using the survey data from the sample sites of Silky Oak, it was found that the amount of carbon sequestration for the aboveground biomass in three sites was 130.63 tCO2eq. When the amount was converted into carbon dioxide, which was absorbed in the three sites, we obtained a value of 478.99 tCO2eq. The results of the application of the allometric equation showed that there was substantial carbon sequestration potential in the surveyed sites, emphasizing the role of Silky Oak plantations for climate change mitigation and sustainable land management. This study advances our understanding of Silky Oak growth and carbon storage dynamics, offering valuable tools for biomass estimation and promoting environmentally beneficial land use practices.

1. Introduction

Fossil fuel combustion and deforestation are human activities which emit very high quantities of greenhouse gases into the atmosphere, and thus, they are major determinants of climate change. In 2000, the content of greenhouse gases emitted from all types of activities throughout the world was 41,755 MtCO2e, of which, 77% was carbon dioxide (CO2), 14% was methane (CH4), 8% was nitrous oxide (N2O), and 1% was hydrofluorocarbons (HFCs), perfluorocarbons (PFCs), and sulfur hexafluoride (SF6) [1,2,3]. Thus, carbon dioxide produced due to human activities is the main greenhouse gas involved in climate change [4,5,6]. Forests play an important role in the carbon cycle. Each year, forests from across the world absorb around 2.6 billion tons of carbon dioxide from the atmosphere. Simultaneously, changes in land use and deforestation also contribute to the quantity of carbon dioxide in the atmosphere, which were estimated to be around 1.6 billion tons (i.e., 20% of total greenhouse gas emissions). In Thailand, in 2000, changes in land use and deforestation contributed to the emission of 44.2 million tons of carbon dioxide, whereas forests sequestered 52.4 million tons of carbon. Consequently, forests play an important role in reducing the amount of carbon dioxide in the atmosphere. In forests, carbon is stored in aboveground biomass, belowground biomass, dead trees, humus, and soil carbon. The average carbon sequestration in the forest areas of Thailand amounts to 252.87 t ha−1. Carbon sequestration reaches 407.25 t ha−1 in rainforests and 101.25 t ha−1 in deciduous forests [7].
Currently, scientists are very interested in the evaluation of forest biomass [8,9,10,11,12,13,14,15] because it allows the determination of the carbon sequestration potential of forest ecosystems that are threatened by global warming and deforestation for land use [16,17,18]. As a result, it is necessary to enhance our understanding of how carbon is stored in the biomass of forests in various ecosystems in order to manage forest resources correctly [19]. To deal with climate change, which is becoming increasingly severe [20], the evaluation of biomass can be helpful. It can be performed directly and indirectly [21]. The direct evaluation of biomass involves cutting all plants in a studied area and weighing them; however, this method is only appropriate for the evaluation of biomass in small areas [22]. In fact, it may be difficult to cut all plants in large areas, and this may cause the destruction of large resources [23]. As a result, the indirect evaluation of biomass is more convenient. Among the indirect evaluation methods for biomass, the allometry method is most preferred [24,25,26,27,28].
The Silky Oak, or Silver Oak (Grevillea robusta A.Cunn. ex R.Br.), is a type of tree in the Proteaceae family [29] that is considered to produce a high-value economic wood in Thailand [30,31]. It is a native Australian species that originated in the northern part of New South Wales and in the southern part of Queensland [32]. Currently, it is grown throughout the world. The Silky Oak is classified as a seedling that rapidly grows and is resistant against coldness and drought. Silky Oak trees have been imported and grown in types of economic wood in various countries throughout the world, including Thailand [33]. Currently, the world is facing an economic, social, and environmental crisis caused by severe climate change due to the increased level of greenhouse gases in the atmosphere, especially carbon dioxide. The global community is aware of this problem [34]; therefore, some measures have been proposed for controlling the number of greenhouse gas emissions and promoting carbon dioxide absorption and sequestration in the agricultural and forest sectors, such as increasing the number of forests and green areas. In this context, there is a great opportunity to promote the planting of Silky Oak to sustainably improve carbon dioxide absorption and sequestration in the long term. This species can contribute to climate change mitigation and ecosystem health improvement, together with other interventions including various trees, plants, ecosystems, and sustainable practices. Moreover, the planting of Silky Oak would also promote the economy and environment on a local level [35]. Additionally, Silky Oak wood is popular with architects and custom furnituremakers, and the trends in the timber construction industry predict an increased demand for timber for new urban dwellers in the future. These buildings could store 0.01–0.68 GtC·yr−1, and the primary superstructure would account for the largest share of carbon storage (~80%) in a building assembly [36].
Many studies have investigated the carbon sequestration potential of Silky Oak [36,37,38,39,40] using allometric equations and applying them to areas with mixed compositions, specific locations, biogeographical regions, or biomes with particular climates [41]. However, no studies have been published on the carbon sequestration potential of Silky Oak in Thailand. This knowledge is important to support and promote a healthy economy, society, and environment in a sustainable manner. This research aimed to develop an allometric equation to evaluate the biomass of F1 Silky Oak imported from Australia to Thailand. These trees were grown as an economic wood in Silky Oak sites in Pak Chong District, Nakhon Ratchasima Province, Thailand.

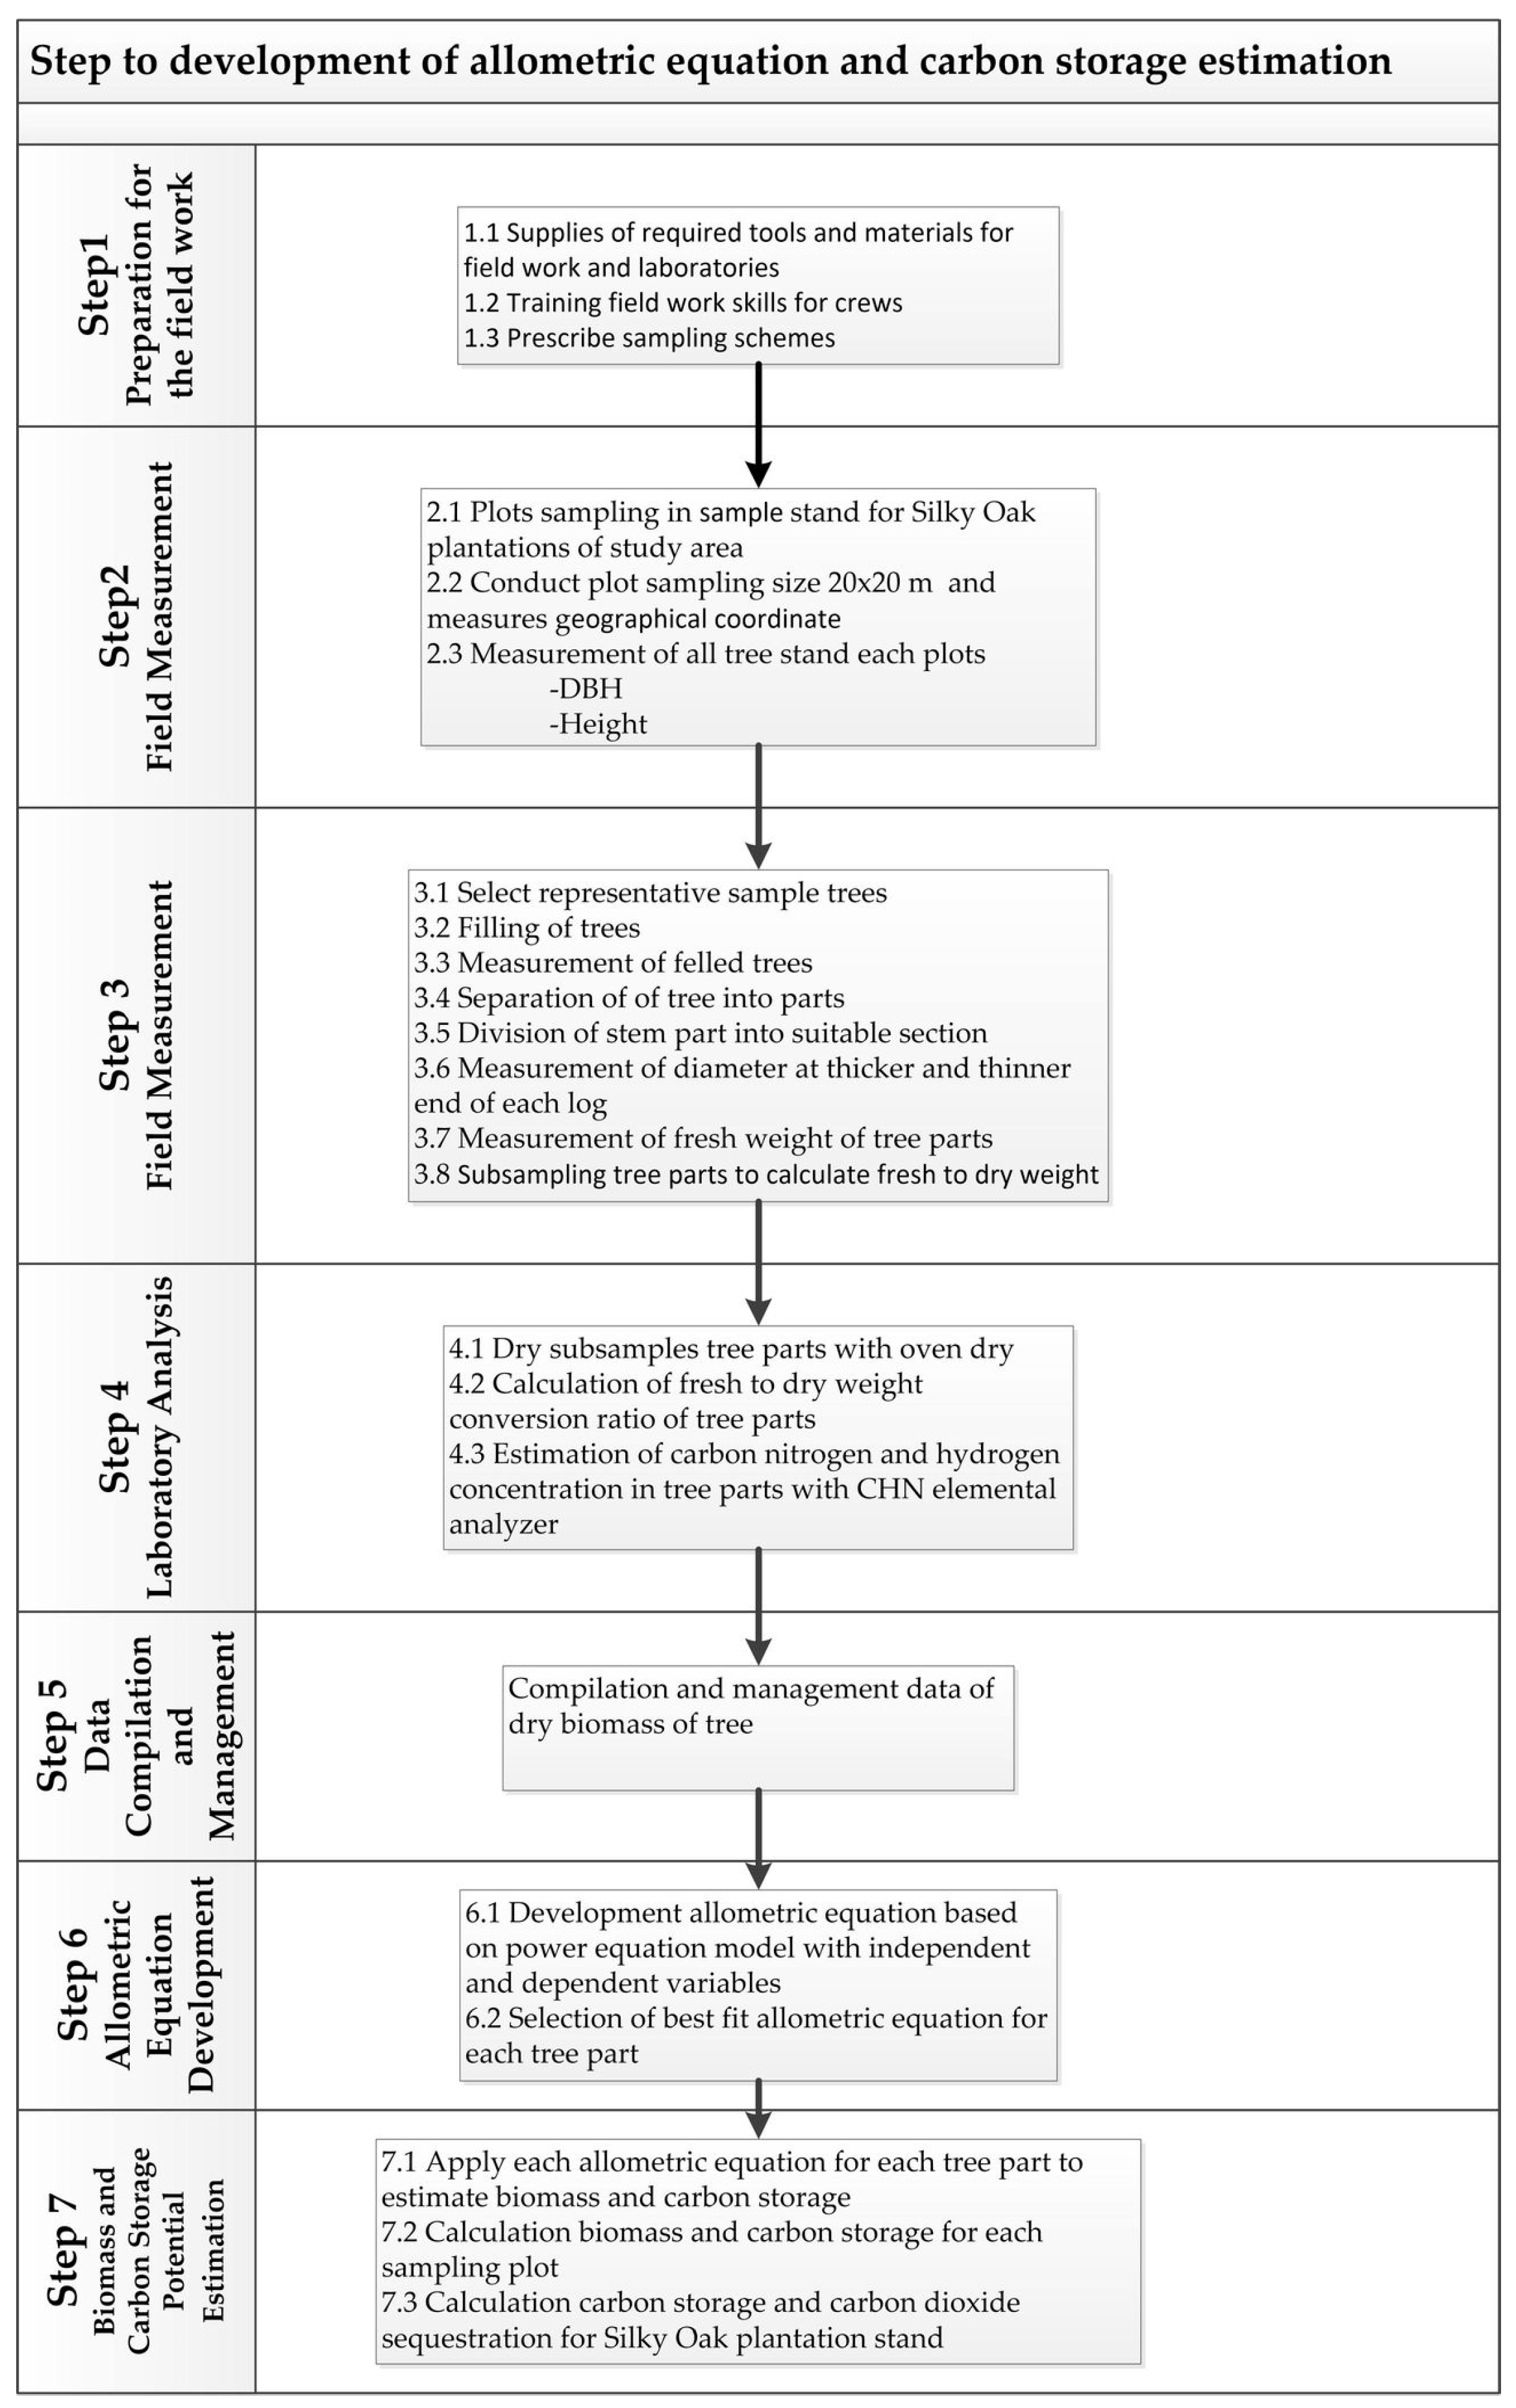
2. Materials and Methods
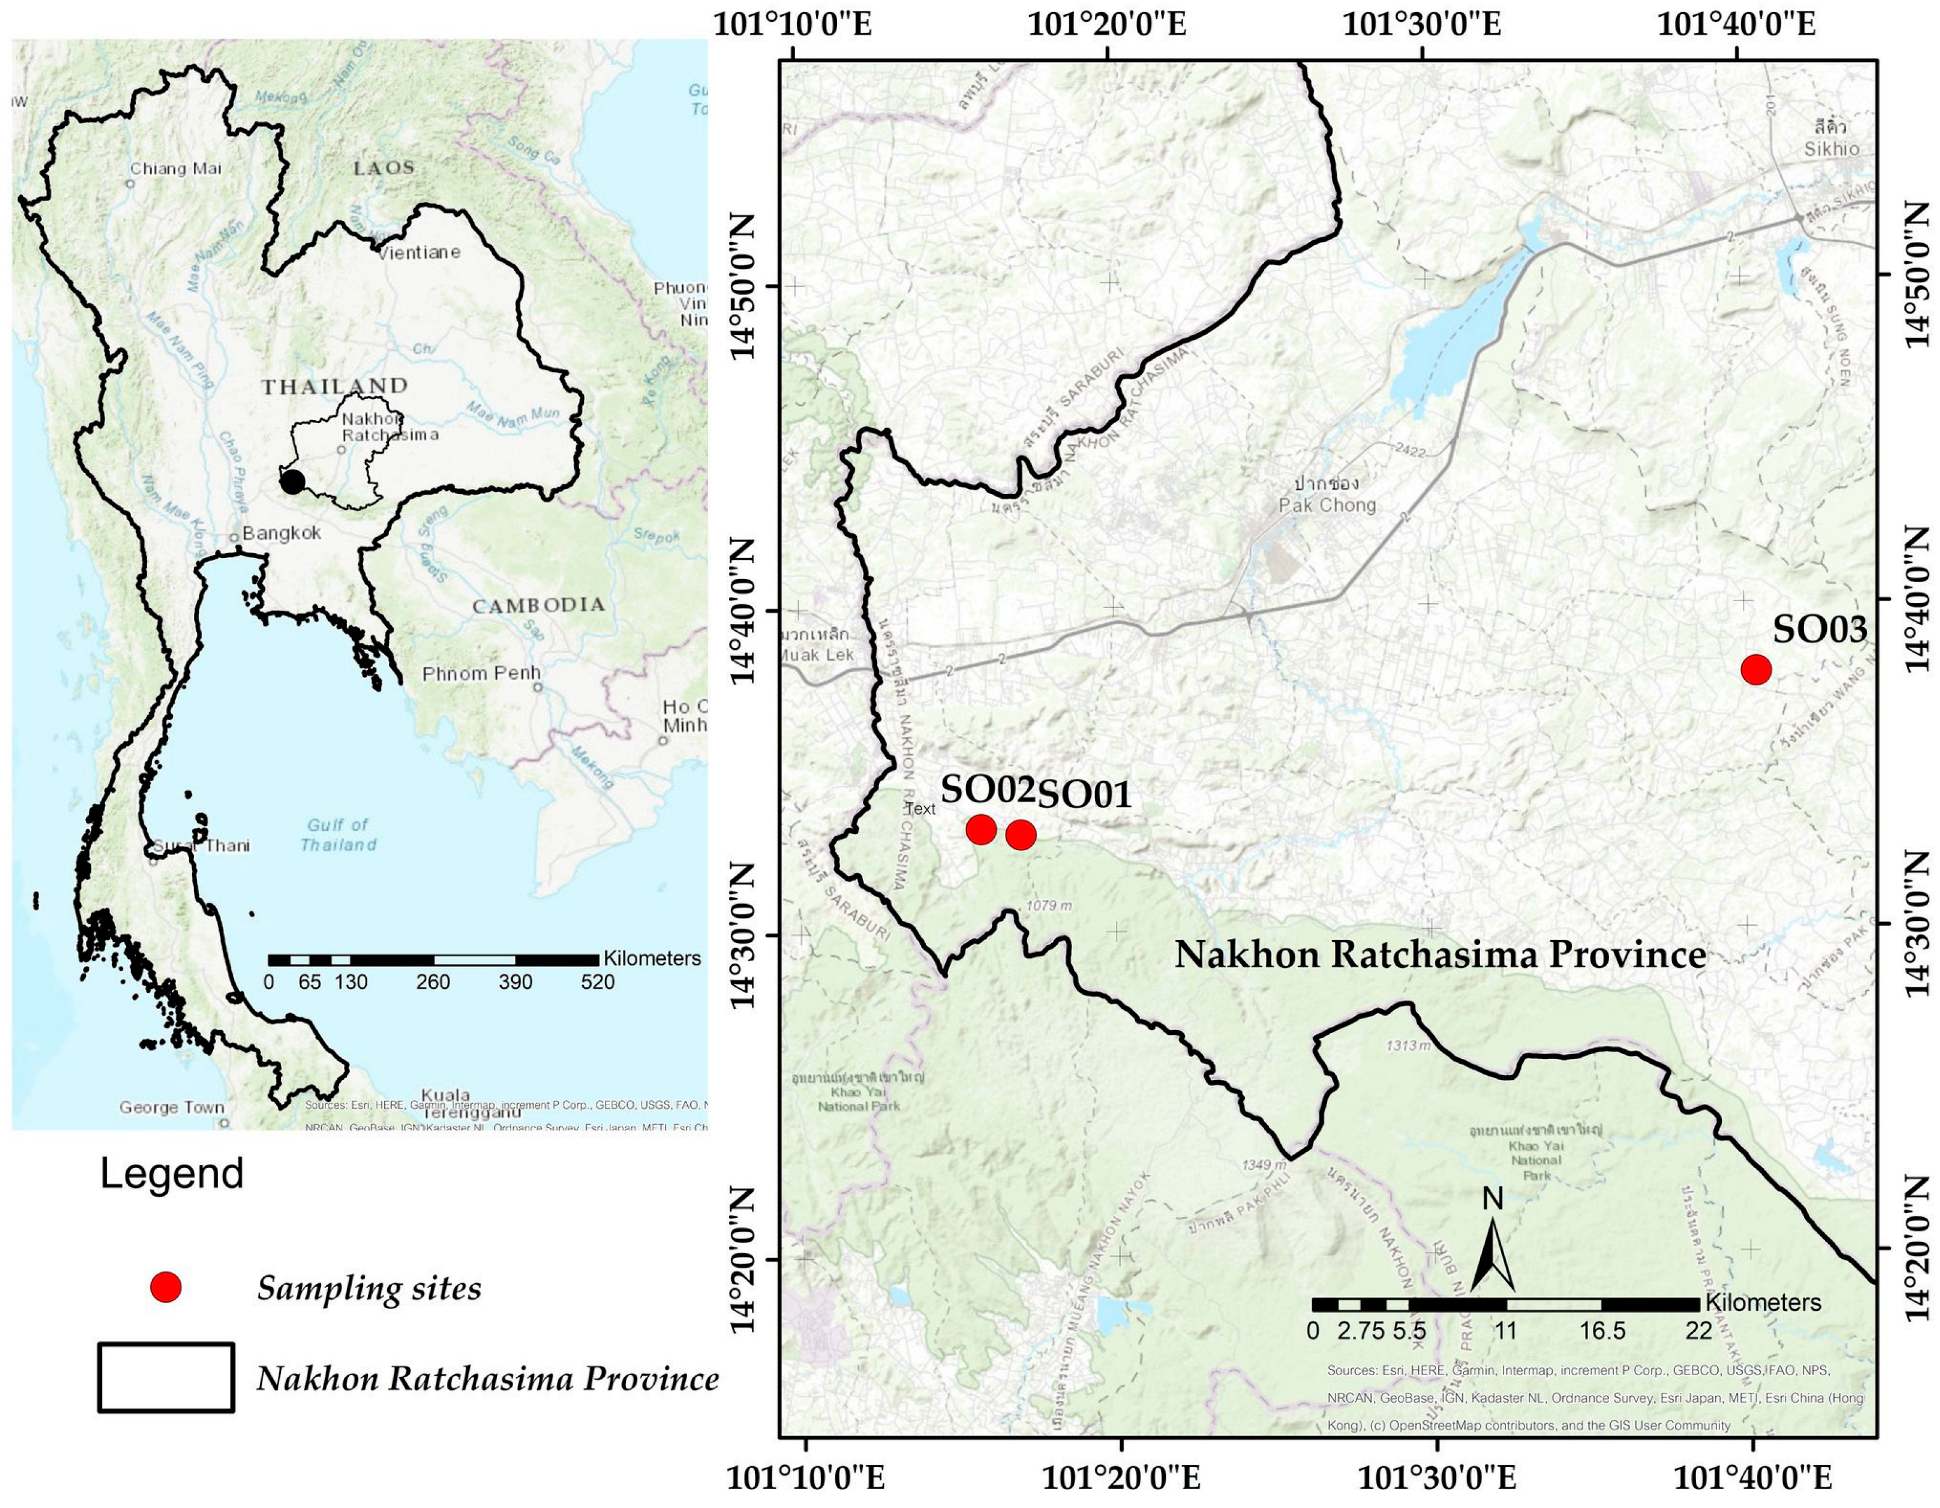
The methodology to develop the allometric equation consisted of 7 steps (i.e., preparation of the field work, field measurements, laboratory analysis, data compilation and management, allometric equation formulation, and biomass and carbon storage potential estimation). These steps are described in detail in Figure 1.

2.1. Study Area

The study area examined this research paper is located in Pak Chong District, Nakhon Ratchasima Province, Thailand (Figure 2). Pak Chong District is in the southwest of Nakhon Ratchasima Province. It has an area of approximately 1825.2 km2. Topographically, Pak Chong District is a pan basin surrounded by mountains, with an altitude more than 250 m above sea level and an average rainfall throughout the year of approximately 1112.0 mm. The soil is characterized by the presence of sediments derived from a decomposition of shale and limestone. It is well-drained, retains moisture well, and has moderate fertility. Its deep layers consist of reddish-brown laterite containing fine clay. The climate of Pak Chong District is classified as a Tropical Savanna. Generally, in Pak Chong District, the rainy season lasts from mid-May to mid-October, winter lasts from mid-October to mid-February, and summer lasts from mid-February to mid-May. The average temperature throughout the year is 27.7 °C, the average minimum temperature is 23.2 °C, and the average maximum temperature is 33.2 °C.
The sample sites with a size of 20 × 20 m were selected in Silky Oak areas containing trees of different ages. Four sites with seven year-old trees (SO01), one site with two year-old trees (SO02), and four sites with three to four year-old trees (SO03) were chosen. All studied areas were in Pak Chong District, Nakhon Ratchasima Province, with the same soil conditions and plant growth characteristics. Tree growth was determined and recorded by measuring the tree diameter at breast height (DBH) (cm) and the total height (H) (m).

2.2. Cutting of the Sample Trees

  • We randomly selected 1–2 sample Silky Oak trees to represent all sites before measuring their DBH; trees with a small to large DBH were selected, based on information on the DBH distribution collected in a field survey.
  • We used a chainsaw to cut the sample trees at a height of 0.3 m from ground level.
  • We measured the height of the cut trees from bolt to top before cutting logs.
  • We cut all branches from the stems after detaching all leaves from the branches and gathering them on a canvas or lining material. The branches and leaves were weighed, and the fresh weights in Kg were recorded in a Field Survey Record Form (FSRF).
  • We cut each stem into equal sections, 1 m or 2 m in length, based on the height of stem, to facilitate their weighing, with the exception of one section that was cut to 1.3 m in length.
All logs were marked to identify the order of the sample trees and the order of the logs, for example, as 1.3 m, 3.3 m, 5.3 m, etc. Each sample tree and its logs were identified with the same number. The length of the sample logs could vary based on the size of the tree.
6.
Tree cutting was performed at a marked position. After cutting, the diameter of the lower end of each log was measured.
7.
We weighed each log and recorded its weight in kg.
8.
We dug and collected all sample roots. These roots were cleaned by spraying water on them before aerating them. However, they were not dried in the sun to avoid losing the moisture in the wood. Subsequently, all roots were weighed.
In the event that a large root was found, it was cut into parts that were separately weighed; the total weight was then calculated and recorded in kg.

2.3. Preparation of the Sample Portions for Dry Weighing

After weighing all fresh samples, sample parts of the trees were cut to determine their dry weight. Each portion was processed in a specific way, as reported below.
  • Stem: the lower part of each log was cut to obtain sections with an approximate thickness of 2–4 cm, or an approximate weight of 100–1000 g. Subsequently, each section was marked with a code indicating the sample tree and the log. Each sample was packed separately and stored in a sampling bag before fresh weighing with a semi-micro balance. The fresh weight of each sample section was recorded in g.
  • Branches: the branches were classified into 4 groups according to their size, which was related to their moisture content. The size was determined by measuring the diameter of each branch, and the branches were classified into the following groups: >10 cm, 5–10 cm, 2–5 cm, and <2 cm. Sampling was conducted by cutting the branches and placing them in sample bags marked with the code of each tree and a number identifying the part of the sample. Subsequently, each sample was weighed using a micro-balance to determine the fresh weight. The fresh weight of each group was recorded in g and was 500–1000 g, depending on the group.
  • Leaves: the leaves were randomly selected from all samples and placed in a sample bag marked with the code of the tree before determining their fresh weight. The weight of the dried leaves had to be around 500–1000 g. If the number of the sampled leaves was small, the total number of leaves from the entire sample was used. The fresh weight of the samples was recorded in g.
  • Roots: the roots were classified into 3 groups, including primary root (PR), secondary root (SR), and find root (FR). Samples were collected from the primary root based on their size and length. The roots were cut into 3–5 logs, each with a length of 2–5 cm. If the number of secondary roots was large, 3–5 roots were randomly selected as representatives of all large secondary roots. Each root was cut into 3–5 logs with a length of 2–5 cm, and they were marked with the code of the tree. The code of the root group indicated whether they were primary roots or secondary roots, and a code specifying the order of the root and that of the of log was also noted. Subsequently, each sample part was weighed to determine its fresh weight, which was recorded in g. The samples were stored in sampling bags, separately.
After measuring and weighing all samples, they were delivered in a sampling box to the laboratory to be dried.

2.4. Sample Drying

The samples obtained from the field survey were dried in a high-temperature drying oven in order to remove moisture from the wood and cell walls. They were consecutively dried in a hot-air BINDER Forced Conversio Oven FD240 at 105 °C, for 48 h, before randomly performing the first weighing. Subsequently, they were dried further for 24 h. A second weighing was performed, and the procedure was repeated until the weight was stable. At that point, the samples were left in a desiccator containing silica gel for cooling. Afterwards, each sample was weighed using a laboratory balance before recording its dry weight in the dry weight column of the table in the Field Survey Record Form. The dry weight was recorded in g.

2.5. Preparation of the Samples for the Analysis and Determination of Carbon in the Wood

Portions from the sampled stems, branches, leaves, and roots were prepared for the elemental analysis that was particularly focused on carbon (C). The samples were dried at 80 °C in order to prevent the evaporation of some elements like nitrogen (N), and then, they were ground into a fine powder before sieving with a 250-micron sieve. Subsequently, they were placed in sampling bags marked with a code specifying the tree part (stem, branch, leaf, or root). Then, they were delivered to an ISO 17025 certified laboratory in order to determine their elemental composition and carbon storage capacity using a CNH Elemental Analyzer, model CHN628. To do this, a blank was prepared, and the instrument was calibrated using pure EDTA, before analyzing the samples. Carbon, hydrogen, and nitrogen results for biomass samples are typically reported on in dry conditions. Therefore, either the materials must be dried prior to analysis, or the moisture content must be determined via a thermogravimetric analyzer and entered during the sample login procedure. Samples are typically dried at 85 °C for two hours prior to analysis; then, the Atmospheric Blank can be determined [42].

2.6. Calculation of the Dry Weight of the Field Samples

The calculation of the dry weight of the field samples, after drying and weighing the different parts, was performed by calculating the moisture percentage of each part of each tree, on the basis of their fresh weight and dry weight, as shown in Equation (1).
M o i s t u r e   p e r c e n t a g e = F r e s h   w e i g h t     D r y   w e i g h t D r y   w e i g h t × 100
Then, the moisture percentage of each part was used to calculate the dry weight of the samples.

2.7. Development of the Allometric Equation for Evaluating the Biomass of Silky Oak

The allometric equation was developed on the basis of the dry weight of the tree samples to describe the relationship between defined independent variables (e.g., DBH DBH2 Ht, or DBH2*Ht), dependent variables (biomass of the stems (Ws), branches (Wb), leaves (Wl), roots (Wr), belowground biomass (BGB), aboveground biomass (AGB), and total biomass (Wt)). The aboveground biomass (AGB) and total biomass (Wt) can be expressed in 2 ways (i.e., AGB = Ws + Wb + Wl and Wt = AGB + BGB or using specific biomass equations). Ogawa et al. (1961) proposed different forms of the allometric equation, as shown in Equations (2) and (3):
Y = a × ( D 2 H ) b
ln Y = ln a + b × ln ( D 2 H )
where Y represents Ws, Wb, Wl, Wr, AGB, or Wt, expressed in kg, D represents the DBH, in cm, H represents the height of the entire tree (Ht) in m, and a and b are constants.

2.8. Biomass and Carbon Storage Potential Estimation of the Planted Sampling Area

The biomass and carbon storage potential of Silky Oak in the planted sampling areas was estimated based on the developed allometric equation. The aboveground biomass (AGB) and belowground biomass (BGB) were estimated at the tree and plot level. At the tree level, the biomass (in kg) was estimated using the allometric equation. At the plot level, it was determined as the sum of the individual tree biomasses (ton biomass) in the sampling plot (ha). The biomass was calculated, as shown in Equations (4)–(6).
AGB = Ws + Wb + Wl
BGB = Wr
TTB = AGB + BGB
where AGB is the aboveground biomass (kg), BGB is the belowground biomass (kg), TTB is the total tree biomass (kg), Ws is the dry weight of the stem (kg), Wb is the dry weight of the branches (kg), Wl = is the dry weight of the leaves (kg), Wr is the dry weight of the roots (kg). The carbon storage capacity was estimated by multiplying the total biomass by 0.47, as per the IPCC 2006 recommended guidelines [43]. Carbon density (tC) was calculated by dividing the carbon storage by the sampling areas. The carbon in each stand was calculated by multiplying the carbon density by the stand area. Carbon dioxide sequestration was calculated by multiplying the carbon storage in a stand by 44/12, based on the atomic weights of carbon (12) and carbon dioxide (44).

3. Results and Discussion

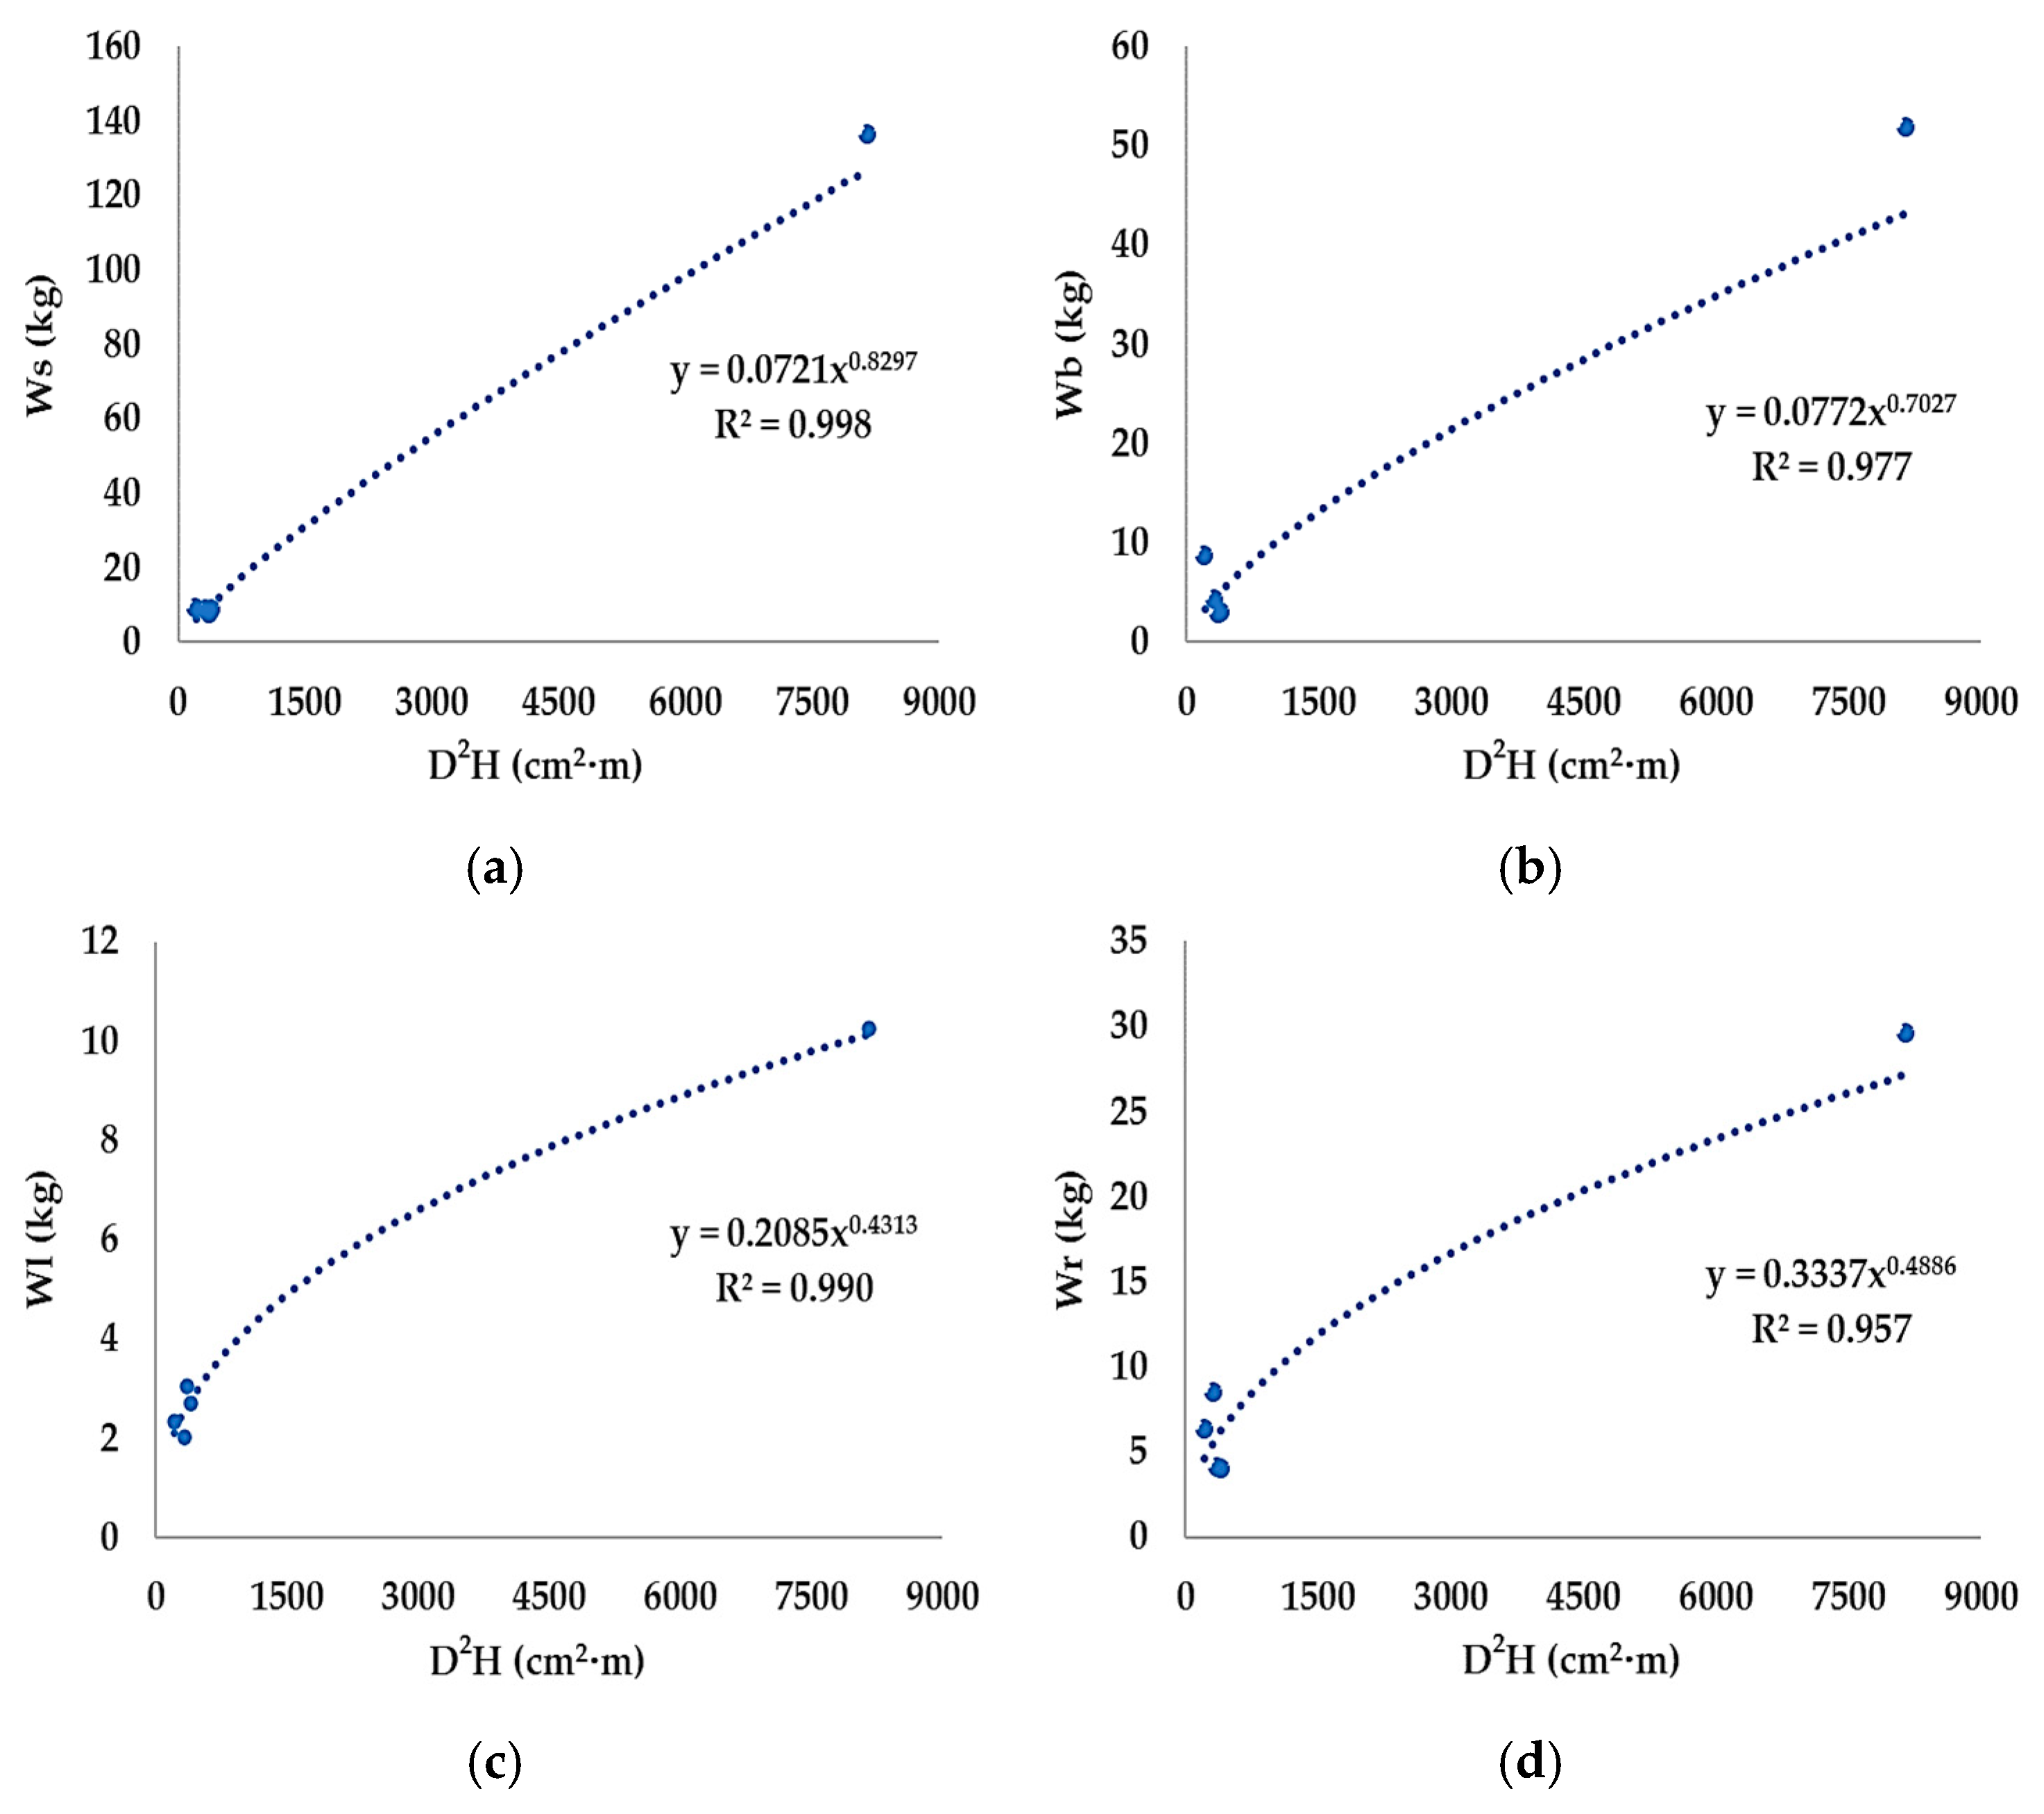
3.1. Development of the Allometric Equation

The data used to develop the allometric equation were obtained from Silky Oak trees of three different ages (i.e., 7 years (SO0101), 3–4 years (SO0301 and SO0302), and 2 years (SO0201 and SO0202)) that were planted in the chosen sites. These data indicated a relationship between the size of the stem (determined by measuring the DBH), the total height of Silky Oak trees, and the age, as shown in Table 1. It appeared that the stem size and tree height of Silky Oak slowly increased in young trees, as observed for trees in the youngest age group, and then rapidly increased, as observed in trees that were older than 4 years. However, due to the lack of data on the size and height for 5–6 year-old trees, no clear conclusions could be made. Nevertheless, these data showed that the increase in stem size and tree height was associated with an increase in the fresh weight of the stems, branches, leaves, and roots, and this increase occurred more quickly in trees that were older than 4 years.
It was also found that the moisture percentage in the stems and leaves was higher than in the branches and roots. As Silky Oak trees grew older, moisture increased in all portions of the trees except for the roots, where it decreased. This indicated that as Silky Oak trees became older, either it absorbed more water in the stem (i.e., in the aboveground portion), or it required more water, as shown in Table 2.
The moisture percentage of all parts of Silky Oak trees was used to determine the biomass of the stems, branches, leaves, and roots for each Silky Oak tree sample. Subsequently, the aboveground biomass of each sample was calculated. In this procedure, the values of the independent variables were determined using the values obtained from field measurements, including DBH and Ht, which were converted into DBH2Ht or D2H to develop the allometric equation, as shown in Table 3.
The D2H independent variable was used to develop the allometric equation in the form of Y = aXb, where Y represents the biomass of each part of the Silky Oak trees, and X represents the DBH2Ht (D2H) dependent variable. In Table 3, a and b are constants obtained from the relationship between biomass and the independent variables. During equation development, the reliability of the relationship (R2) of each equation was obtained to build a graph describing the relationship between biomass (kg) and the independent variable (D2H), as shown in Figure 3.
These results were used to create a quadratic equation, as shown in Table 4.
Ws, Wb, Wl, and Wr represent the biomass in kg of the stem, branches, leaves, and roots, respectively. D represents the DBH, in centimeters (cm), and H represents the total height of the tree, in meters (m).

3.2. Carbon Storage in the Biomass

The results of the analysis on carbon storage in the biomass of Silky Oak, obtained using the LECO method and analyzed using the CHN Elemental Analyzer model CHN628, in a ISO 17025 certified laboratory, revealed that the stems had a carbon storage capacity of 44.328%–45.390%, with a mean of 45.068%, whereas the branches had a carbon storage capacity of 44.185%–45.530%, with a mean of 44.972%. The carbon storage capacity of the leaves was 46.778%–48.172%, with a mean of 47.55%, and the roots had a carbon storage capacity of 44.757%–46.442%, with a mean of 45.624%, as shown in Table 5.
Overall, the carbon storage in the biomass of Silky Oak was 44.328%–48.172%, similar to the carbon storage recommended by the IPCC (2006), which corresponds to 47%. This analysis also showed that carbon storage increased in all parts of the tree in older Silky Oak. Therefore, since the sample trees were still young, carbon storage in the biomass was lower than the actual value. When Silky Oak becomes older, its carbon storage increases until it reaches a stable level. Therefore, this study recommends referring to the value of carbon storage in the biomass reported by the IPCC (2006).

3.3. Evaluation of Carbon Storage in Silky Oak Sites Using the Developed Allometric Equation

The developed allometric equation was used to analyze the data obtained from the survey and measurements conducted in the three sample sites (i.e., SO01, SO02, and SO03) to calculate the biomass in the sample sites. Analyses were performed for stems, branches, and leaves. The biomass of these three parts was combined to obtain the aboveground biomass (AGB). When the aboveground biomass (AGB) was combined with the biomass of the roots, the Total Biomass was obtained. The data from each site were analyzed separately, as shown in Table 6.
The calculated biomass was used to determine the carbon storage capacity while considering the recommended IPCC (2006) carbon storage capacity in biomass; then, it was converted into an amount of carbon dioxide absorption for each site. SO01 had an area of 11.69 ha, whereas SO02 had an area of 0.12 ha, and SO03 had an area of 1.80 ha. For the aboveground biomass, the carbon density was 73.07, 8.52, and 9.23 tC·ha−1 in the three sites; these are lower than the values reported for 25 old plantations in northern India, where the climate is semiarid, monsoons occur, and it is characterized by hot dry summers and cold winters. The aboveground carbon storage was equal to 130.89 tC·ha−1. A healthy soil provides a wide range of ecosystem goods and services that play a crucial role in sustaining biological productivity on marginal lands. There is a large potential for carbon sequestration in Silky Oak tree plantations [38]. When comparing the carbon storage potential in our sites with those found for different geographical areas and climates, we found that it was higher than that reported for Ethiopia (Africa); the aboveground carbon storage for trees of different ages (i.e., 5–10 years, 11–15 years, and more than 16 years) was 12.68, 25.63, and 157.90 tC·ha−1, respectively [39], whereas the leaf and root biomass percentages varied between trees of different ages (Table 6).
The results of this study were compared with those in previous reports concerning Africa, according to which, the biomasses of the stems, branches, leaves, and roots were 56.89%, 14.11%, 6.67%, and 22.32% of the total tree biomass, respectively [37]. The biomass results regarding Silky Oak, that we reported based on tree allometry, require further research and support before they can be applied to climate change mitigation agrosivilculture management and economic development. The aboveground carbon storage in each of the three stands was 113.05, 1.01, and 16.58 tC. The total aboveground carbon storage for the three stands was 130.63 tC. When converted to absorbed carbon dioxide, the amount we obtained was 414.51, 3.70, and 60.78 tCO2eq, respectively. The total amount of absorbed carbon dioxide for the three stands was 478.99 tCO2eq, as shown in Table 7. When evaluating the carbon sequestration using the total biomass and combining the results for the aboveground biomass and the root biomass, the carbon density and carbon storage for SO01, SO02, and SO03 were 82.75, 12.30 m, and 12.95 tC·ha−1, and 128.03, 1.46, 23.26, and 152.75 tC, respectively. The corresponding amounts of absorbed carbon dioxide were 469.46, 5.34, 85.30, and 560.10 tCO2eq, respectively, as shown in Table 8.
The Silky Oak trees that were imported into Thailand have a relatively slow growth rate during their first 2–4 years, in comparison with local economic plants such as Teak (Tectona grandis L.f.) [44]. However, the growth rate increases rapidly thereafter, enabling Silky Oak to be able to absorb carbon dioxide from the atmosphere more rapidly. Therefore, it is not possible to draw a clear conclusion, because the small sample of Silky Oak trees had just been imported to Thailand, and the trees were young. However, referring to previous research carried out in other regions, which supports our reasoning, it is possible that climate change and rising temperatures may vary the biomass of plants, depending on the geographic region. Pretzsch et al. [45] reported that as a consequence of increasing temperatures, the growing season of trees was extended. As a result, the growth rate of trees increased by 29%–100%, whereas the wood density decreased by 20%–76%. It was observed that tree growth is influenced by longer growing seasons and land management, which may, thus, increase the potential of carbon storage and biomass. Furthermore, many studies showed that climate change has a major impact on the growth of forests, including on the number of trees and on stand growth [45,46]. The increase in the temperature and the extended growing seasons are believed to be the main contributors to the observed growth acceleration, particularly for fertile sites [47,48]. It is clear that there are variations in the environment that are conducive to growth, regardless of climatic zones and land use classifications. Global warming progresses, leading to extended growing seasons and higher atmospheric CO2 concentrations [49,50,51,52].

4. Conclusions

The allometric relationships between the size, growth, stem diameter, total height, and age were investigated. The observed growth patterns align with established physiological principles of tree development. The results indicated that Silky Oak size and height gradually increased for trees within the first age range, with rapid growth observed for trees older than 4 years. The gradual growth during the early years can be attributed to the establishment and allocation of resources, whereas the subsequent accelerated growth phase may signify heightened metabolic activity and resource utilization. The absence of data for 5–6 year-old trees poses a limitation, warranting caution in drawing definitive conclusions on the correlation between an acceleration in growth, size, height, and increased age. Furthermore, the link between the growth parameters and the fresh weight of stems, branches, leaves, and roots underscores the complexity of Silky Oak’s developmental dynamics. The data suggest a positive correlation between size, growth, height, and fresh weight. Moreover, increasing age leads to an accelerated accumulation of biomass. Allometric equations were derived for the stems, branches, leaves, and root biomass, revealing distinct relationships between the growth parameters.
The carbon storage in the Silky Oak biomass was quantified, and the analysis revealed that the stems, branches, leaves, and roots exhibited varying carbon storage capacities. Carbon storage increased with tree age, suggesting a relationship between tree maturity and carbon accumulation. These findings align with the IPCC recommendations, and they underscore the potential for Silky Oak tree plantations to contribute to carbon sequestration efforts. The developed allometric equations were employed to assess carbon storage across different sample sites. Carbon density and storage were calculated for aboveground and total biomass, revealing considerable carbon sequestration potential in Silky Oak tree plantations. The findings were compared with those in published studies, highlighting the species’ role in climate change mitigation and sustainable land management. This study elucidates the allometric relationships governing Silky Oak tree growth, and it contributes to our understanding of the carbon storage potential within different tree parts. The derived allometric equations provide valuable tools for estimating biomass distribution, whereas the carbon storage assessment underscores the significance of Silky Oak tree plantations in mitigating climate change and promoting sustainable land use practices.

Author Contributions

Conceptualization, T.L. and Y.U.; Methodology, T.L., Y.U. and S.S; Validation, C.B. and S.L.; Formal analysis, T.L., Y.U., S.S., C.B. and S.L.; Resources, S.L.; Data curation, T.L., Y.U., S.S., C.B. and S.L.; Funding acquisition, S.L.; Writing—review and editing, T.L. and Y.U.; Project administration, S.L. All authors have read and agreed to the published version of the manuscript.

Funding

This research project is financially supported by Wave BCG Co., Ltd. (https://www.wave-groups.com/en/our_business/wave_bcg) (accessed on 10 June 2023).

Data Availability Statement

Data are available on request.

Acknowledgments

We would like to acknowledge AVA Farm888 (https://avafarm888.com/) (accessed on 12 June 2023) on giving permission and providing the trees sample to complete this research.

Conflicts of Interest

The authors declare no conflict of interest.

References

  1. World Resources Institute: World GHG Emissions Flow Chart. Available online: http://pdf.wri.org/world_greenhouse_gas_emissions_flowchart.pdf (accessed on 10 May 2023).
  2. Tian, J.; Shan, Y.; Zheng, H.; Lin, X.; Liang, X.; Guan, D. Structural patterns of city-level CO2 emissions in Northwest China. J. Clean. Prod. 2019, 223, 553–593. [Google Scholar] [CrossRef]
  3. Sugsaisakon, S.; Kittipongvises, S. Citywide Energy-Related CO2 Emissions and Sustainability Assessment of the Development of Low-Carbon Policy in Chiang Mai, Thailand. Sustainability 2021, 13, 6789. [Google Scholar] [CrossRef]
  4. Samek, J.H.; Skole, D.L.; Butthep, C.; Navanugraha, C.; Uttaruk, P.; Laosuwan, T. Inpang carbon bank in northeast Thailand: A Community Effort in Carbon Trading from Agroforestry Projects. In Carbon Sequestration Potential of Agroforestry Systems; Springer: Berlin/Heidelberg, Germany, 2011; pp. 263–280. [Google Scholar]
  5. Uttaruk, Y.; Laosuwan, T. Development of Prototype Project for Carbon Storage and Greenhouse Gas Emission Reduction from Thailand’s Agricultural Sector. Sains Malays. 2019, 48, 2083–2092. [Google Scholar] [CrossRef]
  6. Manabe, S. Role of greenhouse gas in climate change. Tellus A Dyn. Meteorol. Oceanogr. 2019, 71, 1–13. [Google Scholar] [CrossRef]
  7. Community Forestry and Development. Manual of Carbon Sequestration Studies and Biodiversity in Community Forests. Available online: https://www.forest.go.th/community-development/wp-content/uploads/sites/105/2020/03/คู่มือคาร์บอน.pdf (accessed on 10 April 2023).
  8. Duncanson, L.; Rourke, O.; Dubayah, R. Small sample sizes yield biased allometric equations in temperate forests. Sci. Rep. 2015, 5, 17153. [Google Scholar] [CrossRef] [PubMed]
  9. Lu, D.; Chen, Q.; Wang, G.; Liu, L.; Li, G.; Moran, E. A survey of remote sensing-based aboveground biomass estimation methods in forest ecosystems. Int. J. Digit. Earth 2016, 9, 63–105. [Google Scholar] [CrossRef]
  10. Pascarella, A.E.; Giacco, G.; Rigiroli, M.; Marrone, S.; Sansone, C. ReUse: REgressive Unet for Carbon Storage and Above-Ground Biomass Estimation. J. Imaging 2023, 9, 61. [Google Scholar] [CrossRef]
  11. Alongi, D.M. Impacts of Climate Change on Blue Carbon Stocks and Fluxes in Mangrove Forests. Forests 2022, 13, 149. [Google Scholar] [CrossRef]
  12. Byun, C.; Lee, S.H.; Kang, H. Estimation of carbon storage in coastal wetlands and comparison of different management schemes in South Korea. J. Ecol. Environ. 2019, 43, 8. [Google Scholar] [CrossRef]
  13. Repo, A.; Rajala, T.; Henttonen, H.M.; Lehtonen, A.; Peltoniemi, M.; Heikkinen, J. Age-Dependence of Stand Biomass in Managed Boreal Forests Based on the Finnish National Forest Inventory Data. For. Ecol. Manag. 2021, 498, 119507. [Google Scholar] [CrossRef]
  14. He, G.; Zhang, Z.; Zhu, Q.; Wang, W.; Peng, W.; Cai, Y. Estimating Carbon Sequestration Potential of Forest and Its Influencing Factors at Fine Spatial-Scales: A Case Study of Lushan City in Southern China. Int. J. Environ. Res. Public Health 2022, 19, 9184. [Google Scholar] [CrossRef] [PubMed]
  15. Xi, F.; Lin, G.; Zhao, Y.; Li, X.; Chen, Z.; Cao, C. Land Use Optimization and Carbon Storage Estimation in the Yellow River Basin, China. Sustainability 2023, 15, 11278. [Google Scholar] [CrossRef]
  16. Rotjanakusol, T.; Laosuwan, T. Model of Relationships between Land Surface Temperature and Urban Built-Up Areas in Mueang Buriram District, Thailand. Pol. J. Environ. Stud. 2020, 29, 3783–3790. [Google Scholar] [CrossRef]
  17. Encyclopedia. Deforestation and Global Warming. Available online: https://encyclopedia.pub/entry/37075 (accessed on 15 April 2023).
  18. Ceres. Deforestation and Land Use Change. Available online: https://engagethechain.org/deforestation-and-land-use-change (accessed on 17 April 2023).
  19. Othman, M.; Zakaria, R.; Fernando, W. Strategic Planning on Carbon Capture from Coal Fired Plants in Malaysia and Indonesia: A Review. Energy Policy 2009, 37, 1718–1735. [Google Scholar] [CrossRef]
  20. Jorat, M.E.; Aziz, M.A.; Marto, A.; Zaini, N.; Jusoh, S.N.; Manning, D.A.C. Sequestering Atmospheric CO2 Inorganically: A Solution for Malaysia’s CO2 Emission. Geosciences 2018, 8, 483. [Google Scholar] [CrossRef]
  21. Küßner, R.; Mosandl, R. Comparison of direct and indirect estimation of leaf area index in mature Norway spruce stands of eastern Germany. Can. J. For. Res. 2011, 30, 440–447. [Google Scholar] [CrossRef]
  22. University of Idaho. Direct Measures of Biomass. Available online: https://www.webpages.uidaho.edu/veg_measure/Modules/Lessons/Module%207(Biomass&Utilization)/7_3_Direct%20Methods.htm (accessed on 25 April 2023).
  23. Barmpoutis, P.; Stathaki, T.; Kamperidou, V. Estimation of extent of trees and biomass infestation of the suburban forest of Thessaloniki (Seich Sou) using UAV imagery and combining R-CNNs and multichannel texture analysis. In Proceedings of the SPIE-The International Society for Optical Engineering This Link Is Disabled, Amsterdam, The Netherlands, 31 January 2020; Volume 11433, p. 114333C. [Google Scholar]
  24. Lambert, M.C.; Ung, C.H.; Raulier, F. Canadian national tree aboveground biomass equations. Can. J. For. Res. 2005, 35, 1996–2018. [Google Scholar] [CrossRef]
  25. Xiao, X.; White, E.P.; Hooten, M.B.; Durham, S.L. On the use of log-transformation vs. nonlinear regression for analyzing biological power laws. Ecology 2011, 92, 1887–1894. [Google Scholar] [CrossRef]
  26. Chave, J.; Rejou-Mechain, M.; Burquez, A.; Chidumayo, E.; Colgan, M.S.; Delitti, W.B.; Duque, A.; Eid, T.; Fearnside, P.M.; Goodman, R.C.; et al. Improved allometric models to estimate the aboveground biomass of tropical trees. Glob. Chang. Biol. 2014, 20, 3177–3190. [Google Scholar] [CrossRef]
  27. Li, Y.D.; Liu, Q.; Meng, S.; Zhou, G. Allometric biomass equations of Larix sibirica in the Altay Mountains, Northwest China. J. Arid. Land 2019, 11, 608–622. [Google Scholar] [CrossRef]
  28. Fradette, O.; Marty, C.; Tremblay, P.; Lord, D.; Boucher, J.-F. Allometric Equations for Estimating Biomass and Carbon Stocks in Afforested Open Woodlands with Black Spruce and Jack Pine, in the Eastern Canadian Boreal Forest. Forests 2021, 12, 59. [Google Scholar] [CrossRef]
  29. United States Department of Agriculture. Silk-Oak. Available online: https://www.srs.fs.usda.gov/pubs/misc/ag_654/volume_2/grevillea/robusta.htm (accessed on 30 April 2023).
  30. Post Today. Silk Oak. Available online: https://www.posttoday.com/post-next/be-greener/694264 (accessed on 2 May 2023).
  31. Bangkokbiznews. Silk Oak. Available online: https://www.bangkokbiznews.com/business/economic/1067157 (accessed on 2 May 2023).
  32. AVAFARM 888. Silk Oak. Available online: https://avafarm888.com/ (accessed on 5 May 2023).
  33. Silveroak. Silk Oak. Available online: https://silveroak.in.th/ (accessed on 5 May 2023).
  34. Mery, G.; Katila, P.; Galloway, G.; Alfaro, R.I.; Kanninen, M.; Lobovikov, M.; Varjo, J. Forests and Society–Responding to Global Drivers of Change; IUFRO World Series; IUFRO: Vienna, Austria, 2010; Volume 25, 509p. [Google Scholar]
  35. Díaz, S.; Settele, J.; Brondízio, E.S.; Ngo, H.T.; Guèze, M.; Agard, J.; Arneth, A.; Balvanera, P.; Brauman, K.A.; Butchart, S.H.M.; et al. (Eds.) Summary for Policymakers of the Global Assessment Report on Biodiversity and Ecosystem Services of the Intergovernmental Science-Policy Platform on Biodiversity and Ecosystem Services; IPBES Secretariat: Bonn, Germany, 2019; 56p. [Google Scholar]
  36. Churkina, G.; Organschi, A.; Reyer, C.P.; Ruff, A.; Vinke, K.; Liu, Z.; Reck, B.K.; Graedel, T.E.; Schellnhuber, H.J. Buildings as a global carbon sink. Nat Sustain. 2020, 3, 269–276. [Google Scholar] [CrossRef]
  37. Kiyingi, I.; Ocama, D.; Mujuni, D.; Nyombi, K. A bioeconomic analysis of the carbon sequestration potential of agroforestry systems: A case study of Grevillea robusta in South Western Uganda. Uganda J. Agric. Sci. 2016, 17, 219–229. [Google Scholar] [CrossRef]
  38. Owate, O.; Mware, M.; Kinyanjui, M. Allometric Equations for Estimating Silk Oak (Grevillea robusta) Biomass in Agricultural Landscapes of Maragua Subcounty, Kenya. Int. J. For. Res. 2018, 2018, 6495271. [Google Scholar] [CrossRef]
  39. Jangra, R.; Gupta, S.R.; Kumar, R.; Sing, G. Carbon Sequestration in the Grevillea robudta Plantation on a Reclaimmed Sodic Soil at Karnal in Northern India. Int. J. Ecol. Environ. Sci. 2010, 36, 75–86. [Google Scholar]
  40. Yirdaw, M. Carbon Stock Sequestered by Selected Tree Species Plantations in Wondo Genet College, Ethiopia. J. Earth Sci. Clim. Change 2018, 9, 1000472. [Google Scholar]
  41. Cole, T.G.; Ewel, J.J. Allometric equations for four valuable tropical tree species. For. Ecol. Manag. 2006, 229, 351–360. [Google Scholar] [CrossRef]
  42. CHN628 Series: Instruction Manual. Available online: https://eu.leco.com/images/Analytical-Application-Library/CHN628_SULFUR_HYDROCARBONS_203-821-466.pdf (accessed on 27 April 2023).
  43. Paustian, K.; Ravindranath, N.H.; van Amstel, A.R. 2006 IPCC Guidelines for National Greenhouse Gas Inventories. Available online: http://www.ipcc-nggip.iges.or.jp/public/2006gl/index.htm (accessed on 30 April 2023).
  44. Viriyabuncha, C.; Chittachumnonk, P.; Sutthisrisinn, C.; Samran, S.; Peawsa-ad, K. Adjusting Equation to Estimate the Above-ground Biomass of Teak Plantation in Thailand. In Proceedings of the 7th Silvicultural Seminar, Faculty of Forestry, Kasetsart University, Thailand, 12–14 December 2001; pp. 239–260. [Google Scholar]
  45. Pretzsch, H.; Biber, P.; Schütze, G.; Kemmerer, J.; Uhl, E. Wood density reduced while wood volume growth accelerated in Central European forests since 1870. For. Ecol. Manag. 2018, 429, 589–616. [Google Scholar] [CrossRef]
  46. Grote, R.; Pretzsch, H. A model for individual tree development based on physiological processes. Plant Biol. 2002, 4, 167–180. [Google Scholar] [CrossRef]
  47. Reyer, C.; Lasch-Born, P.; Suckow, F.; Gutsch, M.; Murawski, A.; Pilz, T. Projections of regional changes in forest net primary productivity for different tree species in Europe driven by climate change and carbon dioxide. Ann. For. Sci. 2014, 71, 211–225. [Google Scholar] [CrossRef]
  48. Keenan, R.J. Climate change impacts and adaptation in forest management: A review. Ann. For. Sci. 2015, 72, 145–167. [Google Scholar] [CrossRef]
  49. Chmielewski, F.M.; Rötzer, T. Response of tree phenology to climate change across Europe. Agric. For. Meteorol. 2001, 108, 101–112. [Google Scholar] [CrossRef]
  50. Churkina, G.; Zaehle, S.; Hughes, J.; Viovy, N.; Chen, Y.; Jung, M.; Heumann, B.W.; Ramankutty, N.; Heimann, M.; Jones, C. Interactions between nitrogen deposition, land cover conversion, and climate change determine the contemporary carbon balance of Europe. Biogeosciences 2010, 7, 2749–2764. [Google Scholar] [CrossRef]
  51. Davis, W.J. The Relationship between Atmospheric Carbon Dioxide Concentration and Global Temperature for the Last 425 Million Years. Climate 2017, 5, 76. [Google Scholar] [CrossRef]
  52. Nunes, L.J.R. The Rising Threat of Atmospheric CO2: A Review on the Causes, Impacts, and Mitigation Strategies. Environments 2023, 10, 66. [Google Scholar] [CrossRef]
Figure 1. Schematic diagram of the study’s methodology.
Forests 14 01824 g001
Figure 2. The study area comprising Silky Oak sites in Pak Chong District, Nakhon Ratchasima Province, Thailand.
Forests 14 01824 g002
Figure 3. Graph showing the relationship between the biomass of the stems (a), branches (b), leaves (c), roots (d), and the independent variable (D2H) for the samples.
Forests 14 01824 g003
Table 1. Growth, height, and fresh weight of Silky Oak trees of different ages from AVA farm 888 plots, Pak Chong District, Nakhon Ratchasima Province.
Tree IDAge (Year)Ht
(m)
DBH (cm)Fresh Weight (kg)
StemBranchLeafRoot
SO0101718.521.00283.689.622.850.3
SO0201265.9718.8155.210.8
SO020226.17.32187.44.514.4
SO03013–47.87.18185.266.8
SO03023–47.27.1415.856.87
Table 2. Percentage of moisture content in the stems, branches, leaves, and roots of samples from AVA farm 888 plots, Pak Chong District, Nakhon Ratchasima Province.
Tree IDAge (Year)% Moisture
StemBranchLeafRoot
SO01017108.2672.99122.4769.84
SO0201293.9291.2777.4788.53
SO0202291.4385.6380.5187.90
SO03013–4140.1566.28110.9764.91
SO03023–4117.9462.8697.6371.23
Table 3. DBH2Ht independent variable values and biomass values of the stems, branches, leaves, roots, and aboveground biomass of Silky Oak samples from plots in AVA Farm888, Pak Chong District, Nakhon Ratchasima Province.
Tree IDHt (m)DBH (cm)DBH2Ht (cm2·m)Dry Weight (kg)
WsWbWlWrAGB
SO010118.521.008158.50136.1751.8010.2529.62227.83
SO020165.97213.859.038.672.346.3626.39
SO02026.17.32326.858.644.282.028.4823.42
SO03017.87.18402.118.643.012.704.0018.35
SO03027.27.14367.057.592.893.064.1217.65
Table 4. The allometric equation and the R2 value of the equation for each part of the Silky Oak trees from the plots in AVA Farm888, Pak Chong District, Nakhon Ratchasima Province.
Tree PartAllometric EquationR2
StemWs = 0.0721(D2H)0.82970.998
BranchWb = 0.0772(D2H)0.70270.977
LeafWl = 0.2085(D2H)0.43130.990
RootWr = 0.3337(D2H)0.48860.957
Table 5. The proportions of carbon (C), hydrogen (H), and nitrogen (N) in the biomass were analyzed using the LECO method and the CHN Elemental Analyzer model CHN628.
Part of TreeSample IDCarbon %Hydrogen %Nitrogen %
StemSSO010145.3907.8500.098
SSO010245.6547.8260.195
SSO020144.9087.7330.026
SSO030144.3287.7240.067
SSO030245.0607.7470.117
Average 45.0687.7760.101
BranchBSO010145.5307.8520.198
BSO020144.1857.8310.135
BSO020244.9297.8470.151
BSO030145.3297.8230.181
BSO030244.8867.8530.051
Average 44.9727.8410.143
LeafLSO010147.8067.9700.722
LSO020146.7787.9350.699
LSO020248.1727.4041.526
LSO030147.1947.3731.409
LSO030247.8377.3191.490
Average 47.5577.6001.169
RootRSO010146.4427.8610.004
RSO020145.8457.7840.132
RSO020245.9377.7940.144
RSO030145.1427.7740.143
RSO030244.7577.4470.041
Average 45.6247.7320.093
Table 6. Silky Oak biomass (% of total biomass) of the stems, branches, leaves, roots, aboveground biomass, and total biomass for trees in the three examined planting plots (sites).
Site
ID
Biomass (Tons)
WsWbWlWrAGBTTB
SO0117.92 (63.61%)5.75 (20.41%)1.20 (4.26%)3.30 (11.17%)24.87 (88.29%)28.17 (100%)
SO020.36
(34.29%)
0.21 (20.00%)0.15 (14.29%)0.32 (30.48)0.73 (69.52%)1.05 (100%)
SO031.65 (37.41%)0.90 (20.40%)0.59 (13.38%)1.27 (28.80%)3.14 (71.20%)4.41 (100%)
Total19.936.86 1.94 4.8928.7433.63
Remarks: Ws, Wb, Wl, and Wr represent the biomass of the stems, branches, leaves, and roots. The biomass is expressed in tons. ABG represents the aboveground biomass that was calculated as Ws + Wb + Wl and expressed in tons. TTB represents the Total Biomass that was calculated as AGB + Wr with and expressed in tons.
Table 7. Aboveground biomass (AGB), carbon storage, and carbon sequestration for each plot and for all combined plots.
Site IDSO01SO02SO03Total
Total aboveground biomass (tons)24.870.733.1428.74
Total carbon storage in the sampling plots (tons C)11.690.341.4813.51
Number of plots4149
Sampling plot area (ha)0.160.040.160.36
Carbon density (tC)73.078.529.23-
Stand area (ha)1.550.121.803.46
Carbon in stands (tC)113.051.0116.58130.63
CO2 in stands (tCO2eq)414.513.7060.78478.99
Table 8. Total tree biomass (TTB), carbon storage, and carbon sequestration for each plot and in all plots.
Site IDSO01SO02SO03Total
Total tree biomass (tons)28.171.054.4133.63
Total carbon storage in the sampling plots (tons C)13.240.492.0715.80
Number of plots4149
Sampling plot area (ha)0.160.040.160.36
Carbon density (tC)82.7512.3012.95-
Stand area (ha)1.550.121.803.46
Carbon in the stands (tC)128.031.4623.26152.75
CO2 in stands (tCO2eq)469.465.3485.30560.10
Disclaimer/Publisher’s Note: The statements, opinions and data contained in all publications are solely those of the individual author(s) and contributor(s) and not of MDPI and/or the editor(s). MDPI and/or the editor(s) disclaim responsibility for any injury to people or property resulting from any ideas, methods, instructions or products referred to in the content.

