Article

Accessibility Improvement and Renewal of Urban Park Green Space for the Elderly and the Disabled

College of Landscape Architecture, Nanjing Forestry University, Nanjing 210037, China
*
Author to whom correspondence should be addressed.
Forests 2023, 14(9), 1801; https://doi.org/10.3390/f14091801
Submission received: 4 August 2023 / Revised: 23 August 2023 / Accepted: 31 August 2023 / Published: 4 September 2023

Abstract

:
With the global population aging, balancing urban development with the social lives of the elderly and disabled has become an important issue. Network analysis was employed as the primary research method, utilizing tools such as Network Analysis on the ArcGIS platform and Python. To enhance the applicability of the analytical model in population demand and travel characteristic studies, a dataset was established based on the behavioral characteristics of elderly and disabled individuals. Resistance values and evaluation indicators were selected for this purpose. We summarized the travel preferences of the elderly and disabled and proposed corresponding accessibility optimization strategies. Through the analysis of the experimental results, we believe that setting the optimization goal as a 10-min walk for the elderly and a 500-m walk for the disabled to access parks and green spaces is reasonable. Additionally, the service area ratio and service population ratio should exceed 90% to ensure equitable access to the ecological services of urban parks for the elderly and disabled population. We also found that connecting and extending linear green spaces are of significant importance in improving green space accessibility, because linear green spaces have more entrances and exits than dot green spaces and area green spaces.

1. Introduction

Influenced by factors such as family planning policies and the improvement of medical care, the age structure of China’s population is embarking on the fast track of aging. As of the seventh population census in 2020, elderly people over the age of 60 accounted for 18.7% of the total population, and China’s population will reach its highest level of aging in the next 20 years. At the same time, the disability rate is also rising in tandem with the aging level, and both the 14th Five-Year Plan and the Vision 2035 Outline make it clear that the basic rights and interests of the disabled should be protected. Thus, the issue of guaranteeing the quality of life of China’s disadvantaged groups is becoming a focus of social concern.
According to related research, it has been established that the elderly often seek refuge in park green spaces as an ideal setting for physical and mental recovery and rehabilitation [1]. Unfortunately, due to various negative factors such as societal concepts, levels of facility services, and self-awareness, individuals with disabilities rarely frequent these health-promoting park green spaces. Numerous scholars have conducted comprehensive studies on aspects like spatial layout, materials and facilities, aging design, and barrier-free and inclusive design of park green spaces. However, for the elderly and disabled individuals, convenient, prompt, and safe access to these parks is a prerequisite to fully enjoying the ecological services they offer. Thus, the accessibility of park green spaces holds even greater significance for these individuals compared to others.
Research on the accessibility of park green spaces has been an important topic since the 1950s. The concept of accessibility was first proposed by Hansen in 1959 [2], who used it to describe the size of interaction opportunities between nodes in the transportation network. Researchers have primarily focused on the influence of natural geographic factors on accessibility. Spatial distribution, size, distance and park quality are considered key parameters in the study of urban park accessibility. In addition to natural geographic factors, many studies have also examined the impact of social, cultural, and individual factors on urban park accessibility. For example, one study found that improving social exclusivity for women had a positive impact on their access to public transportation in Pakistan [3], indicating the importance of social factors in park accessibility. Another study found that low-income communities face greater challenges in park accessibility [4]. Although economic, social, and geographic factors have been the primary focus of scholars investigating accessibility [5], it is crucial to consider a broader range of factors to gain a comprehensive understanding of urban park accessibility. By incorporating both spatial and psychological factors, researchers can better assess the complex dynamics that influence park accessibility [6].
Due to the regional nature of factors influencing accessibility, studies often focus on specific areas and propose corresponding optimization recommendations. In terms of research methods, statistical analysis, buffer zone analysis, network analysis, minimum distance analysis, gravity potential analysis, cost-resistance analysis, and two-step floating catchment area methods have become relatively mature [7,8,9,10,11,12,13,14]. For instance, a study conducted in Helsinki calculated the travel time required to reach local green spaces and forests using different modes of transportation, and based on the results, proposed measures to optimize the accessibility of recreational green spaces [15]. Another study utilized methods such as threshold population calculation, buffer zone analysis, and network analysis to examine the accessibility and service quality of parks in Khulna, Bangladesh, and proposed optimization strategies for park construction based on accessibility [16]. Additionally, a study conducted in Ufa, Russia, quantified the proportion of green spaces in the total urban area and investigated the impact of factors such as road networks and walking time on accessibility using buffer zone analysis [17]. Moreover, in addition to Geographic Information Systems (GIS), big data and artificial intelligence are also emerging as new methods for studying accessibility [18].
Urban park green space accessibility serves as a crucial indicator for measuring the equity of urban ecosystem service enjoyment among different social groups. Research has shown that high-income groups worldwide have a significant advantage in accessing urban green spaces and their associated ecological services [19]. This has led to pronounced inequalities among socio-economic groups [20], exacerbated by social backgrounds and racial disparities [21], further impacting accessibility and safety. Consequently, research on urban green space accessibility has expanded its scope to encompass a wide range of populations, including but not limited to children [22], immigrants [23], the elderly [24], and family units [25]. This broader approach takes into account different age groups, socio-economic statuses, and activity needs. By doing so, a more comprehensive understanding of the equity and social justice aspects related to urban green space accessibility is achieved.
Furthermore, the accessibility of urban green spaces is closely related to public health, with positive impacts on obesity [26], adolescent mental health [27], cardiovascular diseases [28], and more. In the context of the past few years, during the pandemic, it has been proven that good accessibility to parks and green spaces has beneficial effects on health promotion and disease prevention [29].
Although research on urban park green space accessibility has become increasingly abundant, there is still a lack of studies specifically focusing on the accessibility of parks and green spaces for the elderly and disabled populations.The first category of studies still relies on measuring accessibility based on the actual distance or travel time between urban residents and the location of green spaces. The preferences of the elderly and disabled populations are only considered as a reference for implementing intervention measures, without being integrated into the evaluation system of accessibility [30]. The second category of studies explores the factors that affect the accessibility of parks and green spaces for the elderly and disabled populations; however, they do not provide optimization strategies based on the analysis results [31,32,33]. The third category of studies, while assessing accessibility, only proposes optimization strategies at the micro-scale level of landscape design [34].
Therefore, there is a need for further research that specifically addresses the accessibility of parks and green spaces for the elderly and disabled populations. This research should not only consider their preferences but also incorporate them into the evaluation system of accessibility. Additionally, optimization strategies should be developed based on the identified factors influencing accessibility. These strategies should go beyond micro-scale design and consider broader interventions to improve accessibility for these populations.
Population aging has become a global trend, bringing pressure to various sectors including healthcare, elderly care services, social welfare, and fiscal expenditure [35]. The construction of public infrastructure should fully consider the usage needs and convenience of the elderly and disabled populations. Improving the accessibility of urban parks and green spaces can alleviate some of the social pressures associated with population aging.
We conducted a study using Jianye District in Nanjing City as an example. The district faces the challenge of balancing the modern development of the city with the social lives of the elderly and disabled populations, as well as addressing the issue of equity in the ecosystem services provided by urban green spaces. As of 2022, the population of elderly residents aged 60 and above in Nanjing city was 1.8246 million, accounting for 19.36% of the total population. The registered disabled population was 148,000, with visual impairment and physical disability accounting for over 60%. As one of the emerging modern urban centers and demonstration areas in China, Jianye District attaches great importance to safeguarding the rights and interests of vulnerable groups during the urban renewal process. The purpose of this study is to accurately explore the service status of parks and green spaces in Jianye District for the elderly and disabled populations. By combining behavioral preferences with analysis results, reasonable optimization suggestions are proposed for urban road traffic and urban green spaces. This research is valuable for urban planning and design work in similar cities aiming to improve social welfare equity and optimize the layout of urban green spaces to cater to a broader range of vulnerable groups.

2. Materials and Methods

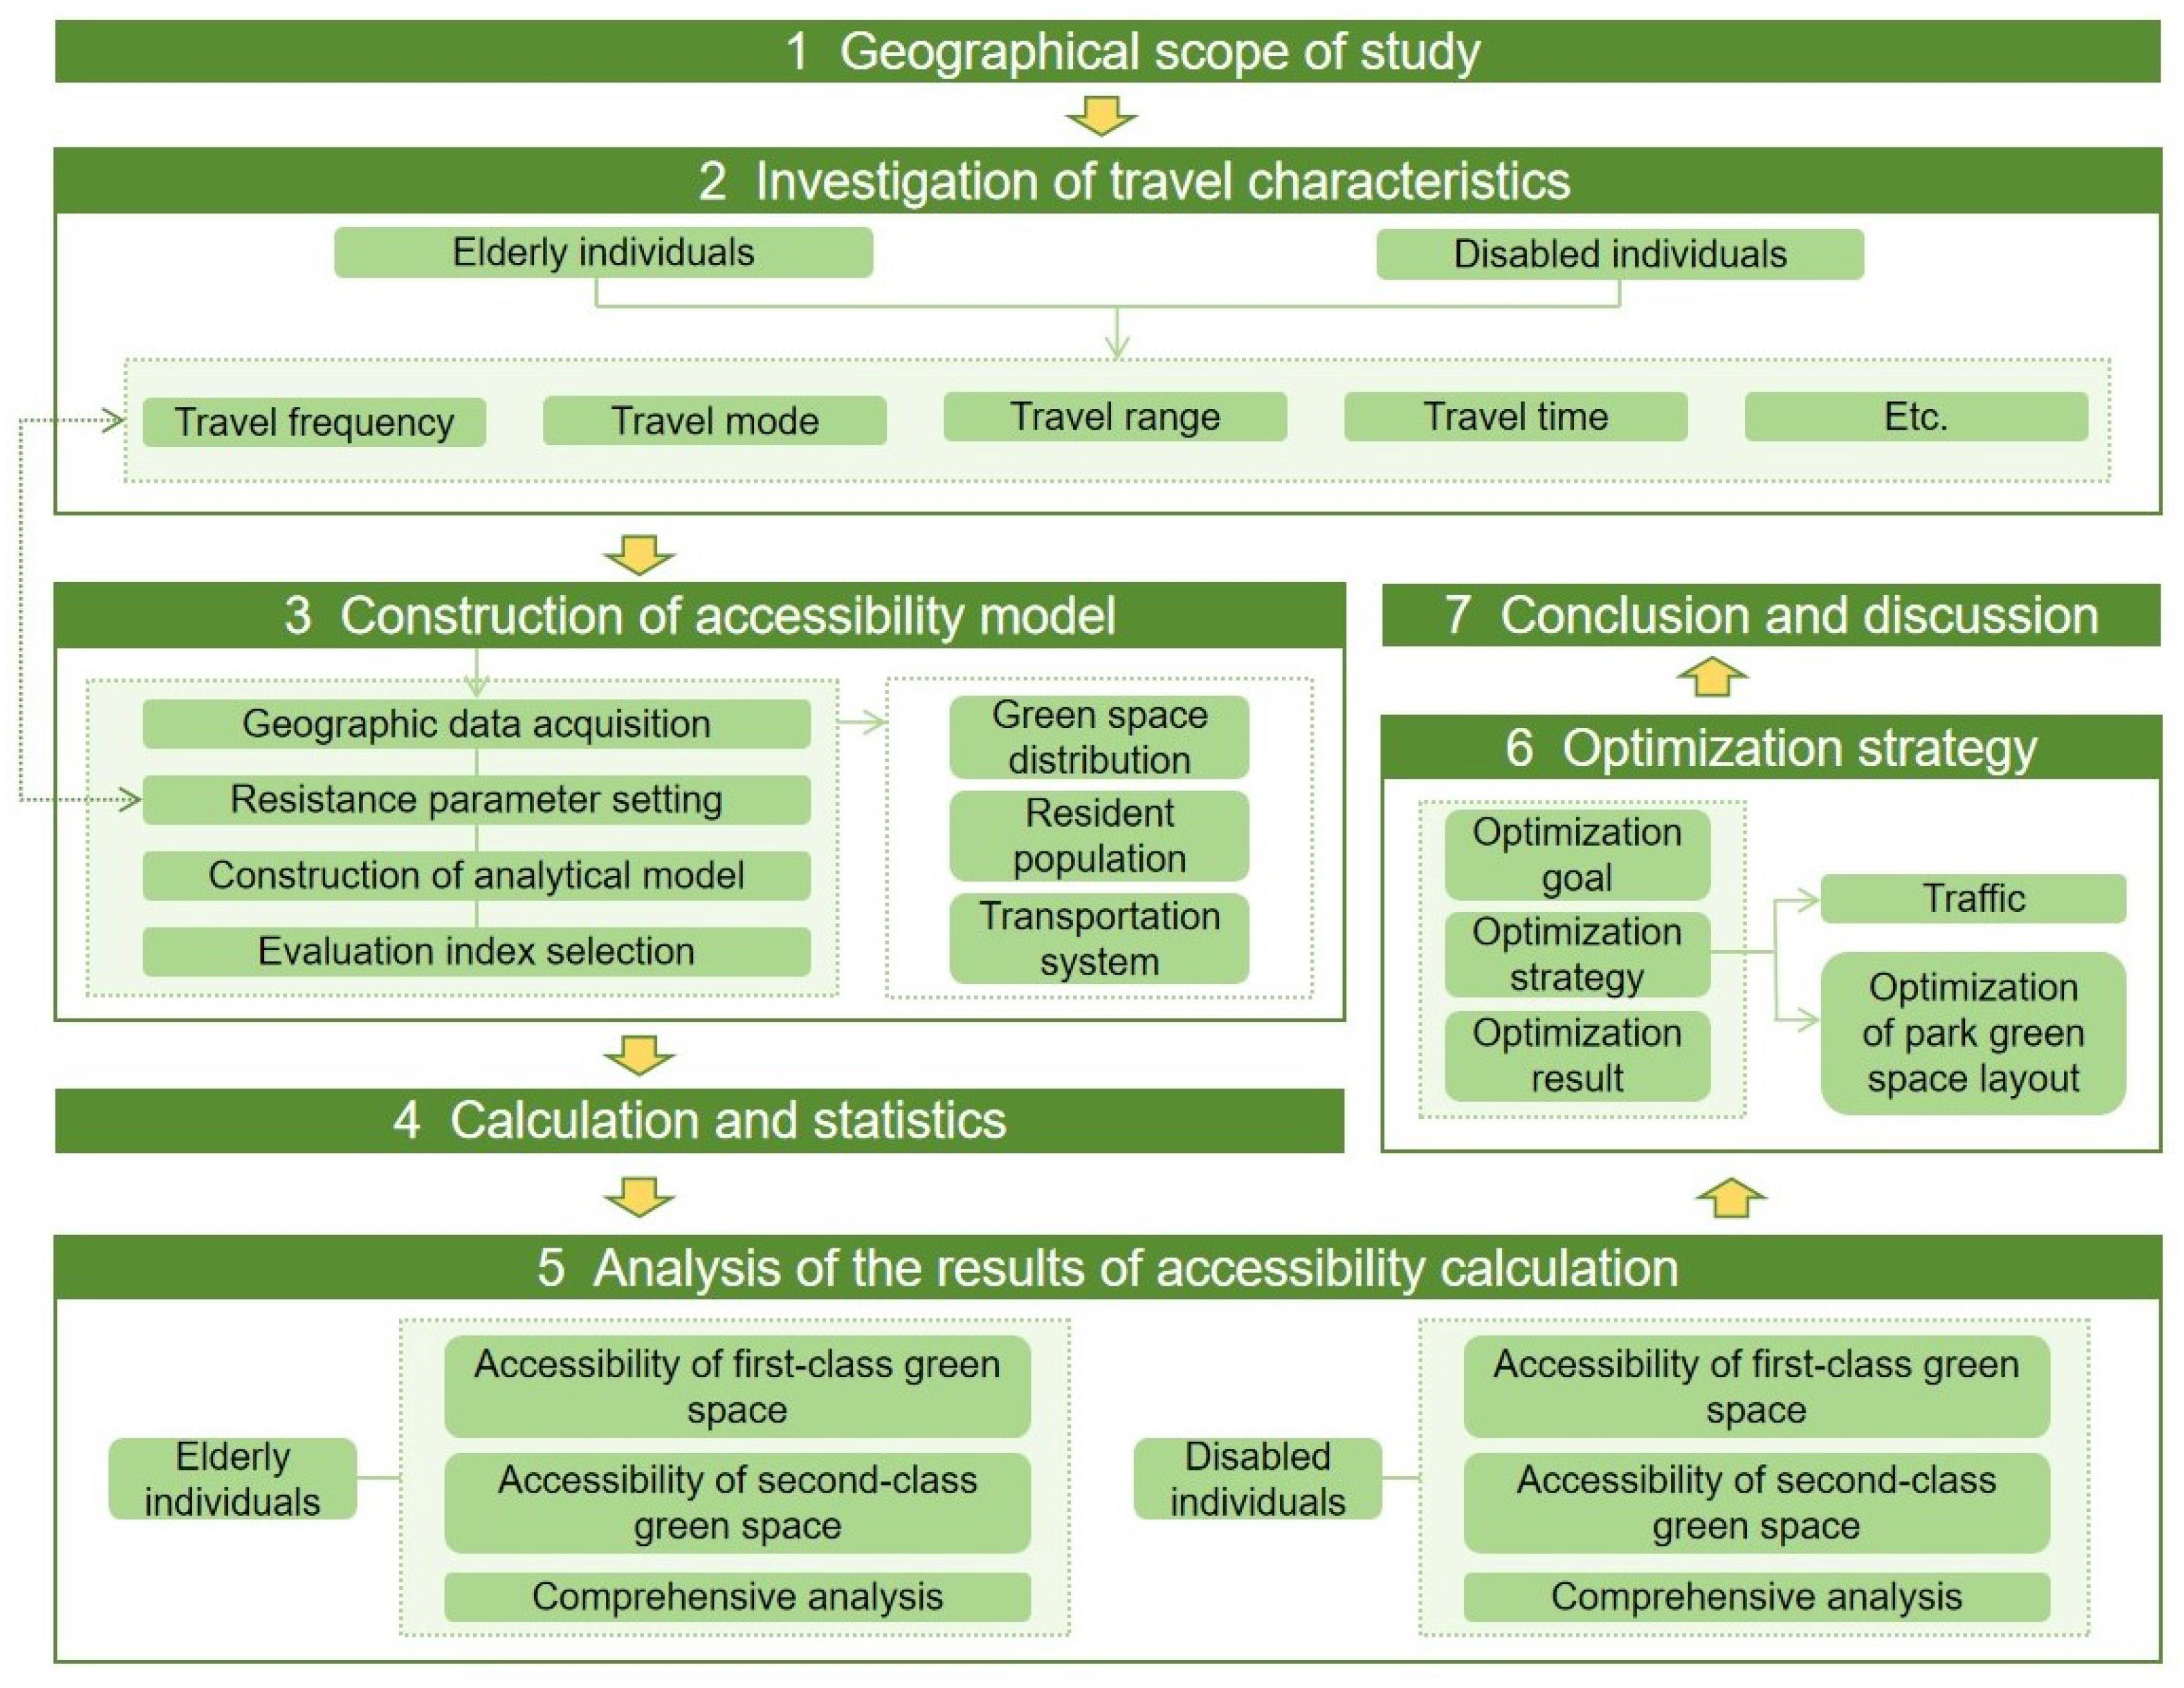
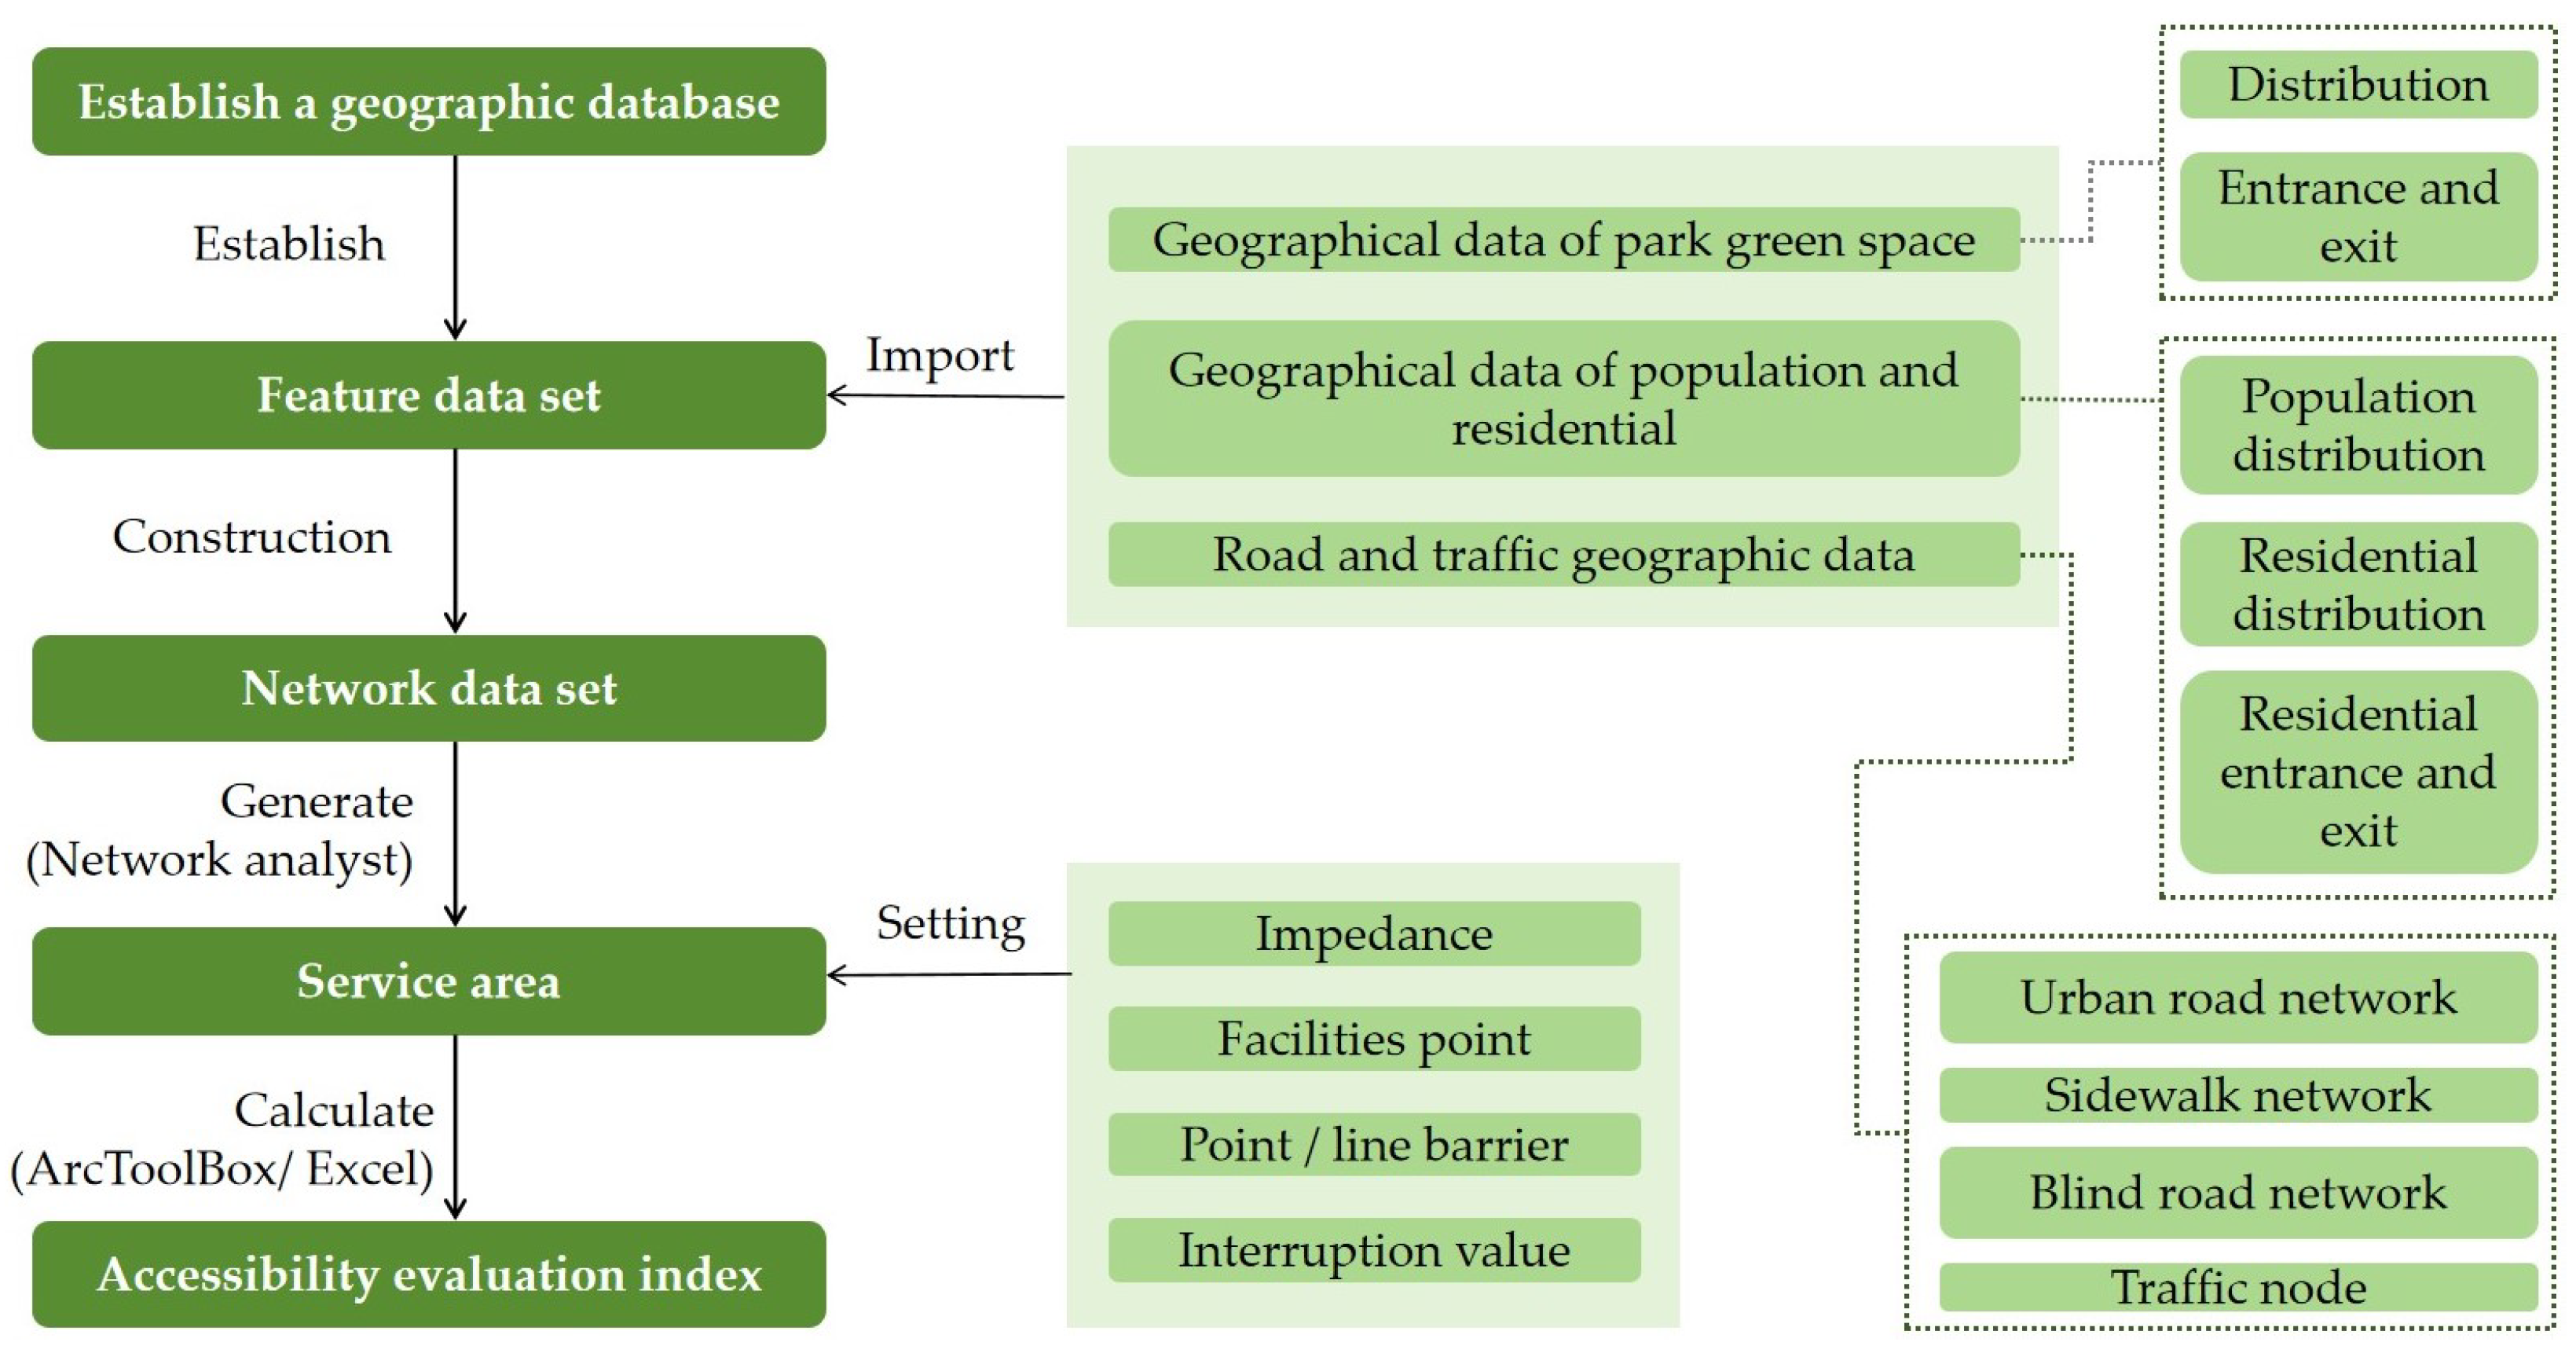
This study takes landscape architecture, environmental psychology, urban and rural planning, graph theory and operations research as the theoretical basis to re-examine the spatial analysis and resource allocation optimization of parks and green spaces in Jianye District, Nanjing. This study simulates the process of the elderly and disabled people going to the park green space, in which the travel characteristics of the elderly and disabled people are important influencing factors. So we use the network analysis method of GIS to obtain more accurate results of the accessibility analysis. The framework of the study refers to Figure 1. In the network, we mainly consider the influence of the center, node, chain and resistance on the accessibility.
This study defines older adults based on age criteria and functional abilities. In terms of age criteria, we refer to Article 2 of the “Law on the Protection of the Rights and Interests of the Elderly” in China, which sets the starting age for older adults at 60 years old. Therefore, any Chinese citizen who has reached the age of 60 is considered an older adult.
Regarding functional abilities, we follow the assessment guidelines outlined in the “Standard for Assessing the Abilities of the Elderly” (MZ/T 039-2013) issued by the Chinese government. According to this standard, the abilities of older adults are categorized into four levels based on their performance in daily living activities, mental status, perception and communication, and social participation. Among the four levels, older adults with moderate and severe disabilities experience significant impairment in their mobility, have limited activities, and rely on others for daily care. As a result, this study mainly focuses on older adults who are 60 years or older and have a functional ability level of mild disability or higher.
Regarding the definition of persons with disabilities, as defined by the “Convention on the Rights of Persons with Disabilities” adopted by the United Nations General Assembly in 2006, persons with disabilities include those with long-term impairments in physical, mental, intellectual, or sensory functions, which may interact with various barriers and hinder their full and effective participation in society on an equal basis with others. Among various types of disabilities, mobility barriers are primarily caused by physical and visual impairments. Speech, intellectual, and mental disabilities usually do not affect physical mobility. Therefore, this article mainly addresses persons with disabilities who face difficulties in transportation due to visual and physical impairments.

2.1. Conceptual Research

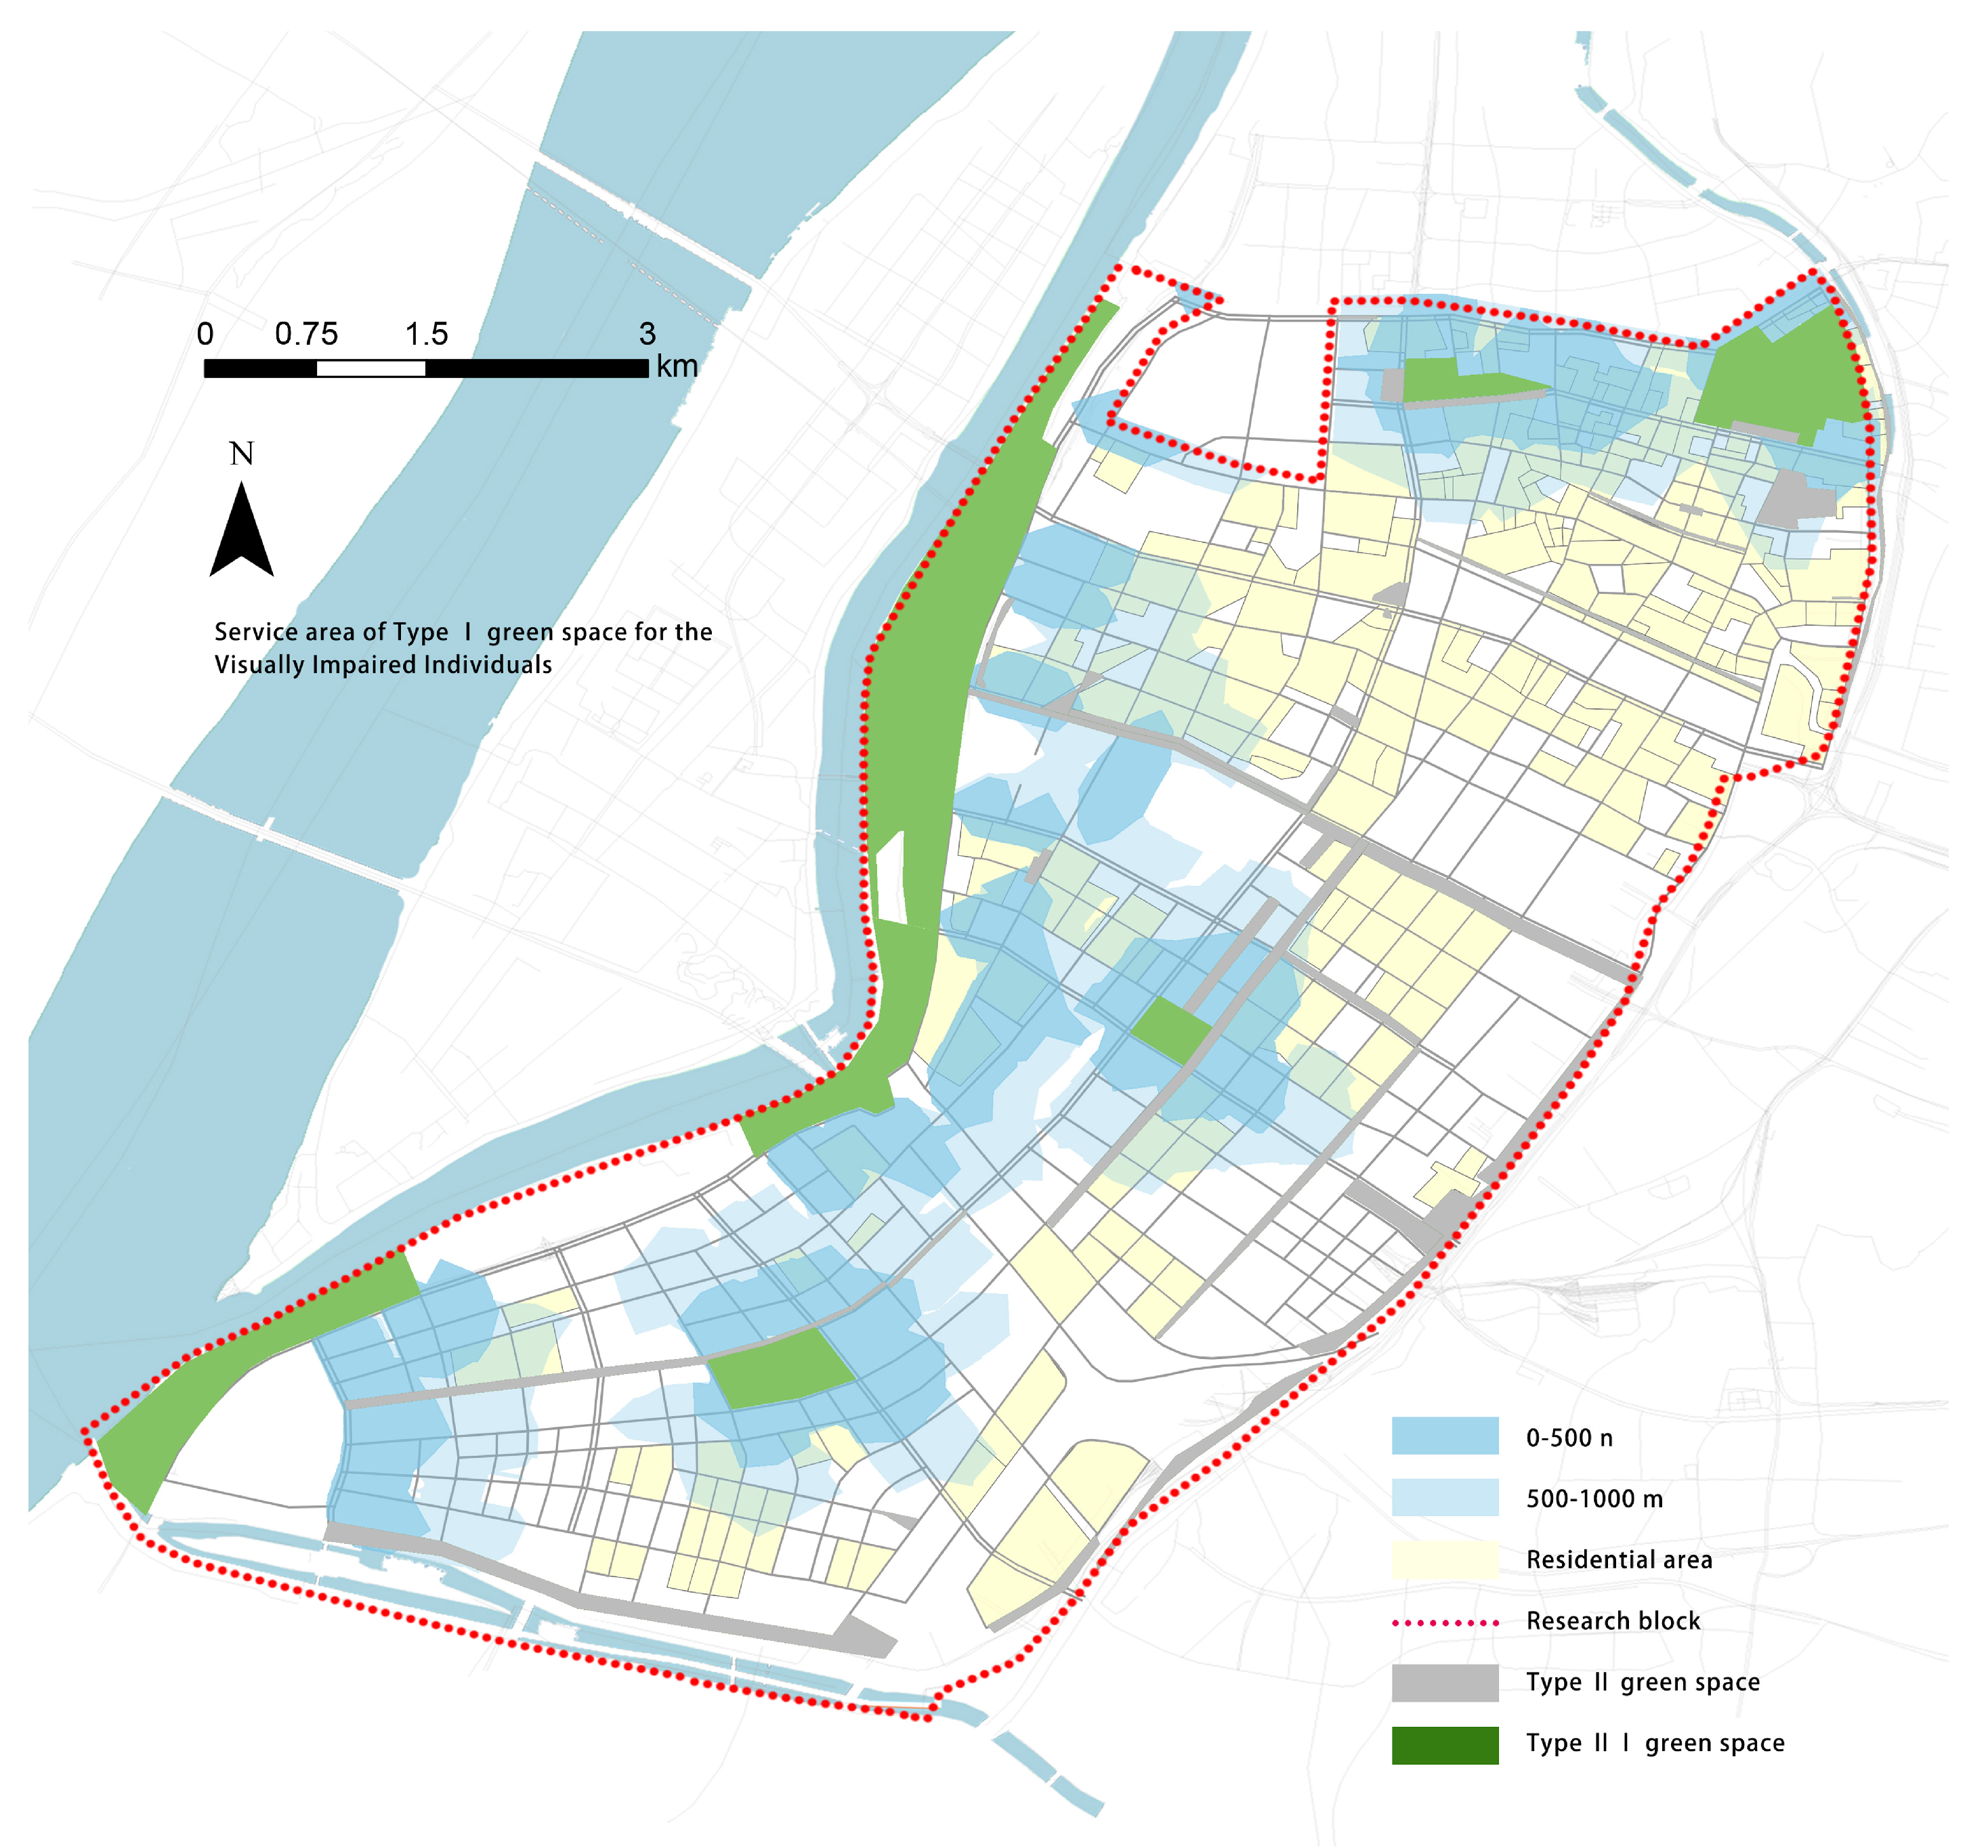
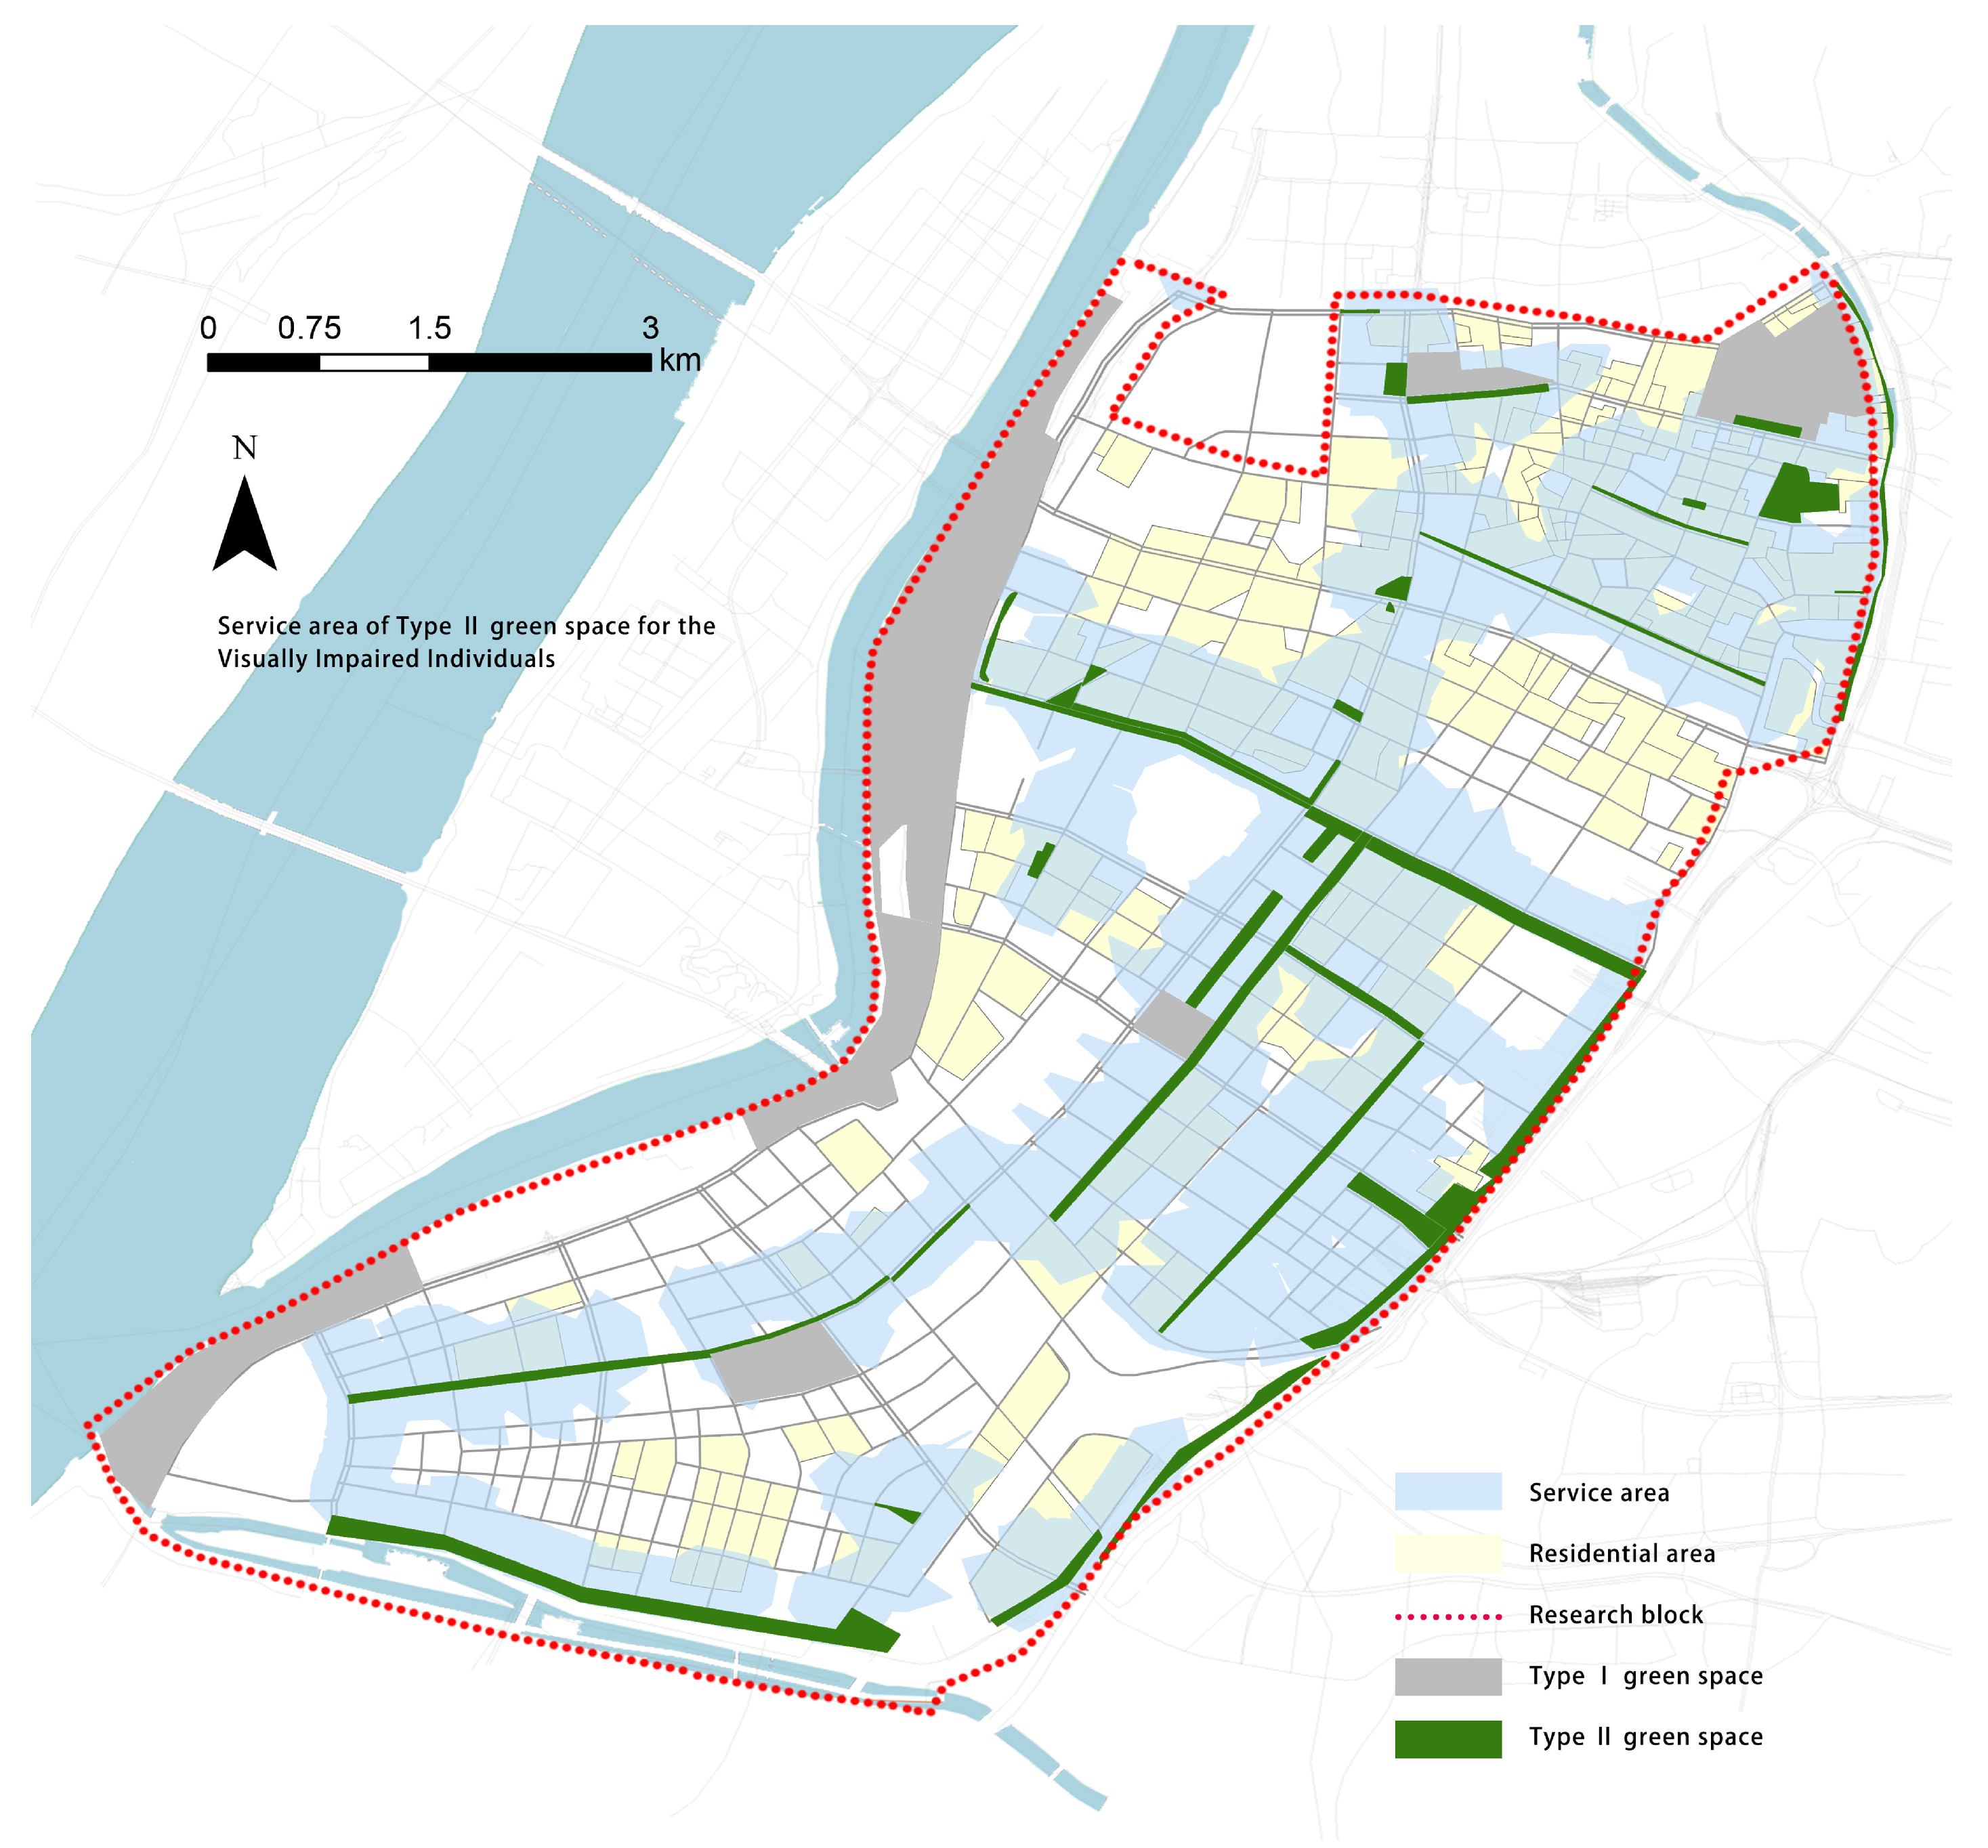
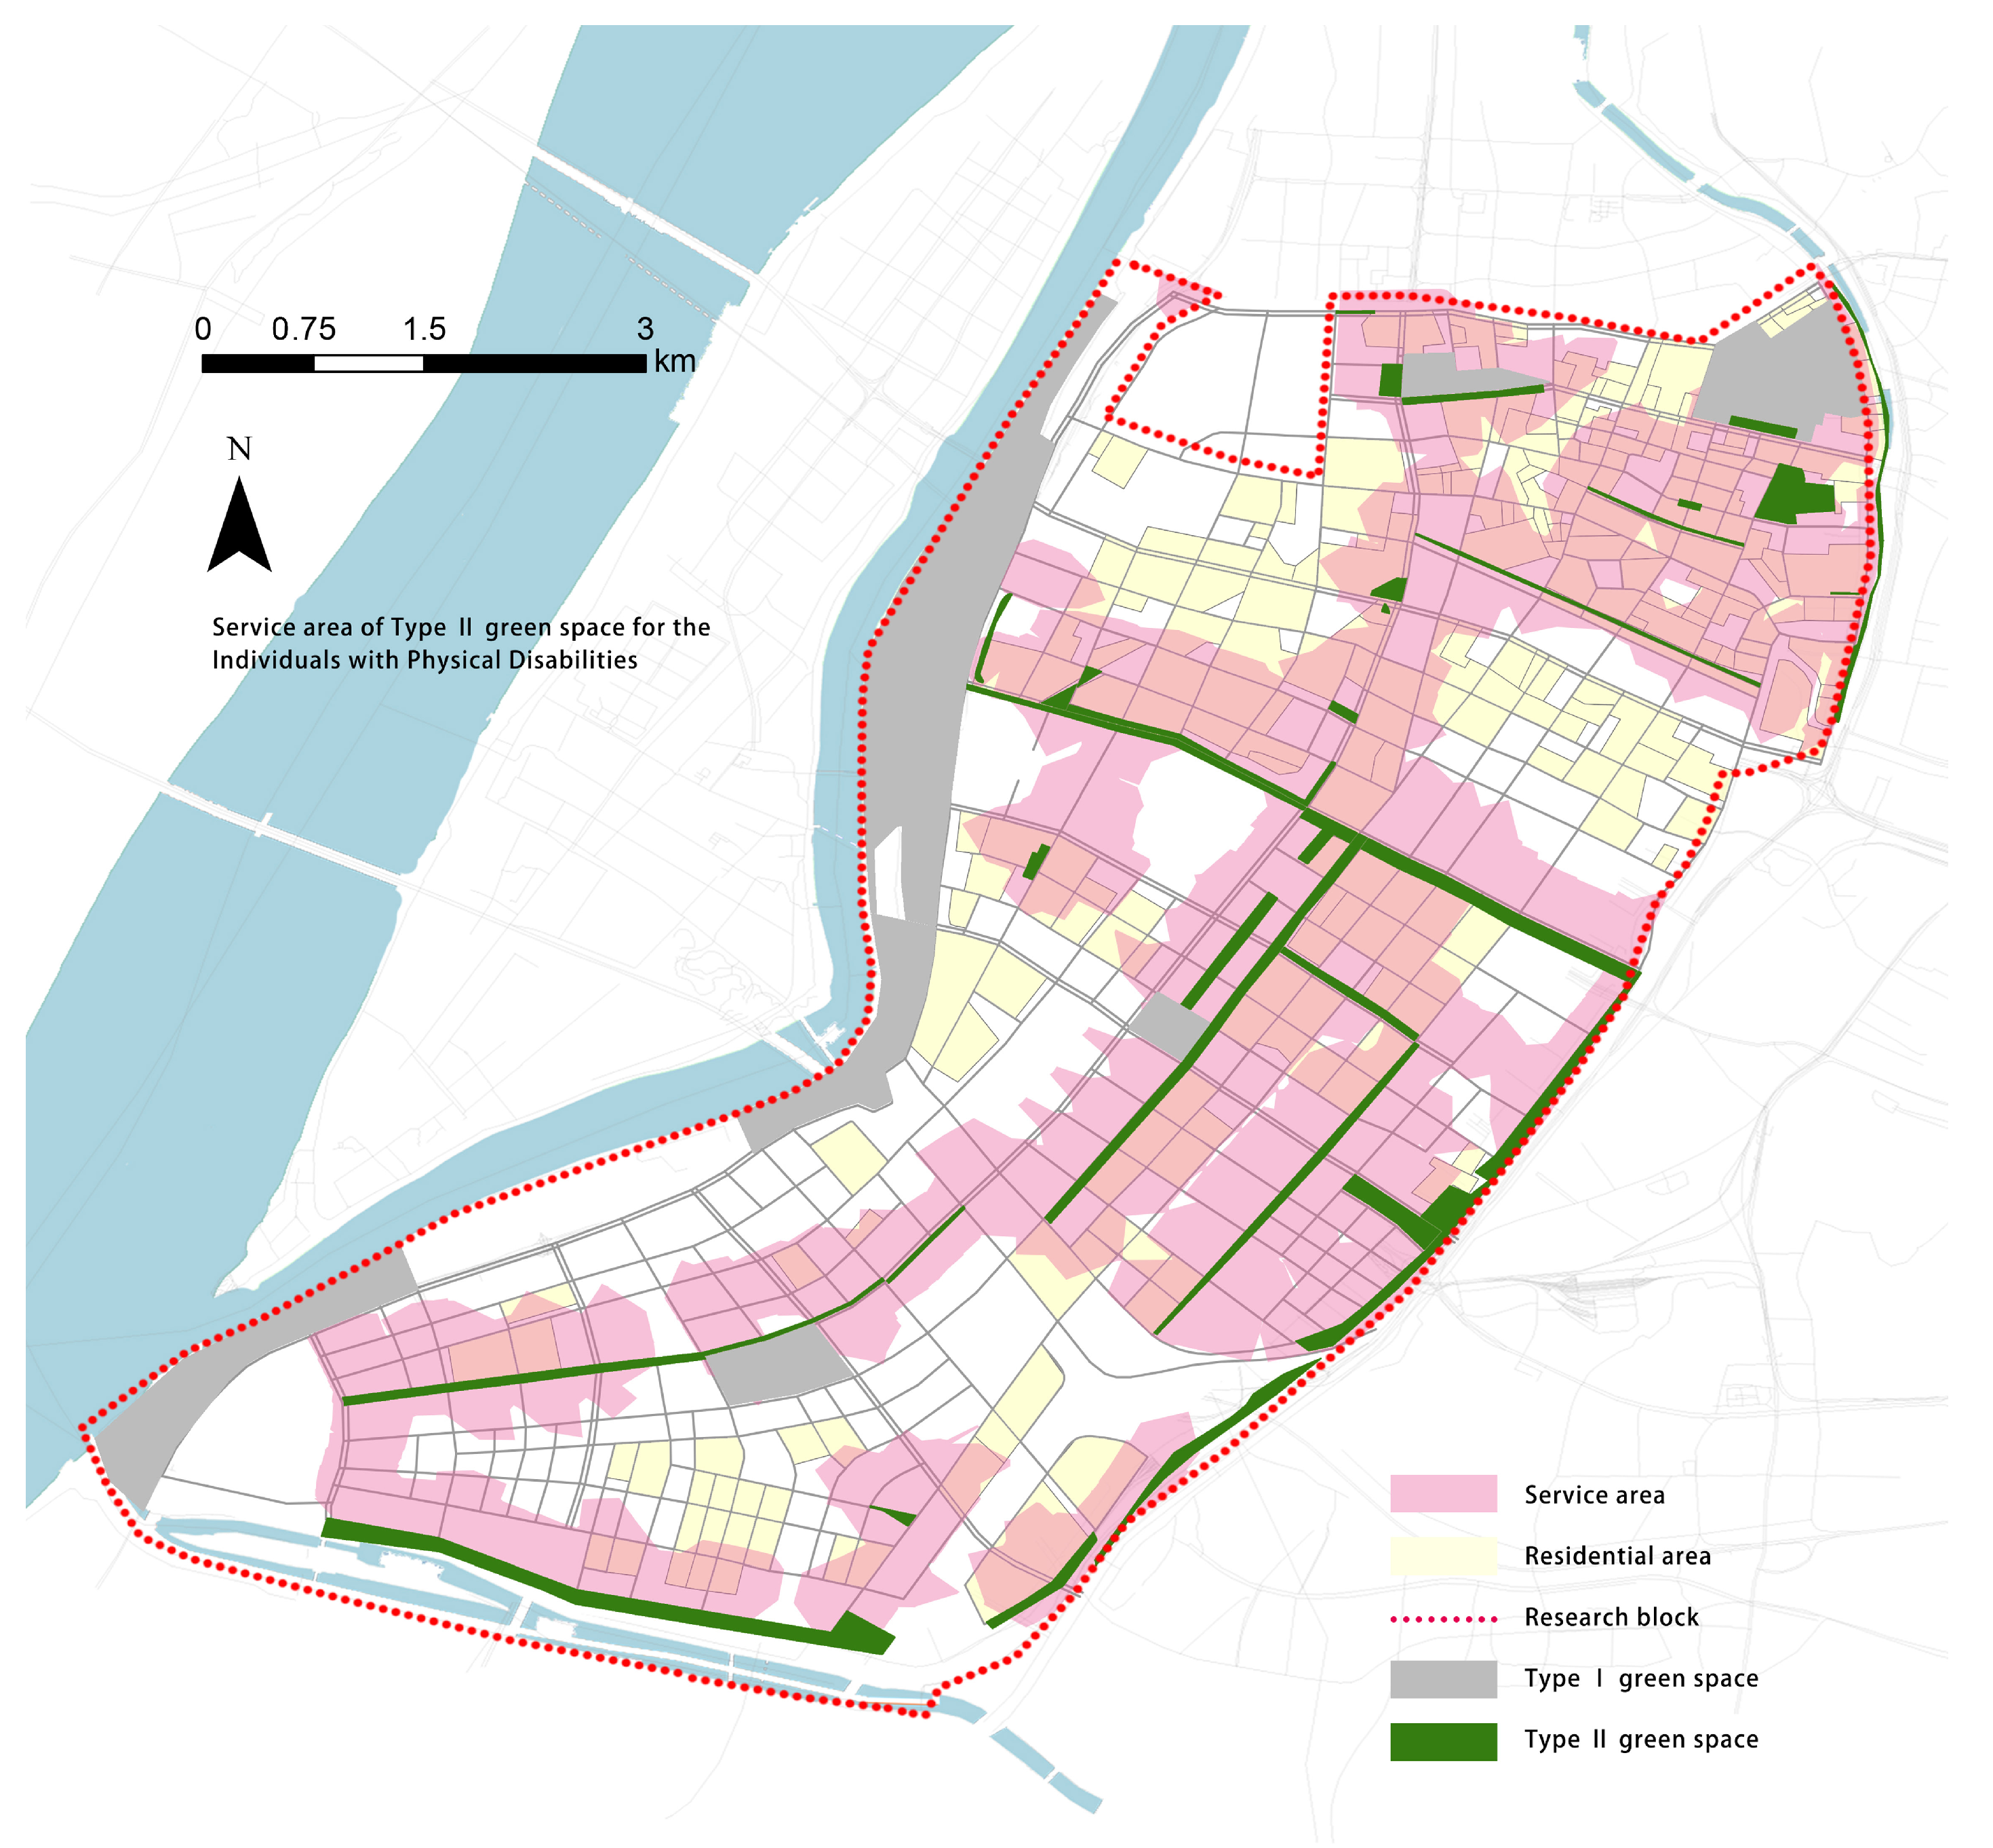
In our study, we observed variations in the classification of urban parks and green spaces across different countries. China, for instance, categorizes them into Comprehensive Park, Community Park, Specialized Park, and Amusement Park. However, our research revealed that the preferences of elderly and disabled individuals in selecting parks and green spaces do not precisely align with the national standards’ categorization. Their priorities lie more in the proximity of green spaces to residential areas and the diversity of green space offerings. To better align with the usage patterns and demand characteristics of this target group, we propose a reclassification of urban park green spaces based on the activity preference of elderly and disabled individuals (Table 1). Type I green spaces have complete facilities and featured content, and are highly attractive. Type II green spaces have certain facilities and content, and the area is small. They are close to residential areas, so they are convenient for residents to use.

2.2. Scope of the Study Area

The study focused on Jianye District, one of the main districts in the city of Nanjing, situated in the southwestern part of the city (Figure 2). Jianye District encompasses six streets, namely Mochou Lake, Xinglong, Nanyuan, Shazhou, Shuangxia, and Jiangxinzhou, comprising a total of 60 communities and six community preparatory groups. As of the end of 2019, the resident population in the study area was 505,600. The research area is surrounded by natural rivers on the east, west, and south sides, with a clearly defined large green space on the northern side, which distinguishes the research area from other regions of the city. Jiangxinzhou street was excluded from the study area due to incomplete development and an incomplete road network.

2.3. Characterization of Park Green Space for the Elderly and the Disabled

To investigate the travel characteristics of elderly and disabled individuals in Jianye District, a questionnaire survey was conducted. A total of 200 questionnaires were distributed to the elderly, with a response rate of 91%. For visually and physically disabled individuals, 100 questionnaires were distributed, with 50 questionnaires for each disability type, and no invalid responses were received. Based on the analysis, the following travel characteristics were identified:
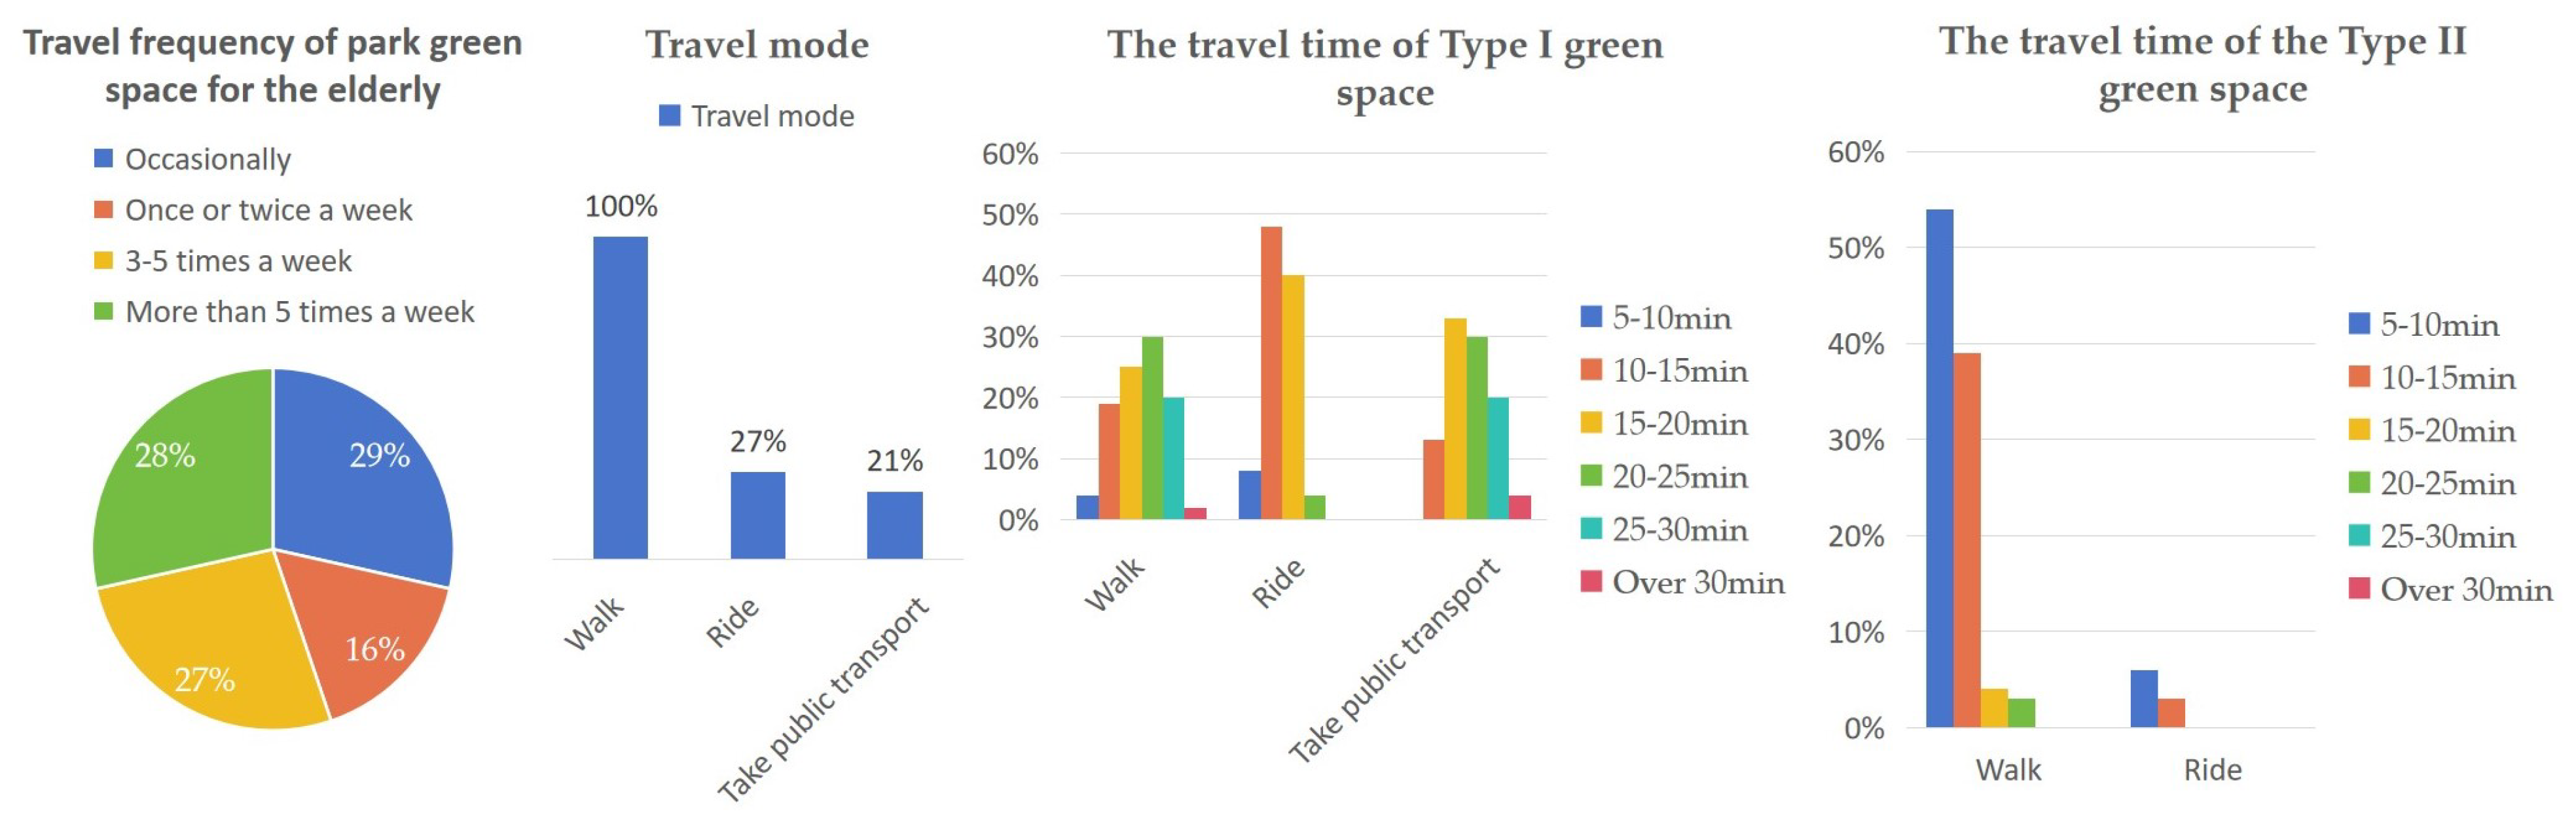
The majority of the elderly population exhibited a strong demand for green spaces (Figure 3). When traveling to Type I green spaces, walking was the primary mode of transportation, supplemented by cycling and public transportation. Type II green spaces were mostly accessible by walking, with a maximum travel time of generally less than 15 min.
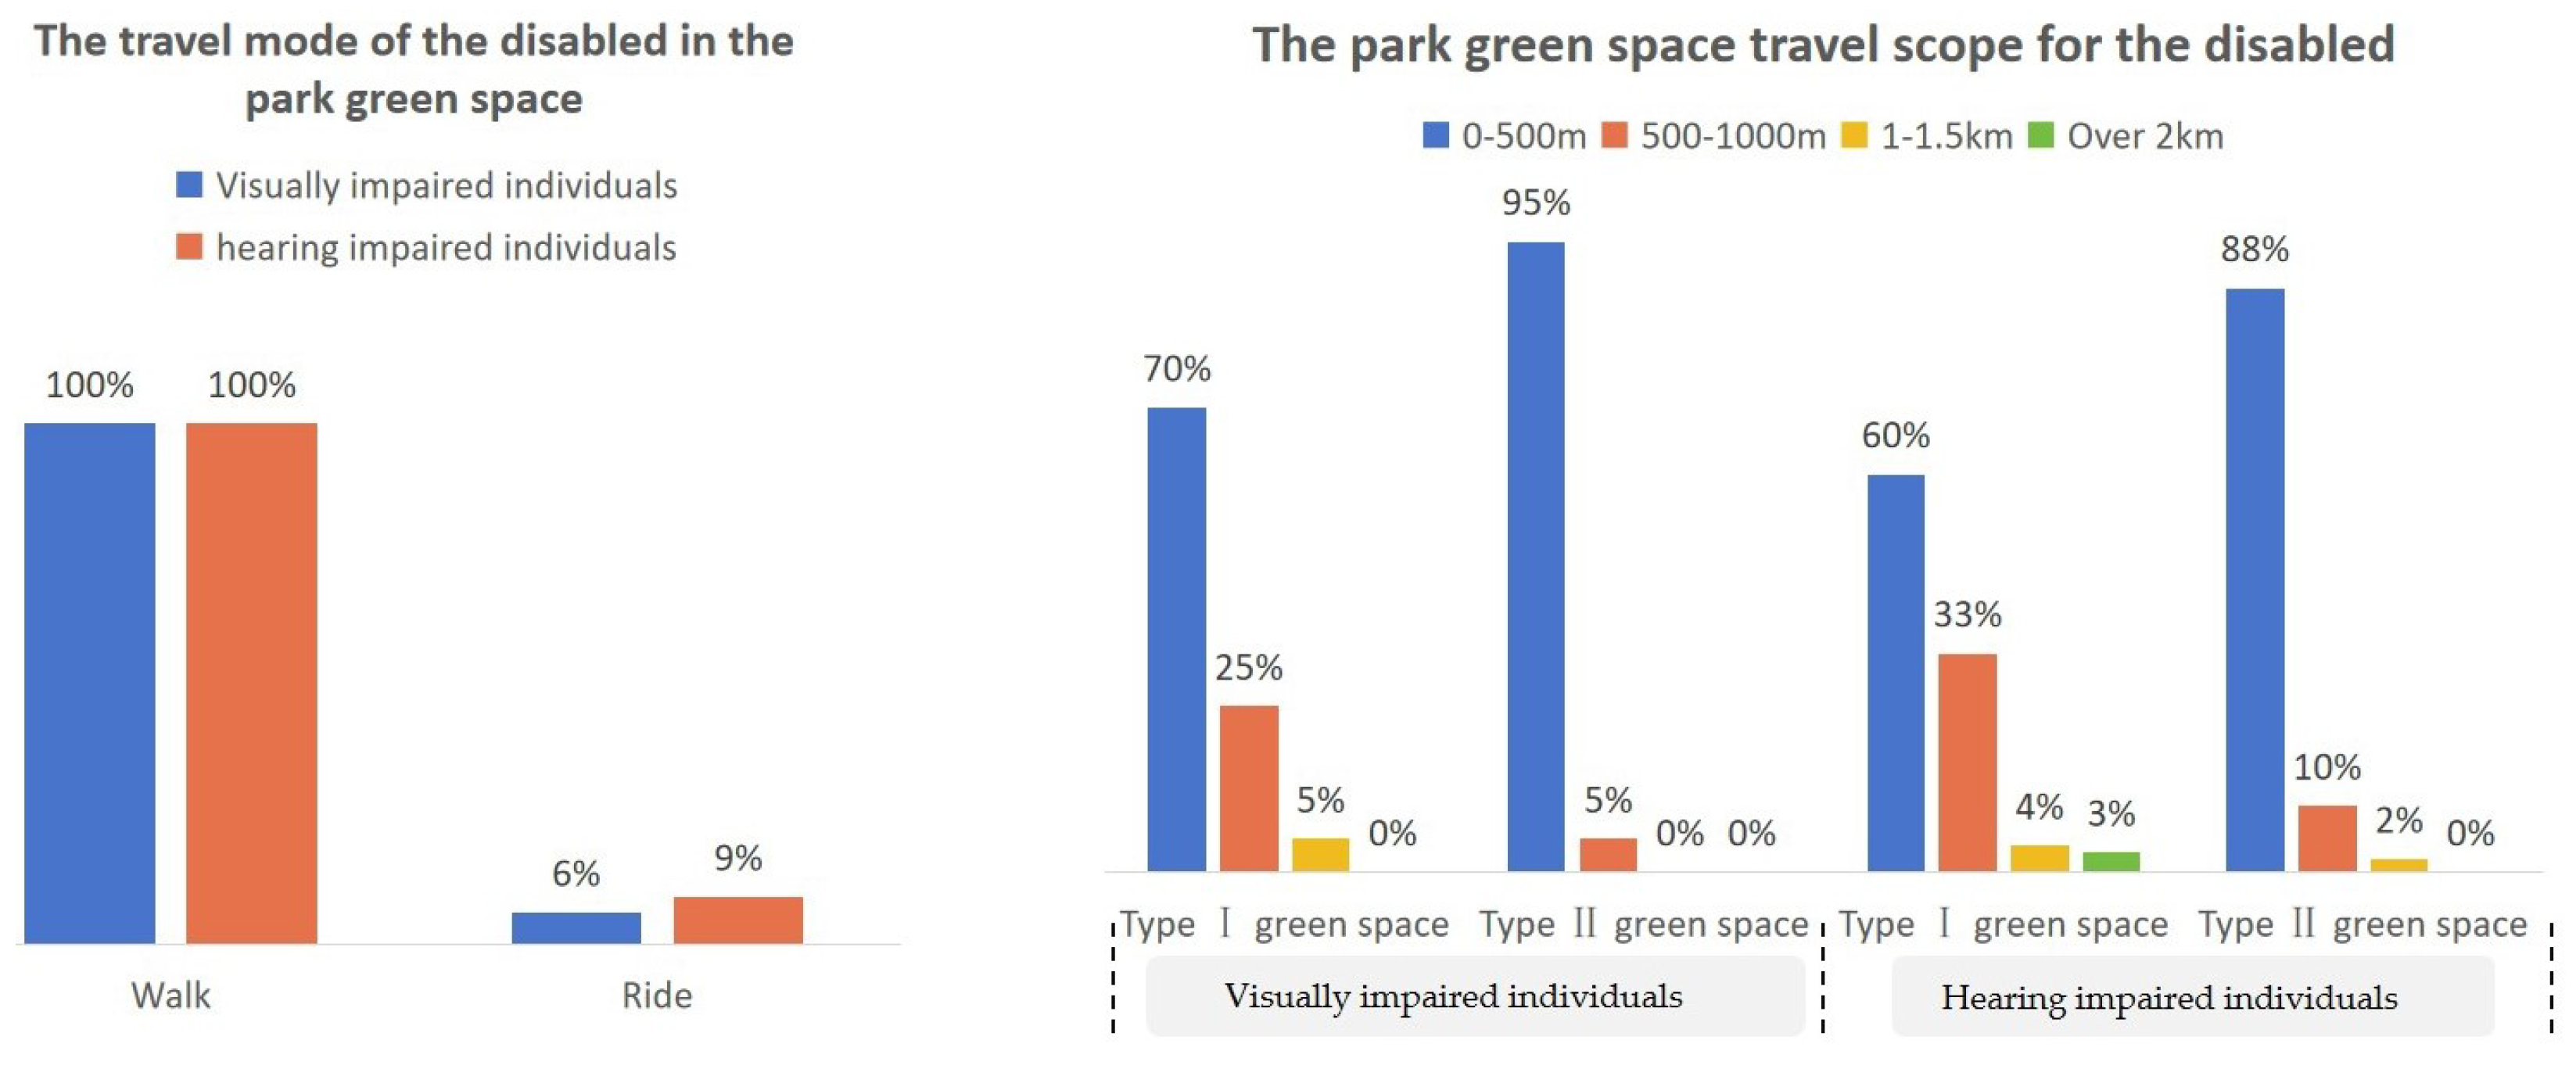
Most disabled individuals have a demand for park green space travel, but their frequency of travel is not high. Their preferred mode of transportation is primarily walking, with fewer choosing other modes of travel for activities in green spaces. Due to the difficulty in determining the travel speed of disabled individuals and the increased likelihood of encountering obstacles with larger travel distances, the questionnaire for disabled individuals focused on measuring travel distance rather than travel time, which better aligns with their travel habits.
Disabled individuals mainly carry out daily activities within a relatively small travel range. For Type I green spaces, some individuals may accept longer walking distances, but generally not exceeding 1 km. For Type II green spaces, the majority of individuals prefer not to walk long distances, with 500 m being an acceptable range for most individuals (Figure 4).

2.4. Geographic Data

2.4.1. Urban Green Space

Jianye District comprises a total of 36 comprehensive parks, community parks, specialized parks, and playgrounds (Table 2). Type I green spaces are primarily situated at the periphery of the study area and are unevenly distributed across the different streets. Type II green spaces are generally located in closer proximity to residential areas. These green spaces, which predominantly consist of parks and green areas along streets and rivers, serve as high-frequency activity sites for the elderly.
Using remote sensing satellite image maps, network maps, and handheld GPS devices, all entrances and exits of park green spaces were identified and labeled. For green spaces with closed boundaries, where visitors can only enter and exit through specific entrances and exits, the intersections of the entrances and roads were designated as entrance and exit points and marked accordingly. In green areas with open boundaries, visitors have the flexibility to enter from any point along the green area boundary. In this case, the points where the green area intersects with other roads are identified as entrance and exit points, and a total of 208 such points are marked (Figure 5).

2.4.2. Population Distribution

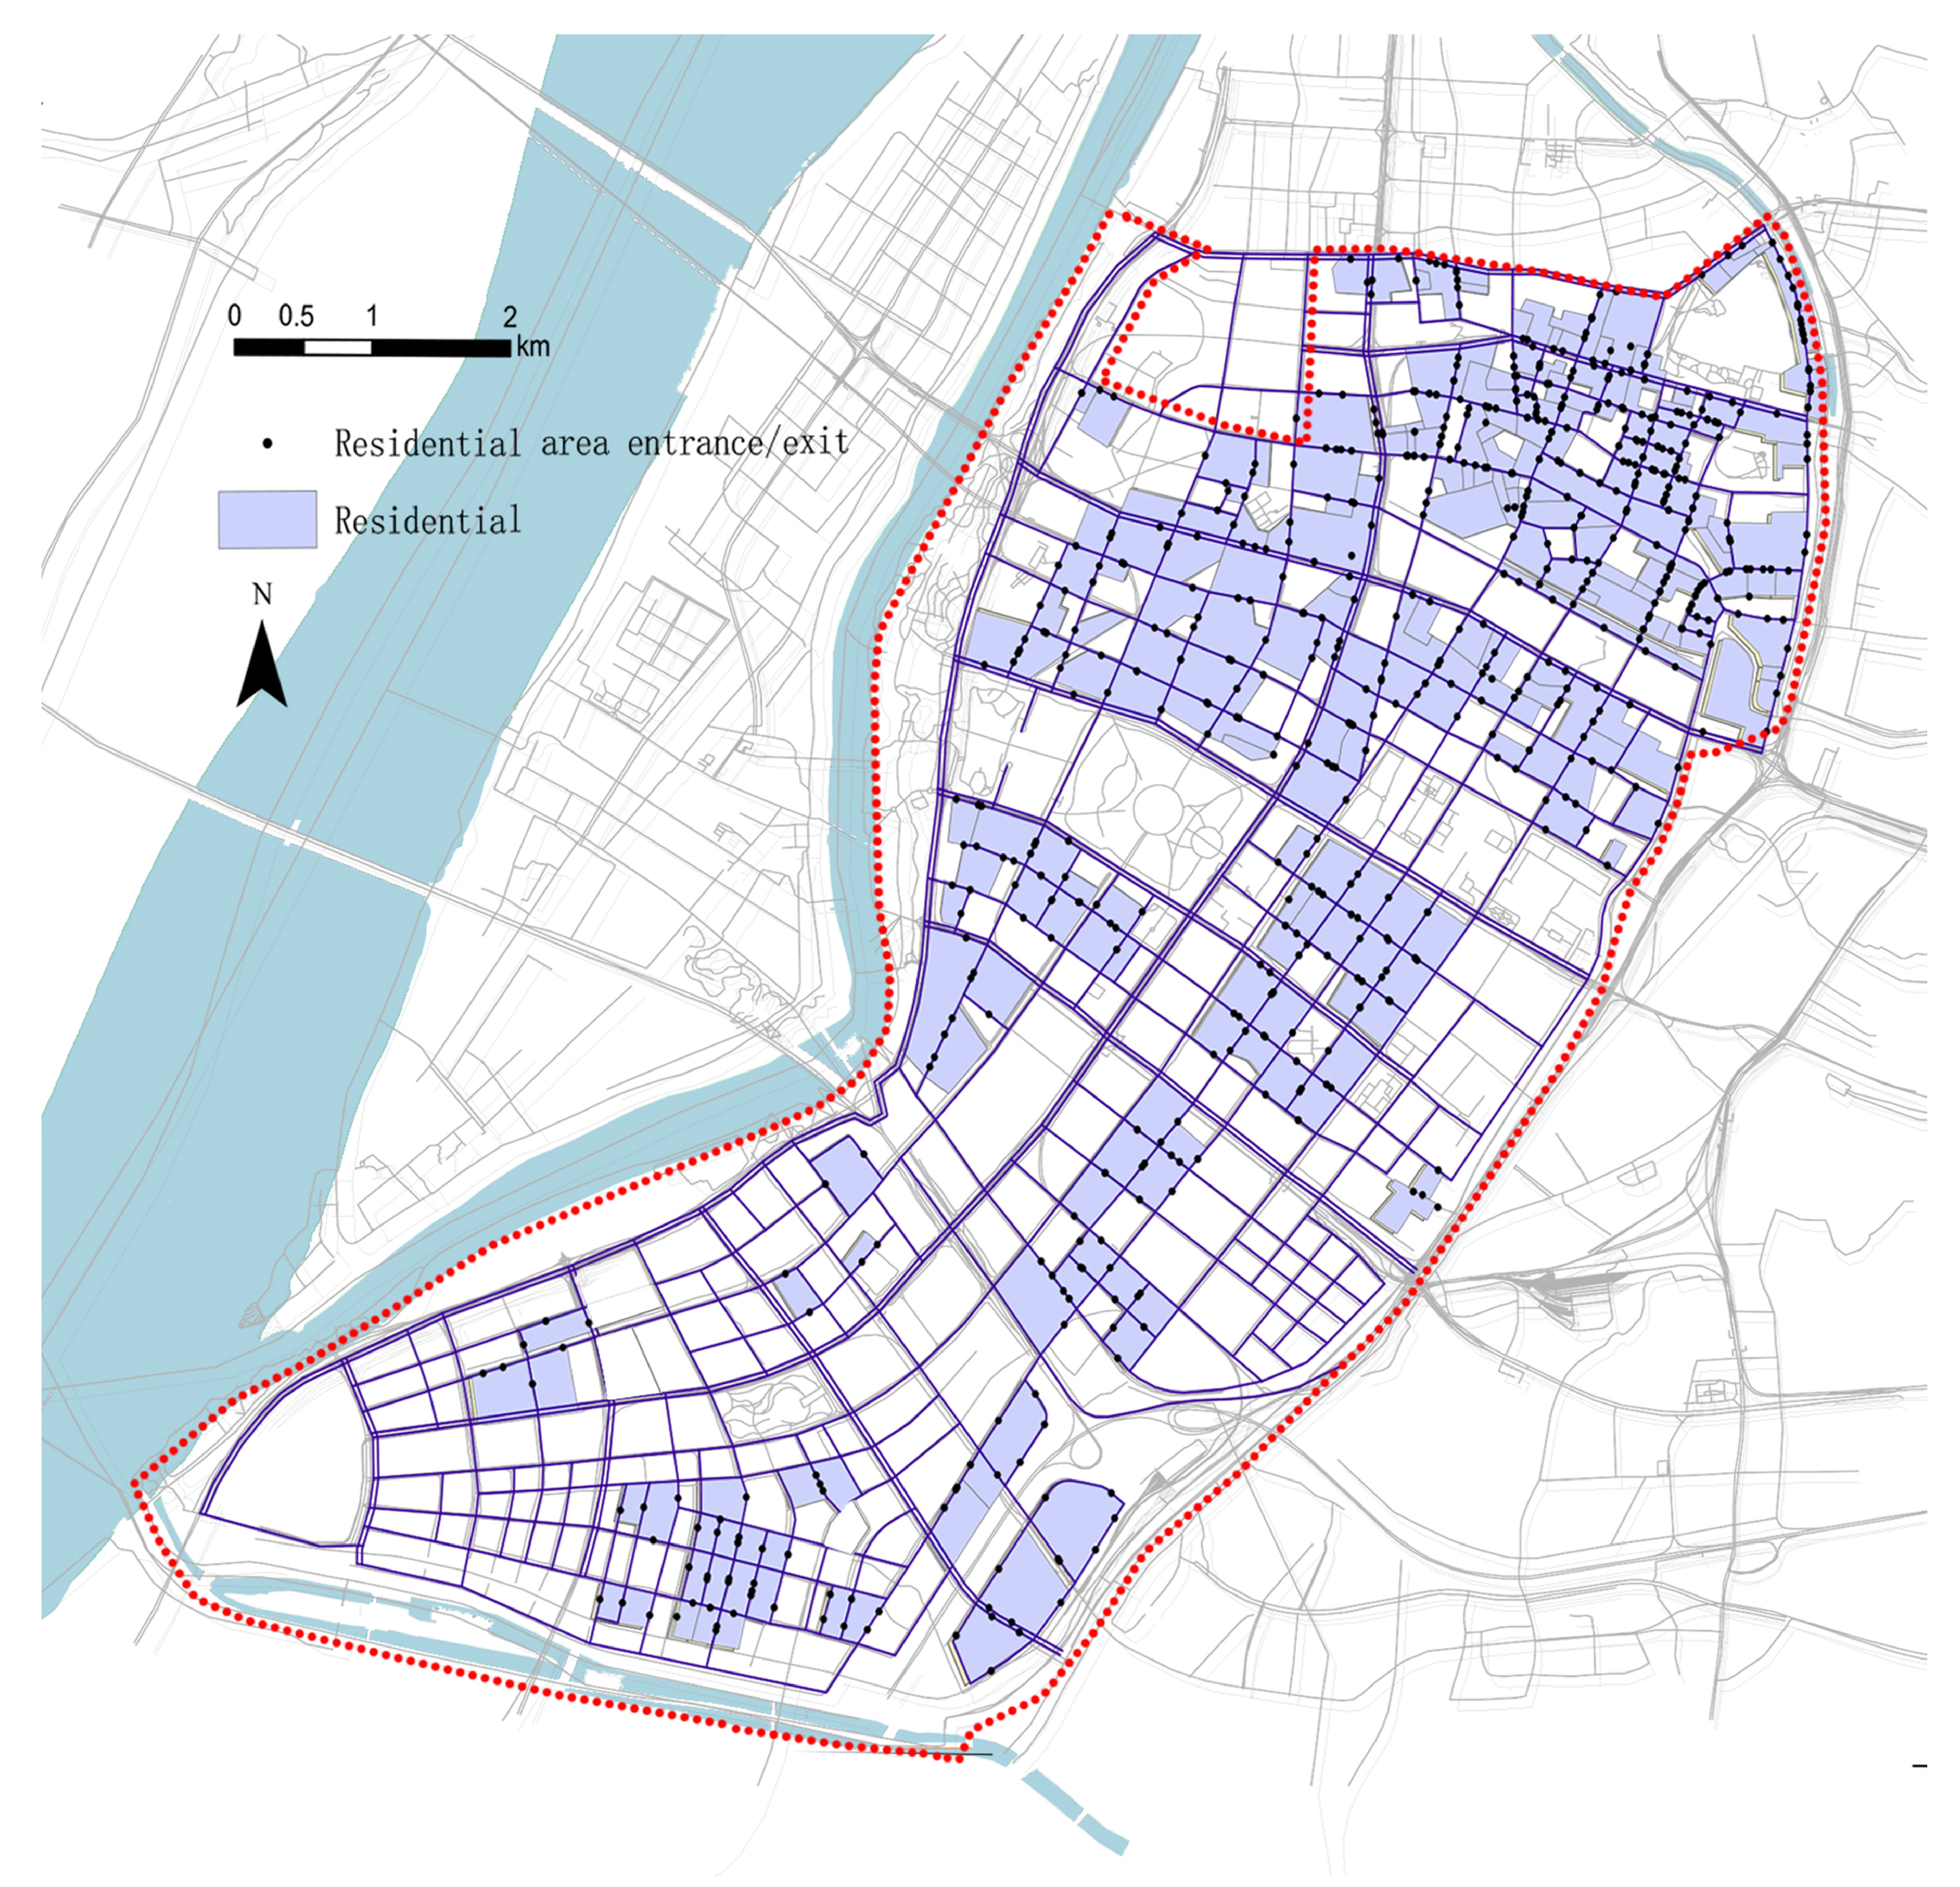
The outer boundaries of all residential areas within the study area were delineated in ArcGIS based on internet maps and satellite image maps, resulting in the creation of a residential area dataset. Through GPS device positioning and searching maps on the internet, a total of 636 entrances and exits were identified for the 246 residential areas in Jianye District. These coordinate points were imported into GIS, underwent coordinate transformation, and were exported as element classes (Figure 6). This dataset serves as one of the core data sources for subsequent accessibility calculations.
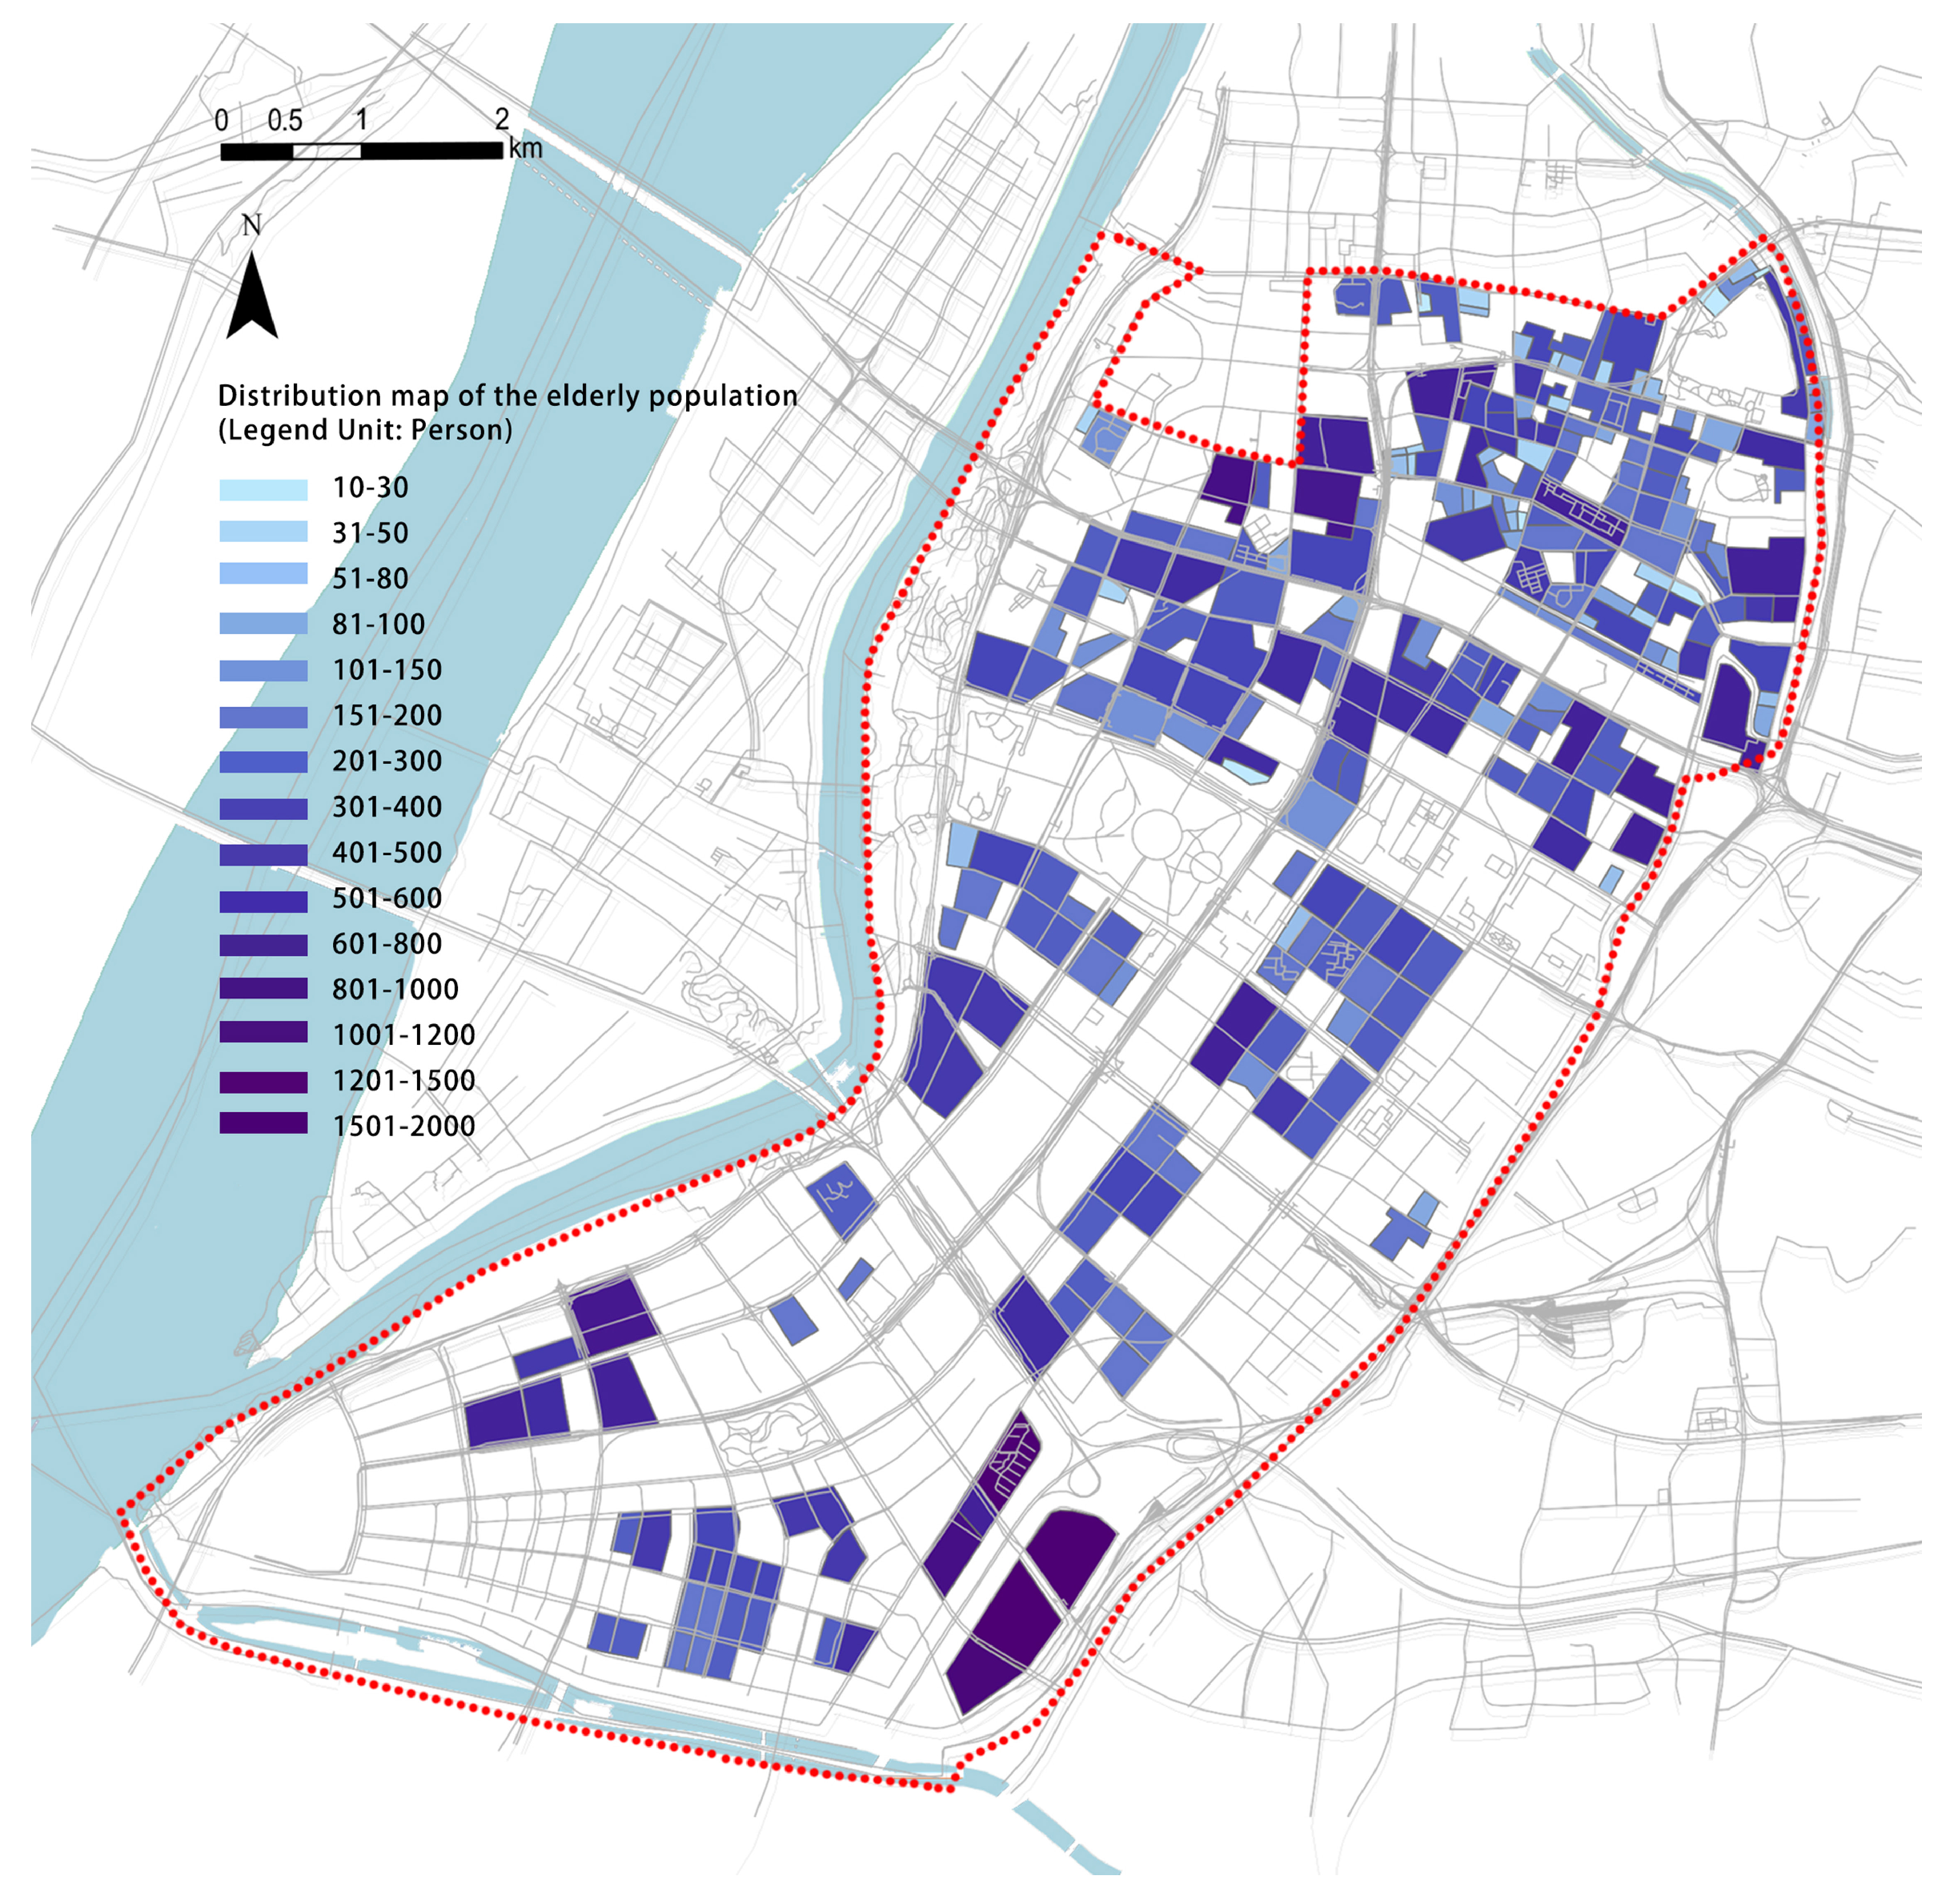
To analyze the distribution of the elderly population, the number of elderly individuals was associated with the residential area dataset, resulting in a map depicting the spatial distribution of the elderly population (
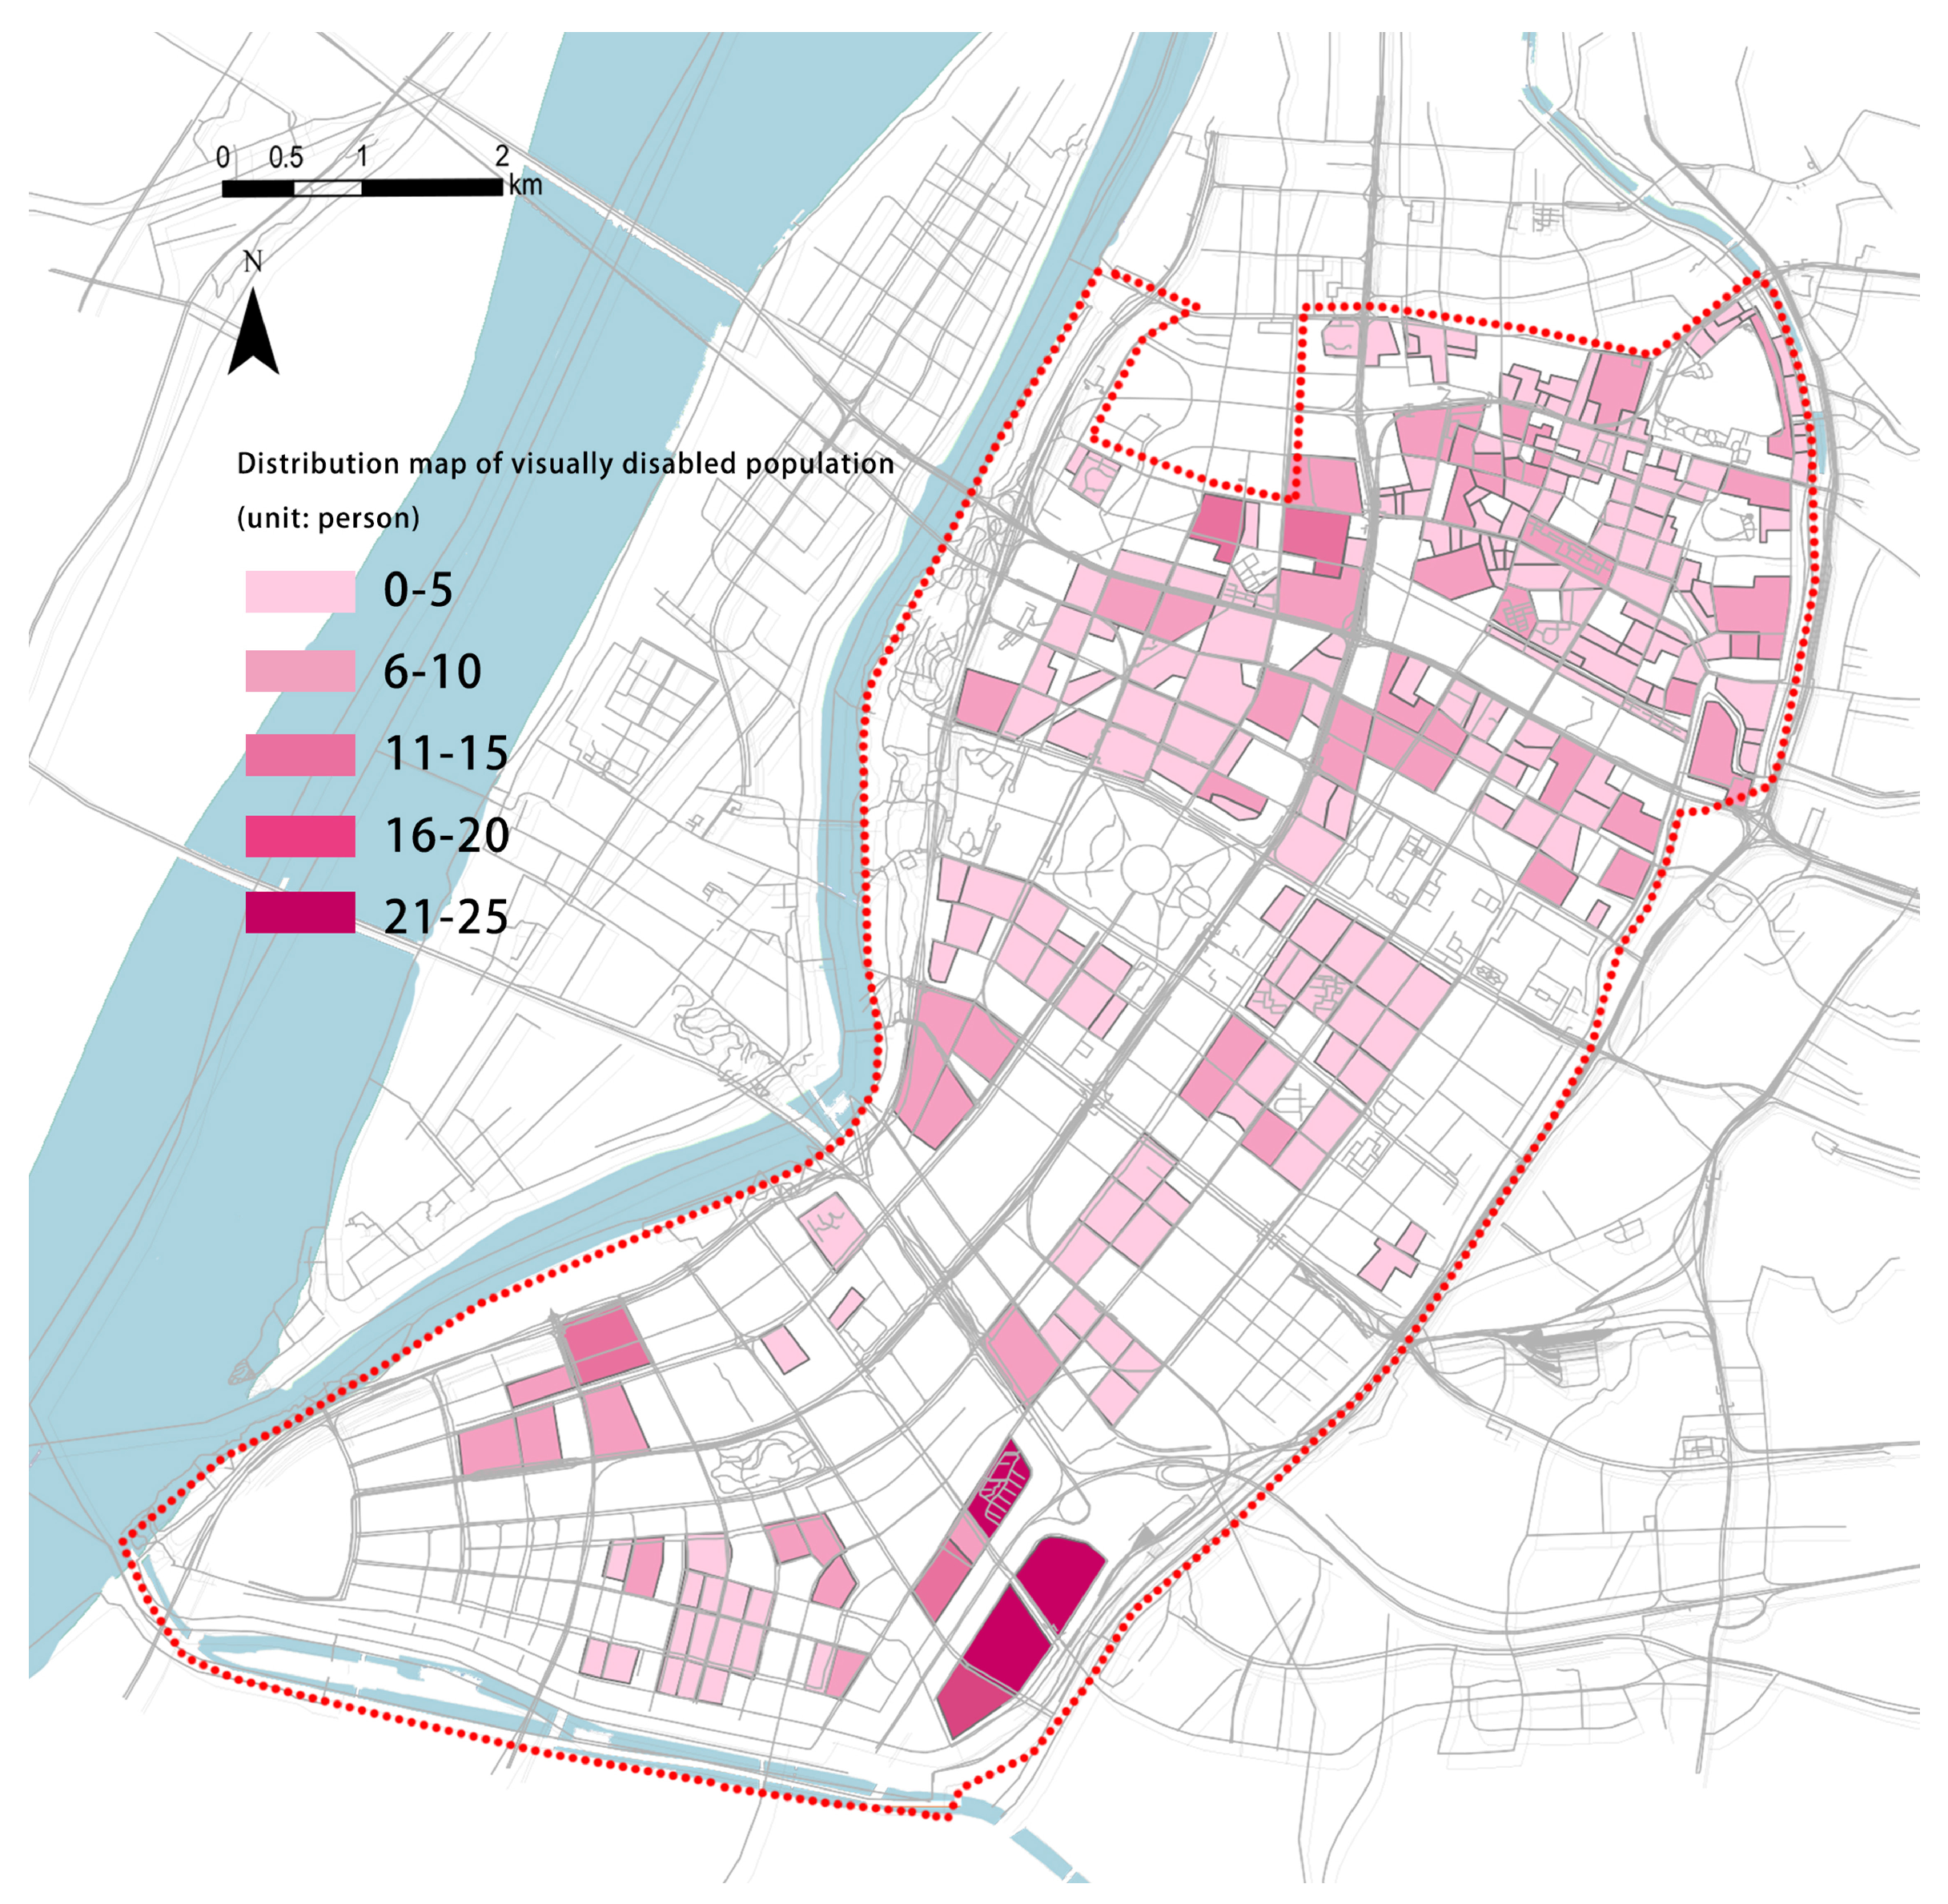
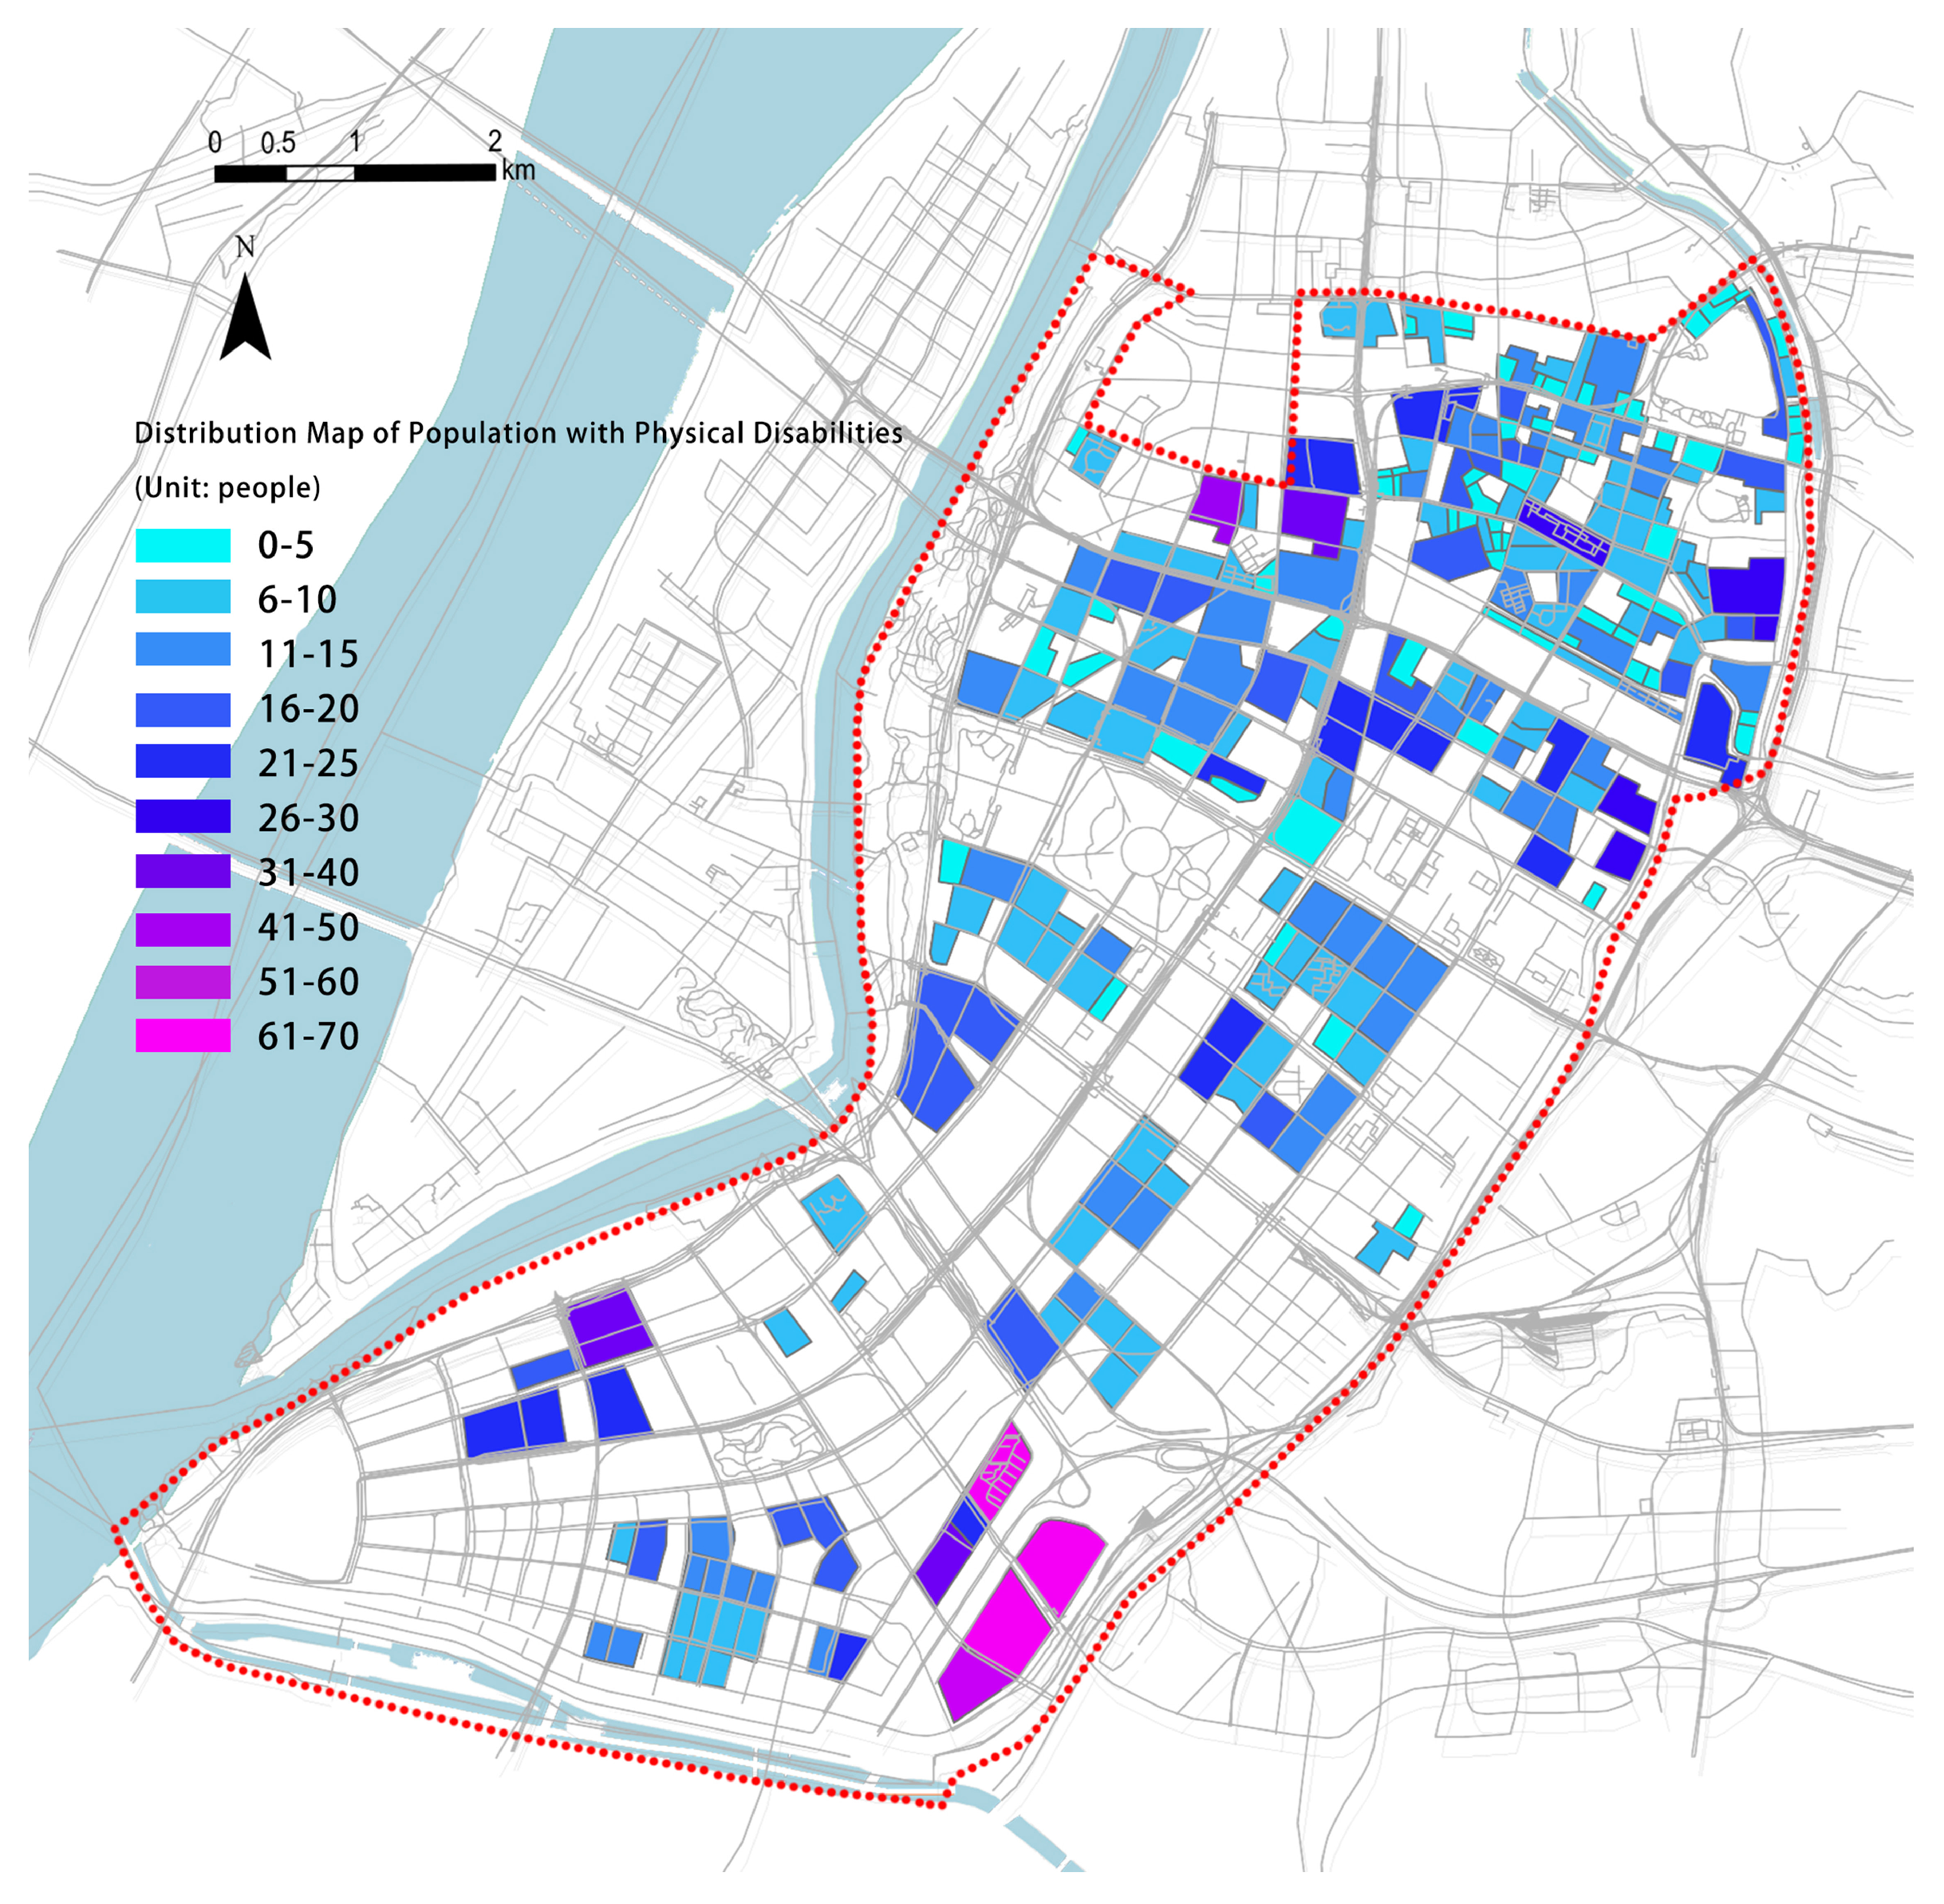
Figure 7). Similarly, the number of disabled individuals was associated with the residential area dataset, generating distribution maps of the disabled population (Figure 8 and Figure 9).
According to the network maps and satellite imagery, we created a distribution map of all residential areas within the study area in ArcMap as residential area data. Additionally, we obtained the number of residential households for each residential area, including residential communities, apartments, and institutional dormitories, within Jianye District from websites such as Lianjia and Anjuke. The residential areas of Jiangxinzhou were excluded from the data. We excluded newly constructed residential areas that are still uninhabited. In total, we obtained data for 246 residential areas (Table 3). The number of residential households in each neighborhood was utilized to calculate the corresponding number of elderly and disabled individuals in that neighborhood, employing the Equations (1) and (2).
N j e = E j s / R s R j ,
where j represents the residential area, N j e represents the number of elderly individuals, E j s represents the total number of elderly individuals on the street s where the residential area j is located, R s represents the total number of residential households on the street s, and R j represents the number of residential households in each residential area.
N j d = E j d / R s R j ,
where j represents the residential area, N j d represents the number of elderly individuals, E j d represents the total number of elderly individuals on the street s where the residential area j is located, R s represents the total number of residential households on the street s, and R j represents the number of residential households in each residential area.
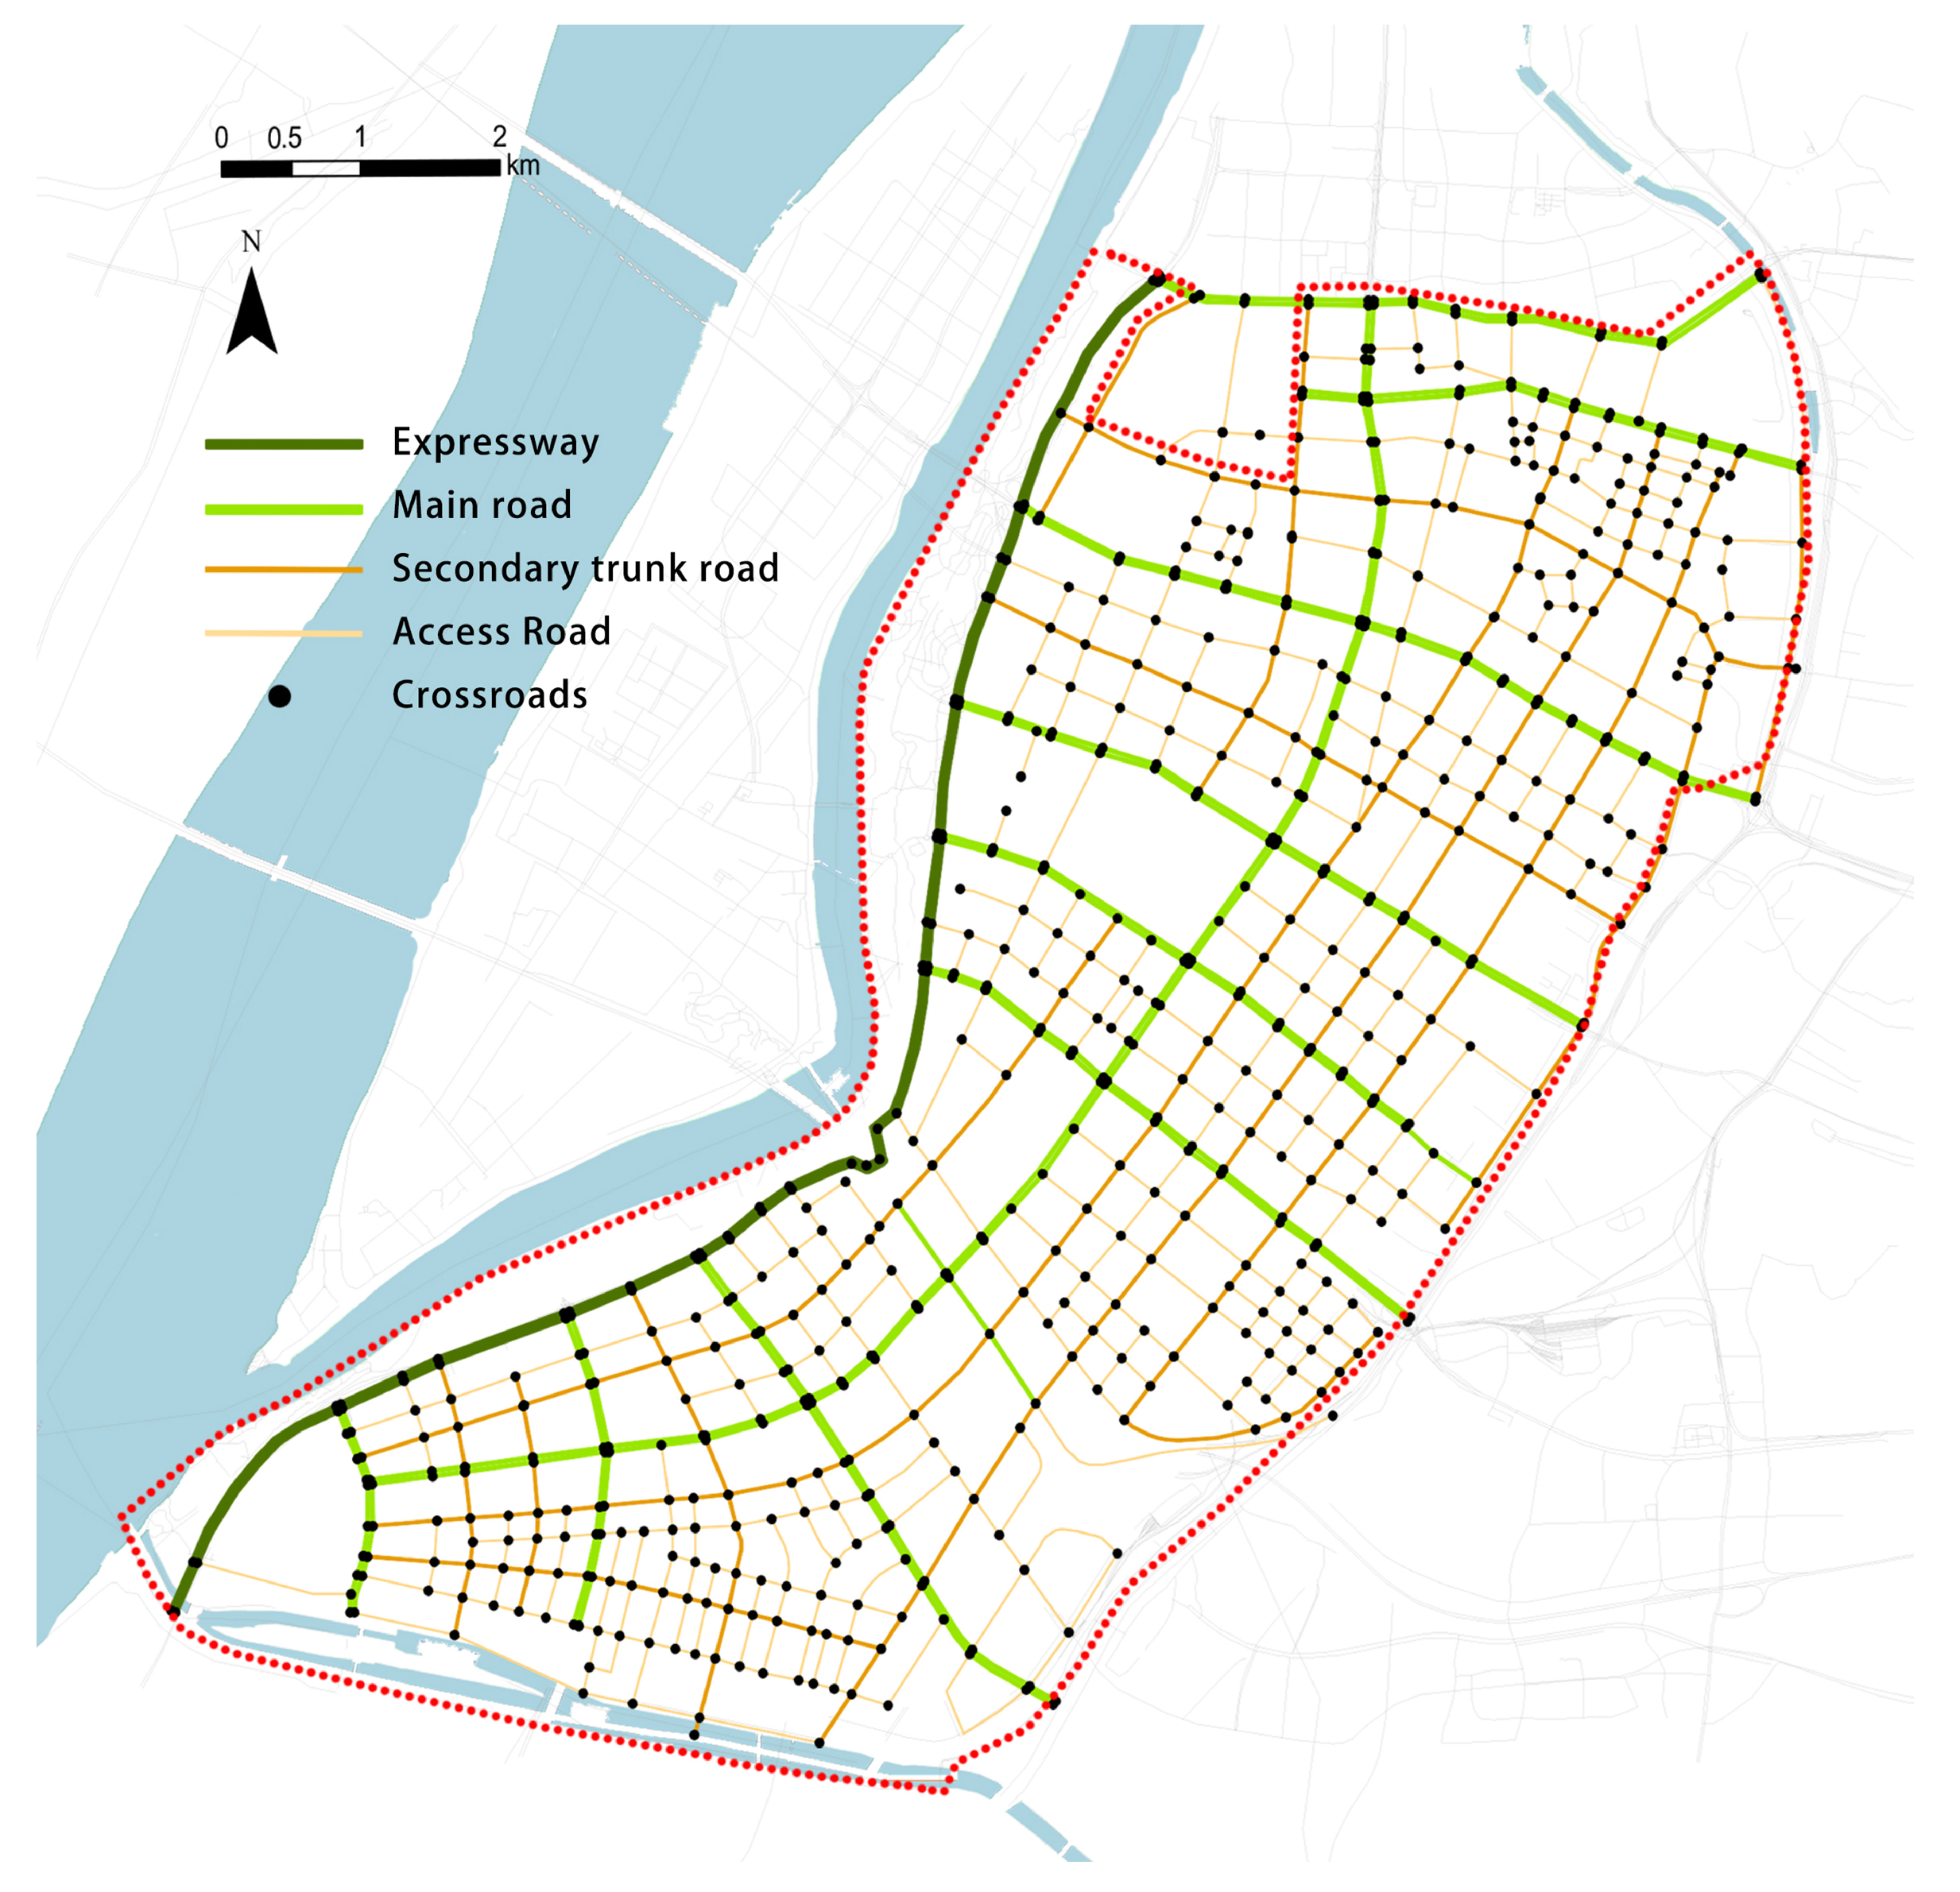
Utilizing OpenStreetMap as a data reference, irrelevant data such as roads within residential areas, internal roads within green spaces, and disconnected roads were removed. Additionally, certain sections of the road network were corrected based on satellite image maps. The road network of Jianye District was then analyzed, and the expressways, main roads, secondary roads, branch roads, and intersections were extracted (Figure 10).
The elderly and disabled individuals often require walking aids such as canes or wheelchairs due to their limited physical mobility. Additionally, their walking stride is typically larger (Table 4). Consequently, compared to other population groups, the elderly and disabled individuals have a greater need for walking on a larger scale. Therefore, the requirement for an effective sidewalk width is higher for them, with a minimum value of 1.5 m.
A comprehensive study was conducted on all roads within the study area, encompassing a total of 141 roads with a combined length of 244.7 km. Among these roads, 227.5 km (93%) were constructed with sidewalks. Sidewalks with an effective passing width exceeding 1.5 m accounted for 177.5 km (78%), achieving a compliance rate of 78%. Sidewalks meeting the standard constituted 72.5% of the total length of all roads (Figure 11).
The study also identified 212.7 km (87%) of sidewalks with complete and continuous blind alleys, representing 87% of the total road length in the study area (Figure 12). These sidewalks, along with the entire road network featuring sidewalks with effective passing widths greater than 1.5 m, were selected as the fundamental data for subsequent calculations pertaining to the accessibility of park green spaces for the elderly and physically disabled populations.

2.5. Resistance Parameter

Relevant statistical research indicates that the average walking speed for the elderly on sidewalks is approximately 1.02 m/s. The waiting time at intersections is set at 45 s, while the delay time for overpasses and underpasses is set at 32 s. The cycling speed is defined as 10 km/h. It is important to note that for disabled individuals, flyovers and underpasses pose significant barriers, resulting in their designation as impassable. To summarize, the resistance value parameters for this network analysis are presented in Table 5.

2.6. Analysis Model

2.6.1. Road Network

After determining the required geographic data and resistance value parameters for network analysis, data collection for the four elements of the network analysis—centers, nodes, links, and resistances—has been completed. The accessibility calculation and analysis can now be performed using the Network Analysis tool on the ArcGIS platform. The process primarily involves the following steps (Figure 13).

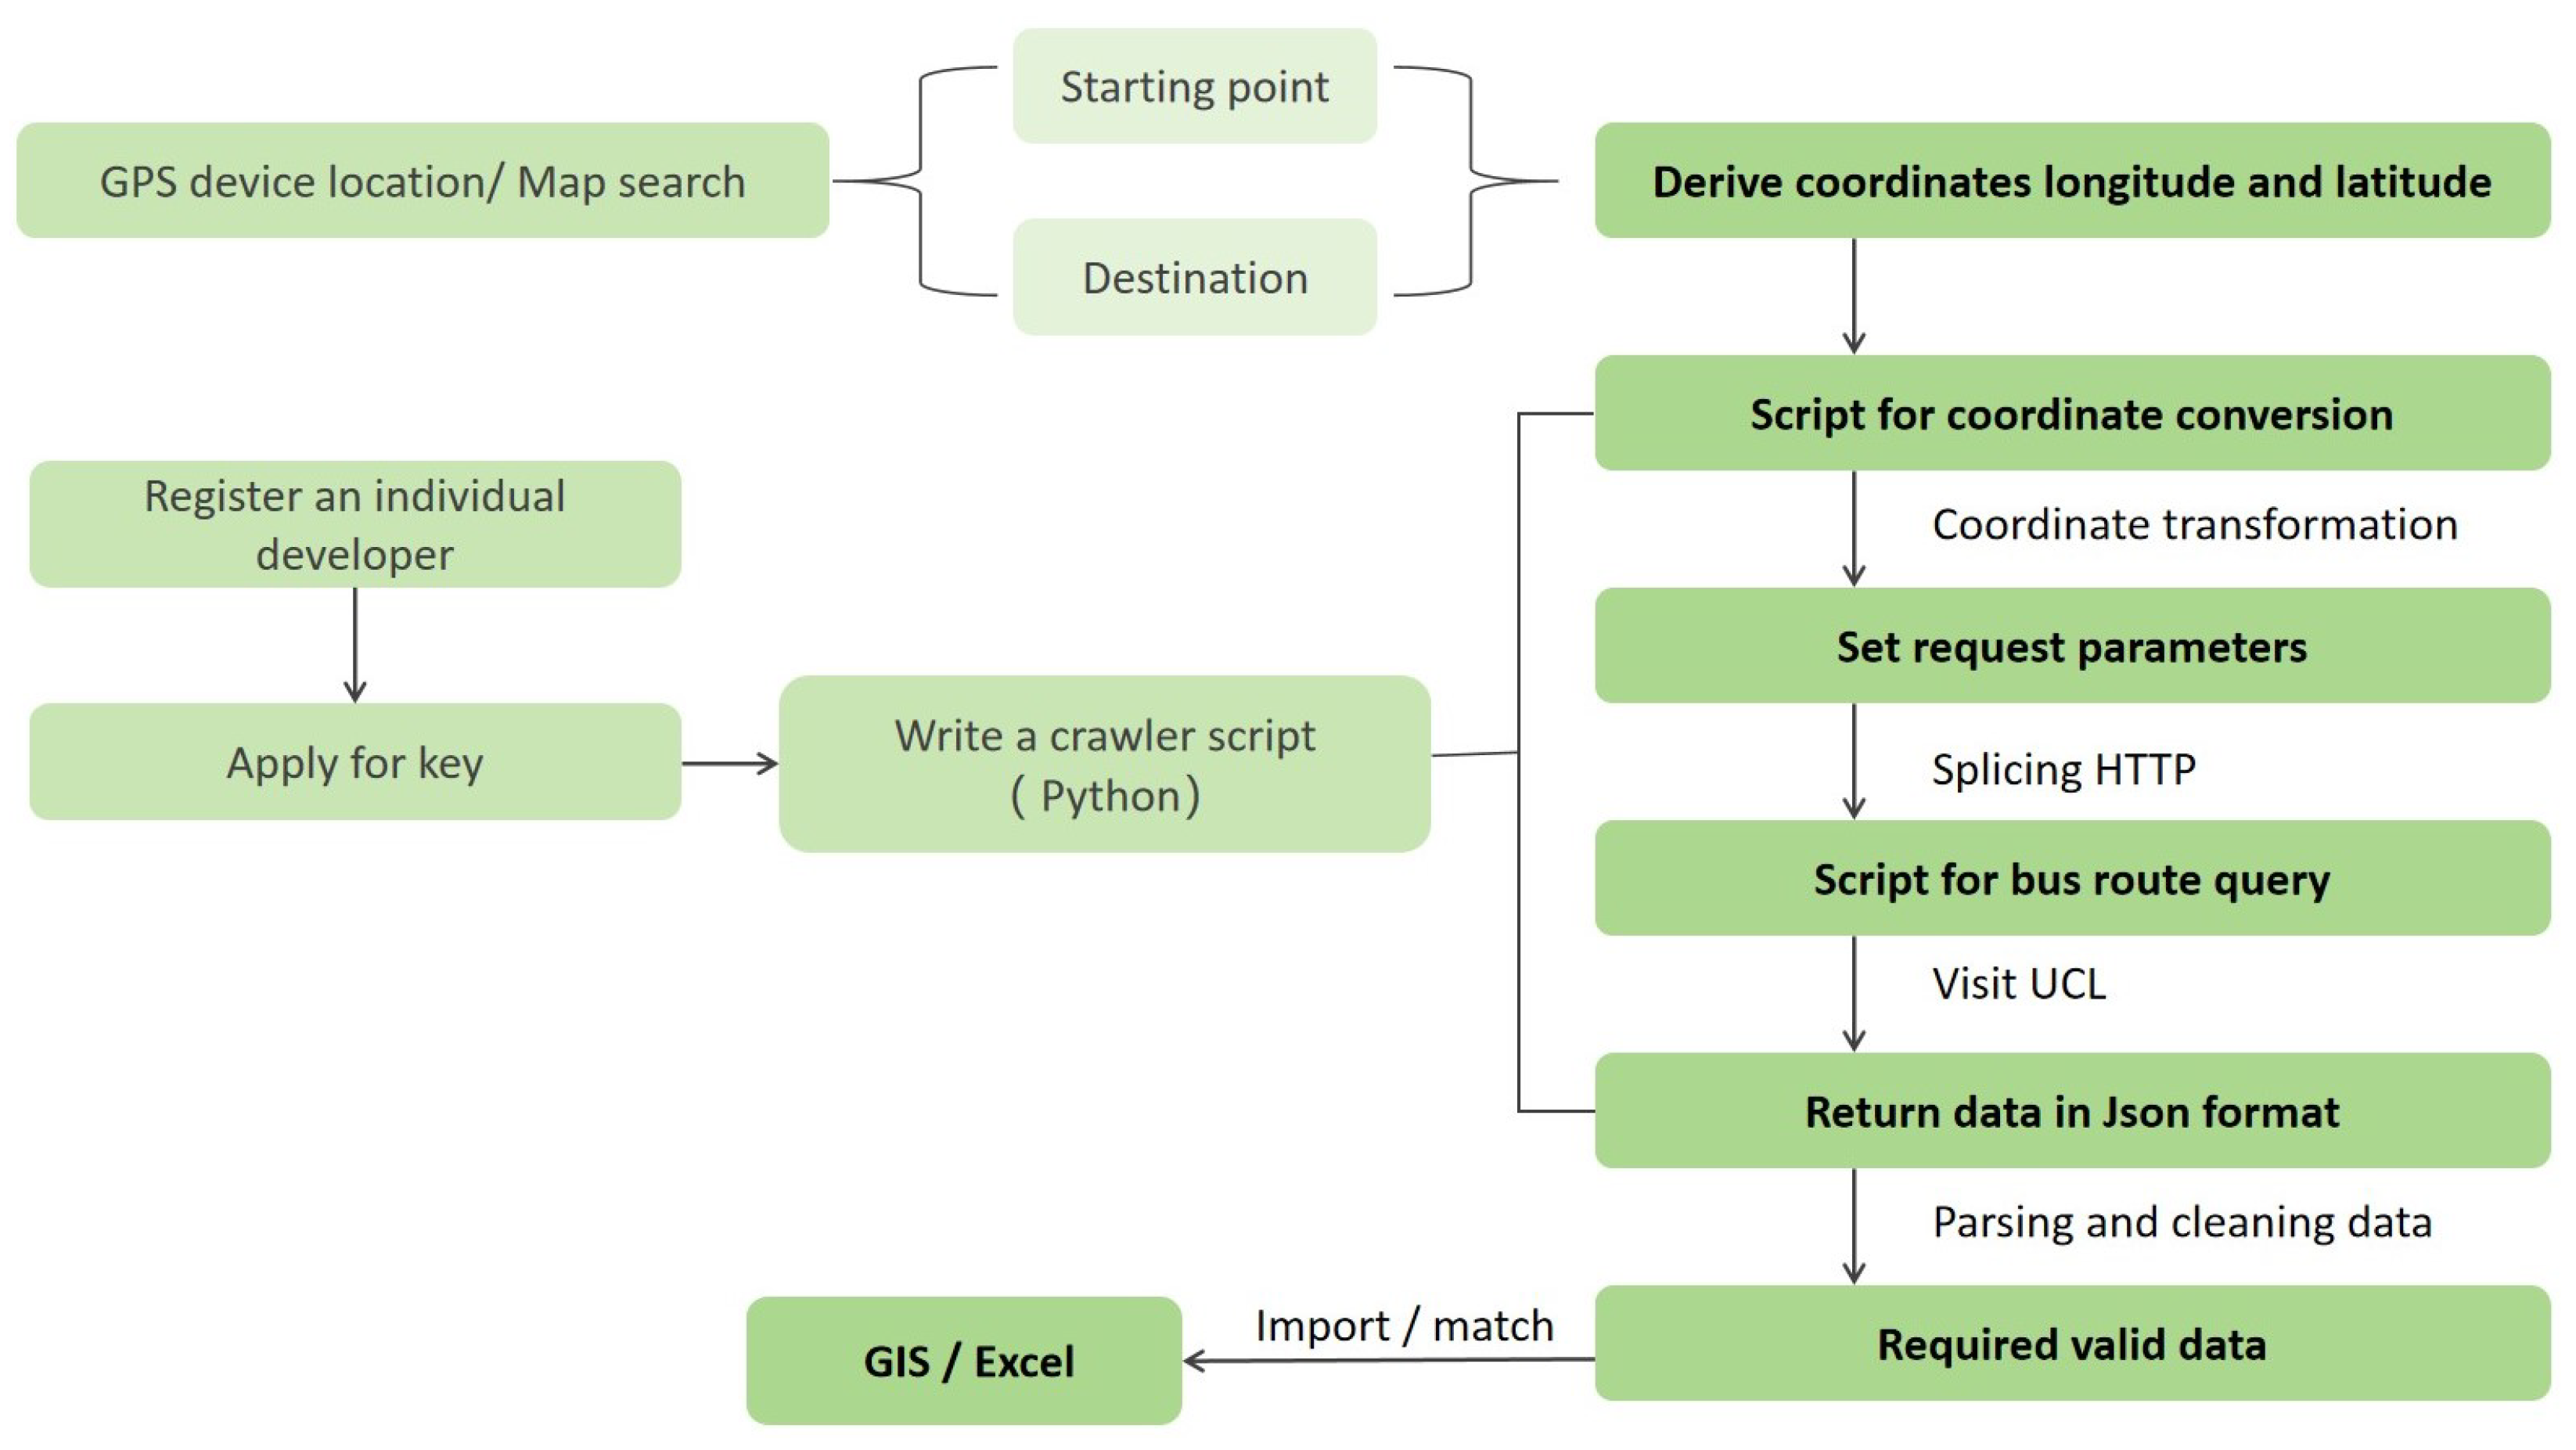
2.6.2. Application of API Open Interface

In this study, we employed the path planning method using the API interface of an Internet map open platform for simulating public transit travel. Specifically, we selected the web service API of the Amap open platform and utilized its public transit route planning API interface. Python scripts were developed to facilitate batch querying of time and total distance information for each planned route. Subsequently, data aggregation, accessibility calculation, and analysis were conducted (Figure 14).

2.7. Selection of Evaluation Indicators

In accessibility studies using network analysis, the service area ratio is commonly chosen as the primary evaluation indicator. However, the service area ratio overlooks the population distribution variations within residential areas. Therefore, the service population ratio is introduced as the main evaluation indicator for accessibility, which better reflects the level of service provided by park green spaces to individuals. Additionally, some residential areas only allow access through specific entrances and exits. The elderly and disabled individuals mostly travel to park green spaces on foot, and they tend to choose entrances and exits that are closer to the green spaces. To enhance the accuracy of the analysis results, this study incorporates the consideration of residential area entrances and exits. The improved calculation method for accessibility is as follows:
P i j = A j N j E i j ,
where P i j represents the number of people served by the green space i in the residential area j, A j represents the total population of the residential area j, N j is the number of entrances and exits for the residential area j, E i j represents the number of entrances and exits for the green space i that cover the residential area j.
G i = P i j H ,
where P i j represents the number of people served by the green space i in the residential area j, G i represents the ratio of the total population of all residential areas to the total population H within the study area, which is the service population ratio.

3. Results

3.1. Accessibility of Park Green Space for the Elderly

3.1.1. Type I Green Space

For Type I green spaces, older adults primarily rely on walking to reach them within a 10-min travel time. However, the service areas of Type I green spaces within a 10-min walk are scattered, serving only a limited number of older adults in close proximity to the green spaces, resulting in poor accessibility. When the walking time is extended to 20 min, the accessibility of Type I green spaces significantly improves (Table 6). The service areas transition from scattered to clustered, primarily located in the north, south, and west of Jianye District (Figure 15). A 30-min walk is the maximum time limit for older adults to reach parks, as they are less willing to travel to green spaces that are more than 30 min away, considering the return journey to their homes. Within a 30-min walk, accessibility across the district increased by 50% compared to a 20-min walk.
Compared to walking, cycling shows a significant improvement in accessibility to green spaces. Furthermore, when comparing a 10-min cycling time to a 20-min cycling time, there is a remarkable enhancement in green space accessibility (Figure 16). The population served ratio increased from 48.26% to 91.66%, with only a few remaining blind spots in Nanyuan Street. Overall, the coverage achieved almost its full extent (Table 7).
In the study of public transportation accessibility, a total of 32,650 valid planning paths were obtained using the bus path query crawler script. The shortest travel time recorded was 15.1 min, and there were no planning paths that took less than 10 min. This indicates that for journeys under 10 min, it is more efficient to travel by bike or on foot. Subsequently, a batch program written in Python was used to filter out the data of all planned paths that took less than 20 min. After organizing and analyzing the data, the service area ratio and service population ratio of buses within 20 min were calculated (Table 8). In the case of a 20-min bus ride, accessibility to green spaces does not improve compared to walking; in fact, both decrease to some extent (Figure 17). This suggests that taking transit does not enhance green space accessibility for a 20-min trip due to various non-riding time-consuming factors. However, for a 30-min trip using public transit, the population ratio served by green spaces in the region increased from 29.50% to 87.79%, resulting in nearly twofold increased accessibility compared to 20 min. Thus, it can be concluded that transit achieves higher travel efficiency for longer trips, while walking or cycling is more convenient for shorter trips.
In the five streets, there are two types of variations in service population within 30 min. The first type exhibits a pattern of initially high and then low growth rates. Streets that exhibit this characteristic primarily rely on green spaces within the street for service provision, with a greater distance from green spaces outside the street. As a result, the accessibility to green spaces within a short period of time shows a high growth rate. However, after 20 min, there is a bottleneck in the supply of green spaces within the street, leading to a slowdown in the growth rate. The second type exhibits a pattern of initially low and then high growth rates. Streets that exhibit this characteristic have both internal green spaces and green spaces from other streets providing services after 20 min. Therefore, the accessibility after 20 min improves. From this, we can conclude that when designing the layout of green spaces, it is advisable to consider placing one type of green space at the boundaries of the streets in order to enhance the efficiency of service provision by green spaces.

3.1.2. Type II Green Space

The maximum acceptable walking travel time for elderly individuals to access Type II green spaces is 15 min. Type II green spaces typically serve the surrounding residential areas; thus, only walking accessibility analysis is conducted. Overall, the accessibility within a 10-min walking distance is good, and there is some improvement in accessibility within the range of 10–15 min (Figure 18).

3.1.3. Comprehensive Analysis for the Elderly

By overlaying the service areas of Type I and Type II green spaces that can be reached within a 10-min walk in ArcGIS, the optimal service range of all parks and green spaces for the elderly in Jianye District can be obtained (Figure 19). About 70% of elderly individuals can walk to green spaces within 10 min to engage in activities, but there is a significant overlap between the service areas of Type I and Type II green spaces, highlighting the issue of uneven distribution of green space services in Jianye District.
By overlaying the service areas of Type I green spaces that can be reached within a 30-min walk and Type II green spaces that can be reached within a 15-min walk, the maximum service range of all parks and green spaces for the elderly in Jianye District can be obtained (Figure 20). The data show that 90% of elderly individuals can reach parks and green spaces within an acceptable time range, and the service areas of parks and green spaces basically cover the entire study area, with good accessibility. The only green space service blind spots are in Nanyuan and Shazhou streets.

3.2. Accessibility of Park Green Space for the Disabled

3.2.1. Type I Green Space

The study calculated the accessibility of parks and green spaces for visually impaired individuals based on the network dataset constructed using tactile paving, and the accessibility for physically disabled individuals based on the network dataset constructed using standard pedestrian pathways. The data show that within a high-frequency travel range of 500 m, only about 13% of visually impaired individuals and 12% of physically disabled individuals can reach Type I green spaces (Table 9). Within a maximum travel range of 1 km, except for the Mochouhu Street, the service coverage for visually impaired individuals is lower than that for physically disabled individuals due to the lack of blind path, indicating a significant impact of loss of blind path on accessibility (Table 10).
The analysis indicates that disabled individuals in Jianye District have difficulty accessing Type I green spaces (Figure 21 and Figure 22). Most disabled individuals find it challenging to reach Type I green spaces by walking alone. Public transportation and motor vehicles face more obstacles and have low utilization rates.

3.2.2. Type II Green Space

Compared to Type I green spaces, Type II green spaces are important places for daily exercise and leisure for disabled individuals. Research results indicate that disabled individuals prefer to have Type II green spaces within a 500 m walking distance. However, the analysis shows that Type II green spaces can only serve approximately 60% of disabled individuals in the entire district (Table 11, Figure 23 and Figure 24).

3.2.3. Comprehensive Analysis for the Disabled

A 500 m distance is considered the optimal service range for parks and green spaces for disabled individuals. However, the analysis results indicate that only about 65% of disabled individuals can reach the green spaces within this travel distance (Table 12). A 1 km distance represents the maximum service range for parks and green spaces for disabled individuals, and over 20% of disabled individuals are unable to access any green spaces for activities within this range (Table 13). Considering the various urban transportation barriers and artificial obstacles that exist in reality, the accessibility of green spaces for disabled individuals is not optimistic. Most disabled individuals can only access Type II green spaces, which are generally smaller in scale and lack adequate accessibility facilities, hindering their ability to engage in activities and further reducing their accessibility to green spaces.

3.3. Optimization Strategy for Improving the Accessibility of Park Green Space in Jianyu District

3.3.1. Traffic

Strict adherence to accessibility design standards and the establishment of a comprehensive pedestrian network will significantly improve the accessibility of parks and green spaces for the elderly and disabled individuals. New pedestrian walkways should be constructed in key sections, and segregated road systems should be established to enhance pedestrian efficiency and safety. Overpasses or underground passages should be used at multi-lane intersections, along with ramps, elevators, and escalators, to facilitate the movement of the elderly and disabled individuals.
Since the elderly and disabled individuals rely on public transportation for long-distance travel, optimizing the public transportation system plays a crucial role in improving the accessibility of parks and green spaces. In the short term, bus routes can be optimized, and more bus stops can be set up near green spaces. In the long run, the integration between the subway system and various parks should be strengthened to improve service efficiency.
Lastly, road management needs to be strengthened. Measures should be taken to reduce common obstacles such as illegal parking, street vendors, newsstands, and construction fences that hinder the mobility of the elderly and disabled individuals. Repairing and maintaining tactile paving on sidewalks should be prioritized to enhance the confidence of vulnerable groups in their travel.

3.3.2. Urban Green Space

In the study, it was found that compared to other point and area green spaces, linear green spaces have multiple entrances and exits, which are of great significance in improving accessibility. Linear green spaces can be connected and extended, with the addition of facilities and the widening of roads, to create a continuous green structure. Furthermore, according to the overall urban planning, point and area green spaces should be reasonably distributed in green service blind spots. Unused land can be transformed into urban comprehensive parks or specialized parks, supplementing riverbanks and street green belts, to address the issues of uneven distribution and lack of diversity in green spaces.
For existing green spaces, particular attention should be given to the renewal and improvement of accessibility and age-friendly design. Consideration should be given to the usage habits and safety of these two groups in terms of details, materials, and scale, in order to enhance the service level of green spaces and fully utilize the accessibility advantages of existing green spaces.

3.3.3. Accessibility Improvement Optimization

Based on the resistance parameter and considering the analysis of travel habits of older adults and persons with disabilities conducted in the previous section, we have set the goal of optimizing the urban green space accessibility to “a 10-min walk for the elderly and a 500-m walk for persons with disabilities to reach city parks and green spaces”. These travel distances are comfortable and reasonable for them, as determined by the resistance parameters derived from their travel habits analysis.
Furthermore, taking into account the actual conditions in most first-tier cities, we believe that optimizing the spatial pattern of urban green spaces to meet this standard will not pose significant challenges. Therefore, achieving this objective would enable the government to enhance the accessibility of parks and green spaces for older adults and persons with disabilities at a relatively low cost.
According to the optimization strategies mentioned above, new linear green spaces are added along the riverside, while point and area green spaces are arranged in service blind spots. After optimizing all the pedestrian road networks and park green spaces in Jianye District, the accessibility of the park green spaces is recalculated and verified. The results show that the measures implemented according to the strategies can achieve the optimization goals (Table 14), and the balance of green space distribution has also been improved (Figure 25 and Figure 26).

4. Discussion

Previous studies [11,36,37,38,39,40,41] on the accessibility of green spaces based on GIS network analysis have largely overlooked the needs and travel characteristic differences of different populations. This study focuses on the activity preferences of the elderly and disabled, reclassifying park green spaces, collecting geographic information data, extracting resistance values, and setting evaluation criteria to obtain accessibility analysis results that better conform to specific populations. The analysis method in this paper makes the accessibility analysis model more in line with the travel characteristics of the study population, and it is significantly innovative compared to other network analysis research that focuses on all urban road networks [42,43,44,45,46].
Meanwhile, we carefully considered the choice of analysis methods and applied different methods for different modes of transportation. In previous studies on transportation accessibility [47,48,49], network analysis has been commonly used as the tool for analyzing bus accessibility. However, bus speeds are greatly influenced by road conditions, real-time traffic, and bus stops. Bus routes are fixed and cannot be flexibly changed. In most cases, GIS network analysis is more suitable for simulating pedestrian and cycling analysis, where the movement speed and mode of transportation are relatively fixed, allowing for the selection of the shortest route. Therefore, we believe that GIS network analysis is not suitable for bus travel analysis.
In this study, we innovatively developed Python scripts for data collection and integration, providing practical references for automated and intelligent planning and design. Compared to GIS network analysis, this method has several advantages in simulating bus travel. Firstly, the scripts can independently complete the collection and updating of a large amount of bus network and stop data, providing more accurate path information. Secondly, internet maps can incorporate real-time traffic flow factors and calculate routes that better align with people’s usage habits. Additionally, the scripts can query the cost time, total distance, and other information for each planned route in batches, and perform statistical analysis and accessibility calculations based on the returned data. In summary, this method allows for efficient data acquisition and precise analysis, significantly improving the reliability of the work and reducing the workload for researchers.
Furthermore, we integrated survey data and previous research data to summarize the travel preferences of the elderly and disabled population, and quantified them into numerical indicators. Most elderly people prefer to go to green spaces for activities frequently. Most are accustomed to walking, but for slightly farther destinations, they also use cycling and public transportation. The disabled, limited by their mobility, do not travel frequently, mostly only walking, with a small activity range, generally with 500 m as the high-frequency activity area, and 1 km as the maximum distance for most disabled people to travel to green spaces. This analysis result can serve as a basis for the calculation of park green space accessibility for the elderly and disabled in other cities.
There are several shortcomings in this study that need to be more accurately studied in future work to better reflect the actual situation:
Firstly, the method of collecting data through questionnaire surveys has a large recall bias and subjective evaluation, making it impossible for such research to establish a more comprehensive understanding of the elderly’s needs and obstacles to urban green spaces.
Secondly, this study only conducted surveys on the effective passage width and blind road in the study area. However, there are many other factors that affect the travel of the elderly and disabled, especially human-made obstacles and management deficiencies, such as vendors and vehicles occupying the road, road facility damage, etc. These factors have a large impact on walking but are difficult to accurately quantify and study. Although the research focus covers factors such as green space layout, traffic roads, and population distribution, it does not consider the attraction and facility quality differences between similar green spaces. In subsequent research, introducing these factors will help obtain more accurate accessibility analysis results.
Thirdly, Due to the impact of the pandemic, the survey data may differ from normal periods. In addition, the behavior activities of the elderly and disabled are also affected by factors such as season, weather, and temperature. Therefore, there is still room for further improvement in the survey of the target population.
Fourthly, Due to some limitations of GIS software, the construction of the accessibility model is somewhat idealized and cannot simulate all factors in reality.

5. Conclusions

This article focuses on vulnerable groups in society—the elderly and people with disabilities. By using GIS and Python for accessibility analysis, different road network datasets are constructed for different modes of transportation. This modeling method can make the analysis more tailored to the target population.
Different countries and cities have different concepts and evaluation methods for green space accessibility, as well as varying population sizes and levels of development. Based on this study, we propose the following optimization suggestions for green space planning in aging cities: in terms of transportation, attention should be paid to improving the accessibility of sidewalks, optimizing public transportation, strengthening road management and constructing slow traffic systems to increase individuals’ willingness to travel and to reduce travel risks. Based on the overall urban planning of the city, new green spaces should be constructed to enrich the types of green spaces and create connected, wide strip green spaces, allowing the elderly to walk 10 min and people with disabilities to walk 500 m to quickly and conveniently reach urban parks and green spaces.

Author Contributions

Conceptualization, R.Z., H.W. and L.H.; methodology, R.Z. and L.H.; software, R.Z.; validation, R.Z. and L.H.; formal analysis, R.Z. and L.H.; investigation, L.H., R.Z. and H.W.; resources, R.Z.; data curation, R.Z. and L.H.; writing—original draft preparation, R.Z. and L.H.; writing—review and editing, R.Z., H.W. and L.H.; visualization, R.Z.; supervision, H.W. All authors have read and agreed to the published version of the manuscript.

Funding

This research was funded by the Industry-University-Research Cooperation Project of Jiangsu Province, China (No. BY2018004). We acknowledge the project for its financial support for the investigation and research on green spaces in Jianye District, Nanjing.

Data Availability Statement

The data presented in this study are available on request from the corresponding author.

Conflicts of Interest

The authors declare no conflict of interest. The funders had no role in the design of the study; in the collection, analyses, or interpretation of data; in the writing of the manuscript; or in the decision to publish the results.

Abbreviations

The following abbreviations are used in this manuscript:
VIIVisually Impaired Individuals
IPDIndividuals with Physical Disabilities

References

  1. Esther, Y.H.K.; Winky, H.K.O.; Edwin, C.H.W. Elderly satisfaction with planning and design of public parks in high density old districts: An ordered logit model. Landsc. Urban Plan. 2017, 165, 39–53. [Google Scholar] [CrossRef]
  2. Hansen, W.G. How Accessibility Shapes Land Use. J. Am. Inst. Planners 1959, 25, 73–76. [Google Scholar] [CrossRef]
  3. Al-Rashid, M.A.; Harumain, Y.A.S.; Goh, H.C.; Ahmed, Z. Psychosocial Factors of Public Transport Users and Social Inclusion Implications among Older Women in Pakistan. J. Urban Plan. Dev. 2021, 147, 4021046. [Google Scholar] [CrossRef]
  4. Talen, E. The Social Equity of Urban Service Distribution: An Exploration of Park Access in Pueblo, Colorado, and Macon, Georgia. Urban Geogr. 1997, 18, 521–541. [Google Scholar] [CrossRef]
  5. Shaaban, K.; Siam, A. Review of Factors Affecting Public Transportation Ridership. In Proceedings of the 2022 Intermountain Engineering, Technology And Computing (IETC), Orem, UT, USA, 14–15 May 2022. [Google Scholar] [CrossRef]
  6. Wang, D.; Brown, G.; Liu, Y. The physical and non-physical factors that influence perceived access to urban parks. Landsc. Urban Plan. 2015, 133, 53–66. [Google Scholar] [CrossRef]
  7. Yang, D.; Goerge, R.; Mullner, R. Comparing GIS-Based Methods of Measuring Spatial Accessibility to Health Services. J. Med. Syst. 2006, 30, 23–32. [Google Scholar] [CrossRef] [PubMed]
  8. Wu, T.; Li, M.; Zhou, Y. Measuring Metro Accessibility: An Exploratory Study of Wuhan Based on Multi-Source Urban Data. Isprs Int. J. Geo Inf. 2023, 12, 18. [Google Scholar] [CrossRef]
  9. Chen, M.; Feng, X.; Zhang, T.; Zhang, Y.; Xu, B.; Zhang, C. Research on Accessibility Measurement Model of Collection and Distribution System for Port Based on Generalized Cost Impedance Function. In Proceedings of the International Conference on Intelligent Traffic Systems and Smart City (ITSSC 2021), Zhengzhou, China, 19–21 November 2021; Tan, G., Cen, F., Eds.; Proceedings of SPIE. SPIE: Cergy, France; Global Science Research Association: Pune, India; Hohai University: Nanjing, China, 2022; Volume 12165. [Google Scholar] [CrossRef]
  10. Ma, L.; Wang, H.; Liu, B. Research on Application of Gradient Analysis to City Green Space Accessibility-Taking garden green space of Taian central city for instance. In IOP Conference Series-Earth and Environmental Science, Proceedings of the 5th International Conference on Advances in Energy, Environment and Chemical Engineering (AEECE), Shanghai, China, 16–18 August 2019; China Agricultural University: Beijing, China; College of Bioscience and Resource Environment: Beijing, China, 2019; Volume 358. [Google Scholar] [CrossRef]
  11. Kong, F.; Yin, H.; Nakagoshi, N. Using GIS and landscape metrics in the hedonic price modeling of the amenity value of urban green space: A case study in Jinan City, China. Landsc. Urban Plan. 2007, 79, 240–252. [Google Scholar] [CrossRef]
  12. Wu, H.; Liu, L.; Yu, Y.; Peng, Z. Evaluation and Planning of Urban Green Space Distribution Based on Mobile Phone Data and Two-Step Floating Catchment Area Method. Sustainability 2018, 10, 214. [Google Scholar] [CrossRef]
  13. Wang, H.; Wei, X.; Ao, W. Assessing Park Accessibility Based on a Dynamic Huff Two-Step Floating Catchment Area Method and Map Service API. ISPRS Int. J. Geo Inf. 2022, 11, 394. [Google Scholar] [CrossRef]
  14. Yang, Q.; Zhan, H.; Huang, J. Urban green service equity in Xiamen based on network analysis and concentration degree of resources. Open Geosci. 2022, 14, 304–315. [Google Scholar] [CrossRef]
  15. Jalkanen, J.; Fabritius, H.; Vierikko, K.; Moilanen, A.; Toivonen, T. Analyzing fair access to urban green areas using multimodal accessibility measures and spatial prioritization. Appl. Geogr. 2020, 124, 102320. [Google Scholar] [CrossRef]
  16. Khaza, M.K.B.; Rahman, M.M.; Harun, F.; Roy, T.K. Accessibility and Service Quality of Public Parks in Khulna City. J. Urban Plan. Dev. 2020, 146, 04020024. [Google Scholar] [CrossRef]
  17. Rakhmatullina, I.; Rakhmatullin, Z.; Zaitsev, G.; Davydychev, A.; Gilmanova, G.; Komissarov, M. The Green Space Availability in Ufa City Metropolis. Forests 2023, 14, 1297. [Google Scholar] [CrossRef]
  18. Farkas, J.Z.; Hoyk, E.; de Morais, M.B.; Csomos, G. A systematic review of urban green space research over the last 30 years: A bibliometric analysis. Heliyon 2023, 9, e13406. [Google Scholar] [CrossRef]
  19. Wen, Z.; Zhang, S.; Yang, Y.; Zheng, X.; Song, Z.; Zhou, Y.; Hao, J. How does enclosed private residential green space impact accessibility equity in urban regions? A case study in Shenzhen, China. Urban For. Urban Green. 2023, 85, 127968. [Google Scholar] [CrossRef]
  20. Williams, T.G.; Logan, T.M.; Zuo, C.T.; Liberman, K.D.; Guikema, S.D. Parks and safety: A comparative study of green space access and inequity in five US cities. Landsc. Urban Plan. 2020, 201, 103841. [Google Scholar] [CrossRef]
  21. Ferguson, M.; Roberts, H.E.; McEachan, R.R.C.; Dallimer, M. Contrasting distributions of urban green infrastructure across social and ethno-racial groups. Landsc. Urban Plan. 2018, 175, 136–148. [Google Scholar] [CrossRef]
  22. Fernandes, A.; Krog, N.H.; McEachan, R.; Nieuwenhuijsen, M.; Julvez, J.; Márquez, S.; de Castro, M.; Urquiza, J.; Heude, B.; Vafeiadi, M.; et al. Availability, accessibility, and use of green spaces and cognitive development in primary school children. Environ. Pollut. 2023, 334, 122143. [Google Scholar] [CrossRef]
  23. Gao, S.; Bosman, C.; Dupre, K. Understanding the Well-Being of Older Chinese Immigrants in Relation to Green Spaces: A Gold Coast Study (Australia). Front. Psychol. 2020, 11, 551213. [Google Scholar] [CrossRef]
  24. Di, X.; Wang, L.; Dai, X.; Yang, L. Assessing the Accessibility of Home-Based Healthcare Services for the Elderly: A Case from Shaanxi Province, China. Int. J. Environ. Res. Public Health 2020, 17, 7168. [Google Scholar] [CrossRef] [PubMed]
  25. Sharifi, F.; Nygaard, A.; Stone, W.M.; Levin, I. Accessing green space in Melbourne: Measuring inequity and household mobility. Landsc. Urban Plan. 2021, 207, 104004. [Google Scholar] [CrossRef]
  26. Coombes, E.; Jones, A.P.; Hillsdon, M. The relationship of physical activity and overweight to objectively measured green space accessibility and use. Soc. Sci. Med. 2010, 70, 816–822. [Google Scholar] [CrossRef] [PubMed]
  27. Zhang, Y.; Mavoa, S.; Zhao, J.; Raphael, D.; Smith, M. The Association between Green Space and Adolescents’ Mental Well-Being: A Systematic Review. Int. J. Environ. Res. Public Health 2020, 17, 6640. [Google Scholar] [CrossRef] [PubMed]
  28. Tamosiunas, A.; Grazuleviciene, R.; Luksiene, D.; Dedele, A.; Reklaitiene, R.; Baceviciene, M.; Vencloviene, J.; Bernotiene, G.; Radisauskas, R.; Malinauskiene, V.; et al. Accessibility and use of urban green spaces, and cardiovascular health: Findings from a Kaunas cohort study. Environ. Health 2014, 13, 20. [Google Scholar] [CrossRef] [PubMed]
  29. Shoari, N.; Ezzati, M.; Baumgartner, J.; Malacarne, D.; Fecht, D. Accessibility and allocation of public parks and gardens in England and Wales: A COVID-19 social distancing perspective. PLoS ONE 2020, 15, e0241102. [Google Scholar] [CrossRef]
  30. La Rosa, D.; Takatori, C.; Shimizu, H.; Privitera, R. A planning framework to evaluate demands and preferences by different social groups for accessibility to urban greenspaces. Sustain. Cities Soc. 2018, 36, 346–362. [Google Scholar] [CrossRef]
  31. Stigsdotter, U.K.; Corazon, S.S.; Ekholm, O. A nationwide Danish survey on the use of green spaces by people with mobility disabilities. Scand. J. Public Health 2018, 46, 597–605. [Google Scholar] [CrossRef]
  32. Wen, C.; Albert, C.; Von Haaren, C. Equality in access to urban green spaces: A case study in Hannover, Germany, with a focus on the elderly population. Urban For. Urban Green. 2020, 55, 126820. [Google Scholar] [CrossRef]
  33. Wen, C.; Albert, C.; Von Haaren, C. The elderly in green spaces: Exploring requirements and preferences concerning nature-based recreation. Sustain. Cities Soc. 2018, 38, 582–593. [Google Scholar] [CrossRef]
  34. Subramanian, D.; Jana, A. Assessing urban recreational open spaces for the elderly: A case of three Indian cities. Urban For. Urban Green. 2018, 35, 115–128. [Google Scholar] [CrossRef]
  35. Lee, R.; Mason, A. Fertility, Human Capital, and Economic Growth over the Demographic Transition. Eur. J. Popul. 2021, 26, 159–182. [Google Scholar] [CrossRef] [PubMed]
  36. Halecki, W.; Stachura, T.; Fudala, W.; Stec, A.; Kubon, S. Assessment and planning of green spaces in urban parks: A review. Sustain. Cities Soc. 2023, 88, 104280. [Google Scholar] [CrossRef]
  37. Xie, K.; Xu, H.; Wu, J. The Accessibility of Nanjing Urban Park Based on Gis. Open House International 2019, 44, 112–117. [Google Scholar] [CrossRef]
  38. Cetin, M. Using GIS analysis to assess urban green space in terms of accessibility: Case study in Kutahya. Int. J. Sustain. Dev. World Ecol. 2015, 22, 420–424. [Google Scholar] [CrossRef]
  39. Comber, A.; Brunsdon, C.; Green, E. Using a GIS-based network analysis to determine urban greenspace accessibility for different ethnic and religious groups. Landsc. Urban Plan. 2008, 86, 103–114. [Google Scholar] [CrossRef]
  40. Senol, F.; Kaya, I.A. GIS-based mappings of park accessibility at multiple spatial scales: A research framework with the case of Izmir (Turkey). Local Environ. 2021, 26, 1379–1397. [Google Scholar] [CrossRef]
  41. Huang, B.X.; Chiou, S.C.; Li, W.Y. Accessibility and Street Network Characteristics of Urban Public Facility Spaces: Equity Research on Parks in Fuzhou City Based on GIS and Space Syntax Model. Sustainability 2020, 12, 3618. [Google Scholar] [CrossRef]
  42. Liang, H.; Zhang, Q. Assessing the public transport service to urban parks on the basis of spatial accessibility for citizens in the compact megacity of Shanghai, China. Urban Stud. 2018, 55, 1983–1999. [Google Scholar] [CrossRef]
  43. Li, J.; Dali, M.; Nordin, N.A. Connectedness among Urban Parks from the User’s Perspective: A Systematic Literature Review. Int. J. Environ. Res. Public Health 2023, 20, 3652. [Google Scholar] [CrossRef]
  44. Stoia, N.L.; Nita, M.R.; Popa, A.M.; Ioja, I.C. The green walk-An analysis for evaluating the accessibility of urban green spaces. Urban For. Urban Green. 2022, 75, 127685. [Google Scholar] [CrossRef]
  45. Wu, J.; Wang, B.; Ta, N.; Zhou, K.; Chai, Y. Does street greenery always promote active travel? Evidence from Beijing. Urban For. Urban Green. 2020, 56, 127685. [Google Scholar] [CrossRef]
  46. Chen, X.J. Review of the Transit Accessibility Concept: A Case Study of Richmond, Virginia. Sustainability 2018, 10, 4857. [Google Scholar] [CrossRef]
  47. Porta, S.; Crucitti, P.; Latora, V. The network analysis of urban streets: A dual approach. Phys. Stat. Mech. Its Appl. 2006, 369, 853–866. [Google Scholar] [CrossRef]
  48. Charreire, H.; Casey, R.; Salze, P.; Simon, C.; Oppert, J.M. Measuring the food environment using geographical information systems: A methodological review. Public Health Nutr. 2010, 13, 1773–1785. [Google Scholar] [CrossRef]
  49. Arvidsson, B.; Johansson, J.; Guldaker, N. Critical infrastructure, geographical information science and risk governance: A systematic cross-field review. Reliab. Eng. Syst. Saf. 2021, 213, 107741. [Google Scholar] [CrossRef]
Figure 1. Research framework.
Forests 14 01801 g001
Figure 2. The location of Jianye District in Nanjing, China.
Forests 14 01801 g002
Figure 3. The behavior habits of park green space travel for the elderly.
Forests 14 01801 g003
Figure 4. The behavior habits of green space travel in parks for the disabled.
Forests 14 01801 g004
Figure 5. Distribution map of entrances and exits of park green space.
Forests 14 01801 g005
Figure 6. Residential area entrance and exit distribution map.
Forests 14 01801 g006
Figure 7. Elderly population distribution map.
Forests 14 01801 g007
Figure 8. Distribution map of Visually Impaired Individuals.
Forests 14 01801 g008
Figure 9. Distribution map of Individuals with Physical Disabilities.
Forests 14 01801 g009
Figure 10. Road network map.
Forests 14 01801 g010
Figure 11. Pavement network map.
Forests 14 01801 g011
Figure 12. Tactile paving network map.
Forests 14 01801 g012
Figure 13. Network analysis model construction steps.
Forests 14 01801 g013
Figure 14. Internet map API application route.
Forests 14 01801 g014
Figure 15. Service area of Type I green space by walking.
Forests 14 01801 g015
Figure 16. Service area of Type I green space by riding.
Forests 14 01801 g016
Figure 17. The residential area covered by the service of Type I green space when choosing public transportation.
Forests 14 01801 g017
Figure 18. Service area of Type II green space of the elderly by walking.
Forests 14 01801 g018
Figure 19. Optimumservice area of park green space for the elderly.
Forests 14 01801 g019
Figure 20. Maximum service area of park green space for the elderly.
Forests 14 01801 g020
Figure 21. Service area of Type I green space for Visually Impaired Individuals.
Forests 14 01801 g021
Figure 22. Service area of Type I green space for Individuals with Physical Disabilities.
Forests 14 01801 g022
Figure 23. Service area of Type II green space for Visually Impaired Individuals.
Forests 14 01801 g023
Figure 24. Service area of Type II green space for Individuals with Physical Disabilities.
Forests 14 01801 g024
Figure 25. Optimized green space service area can be reached by walking 10 min for the Elderly.
Forests 14 01801 g025
Figure 26. Optimized green space service area can be reached by walking 500 m for the Disabled.
Forests 14 01801 g026
Table 1. Classification of green space.
CategoryTypesScope
Type IComprehensive parkWhole region
Special park
Type IICommunity parkSurrounding residential area
Amusement park
Table 2. Relevant statistics of park green space.
Green Space ClassificationArea (Ha)Quantity
Type IComprehensive park288.316
Special park14.852
Type IICommunity park64.824
Amusement park167.1624
Total-535.1436
Table 3. Total Area of Residential Districts and Elderly/Disabled Population by Streets.
ProjectMochou Lake StreetNanyuan StreetShuangxia StreetShazhou StreetXinglong StreetThe Total Region
Total area of residential area (ha)239.11259.02180.48307.92317.331303.85
Elderly population29,67618,697537710,88111,57580,608
Disabled populationVisual2991537610788867
Physical9566142173332642697
Table 4. Data of human body scale in different walking states.
Walking StateFront Width (mm)Side Width (mm)Turning Radius (mm)
Normal state450300600
Carry a walking stick750–950600–7001200
With a blind stick1200700–9001500
In a wheelchair650–7001000–12001500
Table 5. Accessibility calculation index.
Crowd CategoryTraffic ModeMoving Speed (km/h)Maximum Travel Time (min)Maximum Travel Distance (m)
The elderlyPublic transportation-30--
Riding1020
Walking1.0230
The disabledWalking--Type I green spaceType II green space
1000500
Table 6. Evaluation index of Type I green space by walking.
Evaluation IndexMochou Lake StreetNanyuan StreetShuangxia StreetShazhou StreetXinglong StreetThe Entire Region
10-minService area28.34%0.00%8.58%6.89%11.06%10.70%
Service population29.90%0.00%5.79%4.48%11.89%14.50%
20-minService area72.26%0.55%63.82%23.80%44.97%38.76%
Service population77.53%3.46%63.77%16.09%42.96%44.36%
30-minService area92.11%13.81%94.19%44.61%80.82%62.88%
Service population91.80%22.30%91.04%37.45%86.13%66.07%
Table 7. Evaluation index of Type I green space by riding.
Evaluation IndexMochou Lake StreetNanyuan StreetShuangxia StreetShazhou StreetXinglong StreetThe Entire Region
10-minService area75.66%2.40%72.62%28.70%56.03%44.82%
Service population79.59%7.30%63.64%23.03%50.66%48.26%
20-minService area95.44%68.70%100.00%98.42%100.00%92.57%
Service population96.48%74.11%100.00%95.66%100.00%91.66%
Table 8. Evaluation index of Type I green space by bus.
Evaluation IndexMochou Lake StreetNanyuan StreetShuangxia StreetShazhou StreetXinglong StreetThe Entire Region
20-minService area ratio50.31%4.84%24.22%26.88%42.20%30.16%
Service population ratio48.82%1.18%15.33%24.11%37.35%29.50%
30-minService area ratio94.21%68.40%100.00%90.86%100.00%90.50%
Service population ratio94.37%66.39%100.00%87.58%100.00%87.79%
Table 9. Evaluation index of the Type I green space within 500 m of walking for the disabled.
Crowd TypeEvaluation IndexMochou Lake StreetNanyuan StreetShuangxia StreetShazhou StreetXinglong StreetThe Entire Region
VII *Service area ratio25.42%0.00%4.79%3.54%3.55%7.02%
Service population ratio26.73%0.00%6.57%1.54%11.06%13.32%
IPD **Service area ratio26.57%0.00%9.14%5.56%9.36%9.73%
Service population ratio27.97%0.00%6.57%2.52%12.26%11.81%
* “VII” is the abbreviation for “Visually Impaired Individuals”. ** “IPD” is the abbreviation for “Individuals with Physical Disabilities”.
Table 10. Evaluation index of the Type I green space within 1 km of walking for the disabled.
Crowd TypeEvaluation IndexMochou Lake StreetNanyuan StreetShuangxia StreetShazhou StreetXinglong StreetThe Entire Region
VII *Service area ratio70.62%0.44%39.89%12.80%32.20%29.42%
Service population ratio76.82%2.13%38.92%8.22%35.98%41.91%
IPD **Service area ratio70.33%0.44%52.48%20.64%38.86%34.58%
Service population ratio76.84%2.13%44.54%14.56%37.17%41.56%
* “VII” is the abbreviation for “Visually Impaired Individuals”. ** “IPD” is the abbreviation for “Individuals with Physical Disabilities”.
Table 11. Evaluation Index of Type II Green Space within 500 m of Walking for the Disabled.
Crowd TypeEvaluation IndexMochou Lake StreetNanyuan StreetShuangxia StreetShazhou StreetXinglong StreetThe Entire Region
VII *Service area ratio58.60%46.74%17.04%55.04%42.58%45.75%
Service population ratio70.58%62.72%16.79%55.49%46.65%58.12%
IPD **Service area ratio59.44%46.83%19.14%60.31%46.14%48.33%
Service population ratio71.22%62.72%22.23%60.83%48.16%60.57%
* “VII” is the abbreviation for “Visually Impaired Individuals”. ** “IPD” is the abbreviation for “Individuals with Physical Disabilities”.
Table 12. The optimum accessibility indexes of green space t for the disabled in Jianye District.
Crowd TypeEvaluation IndexMochou Lake StreetNanyuan StreetShuangxia StreetShazhou StreetXinglong StreetThe Entire Region
VII *Service area ratio70.94%46.74%20.71%55.19%43.52%48.79%
Service population ratio80.97%62.72%22.18%55.49%51.51%63.57%
IPD **Service area ratio72.33%46.83%27.08%60.32%50.19%52.77%
Service population ratio82.20%62.72%27.62%60.83%54.02%66.11%
* “VII” is the abbreviation for “Visually Impaired Individuals”. ** “IPD” is the abbreviation for “Individuals with Physical Disabilities”.
Table 13. The maximum accessibility indexes of green space t for the disabled in Jianye District.
Crowd TypeEvaluation IndexMochou Lake StreetNanyuan StreetShuangxia StreetShazhou StreetXinglong StreetThe Entire Region
VII *Service area ratio94.93%46.89%54.10%58.97%54.86%61.49%
Service population ratio100.00%63.59%53.55%58.63%61.03%76.55%
IPD **Service area ratio94.76%46.99%68.97%64.04%61.41%66.33%
Service population ratio100.00%63.59%64.61%62.88%62.22%78.03%
* “VII” is the abbreviation for “Visually Impaired Individuals”. ** “IPD” is the abbreviation for “Individuals with Physical Disabilities”.
Table 14. Optimized accessibility indexes of green space for the elderly and disabled in Jianye District.
Crowd TypeTravel TimeEvaluation IndexMochou Lake StreetNanyuan StreetShuangxia StreetShazhou StreetXinglong StreetThe Entire Region
The elderly10-min walkService area ratio93.20%98.04%99.98%96.52%91.91%95.57%
Service population ratio95.25%100.00%100.00%95.13%94.29%96.59%
VII *500 m walkService area ratio88.83%95.75%99.68%94.37%90.09%93.33%
Service population ratio90.53%99.14%100.00%92.70%84.53%92.93%
IPD **500 m walkService area ratio88.83%95.75%99.68%94.37%90.09%93.32%
Service population ratio90.52%99.14%100.00%92.70%84.53%93.24%
* “VII” is the abbreviation for “Visually Impaired Individuals”. ** “IPD” is the abbreviation for “Individuals with Physical Disabilities”.
Disclaimer/Publisher’s Note: The statements, opinions and data contained in all publications are solely those of the individual author(s) and contributor(s) and not of MDPI and/or the editor(s). MDPI and/or the editor(s) disclaim responsibility for any injury to people or property resulting from any ideas, methods, instructions or products referred to in the content.

