Article

Characteristics of Microbial Abundance in Rhizosphere and Non-Rhizosphere Soils of Permafrost Peatland, Northeast China

1
Key Laboratory of Wetland Ecology and Environment, Northeast Institute of Geography and Agroecology, Chinese Academy of Sciences, Changchun 130102, China
2
College of Landscape Architecture, Changchun University, Changchun 130022, China
3
University of Chinese Academy of Sciences, Beijing 100049, China
4
School of Hydraulic Engineering, Dalian University of Technology, Dalian 116024, China
*
Authors to whom correspondence should be addressed.
These authors contributed equally to this work.
Forests 2023, 14(9), 1794; https://doi.org/10.3390/f14091794
Submission received: 12 July 2023 / Revised: 24 August 2023 / Accepted: 1 September 2023 / Published: 3 September 2023
(This article belongs to the Special Issue Forest Plant, Soil, Microorganisms and Their Interactions)

Abstract

:
The rhizosphere microenvironment is crucial to plant–soil physiological processes. The differences among microbial communities in the rhizosphere and non-rhizosphere peatland topsoil (0–15 cm) and subsoil (15–30 cm) in five plant communities dominated by Carex schmidtii, Chamaedaphne calyculata, Ledum palustre, Betula fruticosa, and Vaccinium uliginosum, as well as non-rhizosphere soil in discontinuous and continuous permafrost regions, were studied. We found that the bacteria and nifH gene abundances in the C. calyculata rhizosphere soil in the discontinuous permafrost region were higher than those in continuous permafrost region, while the nirK and nifH gene abundances in the non-rhizosphere soil of the discontinuous permafrost region were lower than those in the continuous permafrost region. The ratio of bacteria to fungi decreased and that of nirK to nirS increased significantly from the discontinuous to the continuous permafrost region, indicating that permafrost degradation can change soil microbial community composition. Fungal abundance was higher in the rhizosphere than the non-rhizosphere soils, suggesting that plant roots provide a more suitable environment for fungi. Moreover, the abundances of the topsoil bacteria; the fungi; and the nirK, nirS, and nifH genes were higher than those in the subsoil because of the organic matter from plant litter as a source of nutrients. The microbial abundance in the subsoil was also more affected by nutrient availability. To sum up, the microbial abundance varied among the different types of rhizosphere and non-rhizosphere soils, and the carbon and nitrogen cycling processes mediated by soil microorganisms may be greatly altered due to permafrost degradation under climate warming.

1. Introduction

Plants play indispensable roles in maintaining the structure and functional stability of wetland ecosystems. Vegetation changes may vastly affect the quality and quantity of organic matter (OM) returned to soil and its microbes, which integrally influence the dynamics of soil organic carbon (SOC) [1,2]. The rhizosphere, an area of soil in the vicinity of 1–2 mm from plant roots, has rich microbial diversity, making it closely related to biogeochemical processes [3,4]. Root exudates are composed of carbohydrates, amino acids, fatty acids, enzymes, and other organic compounds that affect soil’s physicochemical properties, creating differences in the microbial composition and activity in the vicinity of the roots [5,6,7]. The rhizosphere’s function is an important subject of the study of plant–soil interactions in different ecosystems [8]. Previous studies have shown that microbial abundance is strongly associated with vegetation and depth in rhizosphere and non-rhizosphere soils [9,10]. Clarifying the differences in microbial composition characteristics between rhizosphere and non-rhizosphere soils is conducive to disentangling the mechanisms of the interaction effects between plants and soil microorganisms under global warming.
Microorganisms play a fundamental role in soil, regulating various biogeochemical processes, such as organic matter mineralization and nutrient cycling [11,12]. Soil microorganisms are repositories of nutrients, supplying energy for soil chemical and biological processes and those nutrients to plants [13,14,15]. The rhizosphere is critical to microorganism-driven ecological processes in terrestrial ecosystems, being characterized by high microbial activity and substrate availability [16]. Typically, the composition and abundance of soil microbial communities vary significantly depending on the plant species [17]. Plants have a certain impact on soil indigenous microbial populations, and each plant species selectively so for specific microbial communities. Plant root exudates and residue inputs are crucial factors that change bacterial community structures [18,19], directly affecting the decomposition of organic matter or indirectly affecting the soil C and N cycle through the food web [20]. Thus, the abundance and diversity of soil microorganisms is extremely important for understanding soil quality and nutrient status, and thus, their study has always been a hot topic in the contexts of both rhizosphere and non-rhizosphere soil [21,22]. Presently, only a few studies have examined the characteristics of microbial composition in rhizosphere and non-rhizosphere soil in the permafrost region [16,23].
The Great Xing’an Mountains, the only area in China with a zonal permafrost distribution, are located in the northeast of the country. However, the permafrost wetlands are gradually degrading to the north with global warming, which may lead to variations in the plant composition and thus altered microbial communities in the local permafrost peat fields [24]. The purpose of the current research was to determine the differences in microbial abundance among different types of permafrost rhizosphere and non-rhizosphere peatland soil in the Great Xing’an Mountains. Microbial abundance was estimated in two soil layers (0–15 cm, 15–30 cm). The vegetation was dominated by Carex schmidtii, Chamaedaphne calyculata, Ledum palustre, Betula fruticosa, and Vaccinium uliginosum in the discontinuous and continuous permafrost areas. The abundances of bacterial 16S rRNA; fungal ITS; and the nirK, nirS, and nifH genes were detected using a quantitative polymerase chain reaction (q-PCR). We hypothesized that (1) the topsoil microbial abundance would be higher than that of subsoil regardless of the sampling site, (2) the abundance and composition of the microorganisms would differ between rhizosphere and non-rhizosphere soil at different depths due to variations in plant root density, and (3) the soil microbial abundance in the discontinuous permafrost region would be higher than that in the continuous permafrost region due to an increased substrate availability upon permafrost degradation.

2. Materials and Methods

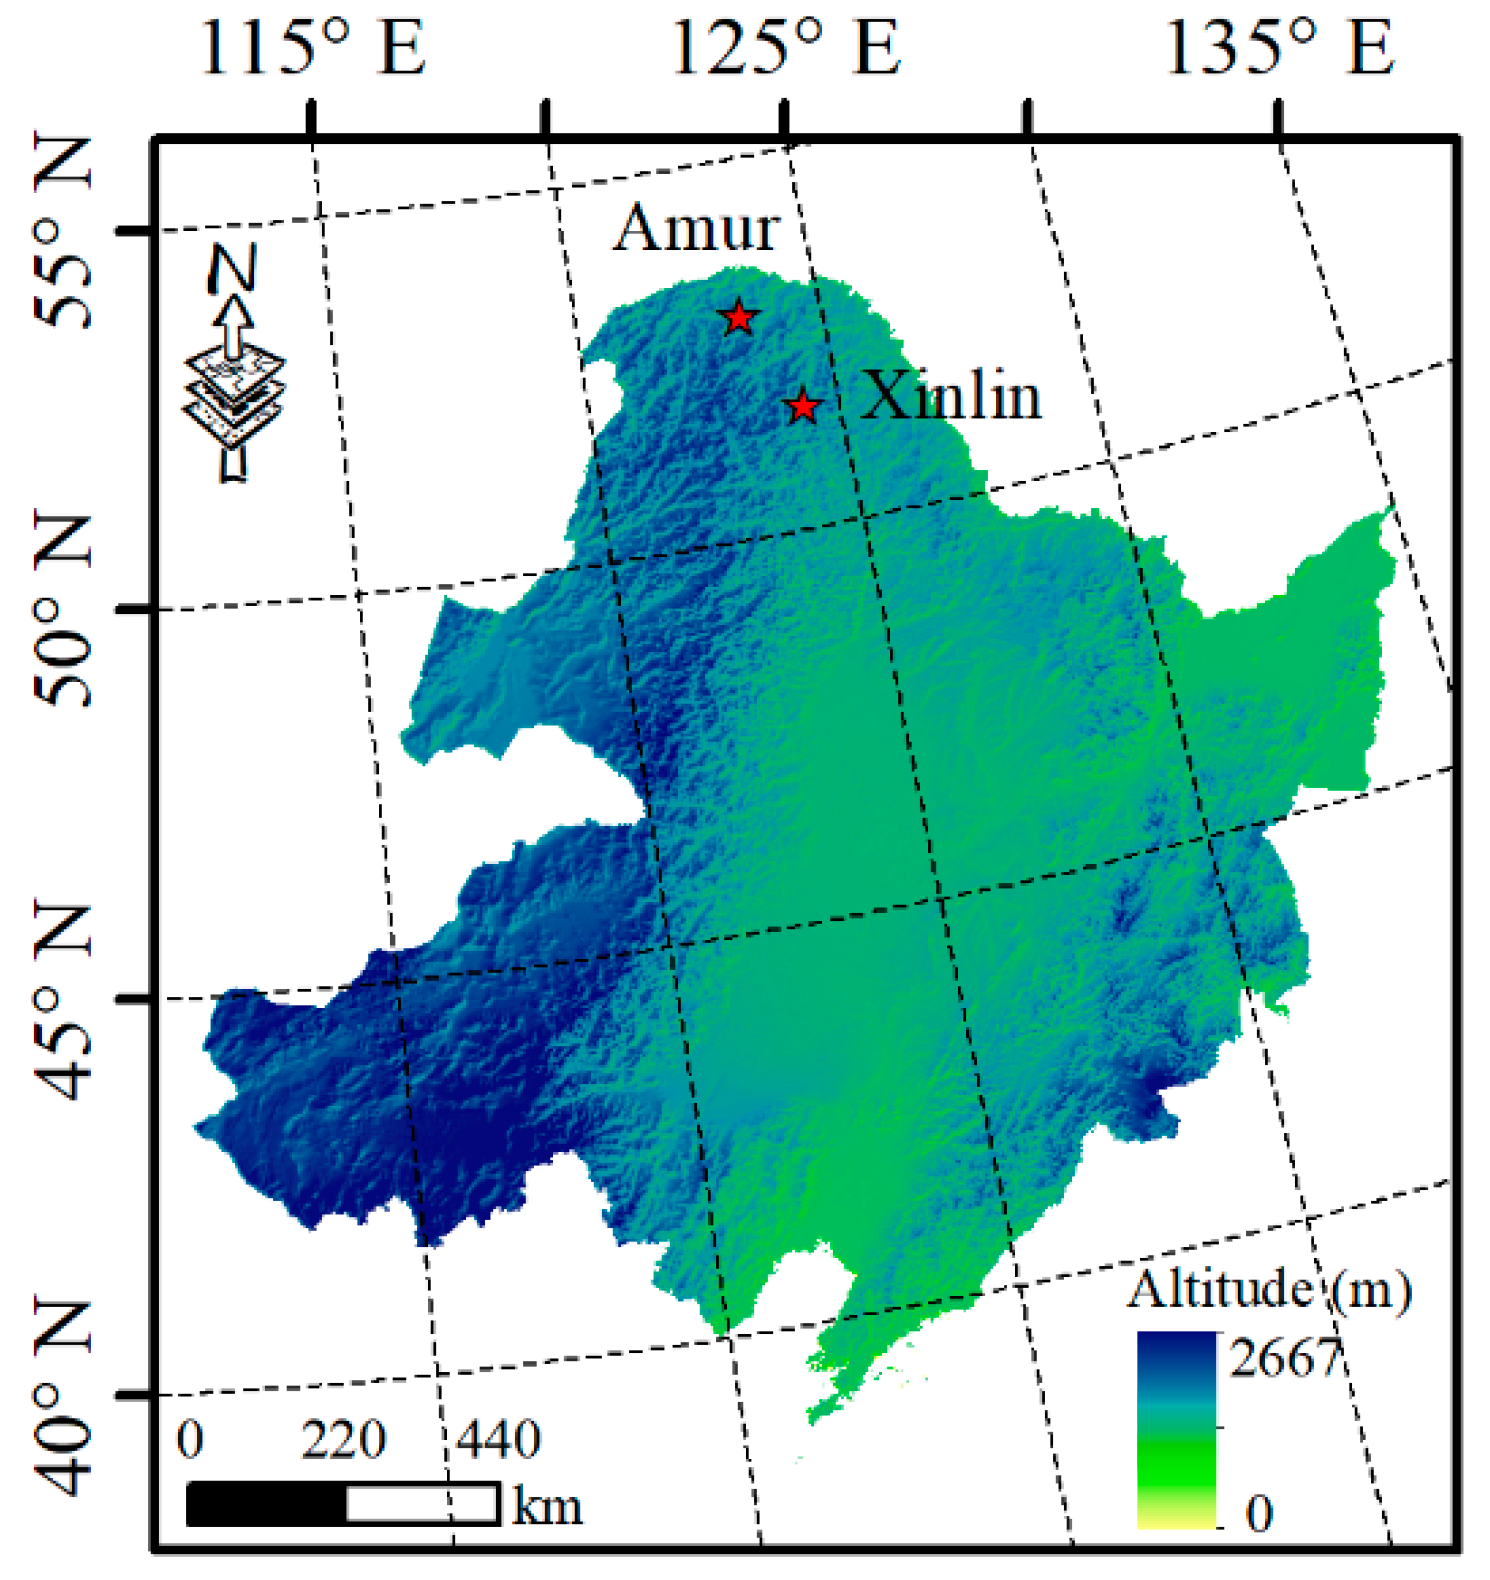
2.1. Site Description and Sampling

In August 2021, soil samples were collected in the discontinuous permafrost peatland in Xinlin (51°35′5.74″ N–51°36′18.22″ N, 124°16′41.13″ E–124°20′14.37″ E) and the continuous permafrost peatland in Amur (52°15′03″ N–53°33′15″ N, 122°38′30″ E–24°05′05″ E; Figure 1). The thawing depths were 45 cm and 55 cm, respectively. The average annual air temperature and precipitation were −3.6 °C and 498 mm, respectively, in the discontinuous permafrost region and −5 °C and 430 mm, respectively, in the continuous permafrost peatland [25].
In each permafrost region, soil samples in three replications were collected at 0–15 and 15–30 cm depths from the rhizosphere of the dominant species Carex schmidtii (Cs), Chamaedaphne calyculata (Cc), Ledum palustre (Lp), Betula fruticosa (Bf), and Vaccinium uliginosum (Vu). The soil >2 mm away from the roots was carefully collected by hand and defined as non-rhizosphere (NR) soil. The rhizosphere soil was the 0–2 mm thick layer of soil attached to the fine roots. Samples were mixed separately from each soil layer of each plant species at each sampling site, stored in plastic bags, and then refrigerated with ice bags and transported to the laboratory as soon as possible. Part of the soil sample was frozen at −80 °C for DNA extraction, and the remaining part was air-dried for further determination of SOC content, total nitrogen (TN) content, total phosphorus (TP) content, and pH.

2.2. Soil Carbon, Nitrogen, Phosphorus, and pH Determination

The SOC content was measured via dry combustion using a Multi N/C 2100 analyzer (Analytik Jena, Jena, Germany). After wet digestion with sulfuric acid, the TN and TP contents were measured with an AA3 Continuous Flow Analyzer (Seal Analytical, Norderstedt, Germany) [26]. The soil pH was determined at a water-to-soil ratio of 10:1 using a calibrated pH meter (PHS-25, Shanghai, China).

2.3. DNA Extraction and Functional Gene Abundance Assay

DNA was extracted from 0.3 g of fresh soil using a FastDNA Spin Kit for Soil (MPbio, Santa Ana, CA, USA), following the manufacturer’s instructions. The DNA concentrations were determined with a NanoDrop® ND-1000 UV-Vis spectrophotometer (Thermo Fisher Scientific, Inc., Waltham, MA, USA). Before functional gene analysis, the extracted DNA was stored inside a −20 °C freezer. The abundances of bacterial 16S rRNA; fungal ITS; and the nirK, nirS, and nifH genes were examined with real-time PCR (RT-PCR) using an ABI StepOne instrument (Applied Biosystems, San Francisco, CA, USA) with SYBR green dye. The RT-PCR analysis was replicated three times for each soil sample. The PCR amplification procedures and primers for each target gene are shown in Table 1. Each 25 µL PCR reaction mixture included 12.5 µL of SYBR Buffer (TaKaRa, Beijing, China), 0.4 µL of each primer (10 µM), 0.5 µL of ROXII (TaKaRa), 0.88 µL of 3% BSA, 0.63 µL of DMSO, and 10 ng of template DNA. Standard curves were generated by purifying phylogenetic and functionally labeled amplicon products using a Cyclic Purification Kit (OMEGA Bio-Tek, Norcross, GA, USA); they were then attached to the vector pMD18-T (TaKaRa) and converted to TOP10 Escherichia coli. competent cells. Plasmids were extracted using the Plasmid Mini Kit (OMEGA Bio-Tek). The plasmid specificity was detected with the Basic Local Alignment Search Tool [27], and the plasmid concentration was determined via Nanodrop 2000 (Thermo, Waltham MA, USA). We obtained the standard curve with successive dilution of the known-copy-number plasmids.

2.4. Statistical Analyses

SPSS software (v. 16.0) was used to analyze the data. One-way analysis of variance (ANOVA) with LSD multiple comparison was used to determine the significant differences in the abundances of bacteria, fungi, and functional genes in the rhizospheres of the different plant species and the non-rhizosphere soil of each sampling site, and three-way ANOVA was performed to test the significant effects of the plant species, soil depth, and sampling site and their interactions on the SOC, TN, TP, and pH values and soil microbial abundances. The relationship between the soil chemical properties and the microbial abundances was analyzed using redundancy analysis (RDA). All data were tested for normality (S-W test) prior to the ANOVA and were distributed normally. The significance of the statistical analysis was considered to be at the p < 0.05 level. Origin8.5 was used for mapping.

3. Results

3.1. SOC, TN, TP, and pH Values

Figure 1 shows the SOC, TN, TP, and pH values at different depths of rhizosphere and non-rhizosphere soils from the two permafrost regions. These results indicate that the subsoil organic carbon content was lower than that of the topsoil at both sampling sites, and the SOC content in the discontinuous permafrost region was higher than that in the continuous permafrost region (Figure 2a,e). The subsoil TN content values under Cs and Bf were apparently higher than those of the topsoil in the discontinuous permafrost, and similar patterns were observed for Cs and Bf across the different sampling sites (Figure 2b,f). Overall, the soil TP content (Figure 2c,g) and pH values (Figure 2d,h) under the same species in the continuous permafrost region were clearly higher than those in the discontinuous permafrost region.

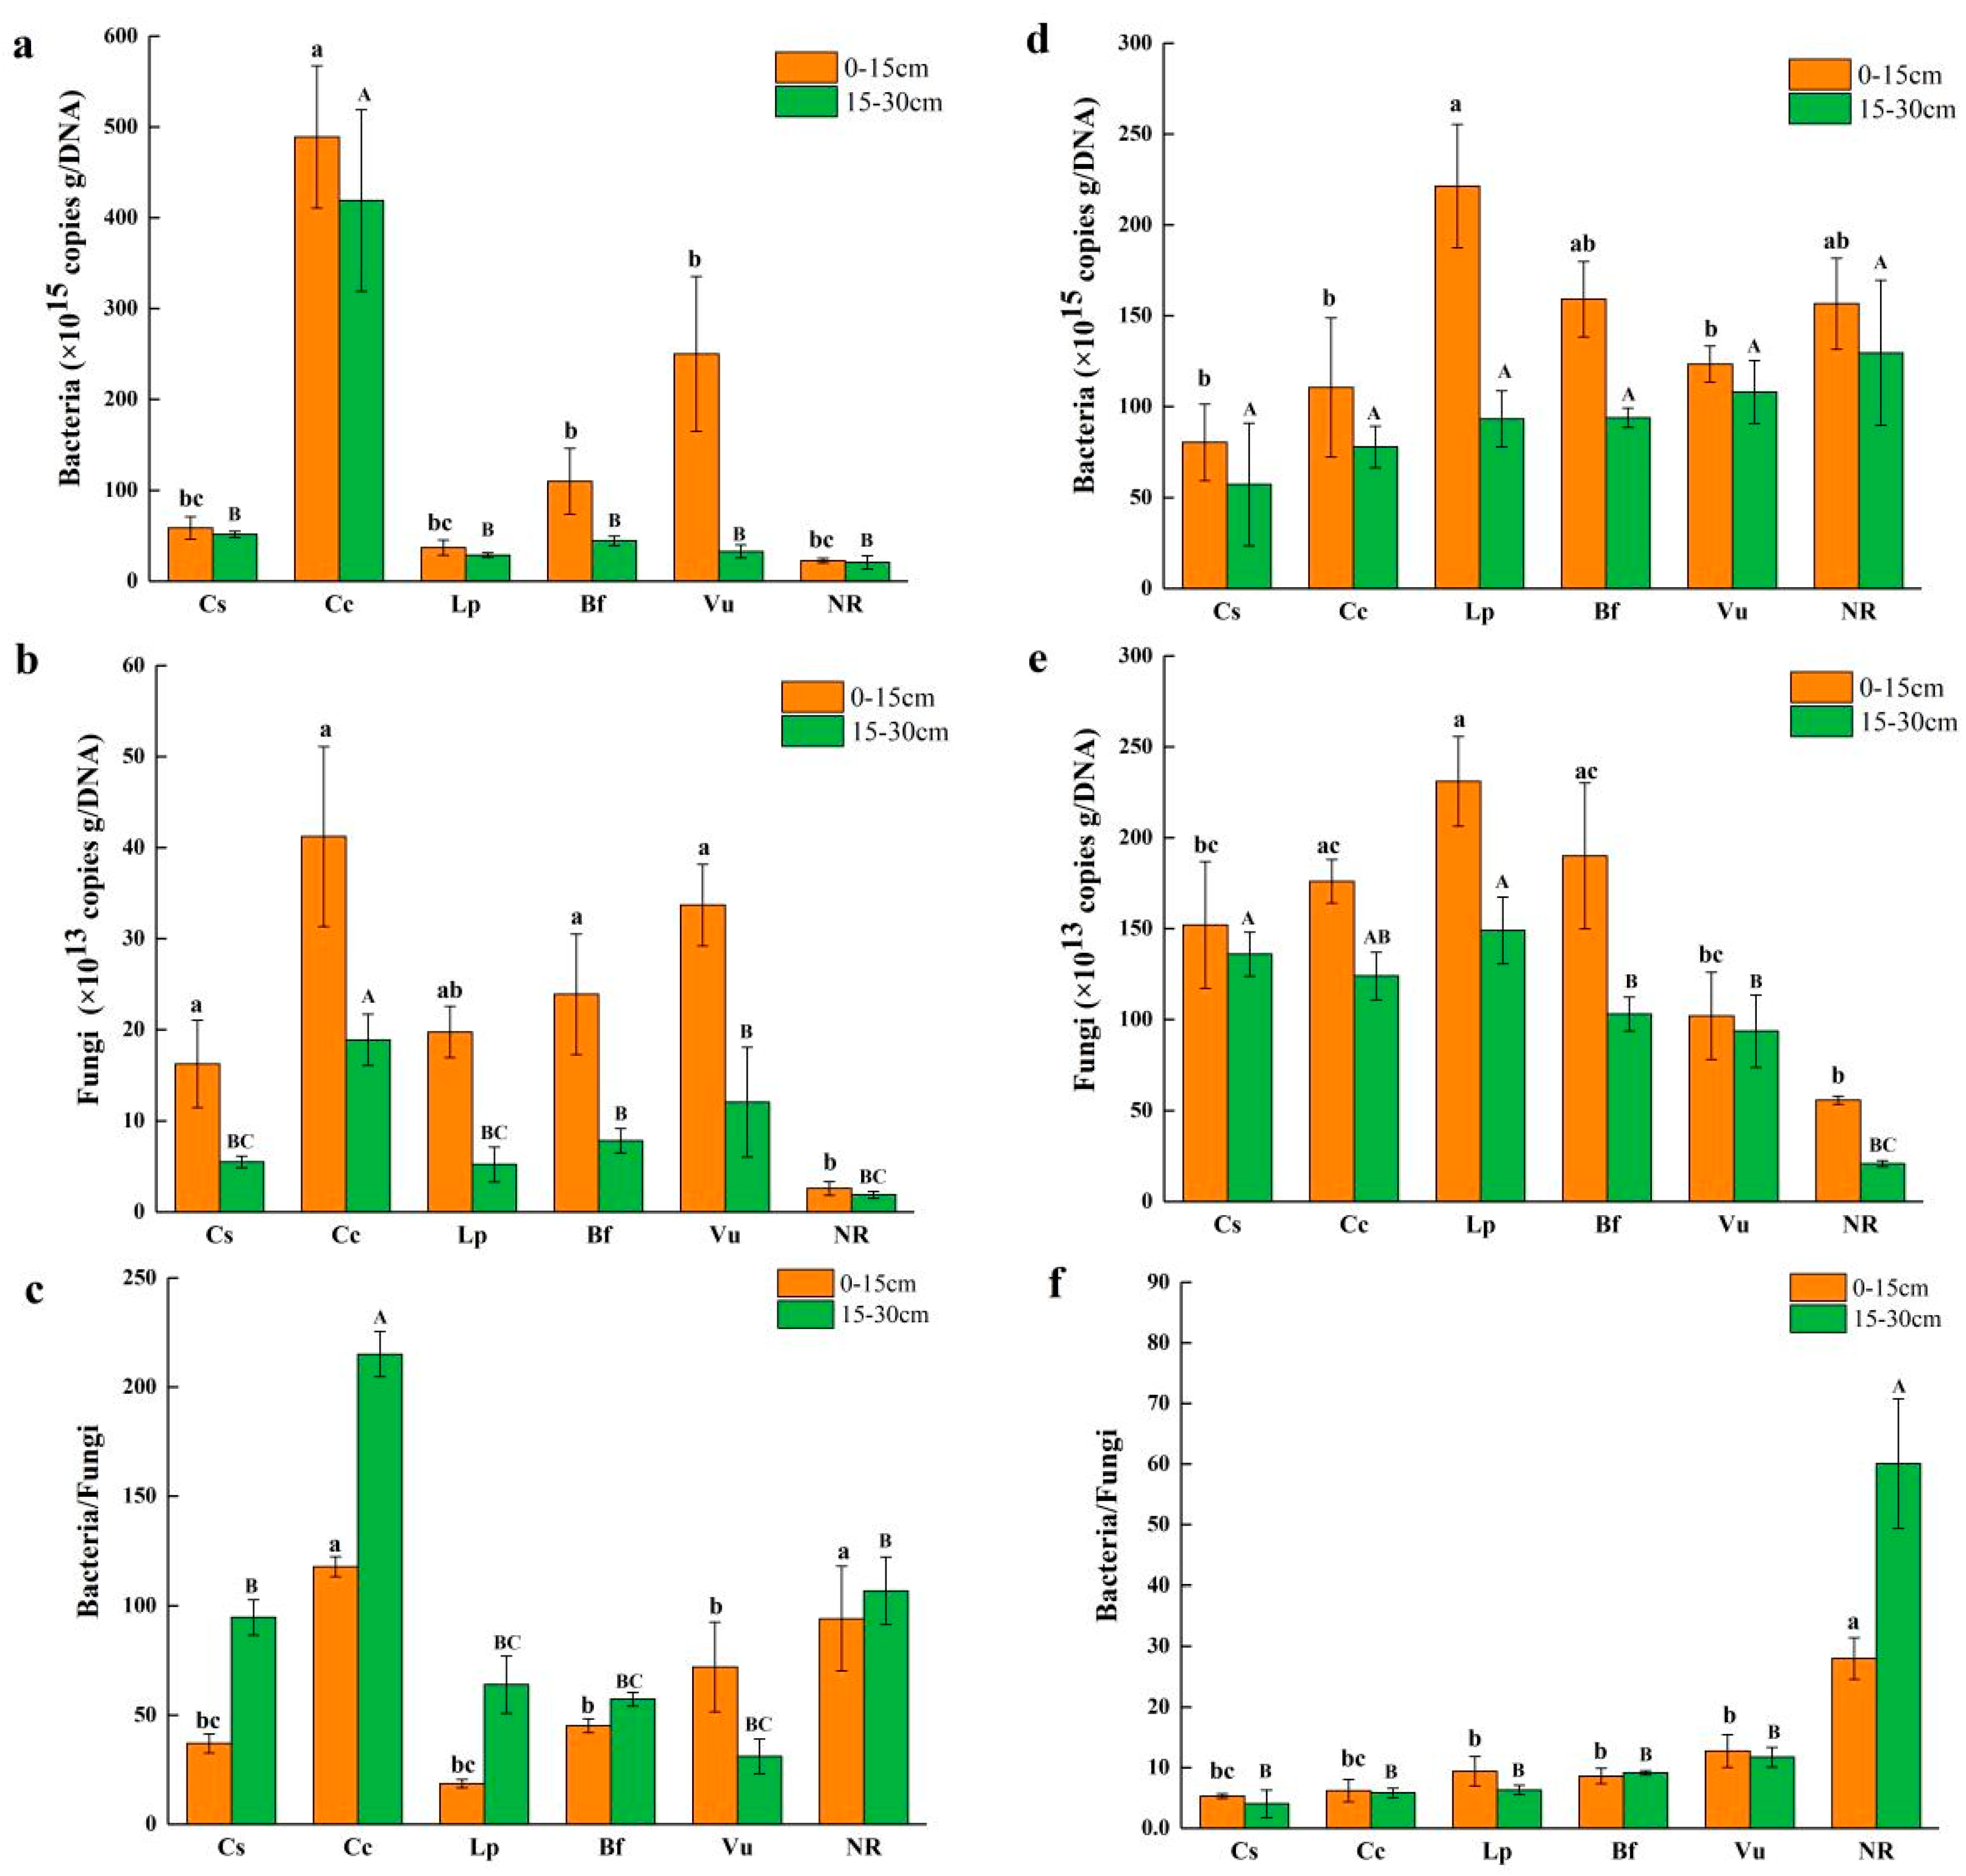
3.2. Abundances of Bacteria and Fungi

The bacterial and fungal abundances in the topsoil were higher than those in the subsoil in both permafrost regions (Figure 3). In the discontinuous permafrost region, the Cc rhizosphere soil and non-rhizosphere soil had the highest and lowest bacterial and fungal abundances, respectively. Moreover, the bacterial abundance was significantly higher at both soil depths in the Cc rhizosphere soil in the discontinuous permafrost region compared with that in the continuous permafrost region (p < 0.05). The bacterial abundance in the Vu rhizosphere topsoil was higher than those in the Cs and Lp rhizosphere soils (p < 0.05), and the fungal abundance in the Vu rhizosphere subsoil was higher than those in the Cs and Lp rhizosphere soils (p < 0.05; Figure 3a,b). In the continuous permafrost region, the topsoil bacterial abundance in the Lp rhizosphere was the highest, while that in the Cs rhizosphere soil was the lowest (Figure 3d). The fungal abundances in the Lp rhizosphere soil at both depths were higher than those in the other investigated soils, while the non-rhizosphere soil had the lowest fungal abundance. The fungal abundance in the Vu rhizosphere topsoil was significantly lower than those in the Lp and Bf rhizosphere soils (p < 0.05). The subsoil fungal abundance under Cs was higher than those in the Bf and Vu rhizosphere soils (p < 0.05; Figure 3e). The ratio of bacteria to fungi decreased significantly from the discontinuous permafrost region to the continuous permafrost region (Figure 3c,f).

3.3. Abundance of Denitrifying Bacteria

The numbers of nirK and nirS gene copies were used to express the abundance of denitrifying bacteria. The abundance of denitrifying genes was consistently higher in the topsoil compared to the subsoil in both permafrost regions (Figure 4). The Cs rhizosphere topsoil had the highest abundances of the nirK and nirS genes, and the lowest abundances of these genes were found in the Lp and Cc rhizosphere soils in the discontinuous permafrost region. The abundances of the nirK and nirS genes in the Cc and Vu rhizosphere subsoils were substantially lower than those in the other soils investigated (Figure 4a,b). In the continuous permafrost region, the abundance of the nirK gene in the non-rhizosphere soil was remarkably higher than in the other investigated rhizosphere soils, and the highest nirS gene abundance occurred in the Bf rhizosphere topsoil (p < 0.05; Figure 4d,e). The ratio of nirK to nirS significantly increased from the discontinuous permafrost region to the continuous permafrost region (Figure 4c,f).

3.4. Abundance of N-Fixing Bacteria

The number of nifH gene copies was used to express the abundance of N-fixing bacteria. We found that the nifH gene abundance in the topsoil was higher than that in the subsoil at the different sampling sites (Figure 5). In the discontinuous permafrost region, the nifH gene abundance in the Cc rhizosphere soil was clearly higher than those in the other soils investigated, and the same pattern was observed in the non-rhizosphere soils of the continuous permafrost region (p < 0.05; Figure 5a,b). The nifH gene abundance in the Cs rhizosphere soil was higher than those observed in the other rhizosphere soils (Cc excepted) in the discontinuous permafrost region, while it was the lowest in the continuous permafrost region (p < 0.05).

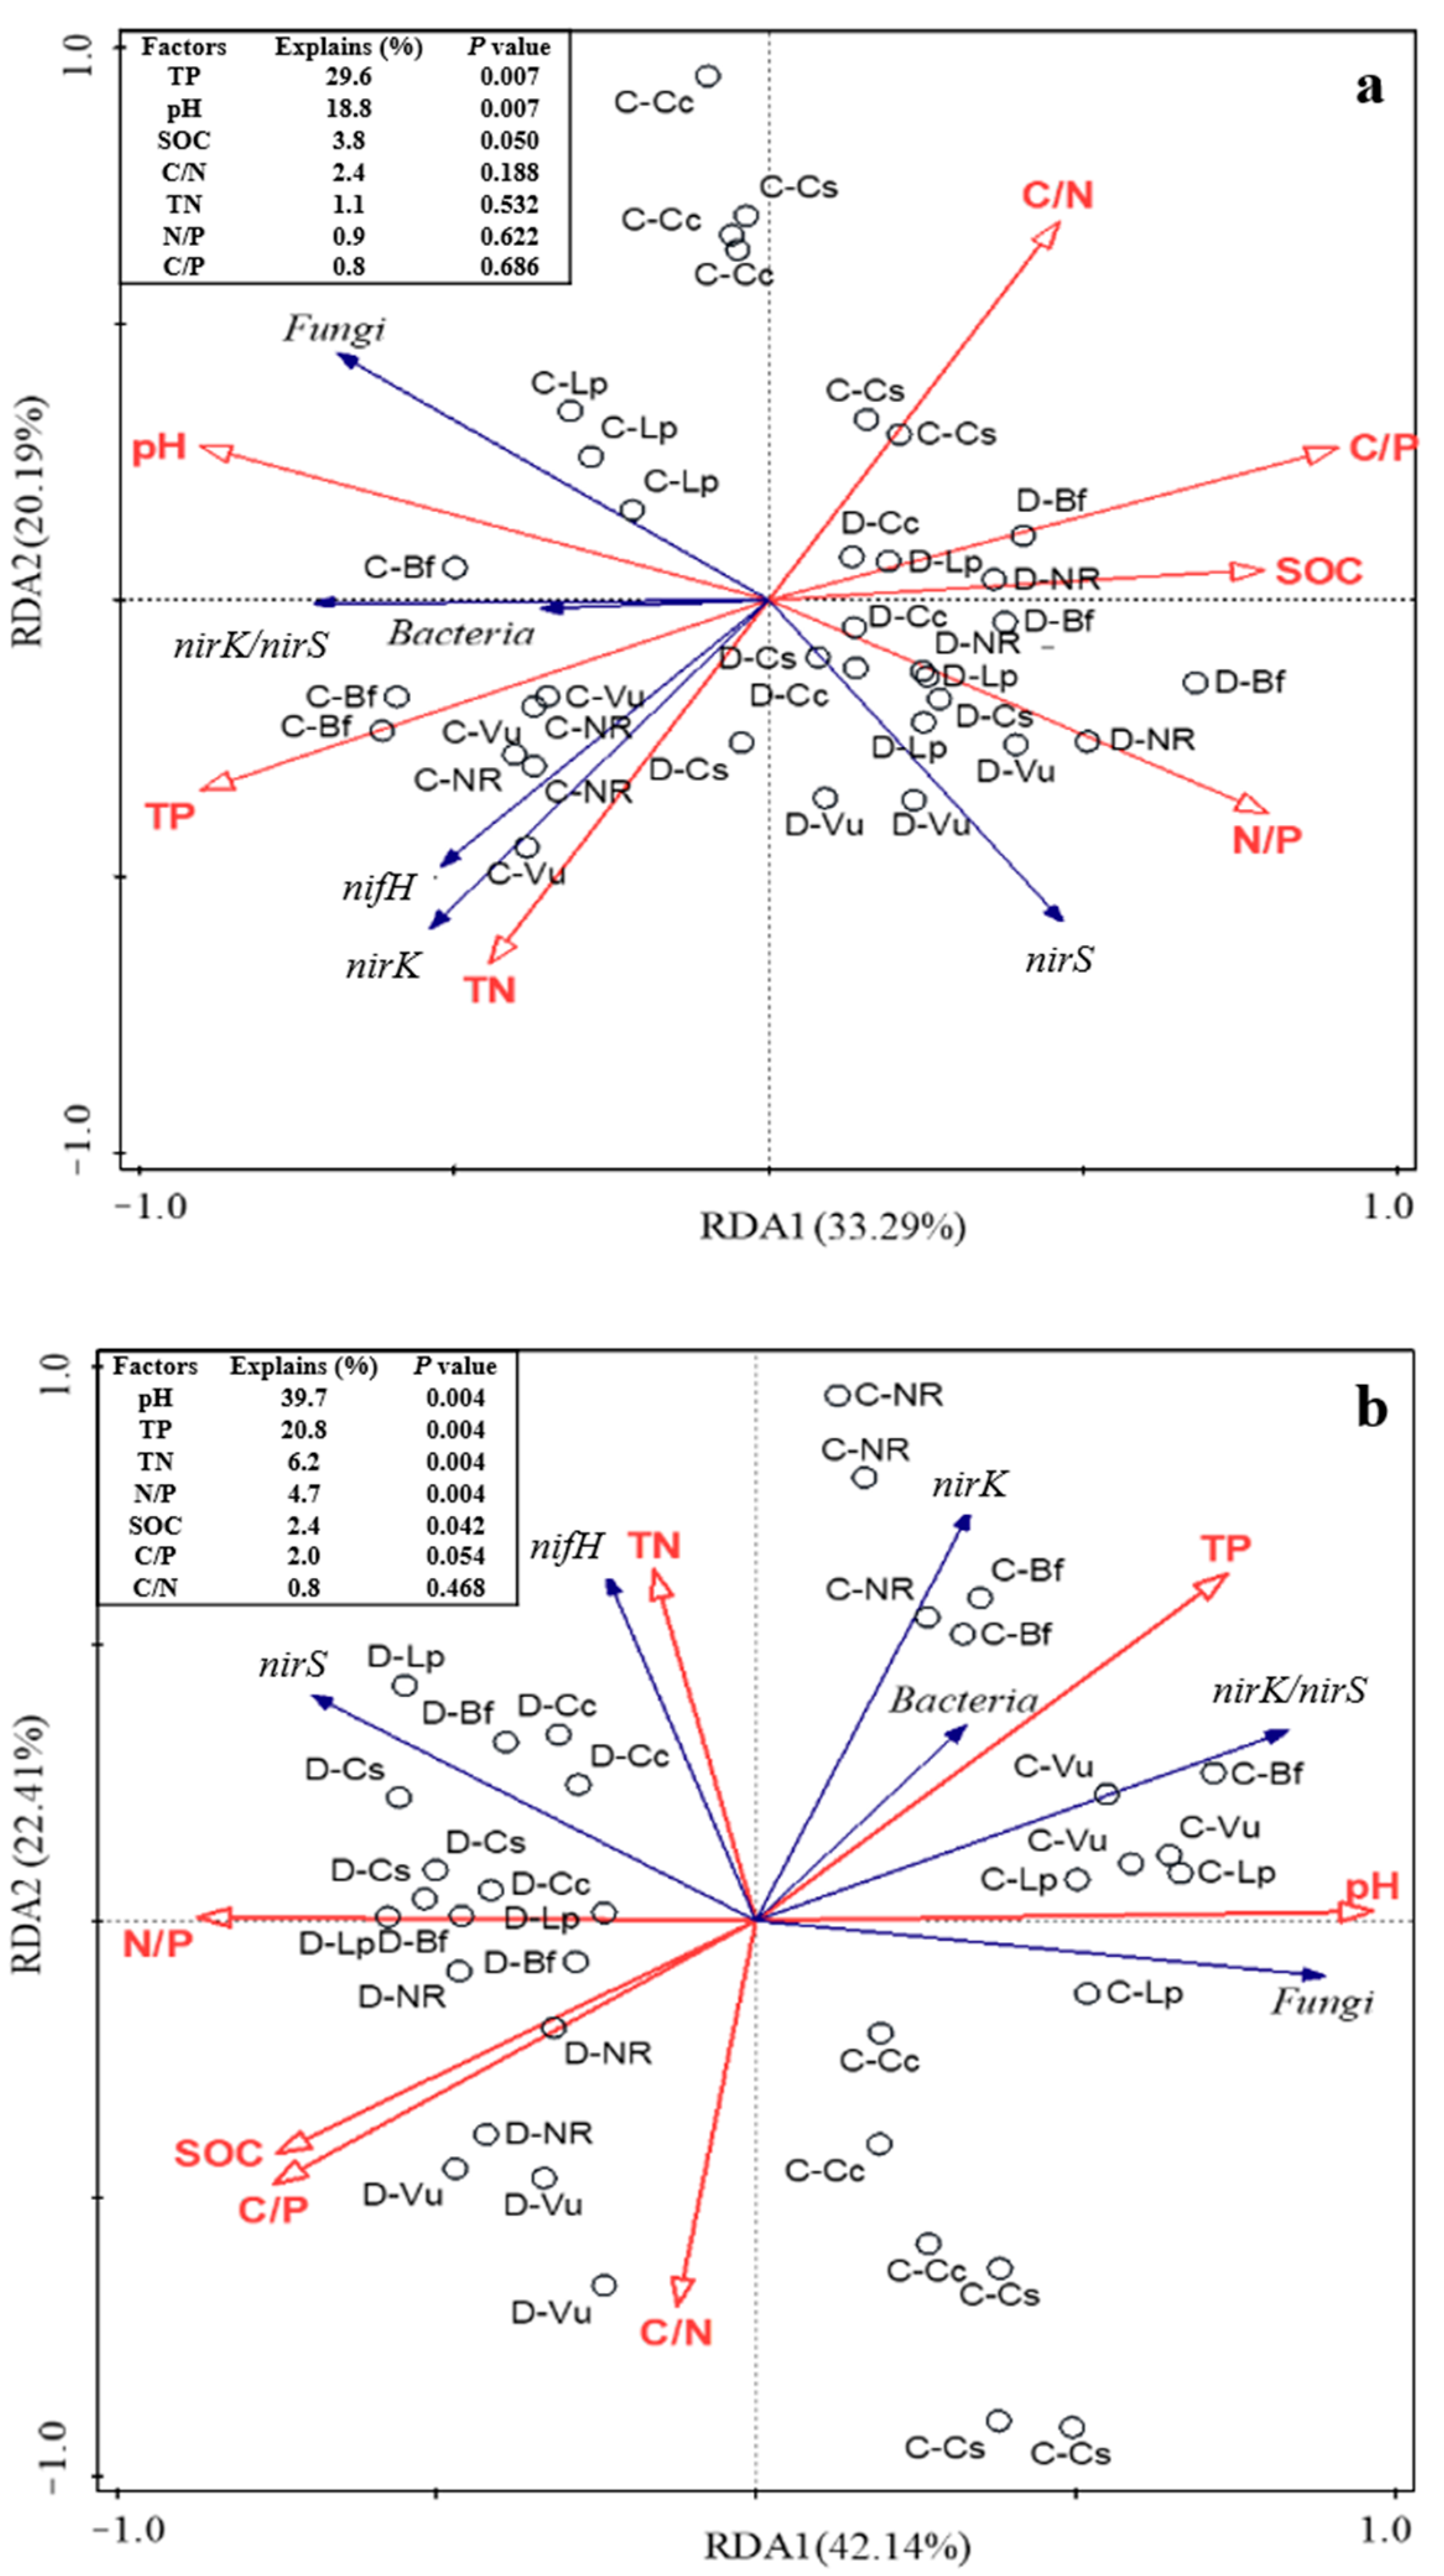
3.5. Effects of Vegetation Type, Soil Depth, and Permafrost Type on Soil Bacteria, Fungi, and Functional Gene Abundances

The results of the three-way ANOVA indicated that the bacterial abundance was significantly influenced by the vegetation type and the soil depth (p < 0.01). The interaction effects between the permafrost type and the soil depth significantly affected the bacterial abundance (p < 0.01). The interaction effects between the vegetation type and the soil depth also significantly affected the soil bacterial abundance (p < 0.05). The fungal abundance was significantly influenced by the vegetation type (p < 0.01). The interaction effects between the permafrost type and the soil depth and between the vegetation type and the soil depth significantly affected the fungal abundance (p < 0.05). Furthermore, the interaction effects among the vegetation type, permafrost type and soil depth had a significant impact on the abundance of nirK (p < 0.01; Table 2). The abundance of nirS was significantly influenced by the vegetation type and the permafrost type (p < 0.05). Furthermore, the interaction effects among the vegetation type, permafrost type, and soil depth had a significant impact on the abundance of nirS (p < 0.01). The interaction effects between the vegetation type and the permafrost type and among the vegetation type, permafrost type, and soil depth had a significant impact on the abundance of nifH (p < 0.01).
The RDA results revealed that the SOC, TP, and pH were significant factors explaining the variations in the surface soil bacteria; fungi; and nirK, nirS, and nifH gene abundances at both sampling sites (p < 0.05; Figure 6a), in which the TP had the highest explanatory power (29.6%), followed by the pH (18.8%) and SOC (3.8%). For the subsoil, variations in the bacteria; fungi; and nirK, nirS, and nifH gene abundances were significantly explained by the pH, TP, TN, N/P, and SOC (p < 0.05; Figure 6b). Among them, pH had the highest explanatory power (39.7%), followed by the TP (20.8%) and the TN (6.2%).

4. Discussion

4.1. Differences in Soil Microbial Abundance between Rhizosphere and Non-Rhizosphere Soil

The results of our study have demonstrated that the bacterial and fungal abundance in the rhizosphere soil were higher than those in the non-rhizosphere soil in the discontinuous permafrost region, which is consistent with hypothesis 2. The same pattern was revealed for fungi in the continuous permafrost region, but not for bacteria in the rhizosphere and non-rhizosphere soils (Figure 3). Our results were in accordance with previous studies that have suggested that the number of bacteria in non-rhizosphere soil is lower than that in rhizosphere soil and this pattern is soil-environment-dependent [9,10]. Diverse plant species growing on the same soil host their own specific microbial communities, confirming that plants can shape their rhizosphere microbiomes [16,33,34,35,36]. Generally, bacteria are a substantial biological group of soil microorganisms due to their large amounts in soil and act as an indispensable driver that is greatly regulated by substrate availability in ecosystems [37]. The abundance of fungi in rhizosphere soil was greater than that of non-rhizosphere soil independently of region, indicating that rhizosphere soil is conducive to the growth and propagation of fungi given the high substrate availability from root debris and exudate. Additionally, the majority of the nutrient shift between plants and microbial communities took place directly in rhizosphere soil, which was different from non-rhizosphere soil, which induced higher bacterial and fungal abundances [38]. We also observed that the fungal abundance varied in the rhizosphere soils of different plant species, mainly due to the fact that different vegetation types have varying effects on soil physicochemical properties, leading to obvious differences in soil fungal community structure and quantity [39,40].
In this study, except for in the topsoil under Betula fruticosa, the abundances of the nirK and nirS genes in rhizosphere soil were clearly lower than those in non-rhizosphere soil in the continuous permafrost region. This is consistent with the research of Nie et al. (2014), who verified that denitrifying functional gene amplification resulted in fewer denitrifiers in rhizosphere soil [41]. The reasons may be that oxygen secretion from plant roots may induce an oxygen gradient in those roots, which is not conducive to denitrification [42], and non-rhizosphere soil provides more substrate sources for denitrifying microorganisms on account of plant competition shortage [43]. Bremer et al. (2007) revealed that plants could directly induce variations in the composition of the nirK-type denitrifier through root exudates [44]. We also observed that the abundances of the nirK and nirS genes in rhizosphere and non-rhizosphere soils under the same (both sampling sites) and different plant species were markedly different. This was relevant to the differences in the microenvironment and the root exudates in the plant rhizospheres, similarly to the results of previous research, suggesting that the nirK and nirS genes’ abundances in rhizosphere and non-rhizosphere soils from different sites and plants differed remarkably [45].

4.2. Differences of Soil Microbial Abundance in Topsoil and Subsoil

In accordance with hypothesis 1, our results clarified that the abundances of bacteria; fungi; and the nirK, nirS, and nifH genes in the topsoil were greater than those in the subsoil in the permafrost region. The reason may be that the surface layer harbors more organic matter from plant litter and roots, which acts as a source of nutrients for soil microorganisms and increases the abundances of bacteria; fungi; and the nirK, nirS, and nifH genes. Plant roots can continuously produce organic matter into rhizosphere soil [46,47]. There are some researchers who have demonstrated that the primary food source of soil microbes closely associated with plants is root exudates, which are essential for microbial population enrichment in rhizosphere soil with high substrate availability [48]. Moreover, topsoil contains more nutrients than subsoil, which is beneficial to the reproduction of microorganisms. However, not only is the interaction between plants and microorganisms a prime factor in determining the composition of rhizosphere microbial communities, but the competitive interactions among microorganisms are the fundamental cause of differences in soil microbial abundance [49].
We discovered that vegetation type and soil depth had remarkable influences on soil microbial abundances, and the complex interactions between vegetation type and permafrost type or among vegetation type, permafrost type, and soil depth were of similar importance to the distribution of soil microbial abundance, which is in line with our hypotheses. Previous studies have found that soil microbial communities under diverse plant species could differ dramatically in their abundance and composition [17,50], and the magnitude and structure of each microbial community in rhizosphere soil is chiefly regulated by soil type [51,52].

4.3. Differences in Soil Microbial Abundances in Different Types of Permafrost

Previous studies have shown that constantly produced organic compounds are excreted into the soil through roots that modulate microbial growth and reproduction [46,47]. In our research, we only observed that the abundances of bacteria and the nifH gene in the C calyculata rhizosphere soil of the continuous permafrost region were lower than those of the discontinuous permafrost region, which is in accordance with hypothesis 3. Vegetation succession under the influence of global climate change may cause a series of variations in the connection between plants and microorganisms, which will subsequently alter nutrient cycles. The reasons for these discrepancies could be due to the facts that C. calyculata may be more sensitive to temperature and precipitation and that the higher air temperature and precipitation in the discontinuous permafrost region are conducive to the physiological activity of C. calyculata, inducing the releases of more soil-available nitrogen and other nutrients utilized by microorganisms.
Furthermore, the higher air temperature and precipitation in the discontinuous compared with the continuous permafrost region are conducive to increasing the soil temperature and moisture, which can directly increase the activity of soil microorganisms. The results of the RDA indicated that soil TP and pH significantly positively correlated with soil bacterial and fungal abundances in permafrost peatland soils, suggesting that the abundances of soil bacteria and fungi may be limited by soil phosphorus content and acidic condition, while increases in soil TP content and pH can stimulate their abundances. The abundances of the nirK and nifH genes in the non-rhizosphere soil in the continuous permafrost region were higher than those in the discontinuous permafrost region, as permafrost degradation is caused by climate warming. This could induce the nitrite reduction step of denitrification while limiting nitrogen fixation, resulting in reductions in the nirK and nifH genes. Previous studies have revealed that the mean annual precipitation in the discontinuous permafrost region is higher than that in the continuous permafrost region, leading to higher soil moisture content. This is not conducive to denitrifying or nitrogen-fixing bacteria [25]. We found that the ratios of bacteria to fungi increased and that of nirK to nirS significantly decreased from the continuous to the discontinuous permafrost region, indicating that permafrost degradation may shift the soil microbial community composition and the bacteria, specifically denitrifying bacteria (nirK) domination. This dominance of bacteria promotes soil organic matter decomposition, as labile substrates favor bacteria more than fungi, inducing more carbon to probably take part in cycling processes with permafrost degradation under climate warming [53,54].

5. Conclusions

The abundance of bacteria was more sensitive to permafrost degradation, leading to the release of more available nutrients that were conducive to bacteria growth and propagation in the rhizosphere soil. The characteristics of the nifH gene abundance in the varied permafrost region revealed that permafrost degradation is not conducive to soil microbial nitrogen fixation without the indirect effect of plants. The abundance of fungi in the rhizosphere soil was greater than that in the non-rhizosphere soil independently of the sites. The non-rhizosphere soil provided more substrate sources for denitrifying microorganisms as a lack of plant competition. Topsoil with more organic matter from plant litter induced higher abundances of bacteria; fungi; and the nirK, nirS, and nifH genes as compared to subsoil that is limited by nutrients in the permafrost region. Our study highlights the microbial abundances in different plant rhizosphere soils, varying with landscape changes, that may greatly impact carbon cycling under climate warming.

Author Contributions

Methodology, X.W.; Software, M.Z.; Formal analysis, J.G.; Resources, S.G.; Data curation, X.M.; Writing—review & editing, C.G.; Supervision, Y.S., D.Z. and C.S. All authors have read and agreed to the published version of the manuscript.

Funding

This work was supported by the National Natural Science Foundation of China (grant numbers 42271109, 41401106); the Professional Association of the Alliance of International Science Organizations (grant number ANSO-PA-2020-14); the Innovation Team Project of the Northeast Institute of Geography and Agroecology, the Chinese Academy of Sciences (grant number 2022CXTD02); and the Young Scientist Group Project of the Northeast Institute of Geography and Agroecology, Chinese Academy of Sciences (grant number 2022QNXZ01-01).

Data Availability Statement

Data are available on request.

Conflicts of Interest

The authors have no relevant financial or non-financial interest to disclose.

References

  1. Templer, P.H.; Groffman, P.M.; Flecker, A.S.; Power, A.G. Land use change and soil nutrient transformations in the Los Haitises region of Dominican Republic. Soil Biol. Biochem. 2005, 37, 215–225. [Google Scholar] [CrossRef]
  2. Kalbitz, K.; Solinger, S.; Park, J.H.; Michalzik, B.; Matzner, E. Controls on the dynamics of dissolved organic matter in soils: A review. Soil Sci. 2000, 165, 277–304. [Google Scholar] [CrossRef]
  3. Dazzo, F.B.; Garoutte, A.; Hartmann, A. Rhizosphere. In Encyclopedia of Microbiology, 4th ed.; Academic Press: Cambridge, MA, USA, 2019; pp. 147–163. [Google Scholar]
  4. Bashir, O.; Khan, K.; Hakeem, K.R.; Mir, N.A.; Rather, G.H.; Mohiuddin, R. Soil Microbe Diversity and Root Exudates as Important Aspects of Rhizosphere Ecosystem. In Plant, Soil and Microbes; Springer International Publishing: Berlin/Heidelberg, Germany, 2016. [Google Scholar]
  5. Hütsch, B.W.; Augustin, J.; Merbach, W. Plant rhizodeposition–An important source for carbon turnover in soils. J. Plant Nutr. Soil Sci. 2002, 165, 397–407. [Google Scholar] [CrossRef]
  6. Walker, T.S.; Bais, H.P.; Grotewold, E.; Vivanco, J.M. Root exudation and rhizosphere biology. Plant. Physiol. 2003, 132, 44–51. [Google Scholar] [CrossRef]
  7. Turner, T.R.; Ramakrishnan, K.; Walshaw, J.; Heavens, D.; Alston, M.; Swarbreck, D.; Osbourn, A.; Grant, A.; Poole, P.S. Comparative metatranscriptomics reveals kingdom level changes in the rhizosphere microbiome of plants. ISME J. 2013, 7, 2248–2258. [Google Scholar] [CrossRef]
  8. Lynch, J.P. Root architecture and plant productivity. Plant Physiol. 1995, 109, 7–13. [Google Scholar] [CrossRef]
  9. He, Y.; Hu, W.G.; Ma, D.C.; Yang, Y.; Lan, H.Z.; Gao, Y. Diversity and abundance of ammonia-oxidizing microorganisms in relation to soil environment in rhizosphere soil of Halocnemum strobilaceum in Ebinur Lake wetland. Acta Sci. Circumstantiae 2017, 37, 1967–1975. [Google Scholar]
  10. Wang, C.H.; Wu, F.; Hu, W.G.; Mo, C.; Zhang, X.H. Community diversity of ammonia-oxidizing bacteria of three plants rhizosphere in Ebinur Lake wetland. Acta Microbiol. Sin. 2015, 55, 1190–1200. [Google Scholar]
  11. Liu, Y.; Shen, X.; Chen, Y.M.; Wang, L.F.; Chen, Q.M.; Zhang, J.; Xu, Z.F.; Tan, B.; Zhang, L.; Xiao, J.J.; et al. Litter chemical quality strongly affects forest floor microbial groups and ecoenzymatic stoichiometry in the subalpine forest. Ann. Forest Sci. 2019, 76, 106. [Google Scholar] [CrossRef]
  12. Moreno-Espíndola, I.P.; Ferrara-Guerrero, M.J.; Luna-Guido, M.L.; Ramírez-Villanueva, D.A.; León-Lorenzana, A.S.D.; Gómez-Acata, S.; González-Terreros, E.; Ramírez-Barajas, B.; Navarro-Noya, Y.E.; Sánchez-Rodríguez, L.M.; et al. The bacterial community structure and microbial activity in a traditional organic milpa farming system under different soil moisture conditions. Front. Microbiol. 2018, 9, 2737. [Google Scholar] [CrossRef]
  13. Damashek, J.; Francis, C.A. Microbial nitrogen cycling in estuaries: From genes to ecosystem processes. Estuaries Coasts 2018, 41, 626–660. [Google Scholar] [CrossRef]
  14. Huang, L.; Riggins, C.W.; Rodríguez-Zas, S.; Zabaloy, M.C.; Villamil, M.B. Long-term N fertilization imbalances potential N acquisition and transformations by soil microbes. Sci. Total Environ. 2019, 691, 562–571. [Google Scholar] [CrossRef]
  15. Linda, H.; Cécile, G.R.; Nicol, G.W.; Prosser, J.I. The consequences of niche and physiological differentiation of archaeal and bacterial ammon Aggravated phosphorus limitation on biomass production under increasing nitrogen loading: A meta-analysisia oxidisers for nitrous oxide emissions. ISME J. 2018, 12, 934–943. [Google Scholar]
  16. Berg, G.; Smalla, K. Plant species and soil type cooperatively shape the structure and function of microbial communities in the rhizosphere. FEMS Microbiol. Ecol. 2009, 68, 1–13. [Google Scholar] [CrossRef] [PubMed]
  17. Innes, L.; Hobbs, P.; Bardgett, R. The impacts of individual plant species on rhizosphere microbial communities in soils of different fertility. Biol. Fertil. Soils 2004, 40, 7–13. [Google Scholar] [CrossRef]
  18. Weinert, N.; Meincke, R.; Gottwald, C.; Heuer, H.; Gomes, N.C.M.; Schloter, M.; Berg, G.; Smalla, K. Rhizosphere communities of genetically modified Zeaxanthin-accumulating potato plants and their parent cultivar differ less than those of different potato cultivars. Appl. Environ. Microbiol. 2009, 75, 3859–3865. [Google Scholar] [CrossRef]
  19. Smalla, K.; Wieland, G.; Buchner, A.; Zock, A.; Parzy, J.; Kaiser, S.; Roskot, N.; Heuer, H.; Berg, G. Bulk and rhizosphere soil bacterial communities studied by denaturing gradient gel electrophoresis: Plant-dependent enrichment and seasonal shifts revealed. Appl. Environ. Microbiol. 2001, 67, 4742–4751. [Google Scholar] [CrossRef]
  20. Wickings, K.; Grandy, A.S.; Reed, S.C.; Cleveland, C.C. The origin of litter chemical complexity during decomposition. Ecol. Lett. 2012, 15, 1180–1188. [Google Scholar] [CrossRef]
  21. Xue, L.; Kuang, L.G.; Chen, H.Y.; Tan, S.M. Soil nutrients, microorganisms and enzyme activities of different stands. Acta Pedol. Sin. 2003, 40, 280–285. [Google Scholar]
  22. Kuzyakov, Y.; Blagodatskaya, E. Microbial hotspots and hot moments in soil: Concept & review. Soil Biol. Biochem. 2015, 83, 184–199. [Google Scholar]
  23. Song, Y.Y.; Jiang, L.; Song, C.C.; Wang, X.W.; Ma, X.Y.; Zhang, H.; Tan, W.W.; Gao, J.L.; Hou, A.X. Microbial abundance and enzymatic activity from tussock and shrub soil in permafrost peatland after 6-year warming. Ecol. Indic. 2021, 126, 107589. [Google Scholar]
  24. Sun, L.; Li, X.Z.; Wang, X.W.; Lv, J.J.; Li, Z.M.; Hu, Y.M. Latitudinal pattern in species diversity and its response to global warming in permafrost wetlands in the Great Hing’an Mountains, China. Russ. J. Ecol. 2011, 42, 123–132. [Google Scholar]
  25. Sun, G.Y.; Yu, S.P.; Wang, H.X. Causes, south borderline and subareas of permafrost in Da Hinggan Mountains and Xiao Hinggan Mountains. Sci. Geogr. Sin. 2007, 27, 68–74. [Google Scholar]
  26. Bao, S.D. Soil Agricultural Chemistry Analysis, 3rd ed.; China Agricultural Press: Beijing, China, 2008. [Google Scholar]
  27. Zhang, Z.; Schwartz, S.; Wagner, L.; Miller, W. A greedy algorithm for aligning DNA sequences. J. Comput. Biol. 2000, 7, 203–214. [Google Scholar] [CrossRef]
  28. Wang, H.; Yang, J.P.; Yang, S.H. Effect of a 10 degrees C-elevated temperature under different water contents on the microbial community in a tea orchard soil. Eur. J. Soil Biol. 2014, 62, 113–120. [Google Scholar]
  29. Gardes, M.; Bruns, T.D. Its primers with enhanced specificity for basidiomycetes-application of mycorrhizae and rusts. Mol. Ecol. 1993, 2, 113–118. [Google Scholar] [PubMed]
  30. Hallin, S.; Lindgren, P.E. PCR detection of genes encoding nitrile reductase in denitrifying bacteria. Appl. Environ. Microbiol. 1999, 65, 1652–1657. [Google Scholar] [CrossRef]
  31. Petersen, D.G.; Blazewicz, S.J.; Firestone, M.; Herman, D.J.; Turetsky, M.; Waldrop, M. Abundance of microbial genes associated with nitrogen cycling as indices of biogeochemical process rates across a vegetation gradient in Alaska. Environ. Microbiol. 2012, 14, 993–1008. [Google Scholar] [PubMed]
  32. Fan, L. Response of Diazotrophic Microbial Community to Nitrogen Input and Glyphosate Application in Soils Cropped to Soybean. Ph.D. Thesis, Auburn University, Auburn, AL, USA, 2013. [Google Scholar]
  33. Berendsen, R.L.; Pieterse, C.M.J.; Bakker, P. The rhizosphere microbiome and plant health. Trends Plant Sci. 2012, 17, 478–486. [Google Scholar]
  34. Hartmann, A.; Schmid, M.; van Tuinen, D.; Berg, G. Plant-driven selection of microbes. Plant Soil 2009, 321, 235–257. [Google Scholar]
  35. Patersen, E.; Gebbing, T.; Abel, C.; Sim, A.; Telfer, G. Rhizodeposition shapes rhizosphere microbial community structure in organic soil. New Phytologist. 2007, 173, 600–610. [Google Scholar]
  36. Jiao, R.Z.; Yang, C.D. The changes of the soil microorganism in rhizosphere and outside in different developing stages of the Chinese fir plantation. Sci. Silvae Sin. 1999, 35, 53–59. [Google Scholar]
  37. Elliott, D.R.; Caporn, S.J.M.; Nwaishi, F.; Nilsson, R.H.; Sen, R. Bacterial and Fungal Communities in a Degraded Ombrotrophic Peatland Undergoing Natural and Managed Re-Vegetation. PLoS ONE 2015, 10, e0124726. [Google Scholar] [CrossRef]
  38. Kemp, J.; Lotter, D.; Meyer, A.; Kleinert, A.; Pérez-Fernández, M.; Valentine, A. Variation in rhizosphere nutrient cycling affects the source of nitrogen acquisition in wild and cultivated Aspalathus linearis (N.L.Burm.) R.Dahlgren plants. Appl. Soil Ecol. 2018, 130, 26–33. [Google Scholar]
  39. Wang, Y.; Liu, S.; Guo, J.L.; Liu, B.B. Effects of different vegetation types on soil nutrients, enzyme activities and microorganisms on the Loess Plateau. Bull. Soil Water Conserv. 2018, 38, 62–68. (In Chinese) [Google Scholar]
  40. Broeckling, C.D.; Broz, A.K.; Bergelson, J. Root exudates regulate soil fungal community composition and diversity. Appl. Environ. Microbiol. 2008, 74, 738–744. [Google Scholar]
  41. Nie, S.A.; Xu, H.J.; Li, S.; Li, H.; Su, J.Q. Relationships between abundance of microbial functional genes and the status and fluxes of carbon and nitrogen in rice rhizosphere and bulk soils. Pedosphere 2014, 24, 645–651. [Google Scholar]
  42. Zheng, Y.L.; Hou, L.J.; Liu, M.; Yin, G.Y.; Gao, J.; Jiang, X.F.; Lin, X.B.; Li, X.F.; Yu, C.D.; Wang, R. Community composition and activity of anaerobic ammonium oxidation bacteria in the rhizosphere of salt-marsh grass Spartina alterniflora. Appl. Microbiol. Biot. 2016, 100, 8203–8212. [Google Scholar]
  43. Zhang, Z.X.; Zhang, W.Z.; Yang, H.C.; Sheng, R.; Wei, W.X.; Qin, H.L. Elevated N2O emission by the rice roots: Based on the abundances of narG and bacterial amoA genes. Environ. Sci. Pollut. Res. 2017, 24, 2116–2125. [Google Scholar]
  44. Bremer, C.; Braker, G.; Matthies, D.; Reuter, A.; Engels, C.; Conrad, R. Impact of plant functional group, plant species, and sampling time on the composition of nirK-type denitrififier communities in soil. Appl. Environ. Microbiol. 2007, 73, 6876–6884. [Google Scholar] [PubMed]
  45. Yang, Y. Characteristics of Denitrifying Microbial Community Structure and Niche Differentiation in Rhizosphere Soil of Dominant Plants in Ebinur Lake Wetland. Master’s thesis, Shihezi University, Shihezi, China, 2018. [Google Scholar]
  46. Uren, N.C. Types, amounts and possible functions of compounds released into the rhizosphere by soil grown plants. In The Rhizosphere: Biochemistry, and Organic Substances at the Soil Interface; Pinton, R., Varani, Z., Nanniperi, P., Eds.; Marcel Dekker Inc.: New York, NY, USA, 2000; pp. 19–40. [Google Scholar]
  47. Rovira, A.D. Plant root excretions in relation to the rhizosphere effect. Plant Soil 2005, 7, 178–194. [Google Scholar]
  48. Vogel, T.M.; Simonet, P.; Jansson, J.K.; Hirsch, P.R.; Tiedje, J.M.; Elsas, J.D.V.; Bailey, M.J.; Nalin, R.; Philippot, L. Terra Genome: A consortium for the sequencing of a soil metagenome. Nat. Rev. Microbiol. 2009, 7, 252–253. [Google Scholar]
  49. Rasche, F.; Velvis, H.; Zachow, C.; Berg, G.; Elsas, J.D.V.; Sessitsch, A. Impact of transgenic potatoes expressing antibacterial agents on bacterial endophytes is comparable to effects of soil, wild type potatoes, vegetation stage and pathogen exposure. Can. J. Microbiol. 2006, 43, 555–566. [Google Scholar]
  50. Schnitzer, S.A.; Klironomos, J.N.; HilleRisLambers, J.; Kinkel, L.L.; Reich, P.B.; Xiao, K.; Rillig, M.C.; Sikes, B.A.; Callaway, R.M.; Mangan, S.A.; et al. Soil microbes drive the classic plant diversity-productivity pattern. Ecology 2011, 92, 296–303. [Google Scholar]
  51. Bulgarelli, D.; Rot, M.; Schlaeppi, K. Revealing structure and assembly cues for Arabidopsis root-inhabiting bacterial microbiota. Nature 2012, 488, 91–95. [Google Scholar] [PubMed]
  52. Lundberg, D.S.; Lebeis, S.L.; Paredes, S.H.; Yourstone, S.; Gehring, J.; Malfatti, S.; Tremblay, J.; Engelbrektson, A.; Kunin, V.; Rio, T.G.D.; et al. Defining the core Arabidopsis thaliana root microbiome. Nature 2012, 488, 86–90. [Google Scholar]
  53. Su, Y.G.; Huang, G.; Lin, Y.J.; Zhang, Y.M. No synergistic effects of water and nitrogen addition on soil microbial communities and soil respiration in a temperate desert. Catena 2016, 142, 126–133. [Google Scholar]
  54. Keiblinger, K.M.; Hall, E.K.; Wanek, W.; Szukics, U.; Hämmerle, I.; Ellersdorfer, G.; Böck, S.; Strauss, J.; Sterflinger, K.; Richter, A.; et al. The effect of resource quantity and resource stoichiometry on microbial carbon-use-efficiency. FEMS Microbiol. Ecol. 2010, 73, 430–440. [Google Scholar]
Figure 1. Sampling sites in Northeast China.
Forests 14 01794 g001
Figure 2. SOC, TN, TP, and pH values in rhizosphere and non-rhizosphere soils at different depths from (ad) discontinuous permafrost peatland and (eh) continuous permafrost peatland. Cs, Carex schmidtii; Cc, Chamaedaphne calyculata; Lp, Ledum palustre; Bf, Betula fruticosa; Vu, Vaccinium uliginosum; NR, non-rhizosphere soil. Error bars represent the standard error (n = 3).
Forests 14 01794 g002
Figure 3. Bacterial and fungal abundances in rhizosphere and non-rhizosphere soils of (ac) discontinuous permafrost peatland and (df) continuous permafrost peatland. Cs, Carex schmidtii; Cc, Chamaedaphne calyculata; Lp, Ledum palustre; Bf, Betula fruticosa; Vu, Vaccinium uliginosum; NR, non-rhizosphere soil. Different letters indicate significant differences at the p < 0.05 level. Error bars represent the standard error (n = 3).
Forests 14 01794 g003
Figure 4. Abundances of nirK and nirS genes in rhizosphere and non-rhizosphere soils at different depths in (ac) discontinuous permafrost peatland and (df) continuous permafrost peatland. Cs, Carex schmidtii; Cc, Chamaedaphne calyculata; Lp, Ledum palustre; Bf, Betula fruticosa; Vu, Vaccinium uliginosum; NR, non-rhizosphere soil. Different letters indicate significant differences at the p < 0.05 level. Error bars represent the standard error (n = 3).
Forests 14 01794 g004
Figure 5. Abundance of the nifH gene in rhizosphere and non-rhizosphere soils in (a) the peatland of the discontinuous permafrost region and (b) the peatland of the continuous permafrost region. Cs, Carex schmidtii; Cc, Chamaedaphne calyculata; Lp, Ledum palustre; Bf, Betula fruticosa; Vu, Vaccinium uliginosum; NR, non-rhizosphere soil. Different letters indicate significant differences at the p < 0.05 level. Error bars represent the standard error (n = 3).
Forests 14 01794 g005
Figure 6. Redundancy analysis (RDA) of the relationships between (a) topsoil and (b) subsoil bacteria, fungi and functional gene abundances, and soil chemical characteristics in different permafrost regions. Note: open circles represent different plant species. C- and D- indicate continuous and discontinuous permafrost regions, respectively. Cs, Carex schmidtii; Cc, Chamaedaphne calyculata; Lp, Ledum palustre; Bf, Betula fruticosa; Vu, Vaccinium uliginosum; NR, non-rhizosphere soil.
Forests 14 01794 g006
Table 1. Primers and amplification procedures for soil microbial functional genes.
GroupPrimerSequence (5′—3′)Amplification DetailsReference
BacteriaBacteria-338FCCTACGGGAGGCAGCAG95 °C, 2 min, 35 cycles; 95 °C, 30 s; 60 °C, 30 s; 72 °C, 30 s; 80 °C, 15 s[28]
Bacteria-518RATTACCGCGGCTGCTGG
FungiITSIFTCCGTAGGTGAACCTGCGG94 °C, 15 min; 94 °C, 30 s; 59.4 °C, 30 s; 72 °C, 30 s; 80 °C, 30 s, 35 cycles[29]
5.8SCGCTGCGTTCTTCATCG
nirKF1aCuATCATGGTSCTGCCGCG95 °C, 10 min; 6 touchdown cycles: 95 °C, 15 s; 63 °C, 30 s (−1 °C); 72 °C, 30 s; and 95 °C, 15 s; 58 °C, 30 s; 72 °C, 30 s; 80 °C, 30 s, 35 cycles[30]
R3CuGCCTCGATCAGRTTGTGGTT
nirScd3aFGTSAACGTSAAGGARACSGG95 °C, 10 min; 94 °C, 1 min; 57 °C, 1 min; 72 °C, 1 min; 83 °C, 30 s, 40 cycles[31]
R3cdGASTTCGGRTGSGTCTTGA
nifHPolFTGCCAYCCSAARGCBGACTC95 °C, 10 min, 40 cycles; 95 °C, 15 s; 60 °C, 30 s; 72 °C, 30 s; 80 °C, 15 s[32]
PolRATSGCCATCATYTCRCCGGA
Table 2. Results of three-way ANOVA on individual and interactive effects of vegetation type, soil depth, and permafrost type on soil bacteria, fungi, and functional gene abundances (* p < 0.05, ** p < 0.01).
FactorBacteriaFunginirKnirSnifH
Vegetation Type3.814 **3.819 **13.470 **2.671 *0.611
Soil Depth8.640 **0.86276.677 **1.3231.636
Permafrost Type0.3601.59147.942 **0.1230.000
Vegetation Type × Permafrost Type0.6990.60648.258 **2.728 *8.707 **
Permafrost Type × Soil Depth9.520 **6.22 *29.046 **0.0010.376
Vegetation Type × Soil Depth2.274 *3.475 *52.467 **1.9792.312 *
Vegetation Type × Permafrost Type × Soil Depth1.0051.75617.412 **5.283 **4.101 **
Disclaimer/Publisher’s Note: The statements, opinions and data contained in all publications are solely those of the individual author(s) and contributor(s) and not of MDPI and/or the editor(s). MDPI and/or the editor(s) disclaim responsibility for any injury to people or property resulting from any ideas, methods, instructions or products referred to in the content.

