Article

Quantification of Ecosystem Services from Urban Mangrove Forest: A Case Study in Angke Kapuk Jakarta

by
Elham Sumarga
1,*,
Arni Sholihah
1,
Febby Angelina Edi Srigati
2,
Servina Nabila
2,
Puteri Raysa Azzahra
2 and
Naufal Pasya Rabbani
2
1
School of Life Sciences and Technology, Institut Tekonologi Bandung, Jalan Ganesa 10, Bandung 40132, Indonesia
2
Forestry Engineering Study Program, School of Life Sciences and Technology, Institut Teknologi Bandung, Sumedang 45363, Indonesia
*
Author to whom correspondence should be addressed.
Forests 2023, 14(9), 1796; https://doi.org/10.3390/f14091796
Submission received: 30 June 2023 / Revised: 23 August 2023 / Accepted: 25 August 2023 / Published: 3 September 2023
(This article belongs to the Special Issue Coastal Forested Wetland Conservation and Carbon Function)

Abstract

:
Coastal urban areas in Indonesia commonly encounter complex environmental problems, including bad air pollution and high risk of flooding due to sea level rise and land subsidence. The existence of urban mangrove forests potentially contributes to mitigating the environmental problems. Preserving mangrove forests in coastal urban areas requires continuous support from all stakeholders, which can be strengthened by good understanding on the comprehensive benefits provided by these ecosystems. This study aims to quantify key ecosystem services from urban mangrove forest, with a case study in Angke Kapuk Jakarta. Four types of key ecosystem services were quantified, i.e., carbon storage, air pollutant absorption, microclimate regulation, and nature recreation. A vegetation survey was conducted in 30 sample plots to collect data for carbon storage, which covers above-ground carbon, below-ground carbon, and carbon on deadwood. The absorption of six pollutants (CO, NO2, O3, SO2, PM10, and PM2.5) was analysed using the i-Tree Eco model. Field measurements of air temperature and humidity, as well as interviews with 99 visitors, were performed to analyse microclimate regulation. This study found a high quantity of carbon storage within mangrove trees and deadwood in the study area (111.6 tonnes C/ha) as well as high amounts of air pollutants absorbed by mangrove trees (11.3 tonnes/year). Mangrove trees in the study area effectively regulated microclimate conditions, indicated by a significant difference in average daily air temperature and humidity between inside and outside the mangrove forest. Meanwhile, the number of visitors benefiting from its recreation services has fluctuated during the last five years, with an average of 138,550 people per year. We discuss the implications of the findings of this study for urban mangrove forest management, including how to integrate ecosystem services quantification into mangrove preservation and rehabilitation.

1. Introduction

Coastal areas are commonly vulnerable to potential disasters due to climate change [1]. The combination of rising sea levels, storms, and extreme rainfall makes coastal areas more vulnerable to floods [2]. The level of vulnerability to flooding increases with the current trend of land subsidence occurring in many coastal areas, including in Indonesia [3,4]. The increasing risk of flooding worsens the environmental problems faced by big cities in Indonesian coastal areas, which generally have classic urban problems such as waste, water pollution, and air pollution [5,6,7].
There is no single solution to resolve the complex urban environmental problems within coastal areas. Among many options, development of urban mangrove forest may contribute to mitigating these environmental problems [8]. Urban mangrove forest potentially has the capacity to combine the roles of both urban forest and mangrove forest. In this case, urban forest is deemed important for its capability in improving urban environmental conditions through: the absorption of pollutants such as sulphur dioxide, carbon monoxide and nitrogen dioxide; entrapment of dust particles; absorption of carbon dioxide; regulation of temperature and humidity; and provision of recreational services for city residents [9,10,11]. Mangrove forest, on the other hand, edaphically grows in the intertidal zone; hence, it serves as a natural biophysical shield for coastal areas. Mangrove forest is an effective wave barrier and capable of preventing seawater abrasion and intrusion [12,13]. Additionally, mangrove forest also provides a habitat for wild animals and fish spawning grounds that significantly support the sustainability of fishery production for the community [14,15].
Maintaining the existence of mangrove forests in urban areas in Indonesia often encounters deforestation and degradation pressures. Mangrove deforestation and degradation can be categorized as one of the biggest environmental problems in Indonesia, with the rate of mangrove loss of about 182 thousand ha during 2009–2019 [16]. The pressure for the conversion of mangrove forest is very high, especially for the expansion of residential areas, business areas, and aquaculture [17,18,19]. In most cases, economic interest is often used as the main consideration in decision making related to land use conversion.
Maintaining mangrove forests in urban areas requires good understanding of the comprehensive benefits provided by these ecosystems. The concept of ecosystem services, which is the contribution of the ecosystem to providing various benefits for humans, has been widely used to support ecosystem preservation [20,21,22]. An ecosystem services approach can be incorporated in the preservation of urban mangrove forests, among others through proper identification and quantification of their key ecosystem services. Quantifying ecosystem services can help people understand the high value of urban mangrove forest and the benefits of mangrove preservation. Quantified data can be used as educational tools to raise awareness about the benefits of urban mangroves and to promote mangrove preservation among policymakers and the public. Quantification of ecosystem services can also provide baseline data for long-term monitoring of mangrove health and their capacity to provide services. In a broader context, quantified data on ecosystem services of urban mangrove forest can help policy makers make informed choices about land use and conservation policies that balance ecological and economic interests.
The objective of this study is to quantify key ecosystem services from urban mangrove forest, with a case study in Angke Kapuk Jakarta. Four types of key ecosystem services were quantified, i.e., carbon storage, air pollutant absorption, microclimate regulation, and nature recreation. Assessing the biophysical quantity of ecosystem services from an area with a combined role (urban forest and mangrove forest) could be a strength of this study, since there are still limited studies addressing this aspect. Study on the absorption of air pollutants by mangrove trees, for example, is still lacking. Most studies assess ecosystem services from mangrove forest and urban forest separately [23,24,25,26].
Mangrove forest in Angke Kapuk Jakarta experienced very bad deforestation in the past. About 90% of mangroves in the area were converted into illegal aquaculture ponds about two decades ago. The area has been reforested through a continuous mangrove rehabilitation program. This study is then highly relevant both for local and global contexts, i.e., in supporting mangrove rehabilitation in Angke Kapuk Jakarta, and in general in strengthening efforts to preserve urban mangrove forests and their capacity to provide multiple ecosystem services.
This study is multidisciplinary, combining aspects of forestry, environmental health, and urban planning. This study provides scientific enrichment related to the management of urban coastal areas, especially for the aspects of urban mangrove ecosystem services. The results of this study can also be important inputs for further analysis, including for integrating the preservation of mangrove ecosystems and their important ecosystem services into spatial urban planning. A wide range of studies show the importance of ecosystem services data in support of ecosystem preservation and land use planning [27,28,29].

2. Materials and Methods
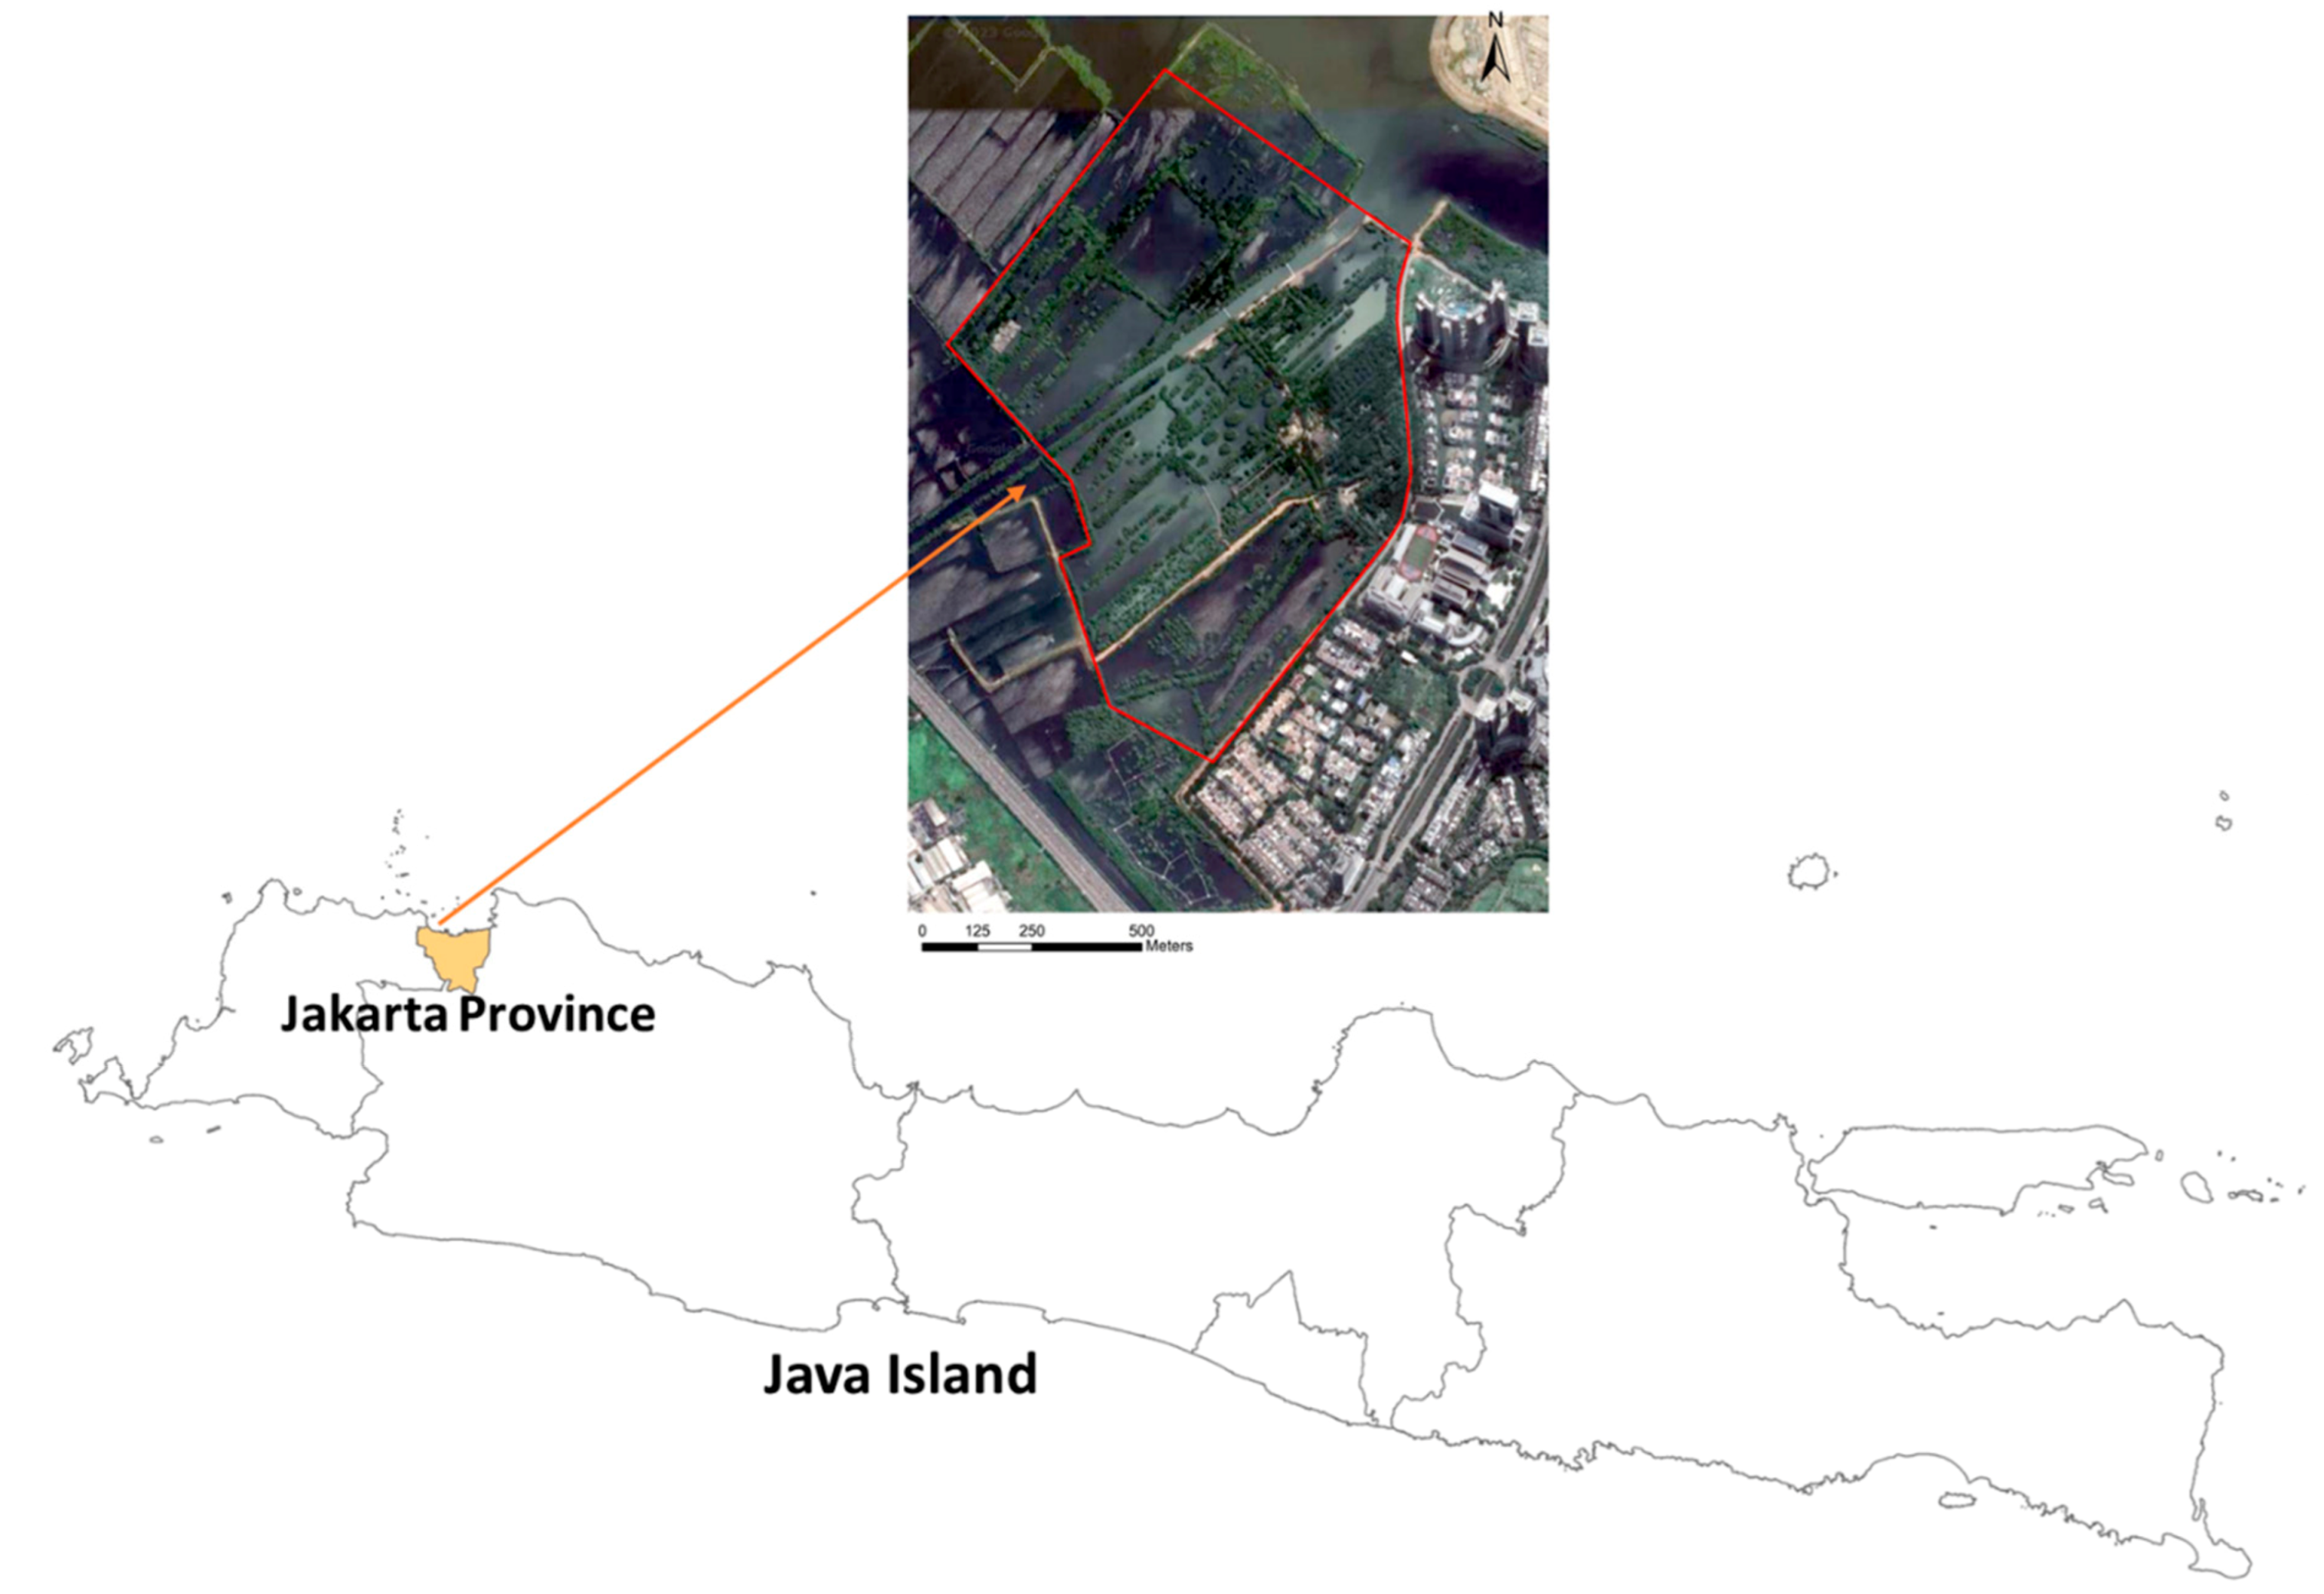
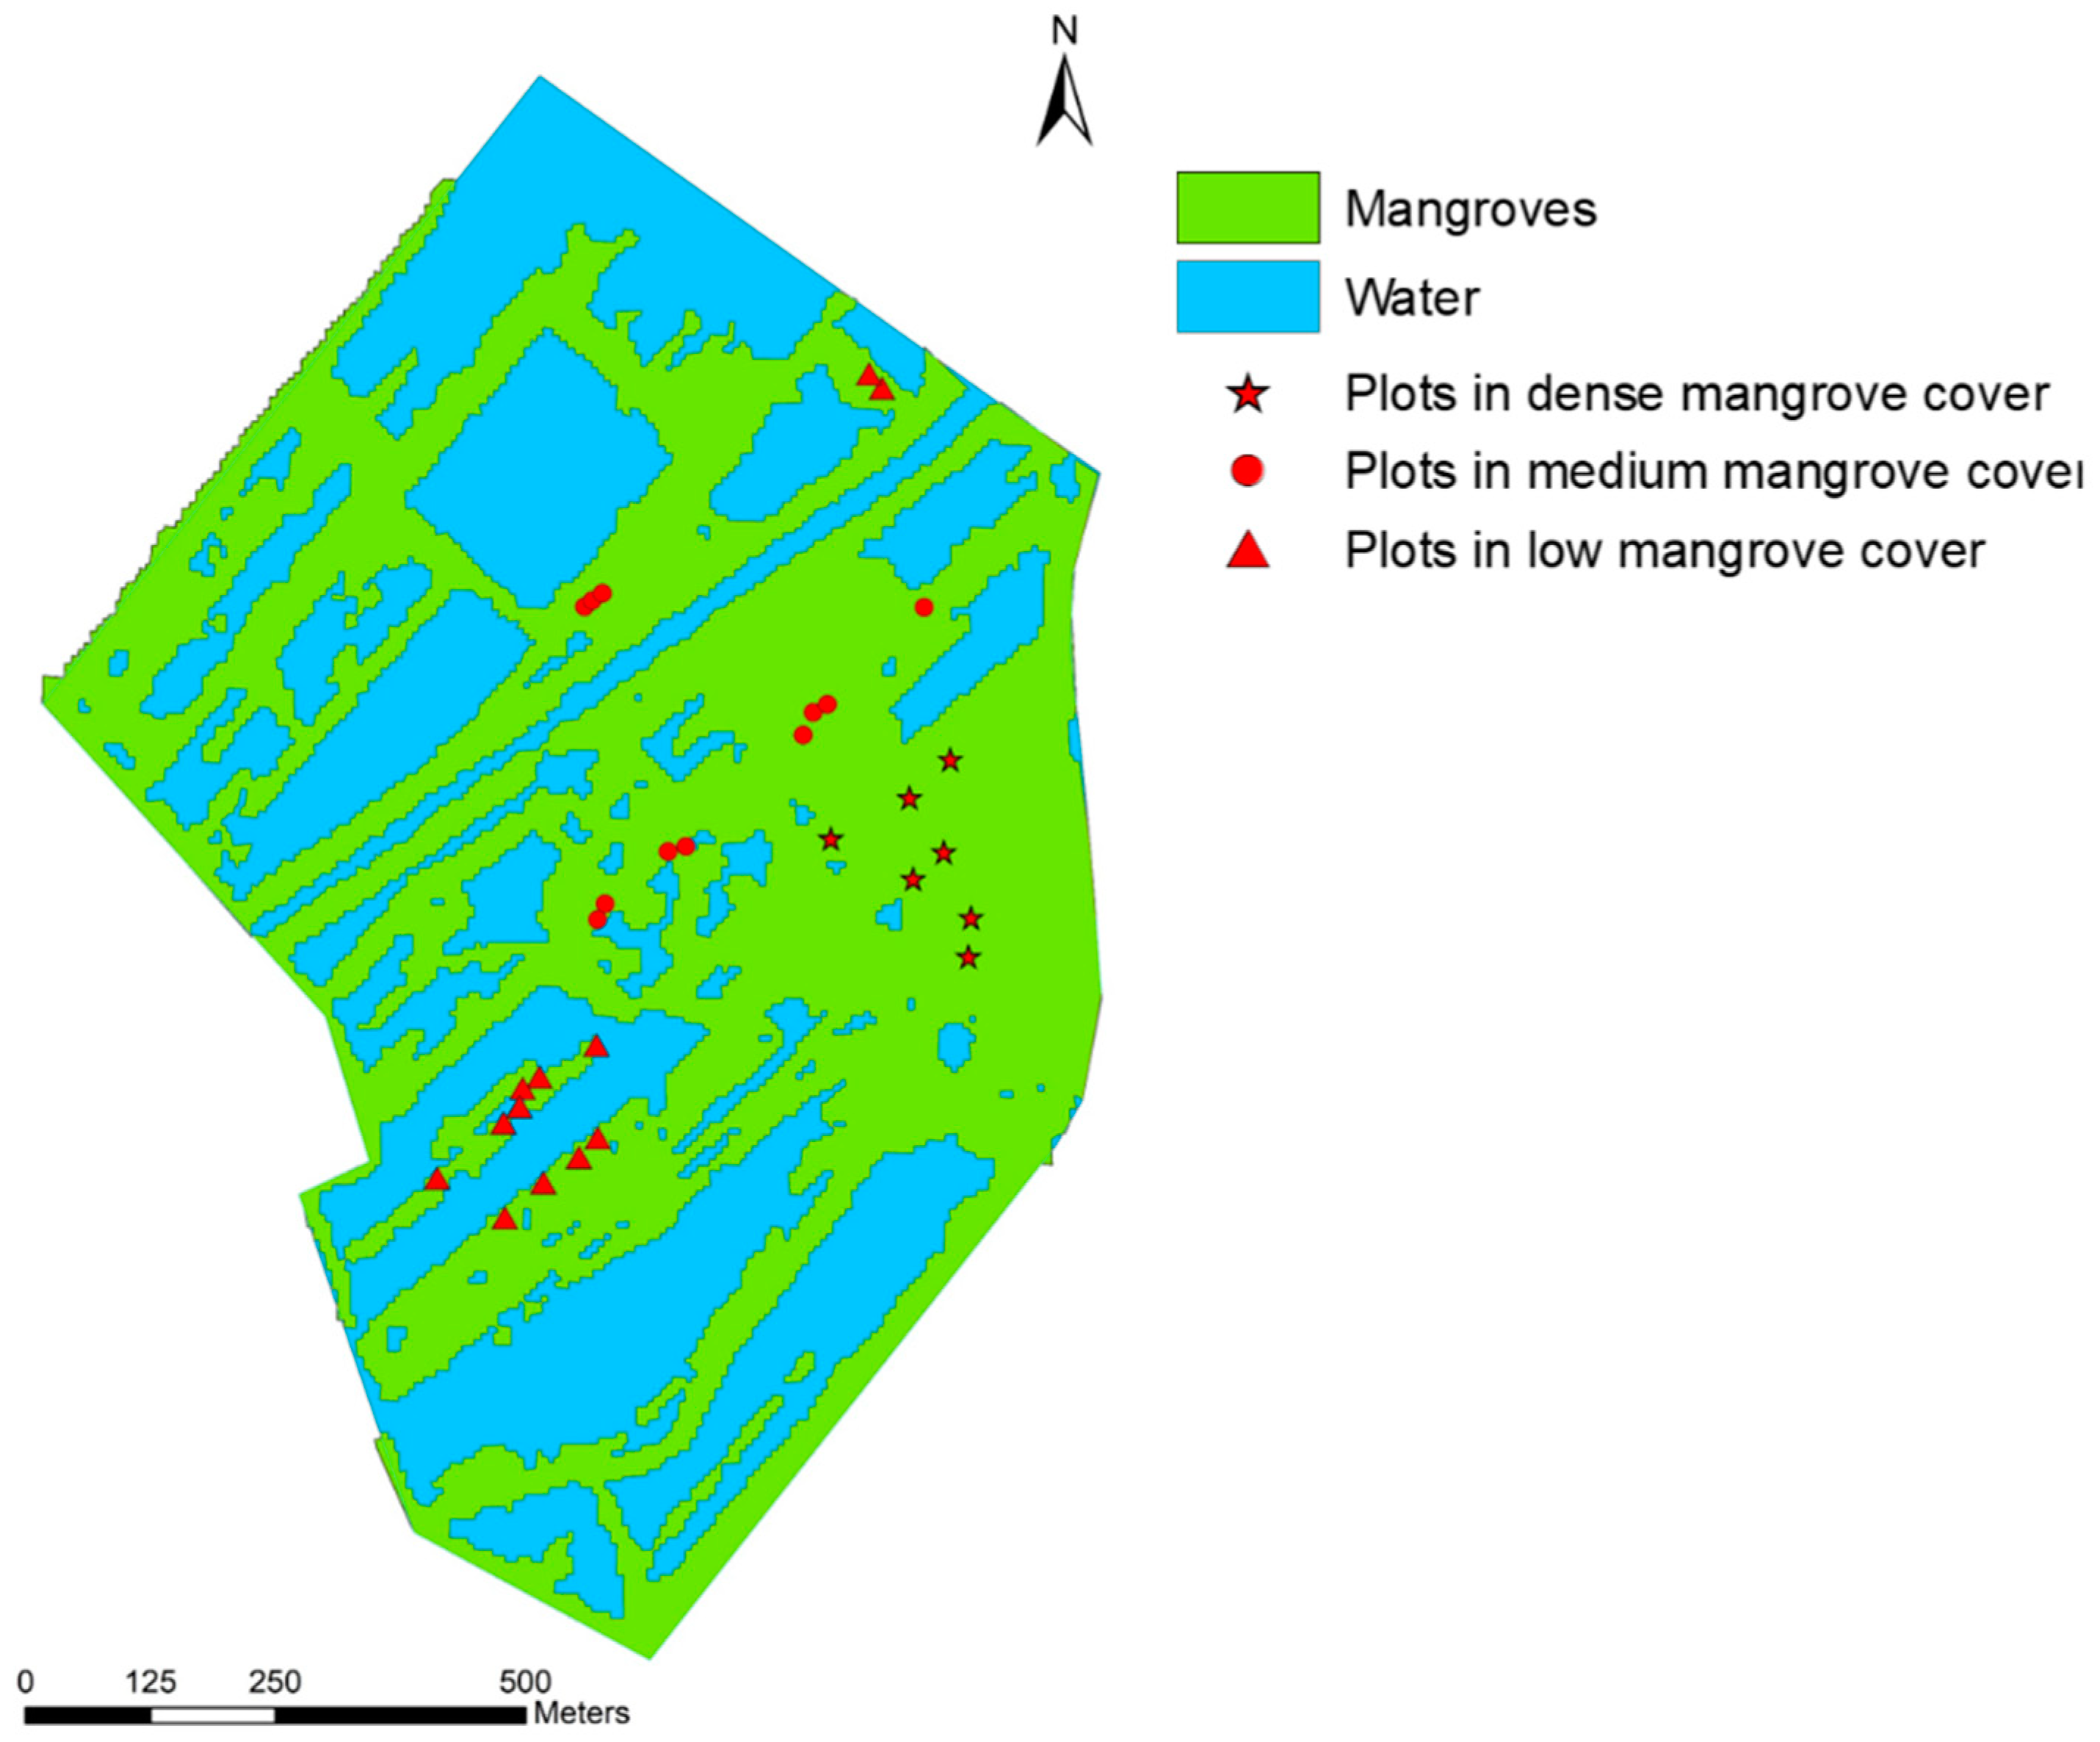
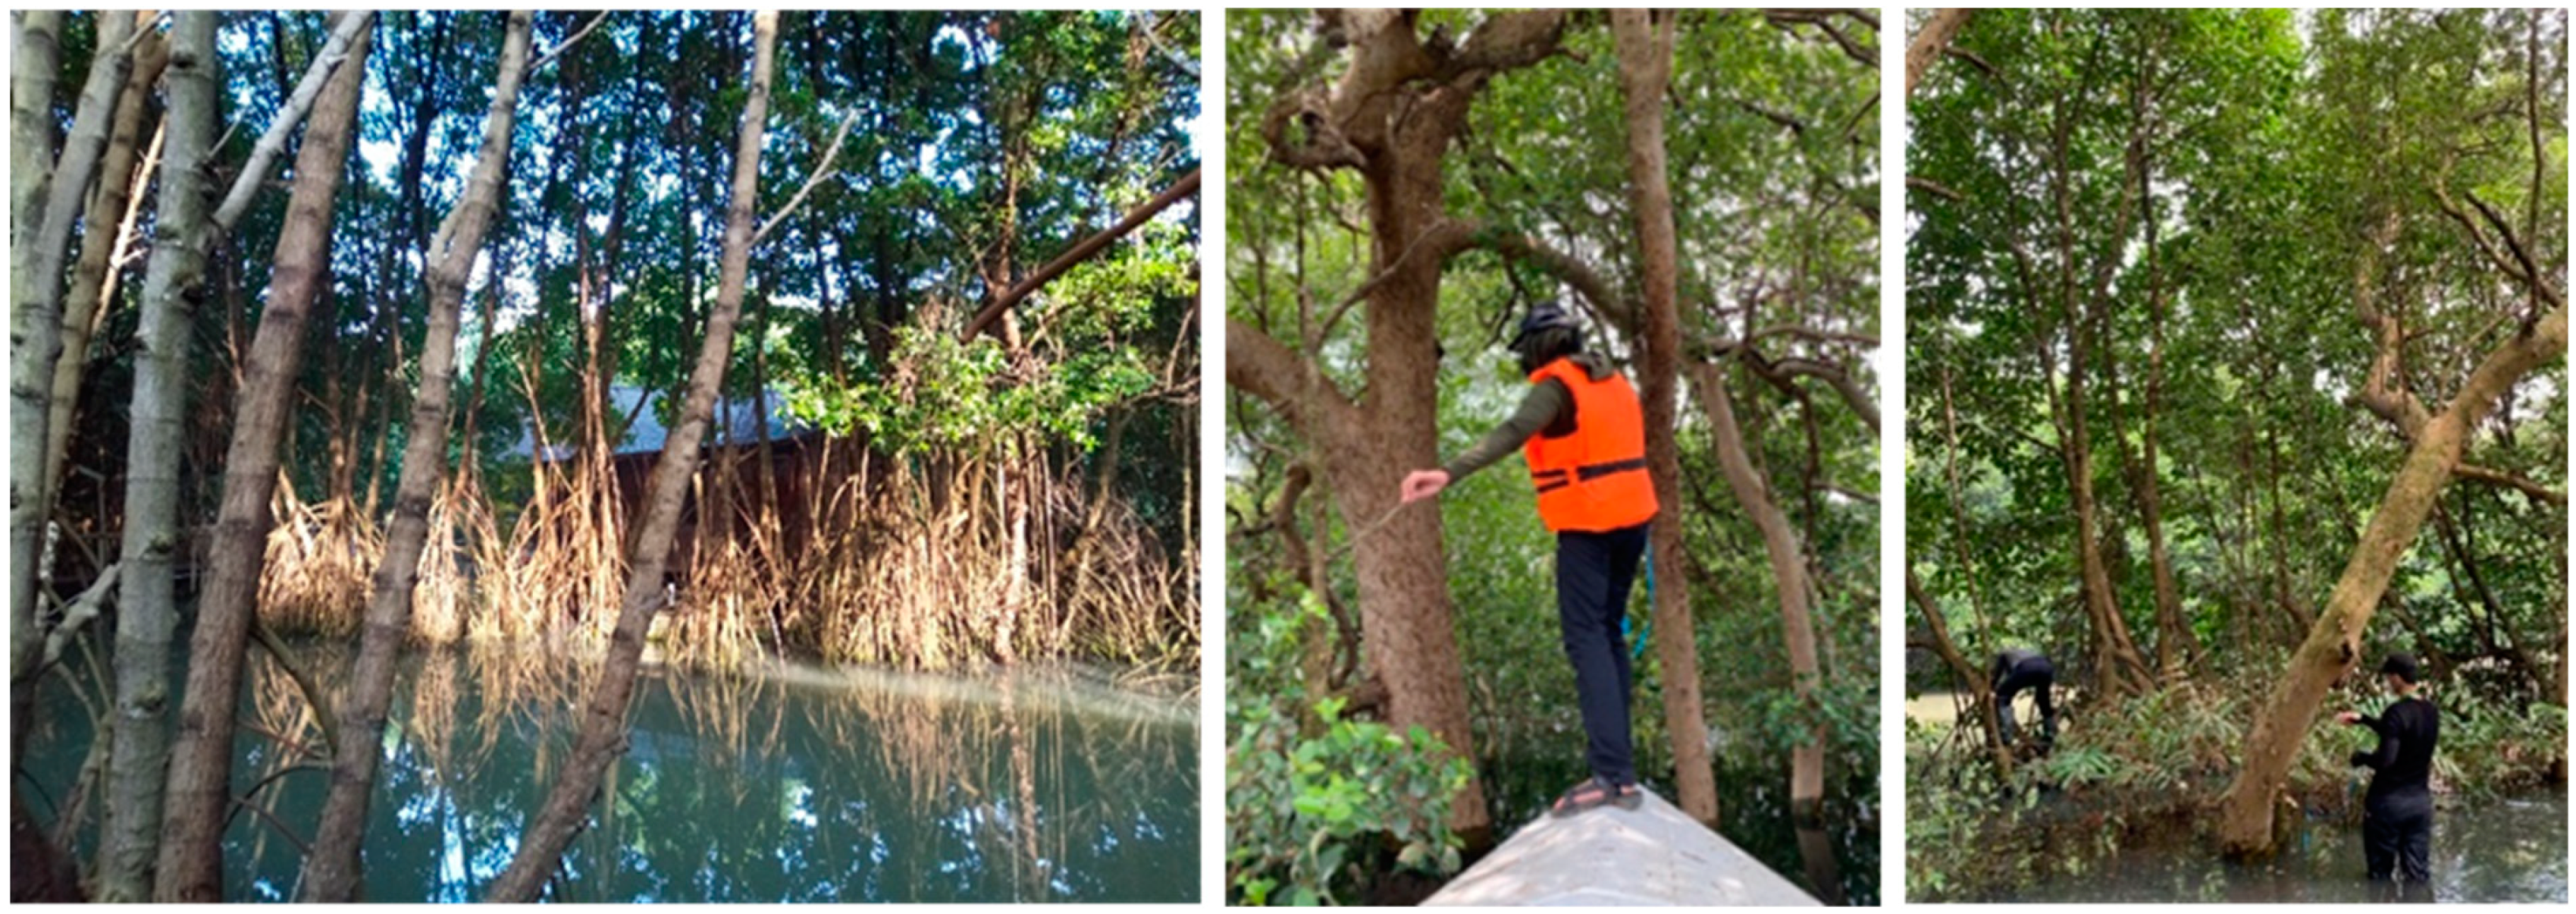
2.1. Study Area

This research was conducted in the urban mangrove forest of Angke Kapuk, Jakarta, with a total area of 99.8 ha. The selection of the study area took into account the existence of Jakarta as a mega-city with complex environmental problems, including the serious threat of climate change. Angke Kapuk is a recreation park with the mangrove ecosystem as the main resource. About 57% of the area is covered by mangrove and the rest is covered by water. Five mangrove tree species are found in this area, with Rhizophora mucronata and Avicennia marina as the dominant species. Geographic information about the study area is presented in Figure 1.

2.2. Data Collection and Analysis

Four types of ecosystem services were analysed in this study, i.e., carbon storage, absorption of pollutants, microclimate regulation, and nature recreation. The procedures of data collection and analysis for the four types of ecosystem services are as follows.

2.2.1. Carbon Storage

This study measured above-ground carbon (AGC), below-ground carbon (BGC), and carbon on deadwood of mangrove to represent carbon storage service. Field data for carbon storage estimation were collected in 30 square plots (10 × 10 m2), proportionally distributed in locations with three different classes of mangrove coverage (Figure 2). Data recorded in each plot included the species name and the diameter at breast height (DBH) of all mangrove trees. Figure 3 presents mangrove vegetation in the study area and measurement activities during field survey. This study used allometric equations (Table 1 and Table 2) to estimate the above-ground biomass (AGB) and below-ground biomass (BGB) of mangrove trees. For biomass of deadwood, the same procedures for AGB measurement were applied, followed by applying correction factors based on the deadwood condition. Correction factors of 0.9, 0.8, and 0.7 were consecutively used for dead tree with branches and twigs, dead tree with main branches, and dead tree without branches and twigs [30]. A ratio of 0.47 was then used for the conversion of biomass into carbon storage [31].

2.2.2. Absorption of Air Pollutants

The absorption of air pollutants was estimated using i-Tree Eco v6 software [37]. The air pollutants analysed are carbon monoxide (CO), nitrogen dioxide (NO2), ozone (O3), sulphur dioxide (SO2), dust particles less than 10 microns (PM10), and dust particles less than 2.5 microns (PM2.5). This software estimates the absorption of air pollutants based on location data, vegetation data, weather data, and air pollution data. Vegetation data (tree species, DBH, and height) were collected from the same plots as for carbon storage measurement. Vegetation data from the sampled plots were used to estimate the vegetation data for the whole study area. Weather and air quality data were selected from the i-Tree Eco database. Considering that there were no data for Jakarta, this study used data for Mexico City in the database. The selection of Mexico City considered the similarity of air pollution conditions in Jakarta and Mexico City. The air pollution indexes of Mexico City and Jakarta in 2022 were 82.3 and 84.4, respectively [38]. Both cities are categorized as big cities located in developing countries with a high population number (11.25 million for Jakarta and 21.28 million for Mexico City) [39].

2.2.3. Microclimate Regulation

The microclimate regulation service in this study was represented by comparing the Temperature–Humidity Index (THI) inside and outside the mangrove park. Air temperature and relative humidity were measured in five locations inside the mangrove park (under mangrove cover), five locations in an open area at a distance of about 50 m from the mangrove park, and five locations in an open area at a distance of about 300 m from the mangrove park. In each location, air temperature and relative humidity were measured on five days, three times a day (9–10 am, 12–1 pm, and 4–5 pm).
The THI was calculated using the following formula [40]:
THI = 0.8 T + ((RH × T)/500)
where:
  • THI = Temperature–Humidity Index.
  • T = Average daily air temperature (°C).
  • RH = Average daily relative air humidity (%).
The THI values were then classified into comfort classes based on the following classification (Table 3) [40].
In addition, this study also measured the comfort level of the microclimate inside the mangrove park based on visitors’ perception. In total 100 respondents were interviewed about the amenity they feel inside the mangrove park. Respondents were asked to give a score between 1 and 100.

2.2.4. Nature Recreation

This study used the number of visitors as an approach to quantify the nature recreation service. Visitor data were obtained from the Angke Kapuk Mangrove Park office. Annual visitor data for the last five years (2018–2022) were used for this analysis. In addition, data on the origin of visitors were also collected, which were classified into three categories: (1) domestic visitors from Jakarta; (2) domestic visitors from outside Jakarta; and (3) visitors from abroad.

3. Results and Discussion

3.1. Carbon Storage

Table 4 presents the estimate of carbon storage in three classes of mangrove cover in the study area. The total carbon storage is composed of AGC, BGC, and carbon in deadwood.
Table 4 shows the high capacity of the mangrove ecosystem in the study area in storing carbon. Compared to another urban mangrove forest in Surabaya Indonesia, for example, the average AGC and BGC in Angke Kapuk are about 80% and 92% higher, respectively [41]. The average AGC in the study area is also higher than that estimated using unmanned aerial vehicles in Pulau Sembilan, North Sumatera Indonesia (42.5 tonnes C/ha) [42]. The combination of AGC and BGC in the study area is comparable to that in an intact rehabilitation mangrove in Subang Indonesia that amounts to 110.3 tonnes C/ha [19]. However, the AGC and BGC in the study area are only about half of the AGC and BGC in primary mangrove in Karimunjawa National Park Indonesia, which amounts to 216.4 tonnes C/ha and 53.9 tonnes C/ha respectively [43]. This indicates the high potential of continuously increasing the capacity of the mangrove ecosystem in the study area in storing carbon, among other things by continuing mangrove rehabilitation and protection.
The high capacity of the mangrove ecosystem in the study area in storing carbon confirms that mangrove ecosystems importantly contribute to mitigating climate change by removing carbon dioxide from the atmosphere. In addition to their ability to effectively capture and store carbon in above-ground biomass, mangrove trees also have extensive and complex root systems that often extend both vertically and horizontally, which provide extensive space for carbon storage. In general, mangrove forests store more carbon than other ecosystems, especially in soils [44,45]. The average global carbon stock per unit area of mangroves is about four times higher than that of rain forests [44]. In many mangrove ecosystems, waterlogged soils slow down the decomposition of organic matter from litter, dead plant material, and trapped organic matter. This results in the accumulation of organic carbon over time [46].

3.2. Absorption of Air Pollutants

The total estimate of pollutants absorbed by mangrove trees in the study area generated by the i-Tree Eco v6 software is 11.3 tonnes/year. The estimate of absorption for each type of pollutant is listed in Table 5, while the estimate of absorption by mangrove species is listed in Table 6.
Jakarta is considered as one of the most polluted cities in the world. Among 7323 cities listed in the world’s most polluted cities 2022 database (iqair.com), Jakarta is ranked 307th. The air quality index of Jakarta in June 2023 ranges from 111 (unhealthy for sensitive groups) to 154 (unhealthy), with an average of 140 (unhealthy for sensitive groups). With the bad air quality of Jakarta, the existence of urban forest is then indispensable to support any efforts in improving air quality in the city. Table 5 and Table 6 shows the crucial contribution of urban mangrove forest in Angke Kapuk in reducing the harmful gases and pollutants in atmosphere. Based on the report on air quality monitoring in Jakarta 2022 [47], the average daily concentration of three types of air pollutants in Jakarta exceeds the WHO air quality guideline value. The three types of pollutants are PM10 (55.3 µg/m3, 3.7 times the WHO guideline), PM2.5 (37.7 µg/m3, 7.5 times the WHO guideline), and NO2 (28.8 µg/m3, 2.9 times the WHO guideline). In particular, for PM2.5, many studies have reported its harmful effects that cause different types of respiratory diseases and even lead to mortality [48,49]. By assuming that the concentration of the pollutants spreads evenly in all area of Jakarta (661.5 km2) with a height of 10 m, the estimates of the total amounts of PM10, PM2.5, and NO2 in Jakarta in 2022 are 133.6 tonnes, 90.45 tonnes, and 69.6 tonnes, respectively. Hence, the contributions of urban mangrove forest in Angke Kapuk in reducing PM10, PM2.5, and NO2 in Jakarta are about 2.8%, 0.4%, and 3.5%, respectively. For all types of pollutants (CO, O3, NO2, SO2, PM10, and PM2.5), urban mangrove forest in the study area absorbs about 0.4% of the total amount of the pollutants in Jakarta. This indicates that, although urban mangrove forest in Angke Kapuk importantly absorbs different types of pollutant, the contribution of the absorption is still insufficient to properly overcome the current level of air pollution in Jakarta. This suggests that there is a high need for continued efforts to establish urban forests and urban greenings in Jakarta, including through mangrove restoration.

3.3. Microclimate Regulation

The average daily air temperature, relative air humidity, and THI measured at 15 locations in the study area are presented in Table 7. The average daily temperature inside the mangrove park is higher than that outside mangrove park, while the average daily relative air humidity inside the mangrove park is lower than that outside the mangrove park. Analysis of variance shows that the difference in both air temperature and relative humidity inside and outside the mangrove park is significant. These findings show the variation in microclimate condition even in some adjacent areas, where the existence of mangrove makes the differences.
Table 7 shows that, based on the Nieuwolt and McGregor [40] classification, the THI both inside and outside the mangrove park are categorized as uncomfortable. However, based on interviews with visitors, the average amenity score for microclimate conditions inside the mangrove park is 82.3%, which can be classified as comfortable. The visitors’ perception of the amenities inside the mangrove park is a relative one, as they compare the amenities inside the park to the amenities outside the park. The visitors’ perception shows that mangrove trees significantly improve the amenity level inside the mangrove park compared to that outside mangrove park. This is confirmed by the significant difference in air temperature and humidity between inside and outside the mangrove park as shown in Table 7. This indicates that trees inside the mangrove park effectively reduce air temperature and improve air humidity through several processes, including evapotranspiration and sunlight blocking. Trees’ evapotranspiration releases water vapor into the air that potentially cools the surrounding air [50,51]. Trees’ canopies also block direct sunlight and reduces heat absorption by buildings and other surfaces, hence lower air temperature [52]. The cooling rate by the mangrove forest found in this study is about similar to the cooling rate found in forest ecosystems in general, where temperatures under forests canopies are on average 1.7 °C cooler than ambient temperatures [53]. This microclimate regulation becomes an important ecosystem service in the study area since mangrove forest in Angke Kapuk is also managed as a recreation area, where the amenity inside the area is much required.

3.4. Nature Recreation

Urban mangrove forest in Angke Kapuk provides a recreation service with the mangrove ecosystem as the main attraction. The most common visitors’ recreation activity in the mangrove park is exploring mangrove using walking track, canoe, or boat. The annual numbers of visitors to Angke Kapuk Mangrove Park from 2018 to 2022 are listed in Table 8. In terms of visitors’ origin, most visitors (54%) are the citizens of Jakarta. About 41% of visitors are domestic visitors from outside Jakarta, and the rest (5%) are overseas visitors. About 31% of visitors are students. This indicates the integration of recreation and education services from natural ecosystems. The mangrove ecosystem in the study area presents opportunities for students to conduct field studies, which allow students to discover and learn about various ecological processes, biodiversity, and the importance of mangrove ecosystems.
Table 8 shows the fluctuation in the annual numbers of visitors to the urban mangrove forest in the study area. The numbers of visitors in 2020 and 2021 are only about one third of that in 2018. This is related to the COVID-19 pandemic in those years, in which the mangrove park was temporarily closed or access was restricted for specific periods. In general people also had limited options for outdoor recreation activities during the pandemic period.
The number of visitors started significantly increasing again in 2022. As more than half of the visitors are the residents of Jakarta, this indicates the importance of the urban mangrove forest in Angke Kapuk in providing a recreation service for Jakarta citizens. The urban mangrove forest offers opportunities for outdoor activities, such as enjoying mangrove through walking track, birdwatching, and canoeing, which can promote physical exercise, reduce stress, and bring people closer to nature. The capability of the mangrove forest in creating a healthier and more comfortable environment by absorbing pollutants and regulating temperature as previously mentioned also attracts city residents to visit the area.

3.5. Implication for Urban Mangrove Forest Management

This study revealed the importance of four key ecosystem services from the urban mangrove forest in Angke Kapuk Jakarta. This points out the important role of the urban mangrove forest in continuously providing and regulating the four ecosystem services: carbon storage; air pollutant absorption; microclimate regulation; and nature recreation. This scientific evidence will serve as strong arguments to encourage public support for urban mangrove protection. These findings should then be properly communicated to all stakeholders, particularly to local community, or in general Jakarta citizens, and policy makers to build a common understanding on mangrove protection.
In the context of preventing any potential destruction caused by human activities, the community’s good understanding of the importance of mangrove forest and its diverse ecosystem services will also be an effective nonphysical buffer. This is highly relevant to the urban mangrove forest in Angke Kapuk that experienced bad deforestation in the past due to illegal fish pond development. Moreover, establishment of a conventional buffer zone [54,55] is difficult to carry out particularly due to the limited area to be allocated in an urban area like Jakarta.
Communicating the importance of mangrove ecosystem services should emphasize both current and long-term benefits people can obtain from a well-protected mangrove forest. People should be well educated that, by protecting mangroves, they are actually investing in future sustainable provision of mangrove ecosystem services. This understanding can stimulate stakeholder engagement and participation in the process of mangrove protection, and create a sense of shared responsibility for the protection.
This study also noticed the opportunity to improve the quantity of the four mangrove ecosystem services in the study area. Besides preserving the current existence of mangrove forest, rehabilitating the remaining degraded areas will significantly improve the performance of mangroves in providing ecosystem services. Figure 1 shows that about 43% of the study area (about 43 ha) is open water area without mangrove cover. This area should be prioritized as the main area for the mangrove rehabilitation program. In particular for the carbon storage service, mangrove rehabilitation in the study area highly supports the national program on climate change mitigation. For the forestry sector, the Indonesian government was committed to achieve a carbon net sink by 2030, through a national program called Indonesia’s FoLU (Forest and other Land Uses) Net Sink 2030 [56]. With this program, the rate of carbon sequestration is targeted to be equal to, or even higher than, carbon emissions by 2030.
One of the biggest challenges for mangrove rehabilitation in the study area is the fact that the open water area is permanently inundated, with most of the area having a depth of more than 2 m. This condition does not allow natural regeneration of mangrove trees. A conventional planting technique of mangrove seedling is also impossible to apply. The main challenge includes how to allow the roots of planted mangrove saplings to properly reach mangrove substrate while preventing the planted saplings from sinking. This condition is worsened by the trend of sea level rising as an impact of climate change as well as the trend of land subsidence in the Jakarta region. The estimated rate of sea level rise is about 3.4 mm/year since the mid-1990s [57], while the estimated rate of land subsidence in Jakarta is around 60 mm/year [58]. Innovations in planting techniques for mangrove trees in deep permanent inundated areas are then much required. All mentioned challenges should be well addressed. Overcoming these obstacles will greatly support the success of mangrove rehabilitation in the study area and in other regions dealing with the same problems.

4. Conclusions

The estimate of carbon storage (above-ground carbon, below-ground carbon, and carbon on deadwood) in mangrove trees in the study area is 111.6 ton C/ha. The total estimate of pollutants (CO, NO2, O3, SO2, PM10, and PM2.5) absorbed by mangrove trees in the study area is 70.3 tonnes/year, mostly absorbed by Avicennia marina and Rhizophora mucronata. The Temperature–Humidity Index (THI) both inside and outside the mangrove park shows uncomfortable conditions, but the score for amenities inside the mangrove park from interviews with visitors is 82.3%, which can be classified as comfortable. Mangrove forests in the study area provide diverse attractions for nature recreation, with annual numbers of visitors ranging from 78,400 to 256,693 people/year in the last five years. The significant impact of four key ecosystem services found in this study indicates the crucial role of urban mangrove forest in the study area and the need to preserve the ecosystem. This study recommends the use of scientific evidence on mangrove ecosystem services in improving people’s understanding and participation in preserving the current existence of mangrove forest, and in rehabilitating the degraded mangrove areas.

Author Contributions

Conceptualization, E.S.; methodology, E.S., A.S., F.A.E.S., S.N., P.R.A. and N.P.R.; software, E.S. and F.A.E.S.; validation, E.S., F.A.E.S. and S.N.; formal analysis, E.S., F.A.E.S. and S.N.; investigation, E.S., A.S., F.A.E.S., S.N., P.R.A. and N.P.R.; resources, E.S.; data curation, F.A.E.S., S.N., P.R.A. and N.P.R.; writing—original draft preparation, E.S.; writing—review and editing, E.S. and A.S.; visualization, E.S., F.A.E.S. and S.N.; supervision, E.S. and A.S.; project administration, E.S.; funding acquisition, E.S. and A.S. All authors have read and agreed to the published version of the manuscript.

Funding

This research was funded by the Institute for Research and Community Services Institut Teknologi Bandung through the excellent research program (Program Riset Unggulan ITB) 2022.

Data Availability Statement

The data presented in this study are available on request from the corresponding author.

Acknowledgments

We thank Pak Djati and other staffs of Angke Kapuk Mangrove Park for their technical support during field observation. We also thank Daffa Raihan and his team for providing complementary data on nature recreation.

Conflicts of Interest

The authors declare no conflict of interest. The funders had no role in the design of the study; in the collection, analyses, or interpretation of data; in the writing of the manuscript; or in the decision to publish the results.

References

  1. Cargiulo, C.; Battarra, R.; Tremiterra, M.R. Coastal areas and climate change: A decision support tool for implementing adaptation measures. Land Use Policy 2020, 91, 104413. [Google Scholar] [CrossRef]
  2. Wu, T. Quantifying coastal flood vulnerability for climate adaptation policy using principal component analysis. Ecol. Indic. 2021, 129, 108006. [Google Scholar] [CrossRef]
  3. Hakim, W.L.; Achmad, A.R.; Lee, C.W. Land subsidence susceptibility mapping in jakarta using functional and meta-ensemble machine learning algorithm based on time-series InSAR data. Remote Sens. 2020, 12, 3627. [Google Scholar] [CrossRef]
  4. Widada, S.; Zainuri, M.; Yulianto, G.; Satriadi, A.; Wijaya, Y.J. Estimation of Land Subsidence Using Sentinel Image Analysis and Its Relation to Subsurface Lithology Based on Resistivity Data in the Coastal Area of Semarang City, Indonesia. J. Ecol. Eng. 2020, 21, 47–56. [Google Scholar] [CrossRef]
  5. Sari, M.M.; Inoue, T.; Harryes, R.K.; Suryawan, I.W.K.; Yokata, K.; Notodarmojo, S.; Priyambada, I.B. Potential of Recycle Marine Debris in Pluit Emplacement, Jakarta to Achieve Sustainable Reduction of Marine Waste Generation. Int. J. Sustain. Dev. Plan. 2022, 17, 119–125. [Google Scholar] [CrossRef]
  6. Widyarani; Wulan, D.R.; Hamidah, U.; Komarulzaman, A.; Rosmalina, R.; Sintawardani, N. Domestic wastewater in Indonesia: Generation, characteristics and treatment. Environ. Sci. Pollut. Res. 2022, 29, 32397–32414. [Google Scholar] [CrossRef] [PubMed]
  7. Syuhada, G.; Akbar, A.; Hardiawan, D.; Pun, V.; Darmawan, A.; Heryati, S.H.A.; Siregar, A.Y.M.; Kusuma, R.R.; Driejana, R.; Ingole, V.; et al. Impacts of Air Pollution on Health and Cost of Illness in Jakarta, Indonesia. Int. J. Environ. Res. Public Health 2023, 20, 2916. [Google Scholar] [CrossRef]
  8. Alemu, J.B.; Richards, D.R.; Gaw, L.Y.F.; Masoudi, M.; Nathan, Y.; Friess, D.A. Identifying spatial patterns and interactions among multiple ecosystem services in an urban mangrove landscape. Ecol. Indic. 2021, 121, 107042. [Google Scholar] [CrossRef]
  9. Barbierato, E.; Bernetti, I.; Capecchi, I.; Saragosa, C. Integrating Remote Sensing and Street View Images to Quantify Urban Forest Ecosystem Services. Remote Sens. 2020, 12, 329. [Google Scholar] [CrossRef]
  10. Nyelele, C.; Kroll, C.N. The equity of urban forest ecosystem services and benefits in the Bronx, NY. Urban For. Urban Green. 2020, 53, 126723. [Google Scholar] [CrossRef]
  11. Wubbelt, A.G.; Fricke, A.; Sebesvari, Z.; Yakouchenkova, I.A.; Fröhlich, K.; Saha, S. High public appreciation for the cultural ecosystem services of urban and peri urban forests during the COVID-19 pandemic. Sustain. Cities Soc. 2021, 74, 103240. [Google Scholar] [CrossRef]
  12. Getzner, M.; Islam, M.S. Ecosystem Services of Mangrove Forests: Results of a Meta-Analysis of Economic Values. Int. J. Environ. Res. Public Health 2020, 17, 5830. [Google Scholar] [CrossRef] [PubMed]
  13. Whidayanti, E.; Handayani, T.; Supriatna; Manessa, M.D.M. A spatial study of mangrove ecosystems for abrasion prevention using remote sensing technology in the coastal area of Pandeglang Regency. IOP Conf. Ser. Earth Environ. Sci. 2021, 771, 012014. [Google Scholar] [CrossRef]
  14. Das, S. Ecological Restoration and Livelihood: Contribution of Planted Mangroves as Nursery and Habitat for Artisanal and Commercial Fishery. World Dev. 2017, 94, 492–502. [Google Scholar] [CrossRef]
  15. Su, J.; Friess, D.A.; Gasparatos, A. A meta-analysis of the ecological and economic outcomes of mangrove restoration. Nat. Commun. 2021, 12, 5050. [Google Scholar] [CrossRef] [PubMed]
  16. Arifanti, V.B.; Novita, N.; Sabarno; Tosiani, A. Mangrove deforestation and CO2 emissions in Indonesia. IOP Conf. Ser. Earth Environ. Sci. 2021, 874, 012006. [Google Scholar] [CrossRef]
  17. Ilman, M.; Dargusch, P.; Dart, P. A historical analysis of the drivers of loss and degradation of Indonesia’s mangroves. Land Use Policy 2016, 54, 448–459. [Google Scholar] [CrossRef]
  18. Sui, L.; Wang, J.; Yang, X.; Wang, Z. Spatial-Temporal Characteristics of Coastline Changes in Indonesia from 1990 to 2018. Sustainability 2020, 12, 3242. [Google Scholar] [CrossRef]
  19. Sumarga, E.; Syamsudin, T.S.; Rahman, S.P.; Putri, A.R.K.; Velia; Aldi, A.A.; Basyuni, M. Maintaining Carbon Storage Does Not Reduce Fish Production from Mangrove-Fish Pond System: A Case Study in Coastal Area of Subang District, West Java, Indonesia. Forests 2022, 13, 1308. [Google Scholar] [CrossRef]
  20. Noe, R.R.; Keeler, B.L.; Kilgore, M.A.; Taff, S.J.; Polasky, S. Mainstreaming ecosystem services in state-level conservation planning: Progress and future needs. Ecol. Soc. 2017, 22, 4. [Google Scholar] [CrossRef]
  21. Li, S.; Yu, D.; Huang, T.; Hao, R. Identifying priority conservation areas based on comprehensive consideration of biodiversity and ecosystem services in the Three-River Headwaters Region, China. J. Clean. Prod. 2022, 359, 13208. [Google Scholar] [CrossRef]
  22. Wang, T.; Chen, X.; Zheng, X.; Lu, Y.; Han, F.; Yang, Z. Identification of Priority Conservation Areas for Natural Heritage Sites Integrating Landscape Ecological Risks and Ecosystem Services: A Case Study in the Bogda, China. Int. J. Environ. Res. Public Health 2022, 19, 2044. [Google Scholar] [CrossRef]
  23. Ruslan, N.F.N.; Goh, H.C.; Hattam, C.; Edwards-Jones, A.; Moh, H.H. Mangrove ecosystem services: Contribution to the well-being of the coastal communities in Klang Islands. Mar. Policy 2022, 144, 105222. [Google Scholar] [CrossRef]
  24. Agustriani, F.; Iskandar, I.; Yazid, M.; Fauziyah. Economic Valuation of Mangrove Ecosystem Services in Sembilang National Park of South Sumatra, Indonesia. J. Hunan Univ. Nat. Sci. 2023, 50, 156–166. [Google Scholar] [CrossRef]
  25. O’Brien, L.E.; Urbanek, R.E.; Gregory, J.D. Ecological functions and human benefits of urban forests. Urban For. Urban Green. 2022, 75, 127707. [Google Scholar] [CrossRef]
  26. Intan, D.Z.; Yuniati, R.; Lestari, R. Comparative study on Pb absorption ability of five shade plant species in industrial estate and urban forests of Bekasi, Indonesia. Biodiversitas 2023, 24, 1289–1294. [Google Scholar]
  27. Lin, C.Y.; Fu, C.Y.; Liu, Y.; Zhang, M.Q.; Liu, Y.; Wu, W.Y.; Wang, L.X.; Lin, X.H.; Fu, X.M. Assessing the changes of the monetary value of mangrove ecosystem services in China and its application. Front. Environ. Sci. 2022, 10, 1018801. [Google Scholar] [CrossRef]
  28. Pertiwi, N.; Tsusaka, T.W.; Nguyen, T.P.L.; Abe, I.; Sasaki, N. Nature-based Carbon Pricing of Full Ecosystem Services for Peatland Conservation—A Case Study in Riau Province, Indonesia. Nat. Based Solut. 2022, 2, 100023. [Google Scholar] [CrossRef]
  29. Sun, C.; Wu, J.; Tang, H.; Yang, P. An urban hierarchy-based approach integrating ecosystem services into multiscale sustainable land use planning: The case of China. Resour. Conserv. Recycl. 2022, 178, 106097. [Google Scholar] [CrossRef]
  30. Rusolono, T.; Tiryana, T.; Purwanto, J. Guidance for Carbon Storage and Biodiversity Survey in South Sumatera; Biodiversity and Climate Change Project; German International Cooperation-GIZ: Bonn, Germany; South Sumatera Forestry Agency: South Sumatera, Indonesia, 2015. [Google Scholar]
  31. Aalde, H.; Gonzalez, P.; Gytarsky, M.; Krug, T.; Kurz, W.A.; Ogle, S.; Raison, J.; Schoene, D.; Ravindranath, N.H.; Elhassan, N.G.; et al. Chapter 4: Forest land. 2006 IPCC Guidelines for National Greenhouse Gas Inventories. 2006. Available online: https://www.ipcc-nggip.iges.or.jp/public/2006gl/pdf/4_Volume4/V4_04_Ch4_Forest_Land.pdf (accessed on 30 August 2022).
  32. Komiyama, A.; Poungparn, S.; Kato, S. Common allometric equation for estimating the tree wight of mangroves. J. Trop. Ecol. 2005, 21, 471–477. [Google Scholar] [CrossRef]
  33. Ong, J.E.; Gong, W.K.; Wong, C.H. Allometry and partitioning of the mangrove, Rhizophora apiculata. For. Ecol. Manag. 2004, 188, 395–408. [Google Scholar] [CrossRef]
  34. Dharmawan, I.W.S. Estimation of above ground biomass of Rhizophora mucronata in Ciasem, Purwakarta. J. Ilmu Pertan. Indones. 2010, 15, 50–56. [Google Scholar]
  35. Kusmana, C.; Hidayat, T.; Tiryana, T.; Rusdiana, O. Allometric models for above-and below-ground biomass of Sonneratia spp. Glob. Ecol. Conserv. 2018, 15, e00417. [Google Scholar] [CrossRef]
  36. Talan, M.A. Allometric Equation for Estimating above Ground Biomass of Xylocarpus granatum in Natural Mangrove Forest in Batu Ampar-West Kalimantan. Bachelor’s Thesis, Faculty of Forestry, Bogor Agricultural University, Dramaga, Indonesia, 2008. [Google Scholar]
  37. Nowak, D.J.; Hirabayashi, S.; Kroll, C.N. i-Tree Eco Dry Deposition Model Descriptions; Syracuse: New York, NY, USA, 2015. [Google Scholar]
  38. Numbeo. Pollution Index by City 2022. Available online: https://www.numbeo.com/pollution/rankings.jsp?title=2022 (accessed on 31 May 2022).
  39. World Population Review. World City Populations 2023. Available online: https://worldpopulationreview.com/world-cities (accessed on 2 August 2023).
  40. Nieuwolt, S.; Mc Gregor, G.R. Tropical Climatology, An Introduction to the Climates of the Low Latitude; John Wiley and Sons: New York, NY, USA, 1998. [Google Scholar]
  41. Hidayah, Z.; Rachman, H.A.; As-Syakur, A.R. Mapping of mangrove forest and carbon stock estimation of east coast Surabaya, Indonesia. Biodiversitas 2022, 23, 4826–4837. [Google Scholar] [CrossRef]
  42. Basyuni, M.; Wirasatriya, A.; Iryanthony, S.B.; Amelia, R.; Slamet, B.; Sulistiyono, N.; Pribadi, R.; Sumarga, E.; Eddy, S.; Al Mustaniroh, S.S.; et al. Aboveground biomass and carbon stock estimation using UAV photogrammetry in Indonesian mangroves and other competing land uses. Ecol. Inform. 2023, 77, 102227. [Google Scholar] [CrossRef]
  43. Wicaksono, P.; Danoedoro, P.; Hartono; Nehren, U. Mangrove biomass carbon stock mapping of the Karimunjawa Islands using multispectral remote sensing. Int. J. Remote Sens. 2016, 37, 26–52. [Google Scholar] [CrossRef]
  44. Alongi, D.M. Carbon sequestration in mangrove forests. Carbon Manag. 2014, 3, 313–322. [Google Scholar] [CrossRef]
  45. Murdiyarso, D.; Purbopuspito, J.; Kauffman, J.; Warren, M.W.; Sasmito, S.D.; Donato, D.C.; Manuri, S.; Krisnawati, H.; Taberima, S.; Kurnianto, S. The potential of Indonesian mangrove forests for global climate change mitigation. Nat. Clim. Chang. 2015, 5, 1089–1092. [Google Scholar] [CrossRef]
  46. Hamzeh, M.A.; Lahijani, H.A.K. Soil and Vegetative Carbon Sequestration in Khuran Estuary Mangroves, Strait of Hormoz, During the Last 18 Centuries. Estuaries Coasts 2022, 45, 1583–1595. [Google Scholar] [CrossRef]
  47. Turyanti, A.; Salmayenti, R.; Rohmawati, F.Y.; Fauziyah, N.; Yulian, N.I. Final Report on Air Quality Monitoring in Jakarta 2022; Life Environment Office of Jakarta: Jakarta, Indonesia, 2022. [Google Scholar]
  48. Hein, L.; Spadaro, J.V.; Ostro, B.; Hammer, M.; Sumarga, E.; Salmayenti, R.; Boer, R.; Tata, H.; Atmoko, D.; Castañeda, J.P. The health impacts of Indonesian peatland fires. Environ. Health 2022, 21, 62. [Google Scholar] [CrossRef] [PubMed]
  49. Rashidi, R.; Khaniabadi, Y.O.; Sicard, P.; Demarco, A.; Anbari, K. Ambient PM2.5 and O3 pollution and health impacts in Iranian megacity. Stoch. Environ. Res. Risk Assess. 2023, 37, 175–184. [Google Scholar] [CrossRef] [PubMed]
  50. Chen, X.; Zhao, P.; Hu, Y.; Ouyang, L.; Zhu, L.; Ni, G. Canopy transpiration and its cooling effect of three urban tree species in a subtropical city- Guangzhou, China. Urban For. Urban Green. 2019, 43, 126368. [Google Scholar] [CrossRef]
  51. Rana, G.; Ferrara, R.M. Air cooling by tree transpiration: A case study of Olea europaea, Citrus sinensis and Pinus pinea in Mediterranean town. Urban Clim. 2019, 29, 100507. [Google Scholar] [CrossRef]
  52. Rahman, M.A.; Moser, A.; Rötzer, T.; Pauleit, S. Comparing the transpirational and shading effects of two contrasting urban tree species. Urban Ecosyst. 2019, 22, 683–697. [Google Scholar] [CrossRef]
  53. de Frenne, P.; Zellweger, F.; Rodríguez-Sánchez, F.; Scheffers, B.; Hylander, K.; Luoto, M.; Vellend, M.; Verheyen, K.; Lenoir, J.R.M.H. Global buffering of temperatures under forest canopies. Nat. Ecol. Evol. 2019, 3, 744–749. [Google Scholar] [CrossRef] [PubMed]
  54. Sayer, J. Rainforest Buffer Zones: Guidelines for Protected Area Managers; IUCN: Gland, Switzerland, 1991. [Google Scholar]
  55. Sumarga, E.; Suwandhi, I.; Haitaunnisa; Nurahman, A.Y.; Susilowardani, D.; Shadida, A. Disturbances-based plan of delineating protected area’s buffer zone: A case study in Masigit Kareumbi Mountain, West Java, Indonesia. Biodiversitas 2021, 22, 5115–5122. [Google Scholar] [CrossRef]
  56. Indonesian Ministry of Environment and Forestry. Operational Plan Indonesia’s Folu Net Sink 2030. 2022. Available online: https://www.menlhk.go.id/site/single_post/4705/operational-plan-indonesia-s-folu-net-sink-2030 (accessed on 29 June 2023).
  57. Gehrels, L.; Garrett, E. Rising sea levels as an indicator of global change. In Climate Change: Observed Impacts on Planet Earth; Letcher, T.M., Ed.; Elsevier: Amsterdam, The Netherlands; Oxford, UK; Cambridge, MA, USA, 2021. [Google Scholar]
  58. Bott, L.M.; Schöne, T.; Illigner, J.; Haghighi, M.H.; Gisevius, K.; Braun, B. Land subsidence in Jakarta and Semarang Bay—The relationship between physical processes, risk perception, and household adaptation. Ocean Coast. Manag. 2021, 211, 105775. [Google Scholar] [CrossRef]
Figure 1. Geographical information on Angke Kapuk Mangrove Park, which is located on the north coast of Jakarta.
Forests 14 01796 g001
Figure 2. Distribution of vegetation plot samples (7 plots in dense mangrove cover; 11 plots in medium mangrove cover; and 12 plots in low mangrove cover).
Forests 14 01796 g002
Figure 3. General description of mangrove vegetation in the study area and measurement activities during field survey.
Forests 14 01796 g003
Table 1. Allometric equations for AGB estimation.
Mangrove SpeciesAllometric EquationsSources
Avicennia marina 0.308 × D 2.11 Komiyama et al. [32]
Rhizophora apiculata 0.235 × D 2.42 Ong et al. [33]
Rhizophora mucronata 0.1466 × D 2.3136 Dharmawan [34]
Sonneratia spp. 0.258 × D 2.287 Kusmana et al. [35]
Xylocarpus granatum 0.1832 × D 2.59 Talan et al. [36]
AGB: Above-ground biomass (kg); D: tree DBH (cm).
Table 2. Allometric equations for BGB estimation.
Mangrove SpeciesAllometric EquationsSources
Avicennia marina 1.28 × D 1.17 Komiyama et al. [32]
Rhizophora apiculata 0.00698 × D 2.61 Ong et al. [33]
Rhizophora mucronata 0.00974 × D 2 H 1.05 Komiyama et al. [32]
Sonneratia spp. 0.230 × ρ × ( D 2 H ) 0.74 Kusmana et al. [35]
Xylocarpus granatum 0.145 × D 2.55 Komiyama et al. [32]
BGB: Below-ground biomass (kg); D: tree DBH (cm).
Table 3. Comfort classes based on THI.
NoComfort ClassesTHI
1Comfortable21–24
2Moderate25–26
3Uncomfortable>26
Table 4. Carbon storage in three classes of mangrove cover in the study area.
Mangrove CoverAbove-Ground Carbon (tonnes C/ha)Below-Ground Carbon (tonnes C/ha)Carbon in Deadwood (tonnes C/ha)Carbon Storage 1
(tonnes C/ha)
Area
(ha)
Carbon Total (tonnes)
Low 54.313168.322.81555.6
Moderate 96.623.30.3120.220.92511.6
Dense 114.153.64.7172.413.32289.1
Total 576356.3
Average83.726.31.6111.6
1 Total carbon storage combining AGC, BGC, and carbon in deadwood.
Table 5. Absorption of six types of air pollutant by mangrove trees in the study area.
NoPollutantsAbsorption by Mangrove (kg/Year)
1CO209.4
2O33768.8
3NO22470.8
4SO2704.1
5PM103773.6
6PM2.5373.7
Total11,300.4
Table 6. Absorption of pollutants by mangrove tree species.
NoSpeciesNumber of TreesAbsorption of Pollutant (ton/Year)
1Avicennia marina30,3843.4
2Rhizophora apiculata15180.1
3Rhizophora mucronata52,7577.7
4Sonneratia caseolaris3790.07
5Xylocarpus granatum1900.01
Total85,22811.3
Table 7. Average daily air temperature, relative air humidity, and THI measured at 15 locations in the study area.
LocationMean and Standard Deviation of Daily Air Temperature (°C)Mean and Standard Deviation of Daily Relative Air Humidity (%)Mean and Standard Deviation of Daily THI
Inside Mangrove Park50 m from Mangrove Park300 m from Mangrove ParkInside Mangrove Park50 m from Mangrove Park300 m from Mangrove ParkInside Mangrove Park50 m from Mangrove Park300 m from Mangrove Park
130.05 ± 0.4231.41 ± 1.4631.55 ± 1.4172.56 ± 2.0968.26 ± 6.8165.09 ± 6.2528.40 ± 0.4129.40 ± 0.9729.33 ± 1.02
230.17 ± 0.7831.25 ± 1.3931.54 ± 1.4471.95 ± 2.7867.07 ± 6.3165.77 ± 4.9228.48 ± 0.7129.18 ± 1.0529.37 ± 1.07
330.01 ± 0.6831.42 ± 1.5931.57 ± 1.673.76 ± 3.4468.65 ± 7.9564.96 ± 5.928.44 ± 0.5529.43 ± 1.0129.35 ± 1.13
430.24 ± 1.0131.79 ± 1.531.6 ± 1.7473.99 ± 3.2866.63 ± 6.4765.13 ± 7.0928.67 ± 0.8629.65 ± 0.9829.37 ± 1.16
529.93 ± 0.8631.01 ± 0.931.36 ± 1.4174.33 ± 2.9667.81 ± 6.5665.33 ± 6.728.39 ± 0.7829.01 ± 0.529.17 ± 0.89
Mean30.08 ± 0.7231.38 ± 1.331.52 ± 1.473.32 ± 2.8467.68 ± 6.2965.26 ± 5.6828.47 ± 0.6329.33 ± 0.8729.32 ± 0.97
Table 8. Numbers of visitors to Angke Kapuk Mangrove Park 2018–2022.
YearNumber of Visitors
2018256,693
2019169,530
202078,400
202187,852
2022100,276
Disclaimer/Publisher’s Note: The statements, opinions and data contained in all publications are solely those of the individual author(s) and contributor(s) and not of MDPI and/or the editor(s). MDPI and/or the editor(s) disclaim responsibility for any injury to people or property resulting from any ideas, methods, instructions or products referred to in the content.

