Abstract
It is of great significance to accurately assess the carbon sink capacity and trend of forest ecosystems on a regional scale, which is a key step to realizing sustainable forest management and carbon sink. Based on several remote sensing datasets, this study analyzes the dynamic characteristics of forest carbon stock in the Yangtze River Basin and its response to environmental factors using the Mann–Kendall nonparametric test, correlation analysis, and BP neural network during 2005–2020. The results show that forest carbon stock in the Yangtze River Basin shows a fluctuating upward trend, with an average annual growth rate of 0.91%. Forest carbon stock in western high-altitude areas and areas with high human activity in the east showed a downward trend, while the central plains showed a stable growth trend. In the vast plains of the Yangtze River Basin, a suitable drought degree (−0.5 < SPEI < 0.5) is helpful to the accumulation of forest carbon reserves. In the future, rich forest resources should be fully developed to promote synergy between environmental protection and economic development from the perspective of developing green carbon trading, such as the carbon-sink forestry projects of CCER.
1. Introduction
The carbon cycle supports a large part of the material cycle in terrestrial ecosystems and is the basis for the exchange of materials and energy in individual ecosystems [1]. Forests are the largest reservoir of organic carbon in terrestrial ecosystems, and the dynamics of their carbon pools directly and indirectly affect greenhouse gas fluxes on a global scale [2]. As the main body of terrestrial ecosystems, forests store the aboveground and underground parts of terrestrial ecosystem organic carbon and are the necessary guarantee and development foundation for human survival [3]. Forest ecosystems play an irreplaceable role in supporting sustainable economic and social development and also play an extremely important role in global carbon balance [4].
The enormous advantages of forests in improving the environment have attracted widespread attention. Accurately grasping the distribution of forest carbon stock and paying timely attention to the development trend and evolution characteristics of forest carbon stock is very important for maintaining the stability of the national ecosystem [5]. At the same time, it is also the guarantee of sustainable development in China, and the study of forest carbon stock changes in key ecological areas can provide a reference basis for China’s carbon sink-related economic activities [6]. However, as the global temperature rises year by year, the global climate gradually warms, which seriously affects the development of the ecological environment and human economy while also affecting the carbon sequestration process of forests [7]. In addition to natural factors such as temperature, precipitation, sunlight and evapotranspiration, urban expansion, and farmland reclamation, as well as a series of ecological measures taken by humans from the perspective of environmental conservation, affect the accumulation of forest carbon stocks from both positive and negative aspects [8]. Recently, many studies have explored the carbon stock, carbon density, and carbon sink function of forest ecosystems at different scales (global, national scale, geographical unit, and plot) [6,9,10,11,12]. These studies cover the changes in carbon stocks in different regions and types of forests and their relationship with the forest structure, forest age, and environmental factors. Most of China’s research on forest carbon stock is on a national and provincial level in administrative regions, and due to geographical limitations, it is hard to fully assess the carbon stock of forest ecosystems and the ecological value it brings. At present, most of the research on forest vegetation carbon stock and its dynamic changes in the watershed focuses on local areas and lacks the study of the entire watershed.
The Yangtze River Basin is a hot spot for biodiversity conservation in China and a key area for ecological environmental protection [13]. Since the last century, China has successively initiated and implemented forestry projects in the Yangtze River Basin, such as the construction of a shelter forest system, the return of farmland to the forest, the protection of natural forests, and the construction of nature reserves. These projects have effectively protected forest resources, increased the forest area, and improved the ecological environment [14]. An understanding of the dynamic changes and evolution of forest carbon stocks in the Yangtze River Basin is helpful in providing a scientific basis for the sustainable development of forest resources in the entire basin [15]. There are differences in carbon storage estimated using different data sources in the Yangtze River Basin. Based on the satellite observation and LPJ model, it was found that forest carbon storage in the Yangtze River Basin increased from 2563.91 Tg C in 1993 to 2893.17 Tg C in 2012. Meanwhile, forest biomass was found to be sensitive to changes in temperature [16]. Forest inventory data are also valuable for estimating forest carbon stocks. Based on the continuous national forest resources inventory data, the forest carbon stock in the Yangtze River Basin was estimated to increase from 1345.30 Tg C to 1924.98 Tg C during the period from 1989 to 2008. This study points out that the middle and upper reaches of the Yangtze River are the main contributors to forest vegetation carbon storage in the basin [17]. While exploring forest carbon storage, the impact of human activities on forest carbon stock has also been noticed. The research on urbanization and the balance between the supply and demand of carbon pools showed that during 2000–2020, the continuous advancement of urbanization greatly promoted the demand for carbon storage [18]. On the other hand, the change in land use policy also deeply affects the change in forest carbon storage. Before 1990, disorderly urban expansion led to the serious loss of forest carbon stocks. From 1990 to 2015, with the improvement in management measures and the implementation of various protection measures, the forest carbon stock in the Yangtze River Delta and other human-populated areas has been protected [19]. The estimation of forest carbon storage and the assessment of human impact in the Yangtze River basin is of guiding significance to economic development and environmental protection.
Based on long-term remote sensing data products, this study analyzed the dynamic characteristics of forest carbon stock in the Yangtze River Basin with mathematical statistical methods and neural network methods. This study aims to explore the influence of different environmental factors on forest carbon stock in this area and a provide scientific basis for the formulation of forest protection plans and resource development plans in the Yangtze River Basin in China.
2. Materials and Methods
2.1. Study Area
This study focuses on forest carbon stock in the Yangtze River Basin (Figure 1). The Yangtze River Basin (90°33′ E~122°25′ E, 24°30′ N~35°45′ N) refers to the vast area through which the mainstream and tributaries of the Yangtze River flow, spanning three major economic zones in the eastern, center, and western sections of China, and is the third largest river basin in the world. The Yangtze River Basin covers an area of about 1.8 million square kilometers, accounting for 18.8% of China’s land area, which is rich in natural resources. It is in the shape of three steps, high in the west and low in the east, with a total drop of about 6000 m. The Yangtze River basin contains many geographical units, such as mountains, plateaus, basins, hills, and plains. The average annual precipitation in the Yangtze River Basin is about 1100 mm, and the temporal and spatial distribution of precipitation is very uneven due to the influence of the monsoon climate and complex topography. The temperature in the Yangtze River Basin is affected by topographic factors, and the annual average temperature shows a distribution trend of high in the east, low in the west, high in the south, and low in the north. The average temperature in the whole basin is about 14 °C, and the temperature in the middle and lower reaches is higher than in the upper regions. The vegetation of the Yangtze River Basin is rich and diverse, and the west holds a desert vegetation area composed of sparse grassland and alpine meadows, while the middle and lower plains are subtropical vegetation areas. The main forest types in the Yangtze River Basin include a deciduous broad-leaved mixed forest, an evergreen broad-leaved mixed forest, an evergreen broad-leaved forest, and montane evergreen coniferous and broad-leaved mixed forest. Major tree species include Liriodendron Chinese, Davidia involucrate, Pinus taiwanensis, Castanopsis hystrix, Eucommia ulmoides, and Pteroceltis tatarinowii. The soil in the Yangtze River Basin holds complex causes, with red and yellow soil widely distributed in most areas south of the Yangtze River, while yellow-brown soil is mainly distributed to the north of the Yangtze River Basin. The Yangtze River basin accounts for about 25% of China’s forest stock, and more than 100 nature reservations with multiple conservation targets have been established in the basin.
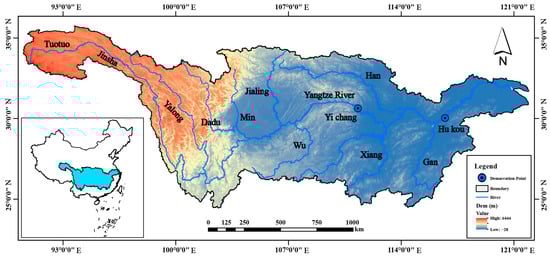
Figure 1.
Study area.
2.2. Data Description
The forest carbon stocks, land use cover change (LUCC), evapotranspiration, precipitation, population distribution, temperature, and gross primary productivity (GPP) used in this study were all derived from published datasets. The data name, resolution, duration, and source are shown in Table 1. The research period was from 2005 to 2020, and the research area covered the Yangtze River Basin in China. All datasets were preprocessed with aligned row and column numbers and uniform resolution (Figure 2). Data preprocessing was conducted in Arcgis 10.8.

Table 1.
Basic information of dataset.
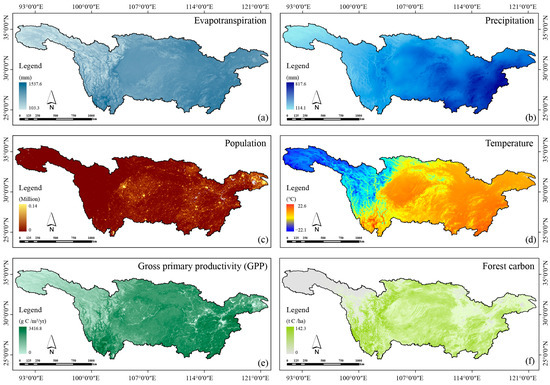
Figure 2.
Multi-year average values of each dataset in the Yangtze River Basin during 2005–2020. Note: (a–f) are multi-year averages of evapotranspiration, precipitation, population, temperature, Gross primary productivity (GPP) and forest carbon stocks, respectively. Each figure is calculated using the data from 2005 to 2020.
The forest carbon stock dataset combines historical remote sensing data with a mount of ground-measured data and is obtained by combining high-resolution active microwave remote sensing, long-time series passive microwave, and optical remote sensing information with a regression model and machine learning algorithm [20]. The total duration of the dataset is from 2002 to 2021, and the spatial resolution is about 1 km × 1 km. In this study, the sum of forest aboveground carbon stock and forest underground carbon stock was taken as the total forest carbon stock.
The evapotranspiration dataset is based on the monthly average temperature, minimum temperature, and maximum temperature in China and can be obtained by Hargreaves’ potential evapotranspiration calculation formula [21]. The total length of the dataset was from 1901 to 2022, and the spatial resolution was about 1 km × 1 km.
The precipitation dataset is generated in the China area by the Delta spatial downscaling scheme according to the global 0.5 climate dataset published by CRU (Climatic Research Unit) and the global high-resolution climate dataset published by World Clim [22]. The total length of the dataset is from 1901 to 2022, and the spatial resolution is about 1 km × 1 km.
The Digital Elevation Model (DEM) comes from the General Bathymetric Chart of the Ocean (GEBOC), which was developed jointly by the International Hydrographic Organization (IHO) and the Intergovernmental Oceanographic Commission (IOC) in coordination with interested countries. The latest version of this dataset is 2022, with a spatial resolution of 1 km × 1 km [23].
The population distribution dataset is based on the national statistical data of counties and comprehensively considers many factors that are closely related to population, such as land use type, night lighting brightness, residential density, and so on. This dataset uses the multi-factor weight distribution method to spread the population data with administrative districts as the basic statistical unit to the spatial grid, thus realizing the spatialization of the population [24]. The total duration of the dataset is from 1901 to 2020, and the spatial resolution is about 1 km × 1 km.
The temperature dataset was generated in China by the Delta spatial downscaling scheme. This dataset is based on the global climate dataset of 0.5 released by CRU (Climatic Research Unit) and the global high-resolution climate dataset released by WorldClim. Moreover, this dataset is verified by 496 independent meteorological observation points, and the verification results are credible [25]. The total length of the dataset is from 1901 to 2021, and the spatial resolution is about 1 km × 1 km.
The GPP dataset is based on the long-term online observation data of China FLUX and public datasets, combined with biological, climate, and soil factors, and is constructed using a stochastic forest regression model. This dataset covers many years of observation with data from 872 stations [26]. The total length of the dataset is 2000–2020, and the spatial resolution is about 1 km × 1 km.
The LUCC dataset comes from the data center of resources and environmental science of the China Academy of Sciences. This dataset is based on high-resolution Landsat remote sensing image products and is put into use after image fusion, data mosaic, geographic correction, image quality enhancement, supervised classification, and cross-validation [27]. The LUCC dataset keeps 6 I-level classifications and 25 II-level classifications. The total length of the dataset is from 1980 to 2020, and there is a period of data for every five years, with a spatial resolution of 1 km × 1 km.
2.3. Mann–Kendall Nonparametric Test
The Mann–Kendall nonparametric test was put forward by Mann and Kendall in 1945, which is a technology of time series data detection and prediction [28]. The Mann–Kendall test can be used to judge whether there is a sudden change in climate series, and if there is, the time that this sudden change occurs can be determined [29]. The Mann–Kendall test method is also often used to detect the trend change in time series data under the influence of climate change. The Mann–Kendall test method is a nonparametric method, and its advantage is that it does not need samples to follow a certain distribution and is not disturbed by a few outliers, so it is more suitable for type variables and sequence variables [30]. The Mann–Kendall test method is obtained from Equations (1)–(4):
where is the step function; is the time series variable, which is forest carbon stock in this study; is the normal distribution test; is variance operation; is the sample size of time series variables. After the variance operation and normal distribution test are completed, the standardized test statistic can be defined:
Under the given confidence level , if , the original hypothesis is invalid. If , it means that the change range of the time series increases; if , it means that the range of change is reduced. Generally, if , the change trend is considered to be extremely significant. If , the changing trend is considered significant. If , the changing trend is not considered significant [31]. In this study, the Mann–Kendall calculation of forest carbon stock was completed in Arcgis Pro 3.0.
2.4. Pearson Correlation Analysis
The Pearson correlation coefficient (PCC) is used to measure the linear correlation between two independent variables [32], which is calculated in Equation (5):
where is the correlation coefficient. and are two variables. and are the means of the corresponding variables. is distributed in the interval of [–1, 1]; the stronger the positive correlation near 1, the stronger the negative correlation close to −1, and the smaller the correlation between the two variables near 0 [33]. In this study, Pearson correlation analysis was proposed to explore the correlation between forest carbon stock and other environmental factors, and the calculation process was completed in Matlab 2021b. It is notable that the resolution between different datasets should be paid attention to when using Matlab 2021b to analyze the correlation of long-time series raster data. Before analysis, the data should be preprocessed to ensure that the row and column numbers of each frame are the same.
2.5. Contribution Analysis
2.5.1. BP Neural Network
The BP neural network (backpropagation, BP), first proposed in 1986, is a learning method for error backpropagation in neuron-like networks [34]. BP neural networks can learn and store many input–output pattern mapping relationships without revealing the mathematical equations describing this mapping relationship in advance [35]. The learning rule of the BP neural network is to use the fastest descent method to continuously adjust the weight and threshold of the network through backpropagation and minimize the sum of squared errors in the network [36]. The main idea of the BP neural network is to use the backpropagation algorithm to repeatedly adjust the weights and biases of the network based on input learning samples so that the output vector is as close as possible to the expected vector [37]. When the sum of squared errors for the network output layer is less than the specified error, the weight and threshold of the optimal network structure are retained. In this study, the BP neural network was used to explore the contribution rate of environmental factors to the distribution pattern of forest carbon stock at different altitudes, and the structure of the BP neural network is shown in Figure 3.
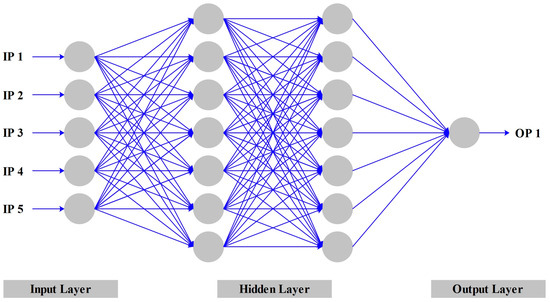
Figure 3.
Basic construction of BP neural network. Note: In this study, temperature, precipitation, population, GPP, and potential evapotranspiration were used as input neurons, and forest carbon stock was used as the output neuron. A single-hidden layer BP neural network was constructed and the topology of BP neural network was 5 × 13 × 1.
2.5.2. Contribution Rate Analysis
Contribution analysis is often used to evaluate the contribution of individual factors to the overall variable, which helps to understand the coordination relationship between the overall variable and the various subsystems [38]. The first step was to lay sampling points in the Yangtze River Basin by means of isometric sampling. According to the modeling method of the BP neural network, 70% of the sampling points are used as training data, 15% of the data are used for model testing, and 15% of the data are used for result verification. After that, these sampling points were divided into five groups according to the change in altitude, which were <900 m, 900 m–1800 m, 1800 m–2700 m, 2700 m–3600 m, and >3600 m [39]. Finally, evapotranspiration, precipitation, temperature, population, and gross primary productivity were used as input layers, and forest carbon stocks were used as output layers to be modeled in Matlab 2021b. By default, the system used the correlation coefficient r as the test statistic for the model. After obtaining the optimal model structure, the model topology, weights, and thresholds were saved. The contribution rate of environmental factors to the formation of forest carbon stock patterns at different altitudes can be calculated by Equations (6)–(8):
where is the contribution rate of a single factor to the whole variable, and the contribution factors of forest carbon stock in this study included the evapotranspiration, temperature, precipitation, population, and GPP. is the input layer neuron. is the number of neurons in the input layer with a value of 5. is the output layer neuron. is the connection weight between the input layer neurons and hidden layer neurons, which is given by the algorithm. is the hidden layer neuron; is the number of neurons in the hidden layer, and the value of was 13 after calculation in this study. is the connection weight between the hidden layer and the output layer, which is given by the algorithm.
2.6. Standardized Precipitation Evapotranspiration Index
The standardized precipitation evapotranspiration index (SPEI) is a drought index based on the normalized precipitation index [40]. It is constructed from precipitation, temperature, and potential evapotranspiration and can be calculated on a variety of time scales [41]. Recently, SPEI has been widely used in many fields, such as climate change, environmental quality assessment, and drought assessment [42]. The key concept of SPEI is to describe the degree of drought in an area by calculating how far the difference between precipitation and potential evapotranspiration deviates from the average state. Generally, the construction of SPEI is completed in three steps: potential evapotranspiration calculation, the difference between precipitation and evapotranspiration, and data normalization, which are calculated by Equations (9)–(20).
where is the potential evapotranspiration; is the average monthly temperature; is the annual caloric index; is the function of , . Potential evapotranspiration in this study used the datasets already acquired (Table 1). is the difference between precipitation and potential evapotranspiration. The normalization of the sequence can be calculated using Equations (12)–(15):
where is the probability distribution function (log-logistic); is the factorial function; , , are the probability weighted moments of , which is calculated using Equations (16) and (17):
where is the number of months participating in the calculation, and the next step is to normalize the cumulative probability density:
When the cumulative probability , then:
where SPEI is the standard precipitation evapotranspiration index. The values of , , , , , and were 2.515517, 0.802853, 0.010328, 1.432788, 0.189269 and 0.001308, respectively. The SPEI was constructed with Arcgis 10.8 and Matlab 2021b in this study.
3. Results
3.1. Forest Carbon Stock Variations
3.1.1. Spatiotemporal Variations
Figure 4e shows that, during the study period from 2005 to 2020, forest carbon stock in the Yangtze River Basin showed a fluctuating growth trend. In 2006, which had the minimum value for the entire study period, the forest carbon stock in the Yangtze River Basin was about 4.8 × 10⁹ t C, after which the forest carbon stock increased in fluctuations. In this year, the forest carbon stock per unit area in the Yangtze River Basin was 25.50 t C/hm. The first peak occurred in 2016 when total forest carbon stocks reached 5.6 × 10⁹ t C, when the per unit area in this year being 27.85 t C/hm. After a process of first declining and then rising, a maximum for the entire study period was reached in 2020, when the forest carbon stock was 5.7 × 10⁹ t C with the per unit area in this year was 28.24 t C/hm. From the perspective of growth rate, the growth rate of forest carbon stock in the Yangtze River Basin has shown great fluctuations for many years. During 2005–2020, the average annual growth rate of forest carbon stock in the Yangtze River Basin was 0.91%. The highest growth rate of forest carbon stocks was 8.78% in 2015, and the lowest was −4.04% in 2017. In order to further explore the spatial distribution pattern of forest carbon stock in the Yangtze River Basin, the spatial visualization of forest carbon stock is shown in Figure 4a–d. The forest carbon stock in the Yangtze River Basin shows a certain spatial imbalance.
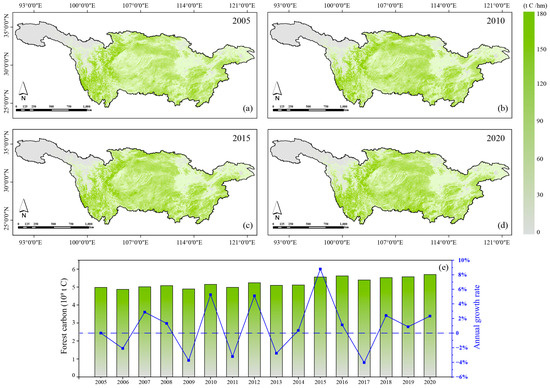
Figure 4.
Summary and spatiotemporal pattern of forest carbon stock in Yangtze River Basin. Note: (a–d) show the spatial distribution of forest carbon stock in the Yangtze River Basin in 2005, 2010, 2015 and 2020, respectively. (e) is the change and annual growth rate of total forest carbon stock from 2005 to 2020. The lowest value of forest carbon storage in the Yangtze River Basin was 4.8 × 10⁹ t C in 2006, and the highest value was 5.7 × 10⁹ t C in 2020. The average annual growth rate was 0.91%. From 2005 to 2020, the spatial pattern of forest carbon stock was stable.
3.1.2. Spatial Trend Variations
Figure 5 shows the change trend of forest carbon stock in the Yangtze River Basin from 2005 to 2020 based on the MK nonparametric test and its significance analysis. Table 2 shows the percentage calculation of the Z-values of the test statistic used to test the significance of trend changes. The results of Figure 5a show that during the study period from 2005 to 2020, forest carbon stock in the Yangtze River Basin showed an increasing trend in the central region. In the western region, except for high-altitude areas without forests, most of the areas showed a downward trend. The eastern region is the region with the most severe decline in the entire study area, and urban sprawl and increasing human activities could be responsible for the decline in forest carbon stocks in this region.
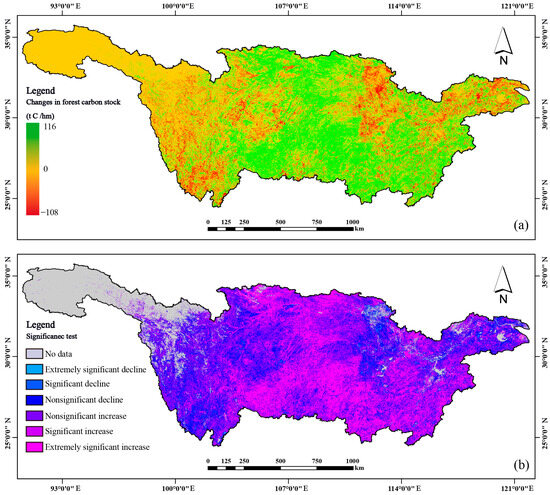
Figure 5.
The variation trends and significance of forest carbon stock in Yangtze River Basin. Note: (a) Shows the trend analysis results of forest carbon stock changes in the Yangtze River Basin from 2005 to 2020. (b) The result of the significance test for trend analysis.
Table 2.
Statistics of the forest carbon stock variation trend in Yangtze River Basin.
Figure 5b uses the Z-value to distinguish the significance of forest carbon stock in the Yangtze River Basin during the study period from 2005 to 2020. About 80% of the area with increased forest carbon stock was mainly distributed in the central region of the Yangtze River Basin. Among them, the proportions of extremely significant increase areas and significant increase areas were 17.74% and 15.18%, respectively. It is notable that the proportion of areas with a nonsignificant increase was 47.82%, which is the largest proportion of all significance analysis sections. This trend shows that during the study period from 2005 to 2020, forest carbon stock in the Yangtze River Basin was generally in a stable process of increase. About 20% of the area of forest carbon stock in the Yangtze River Basin has decreased, of which only 1.53% has extremely significantly declined or significantly declined, and 17.73% has not significantly declined. The plots with reduced forest carbon stock are mainly distributed in the high-altitude and ecologically fragile areas in the west alongside the areas with more human activities in the east.
3.1.3. Dynamics of Forest Carbon Stock with Elevation
The complex topography of the Yangtze River Basin is divided according to the 300 m contour line, as shown in Figure 6, of which the area with an altitude of <300 m is the largest, accounting for about 30%. With the increase in altitude, the proportion of various types gradually decreases, and when the altitude exceeds 1800 m, the proportion of each type is stable at about 1%–5%.
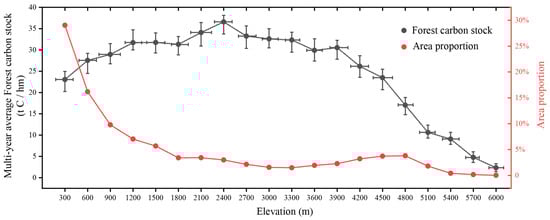
Figure 6.
The forest carbon stock and area proportion varies with altitude.
The calculation results of Figure 6 show that the average forest carbon stock per unit area in the Yangtze River Basin indicates a trend of first rising and then falling with the increase in altitude. When the altitude is less than 2400 m, the average forest carbon stock per unit area in the Yangtze River Basin gradually increases, from 23.05 (t C/hm) at an altitude of 300 m to 34.13 (t C/hm) at 2400 m. The average forest carbon stock per unit area at this altitude is the highest value in the Yangtze River Basin. After that, as the altitude increases, the average forest carbon stock per unit area gradually decreases. When the altitude exceeds 5100 m, the average forest carbon stock per unit area drops below 10 (t C/hm).
3.2. Correlation between Forest Carbon Stock and Environmental Factors
Figure 7a shows the correlation between SPEI and forest carbon stock in the Yangtze River Basin. On an overall scale, the SPEI showed an insignificant positive correlation (45.99%) and an insignificant negative correlation (43.87%) with forest carbon stock in the large area. These areas are widely spread throughout the study area. In the northwestern area, a significant positive correlation between SPEI and forest carbon storage began to appear, among which the proportions of an extremely significant positive correlation and significant positive correlation reached 2.16% and 4.02%, respectively. While in the central and eastern areas, SPEI had a significant negative correlation with forest carbon stock. In the middle and lower reaches of the Yangtze River, the proportions of an extremely significant negative correlation and a significant negative correlation were 1.96% and 2.07%, respectively.
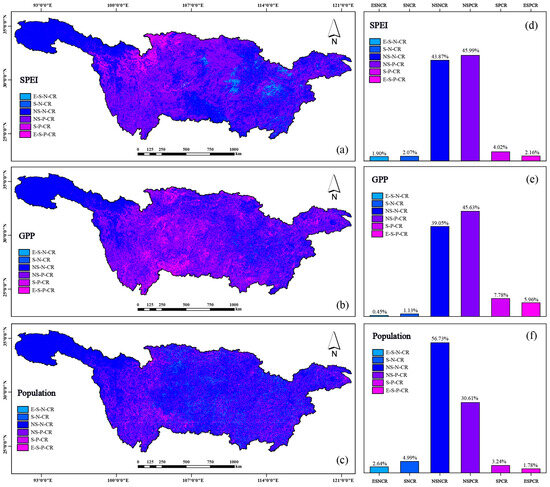
Figure 7.
Multi-year correlation between forest carbon stock and environmental factors. Note: (a–c) show the spatial characteristic of correlation between forest carbon stock and environmental factors. (d–f) show the proportion of each correlation. E-S-P-CR: extremely significant positive correlation; S-P-CR: significant positive correlation; NS-P-CR: nonsignificant positive correlation; E-S-N-CR: extremely significant negative correlation; S-N-CR: significant negative correlation; NS-N-CR: nonsignificant negative correlation.
Figure 7b shows the correlation between forest carbon stock and GPP in the Yangtze River Basin. The proportion of positive correlation areas was 59.37%, of which 5.96% and 7.78% had an extremely significant positive correlation and significant positive correlation, respectively, which were widely distributed in the western and central regions. The proportion of negative correlation areas was 40.63%, for which the proportion of extremely significant negative correlation and significant negative correlation was 0.45% and 1.13%, respectively, and mainly distributed in the eastern region. In general, GPP and forest carbon stock showed a nonsignificant positive and negative correlation in a wide area, accounting for more than 80%.
Figure 7c shows the results of the correlation analysis between forest carbon stock and population distribution. Overall, the correlation between population and forest carbon stocks was the weakest. In close to 90% of the area, it showed a nonsignificant positive and nonnegative correlation. The proportion of positive correlation areas was 35.63%, of which 1.78% and 3.24% had an extremely significant positive correlation and significant positive correlation, respectively, mainly distributed in the western region. The proportion of negative correlation areas was 64.36%, of which the proportion of extremely significant negative correlation and a significant negative correlation were 2.64% and 4.99%, respectively, and mainly distributed in the central and eastern regions.
3.3. Contribution Rate of Environmental Factors to Forest Carbon Stock
Taking evapotranspiration, temperature, precipitation, human activities, and GPP as environmental factors and forest carbon stock as the output, the BP neural network was used to model and explore the contribution of environmental factors to the formation of forest carbon stock patterns in the Yangtze River Basin at different altitudes. The modeling results are shown in Figure 8, and the BP neural network models at different altitudes achieved good modeling results, while the correlation coefficient between the simulated values and the observed values reached more than 0.9.
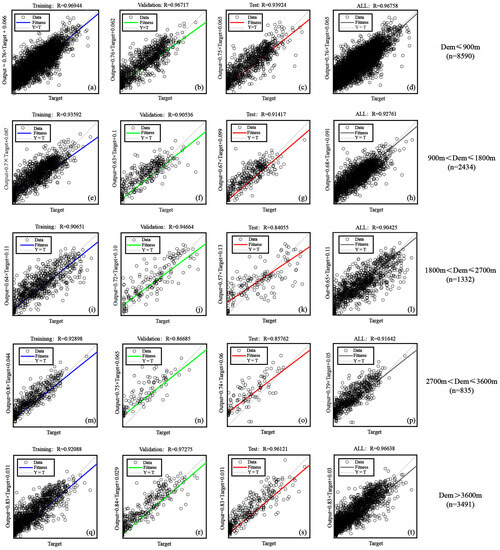
Figure 8.
Result of contribution rate analysis based on BP neural network. Note: The figure shows the modeling results of the BP neural network at different elevations. (a–d) show the correlation coefficient of Training, Validation, Test and All of Dem ≤ 900 m (n = 8590). (e–h) show the correlation coefficient of Training, Validation, Test and All of 900 m < Dem ≤ 1800 m (n = 2434). (i–l) show the correlation coefficient of Training, Validation, Test and All of 1800 m < Dem ≤ 2700 m (n = 1332). (m–p) show the correlation coefficient of Training, Validation, Test and All of 2700 m < Dem ≤ 3600 m (n = 835). (q–t) show the correlation coefficient of Training, Validation, Test and All of Dem > 3600 m (n = 3491). Filter high-performing models based on the value of the correlation coefficient between the simulation and observation. The contribution rate of each factor is given in Table 3.
The contribution statistics of Table 3 show that there is a certain heterogeneity in the contribution rate of various environmental factors to the formation of the forest carbon stock pattern in the Yangtze River Basin at different altitudes. At an altitude of <900 m, temperature was the main factor in the formation of the forest carbon stock pattern, and this contribution rate reached 38.44%. The contribution rate of the remaining four factors was distributed at about 10%–25%. At an altitude of 900 m–1800 m, the contribution rate of these five factors was very uniform, and all remained at about 20%. At an altitude of 1800 m–2700 m, the contribution rate of the population was high, reaching 28.11%, which could be due to the fact that activities of artificially regulating forest structure and carrying out forest operations in the Yangtze River Basin were mainly concentrated in this altitude range. At an altitude of 2700 m–3600 m, evapotranspiration was the most important factor affecting the pattern of forest carbon stock, and this contribution rate reached 32.15%. At an altitude of >3600 m, evapotranspiration was still the main factor in the formation of forest carbon stock patterns in the Yangtze River Basin, and its contribution rate reached 41.87%. The reason for this might be related to the physiological process of trees and the evapotranspiration of the natural environment, which affects the transpiration of trees and, in turn, affects the formation of forest patterns.
Table 3.
Contribution rate of environmental factors to forest carbon stock in Yangtze River Basin.
3.4. Result of Standardized Precipitation Evapotranspiration Index
The results of SPEI show that the multi-year average distribution of SPEI in the Yangtze River Basin is in the range of −0.74 to 0.93. From the perspective of spatial characteristics, the SPEI is high in the high-altitude area, which is above 0.5 in the west of the Hengduan Mountains. The SPEI in the central plain and most of the Sichuan Basin was distributed between −0.5 and 0.5, indicating that the climate in most areas of the Yangtze River Basin was mild and the drought degree was suitable. Areas with an SPEI of more than 0.5 were mainly distributed in urban agglomerations in the lower reaches of the Yangtze River and some areas in the southeast. Overall, the distribution of SPEI in the Yangtze River Basin showed a gradual decreasing trend from the western region to the eastern coast (Figure 9).

Figure 9.
Multi-year average of SPEI during 2005–2020 in the Yangtze River Basin.
4. Discussion
4.1. Pattern and Trend of Forest Carbon Stock
During the study period from 2005 to 2020, the overall spatial pattern of the central plain area was higher than that of the eastern population concentration area and the western high-altitude area. The total estimation and trends of forest carbon stocks in the Yangtze River Basin are similar to previous studies [16,43]. The reasons for this spatial pattern could be related to altitude, land use cover change, and the distribution of hydrothermal conditions. The western region has a high altitude and undulating terrain, which is not conducive to the growth of large areas of forest. The central region has flat terrain and relatively suitable hydrothermal conditions, which is the main distribution area of forest carbon stock in the Yangtze River Basin. The eastern region is relatively flat, and the water network is dense, but this area is the main urban development area in the Yangtze River Basin, where human activities and land use cover changes have had a certain impact on forest carbon stock [44]. Figure 4a–d shows that the pattern of forest carbon stocks in the Yangtze River Basin has not changed significantly during the 16-year study period, which is one of the results of the Yangtze River protection project actively promoted by the Chinese government [45].
4.2. Role of LUCC in the Pattern of Forest Carbon Stock
Land use cover change (LUCC) is the most direct form of interaction between human activities and natural ecosystems [46]. With the development of society, population growth, rapid progress in production technology, changes in human production, and lifestyle have seriously affected the change in land use. With the continuous attention of the country on ecological conservation, the impact of LUCC on forest ecosystems at a regional scale has received increasing attention [47]. Figure 10 shows the land use cover changes in the Yangtze River Basin during the study period from 2005 to 2020.
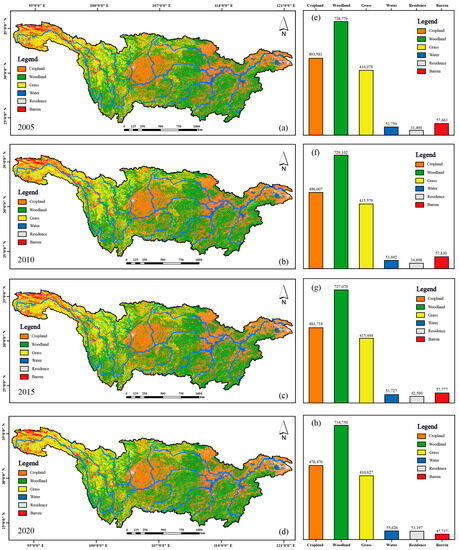
Figure 10.
Spatiotemporal patterns of LUCC in the Yangtze River Basin. Note: (a–d) show the spatial characteristic of LUCC in 2005, 2010, 2015 and 2020, respectively. (e–h) show the proportion of each land cover including Cropland, Woodland, Grass, Water, Residence and Barren. Woodland refers to forestry land where trees, shrubs, bamboo, and mangroves grow. It is divided into Dense, Shrubland, and Sparse according to the degree of closure. Grass refers to all kinds of grassland that mainly grow herbaceous plants and covers more than 5%, which is divided into >50%, 20%–50%, and <20% according to the degree of closure. Water refers to natural terrestrial waters and land used for water conservancy facilities. It is divided into Canals, Seas, Reservoirs, Glaciers, and Beaches according to the state of matter. Residence refers to urban and rural settlements, as well as industrial, mining, and transportation land. It is divided into Urban, Rural, and Other construction sites. Barren refers to land that has hitherto been unused, including hard-to-use land. It is divided into Sand, Desert, Alkali, Swamp, Exposed, and Rock. Cropland refers to the land on which crops are grown. Depending on the irrigation method, Cropland is divided into Dryland and Paddy.
Figure 10a–d shows that LUCC in the Yangtze River Basin has not undergone major changes over the 16-year study scale. Comparing Figure 4 and Figure 10, it can be found that LUCC has a significant influence on the formation of forest carbon stock patterns in this area. LUCC in a high-altitude area in the western Yangtze River Basin is mainly Barren and Grass, and there is almost no distribution of forest, which supports the fact that there is almost no forest carbon stock data in western regions. In addition, the areas through which the Min and Jialing rivers flow in the central and eastern Yangtze River basins and the LUCC in the Han River basin appear as large tracts of Cropland, crowding out the living space of forest land, so the forest carbon stock in these areas in Figure 4 is lower compared to other areas. Meanwhile, Figure 5a shows that the areas with reduced forest carbon stocks in the central and eastern Yangtze River basins also have a high degree of overlap with the distribution of Cropland and the areas of Residence along the river in Figure 10. The reason for this phenomenon may be that farming and urban expansion in Cropland and Residence affect the pattern of forest carbon stock to some extent [48]. However, due to the stable area of Cropland and the small proportion of Residence expansion (<1%), the impact of these two LUCC changes in forest carbon stock in the entire Yangtze River Basin is limited.
4.3. Role of Population in the Pattern of Forest Carbon Stock
The role of population on forest carbon stocks has two sides. Comparing Figure 2c,f shows that, on an average scale over many years, the distribution of forest carbon stock in dense populations is less. Figure 10 also shows that the LUCC in the dense population is generally Cropland and Residence. This phenomenon shows that human urban expansion and cultivation have had a certain impact on the distribution and accumulation of forest carbon reserves. On the other hand, the correlation analysis of Figure 7c shows that there is a significant positive correlation between population and forest carbon stock in the vast mountainous area to the west of the Yangtze River basin. The reason for this phenomenon may be that the population density in this area is still below its environmental carrying capacity. The large-scale movement and migration of the labor force in the Yangtze River Basin relieve the environmental pressure and improve the vegetation conditions for the region of emigration [49].
4.4. Role of Environmental Factors in the Pattern of Forest Carbon Stock
Temperature and precipitation are two basic meteorological factors in forest succession, but their effect on forests varies from region to region [49]. Since 2001, the Yangtze River basin has warmed unprecedentedly, with all annual average temperatures exceeding the average temperatures of 1970–2000 [48]. In addition, potential evapotranspiration is also an important factor affecting the growth of trees. However, the effects of these environmental factors on forest carbon storage are often synergistic; therefore, this study constructed SPEI based on temperature, precipitation, and potential evapotranspiration to explore the relationship between forest carbon stock and SPEI. Comparing Figure 5b and Figure 9, it can be found that the forest carbon stock significantly increased and extremely significantly increased in the central part where the SPEI index is −0.5–0.5. This phenomenon shows that suitable drought degrees are helpful in the accumulation of forest carbon stock. The correlation analysis of Figure 7a shows that there is a significant and positive correlation between SPEI and forest carbon stock in the northwestern region with a high SPEI value. However, in some areas with low SPEI in the east, they show a significant negative correlation.
With the change in altitude fluctuation, the annual average forest carbon stock per unit area in the Yangtze River Basin also shows large spatial heterogeneity, so it is necessary to analyze the change in forest carbon stock according to the change in altitude. The Yangtze River basin is affected by the subtropical monsoon climate, and the airflow is rich in water vapor from the southeast coast to the northwest. After being blocked by the Hengduan Mountain Range in the southeast of the Qinghai–Tibet Plateau, it stopped flowing westward, which increased the air humidity in this area, resulting in a decrease in evapotranspiration [50]. With the increase in the altitude, the contribution of evapotranspiration to the carbon stock pattern in the Yangtze River Basin gradually increased, and it became the most important contributor after the altitude exceeded 2700 m (Table 3). The reason for this phenomenon may be that as altitude rises, temperature, precipitation, and the groundwater table decrease, which no longer limits factors for tree growth; however, the intensity of evapotranspiration, as a necessary physiological process of trees, affects plant development and biomass accumulation [51]. This study found that evapotranspiration became the main influencing factor of forest carbon stock patterns at high altitudes. The results of SPEI and contribution analysis show that drought is an important factor affecting the accumulation of forest carbon storage in the Yangtze River basin.
GPP refers to the amount of organic carbon fixed by green plants through photosynthesis pathways per unit of time, and GPP determines the initial material and energy entering terrestrial ecosystems. Figure 7e shows that there is a significant positive correlation between GPP and forest carbon stock in the Yangtze River basin in a wide area, indicating that the Yangtze River basin has good potential for forest development. Trees with large carbon reserves may have stronger growth in the next growing season, which forms a synergy with the growth of GPP [52]. However, the contribution analysis results in Figure 8 and Table 3 show that the contribution rate of GPP in different regions is low, which also reveals the limited impact of this factor on forest carbon stock.
4.5. Future Development of Forest Carbon Storage in the Yangtze River Basin
The Chinese government has continued to implement afforestation and environmental protection projects in the Yangtze River basin. These projects require considerable financial investment, which was previously motivated by financial compensation [53]. Over the past few years, the Reducing Emission from Deforestation and Forest Degradation (REDD) and its derived REDD+ model have provided ample financial assistance for forest conservation actions in tropical developing countries. The experience of protecting, enhancing, and sustainable forest management in REDD+ is also worth learning [54]. Figure 4 shows that there are vast forest carbon stocks existing in the Yangtze River basin, which are growing at an annual rate of 0.91%. Combined with the China Forest Resources Report [55] and Forest Resources Statistics of China [56], it was found that the proportion of natural forests and planted forests in the Yangtze River Basin was about 80% and 20%, respectively. The proportion of young and middle-aged forests was about 70%. The Yangtze River Basin should make full use of its abundant medium and low biomass forests to develop forestry-carbon sink projects suitable for CCER (Chinese Certified Emission Reduction) trading. This operation responds to the national policy strategy while reaping the benefits of carbon sink projects, bringing forest protection in the Yangtze River Basin to a new height. At the same time, this operation could promote synergies between economic development and environmental conservation [57].
5. Conclusions
(1) During 2005–2020, the forest carbon stock in the Yangtze River Basin showed a fluctuating upward trend, with the lowest value of 4.8 × 10⁹ t C in 2006 and the highest value of 5.7 × 10⁹ t C in 2020, with an average annual growth rate of 0.91%. The results of the trend analysis show that the plots with reduced forest carbon stock in the Yangtze River Basin were mainly distributed at a high altitude in ecologically fragile areas in the west, with more human activities in the east, while the central region showed a state of steady growth.
(2) The results of SPEI and contribution analysis show that a suitable drought degree (−0.5 < SPEI < 0.5) is helpful to the accumulation of forest carbon reserves. In the plain, temperature is the main contributing factor to the formation of forest carbon stock patterns. With the increase in altitude, potential evapotranspiration becomes the main contributing factor to it.
(3) The role of population on forest carbon stock in the Yangtze River basin has two sides. The impact of urban expansion and economic development on forest carbon stock is negative, mainly in densely populated urban areas. On the other hand, the movement and migration of the labor force balance the ecological pressure in various regions in the Yangtze River Basin. In order to promote the synergy of economic development and ecological protection in a sustainable way, the Yangtze River Basin should make full use of the vast forest resources and rationally develop forestry-carbon sink projects of CCER to promote a green income.
Author Contributions
J.C. and Y.C. (Ye Chen) are coauthors and contributed equally to this work. Conceptualization, J.C. and Y.C. (Ye Chen); methodology, J.C. and J.Z.; software, J.C.; validation, Y.C. (Yiming Chen), B.Y. and Y.H.; formal analysis, S.W.; investigation, J.Z.; resources, J.C.; data curation, J.C. and J.Z.; writing—original draft preparation, J.C.; writing—review and editing, J.C.; visualization, Y.C. (Ye Chen); supervision, S.W.; project administration, Y.C. (Yiming Chen); funding acquisition, Y.C. (Yiming Chen) and B.Y. All authors have read and agreed to the published version of the manuscript.
Funding
This research was funded by the Project of Industry-University-Research cooperation between Tsinghua University and China Forestry Group Corporation on Forestry carbon sink development (ZLJT-THU2022110101) and the National Natural Science Foundation of China (72104118).
Data Availability Statement
Not applicable.
Conflicts of Interest
The authors declare no conflict of interest.
References
- Sitch, S.; Smith, B.; Prentice, I.C.; Arneth, A.; Bondeau, A.; Cramer, W.; Kaplan, J.O.; Levis, S.; Lucht, W.; Sykes, M.T.; et al. Evaluation of ecosystem dynamics, plant geography and terrestrial carbon cycling in the LPJ dynamic global vegetation model. Glob. Chang. Biol. 2003, 9, 161–185. [Google Scholar] [CrossRef]
- Falkowski, P.; Scholes, R.J.; Boyle, E.; Canadell, J.; Canfield, D.; Elser, J.; Gruber, N.; Hibbard, K.; Hogberg, P.; Linder, S.; et al. The global carbon cycle: A test of our knowledge of earth as a system. Science 2000, 290, 291–296. [Google Scholar] [CrossRef] [PubMed]
- Englhart, S.; Keuck, V.; Siegert, F. Aboveground biomass retrieval in tropical forests—The potential of combined X- and L-band SAR data use. Remote Sens. Environ. 2011, 115, 1260–1271. [Google Scholar] [CrossRef]
- Coomes, D.A.; Dalponte, M.; Jucker, T.; Asner, G.P.; Banin, L.F.; Burslem, D.F.; Lewis, S.L.; Nilus, R.; Phillips, O.L.; Phua, M.-H.; et al. Area-based vs tree-centric approaches to mapping forest carbon in Southeast Asian forests from airborne laser scanning data. Remote Sens. Environ. 2017, 194, 77–88. [Google Scholar] [CrossRef]
- Chopping, M.; Nolin, A.; Moisen, G.G.; Martonchik, J.V.; Bull, M. Forest canopy height from the Multiangle Imaging SpectroRadiometer (MISR) assessed with high resolution discrete return lidar. Remote Sens. Environ. 2009, 113, 2172–2185. [Google Scholar] [CrossRef]
- Fang, J.; Chen, A.; Peng, C.; Zhao, S.; Ci, L. Changes in Forest Biomass Carbon Storage in China Between 1949 and 1998. Science 2001, 292, 2320–2322. [Google Scholar] [CrossRef]
- Li, C.; Zhang, C.; Luo, G.; Chen, X.; Maisupova, B.; Madaminov, A.A.; Han, Q.; Djenbaev, B.M. Carbon stock and its responses to climate change inCentralAsia. Glob. Chang. Biol. 2015, 21, 1951–1967. [Google Scholar] [CrossRef]
- Maniatis, D.; Malhi, Y.; André, L.S.; Mollicone, D.; Barbier, N.; Saatchi, S.; Henry, M.; Tellier, L.; Schwartzenberg, M.; White, L. Evaluating the Potential of Commercial Forest Inventory Data to Report on Forest Carbon Stock and Forest Carbon Stock Changes for REDD+ under the UNFCCC. Int. J. For. Res. 2011, 2011, 1–13. [Google Scholar] [CrossRef]
- Fang, J.; Guo, Z.; Hu, H.; Kato, T.; Muraoka, H.; Son, Y. Forest biomass carbon sinks in East Asia, with special reference to the relative contributions of forest expansion and forest growth. Glob. Chang. Biol. 2014, 20, 2019–2030. [Google Scholar] [CrossRef]
- Lal, R. Forest soils and carbon sequestration. For. Ecol. Manag. 2005, 220, 242–258. [Google Scholar] [CrossRef]
- Lamlom, S.; Savidge, R. A reassessment of carbon content in wood: Variation within and between 41 North American species. Biomass Bioenergy 2003, 25, 381–388. [Google Scholar] [CrossRef]
- McKinley, D.C.; Ryan, M.G.; Birdsey, R.A.; Giardina, C.P.; Harmon, M.E.; Heath, L.S.; Houghton, R.A.; Jackson, R.B.; Morrison, J.F.; Murray, B.C.; et al. A synthesis of current knowledge on forests and carbon storage in the United States. Ecol. Appl. 2011, 21, 1902–1924. [Google Scholar] [CrossRef] [PubMed]
- Heiner, M.; Higgins, J.; Li, X.; Baker, B. Identifying freshwater conservation priorities in the Upper Yangtze River Basin. Freshw. Biol. 2010, 56, 89–105. [Google Scholar] [CrossRef]
- Zhang, L.; Xu, W.-H.; Ouyang, Z.-Y.; Zhu, C.-Q. Determination of priority nature conservation areas and human disturbances in the Yangtze River Basin, China. J. Nat. Conserv. 2014, 22, 326–336. [Google Scholar] [CrossRef]
- Cao, L.; Zhou, F.; Wu, M. Study on the ecological compensation mechanism of a watershed based on an urban agglomeration by using the Yangtze River basin as an example. Acta Ecol. Sin. 2019, 39, 85–96. [Google Scholar] [CrossRef]
- Kong, R.; Zhang, Z.; Zhang, F.; Tian, J.; Chang, J.; Jiang, S.; Zhu, B.; Chen, X. Increasing carbon storage in subtropical forests over the Yangtze River basin and its relations to the major ecological projects. Sci. Total Environ. 2019, 709, 136163. [Google Scholar] [CrossRef]
- Jia, S. Carbon Storage Distribution and Its Dynamic Changes of Forest Vegetation in Yangtze River Basin Based on Continuous Forest Resources Inventory. J. Ecol. Rural. Environ. 2018, 34, 997–1002. [Google Scholar]
- Yang, Y.; Li, J.; Wang, L.; Wang, Z.; Ling, Y.; Xu, J.; Yao, C.; Sun, Y.; Wang, Y.; Zhao, L. The Impact of Urbanization on the Relationship between Carbon Storage Supply and Demand in Mega-Urban Agglomerations and Response Measures: A Case of Yangtze River Delta Region, China. Int. J. Environ. Res. Public Health 2022, 19, 13768. [Google Scholar] [CrossRef]
- Cai, W.; Peng, W. Exploring Spatiotemporal Variation of Carbon Storage Driven by Land Use Policy in the Yangtze River Delta Region. Land 2021, 10, 1120. [Google Scholar] [CrossRef]
- Chen, Y.; Feng, X.; Fu, B.; National Tibetan Plateau Scientific Data Center. Above- and Belowground Forest Biomass Carbon Pool in China during 2002~2021. 2023. Available online: https://data.tpdc.ac.cn/zh-hans/data/fa3e5766-95a4-4de2-9d45-f51f917b73d9 (accessed on 28 February 2023).
- Peng, S.; National Tibetan Plateau Data Center. 1 km Monthly Potential Evapotranspiration Dataset in China (1901–2022). 2022. Available online: http://loess.geodata.cn/data/datadetails.html?dataguid=34595274939620&docid=74 (accessed on 28 February 2023). [CrossRef]
- Peng, S.; National Tibetan Plateau Data Center. 1-km Monthly Precipitation Dataset for China (1901–2022). A Big Earth Data Platform for Three Poles. 2022. Available online: https://www.tpdc.ac.cn/en/data/faae7605-a0f2-4d18-b28f-5cee413766a2/ (accessed on 31 May 2023).
- GEBCO. General Bathymetric Chart of the Oceans. Available online: https://www.gebco.net/ (accessed on 15 December 2019).
- Xu, X. Chinese Port Spatially Distributed Kilometers Grid Dataset. 2021. Available online: https://www.resdc.cn/DataSearch.aspx (accessed on 19 June 2022).
- Peng, S. 1-km Monthly Mean Temperature Dataset for China (1901–2022). 2019. Available online: https://cstr.cn/18406.11.Meteoro.tpdc.270961 (accessed on 31 May 2023).
- Fan, R.; Zhu, X.; Chen, Z. A Dataset of Annual Gross Primary Productivity over Chinese Terrestrial Ecosystems during 2000–2020. 2023. Available online: https://www.scidb.cn/en/detail?dataSetId=b496b208f51e44fcaf326e8b0f792c34 (accessed on 1 January 2023).
- Xu, X.; Liu, J.; Zhang, S.; Li, R.; Yan, C.; Wu, S. The Dataset of China’s Land Use Remote Sensing Mapping System (CNLUCC). 2018. Available online: http://www.resdc.cn/DOI/DOI.aspx?DOIid=54 (accessed on 10 March 2020).
- Mann, H.B. Nonparametric tests against trend. Econometrica 1945, 13, 245–259. [Google Scholar] [CrossRef]
- Hamed, K.H.; Rao, A.R. A modified Mann-Kendall trend test for autocorrelated data. J. Hydrol. 1998, 204, 182–196. [Google Scholar] [CrossRef]
- Hamed, K.H. Trend detection in hydrologic data: The Mann–Kendall trend test under the scaling hypothesis. J. Hydrol. 2008, 349, 350–363. [Google Scholar] [CrossRef]
- Lou, J.; Xu, G.; Wang, Z.; Yang, Z.; Ni, S. Multi-Year NDVI Values as Indicator of the Relationship between Spatiotemporal Vegetation Dynamics and Environmental Factors in the Qaidam Basin, China. Remote Sens. 2021, 13, 1240. [Google Scholar] [CrossRef]
- Zhou, Y.; Feng, X.; Enhedelihai; Luo, T.; Yang, X.; Mei, H.E. Statistical analysis of fracture properties based on particle swarm optimization and Pearson correlation coefficient method. Glob. Geol. 2015, 18, 41–48. [Google Scholar] [CrossRef]
- Arif, C.; Setiawan, B.I.; Hasanah, N.A.I.; Mizoguchi, M. Estimating Greenhouse Gas Emissions from Irrigated Paddy Fields in Indonesia under Various Water Managements. IOP Conf. Ser. Mater. Sci. Eng. 2019, 557, 012034. [Google Scholar] [CrossRef]
- Rumelhart, D.E.; Hinton, G.E.; Williams, R.J. Learning representations by back-propagating errors. Nature 1986, 323, 533–536. [Google Scholar] [CrossRef]
- Zhang, Y.; Wang, S.; Xu, W.; Fernandez, C.; Fan, Y. Novel Feedback-Bayesian BP Neural Network Combined with Extended Kalman Filtering for the Battery State-of-Charge Estimation. Int. J. Electrochem. Sci. 2021, 16, 210624. [Google Scholar] [CrossRef]
- Liu, J.; Yu, X. Rolling Element Bearing Fault Diagnosis for Complex Equipment based on MFMD and BP Neural Network. J. Phys. Conf. Ser. 2021, 1948, 012113. [Google Scholar] [CrossRef]
- Liu, J.; Ni, L. The Prediction of Laser Clad Parameters Based on Neural Network. In Advanced Materials Processing 2010; World Scientific Publishing Co. Pte. Ltd.: Singapore, 2011; pp. 279–284. [Google Scholar] [CrossRef]
- Sanger, D. Contribution Analysis: A Technique for Assigning Responsibilities to Hidden Units in Connectionist Networks. Connect. Sci. 1989, 1, 115–138. [Google Scholar] [CrossRef]
- Jiang, T.; Su, B.; Hartmann, H. Temporal and spatial trends of precipitation and river flow in the Yangtze River Basin, 1961–2000. Geomorphology 2007, 85, 143–154. [Google Scholar] [CrossRef]
- Vicente-Serrano, S.M.; Beguería, S.; López-Moreno, J.I. A Multiscalar Drought Index Sensitive to Global Warming: The Standardized Precipitation Evapotranspiration Index. J. Clim. 2010, 23, 1696–1718. [Google Scholar] [CrossRef]
- Zarei, A.R.; Mahmoudi, M.R. Assessment of the effect of PET calculation method on the Standardized Precipitation Evapotranspiration Index (SPEI). Arab. J. Geosci. 2020, 13, 182. [Google Scholar] [CrossRef]
- Kimosop, P. Characterization of drought in the Kerio Valley Basin, Kenya using the Standardized Precipitation Evapotranspiration Index: 1960−2016. Singap. J. Trop. Geogr. 2019, 40, 239–256. [Google Scholar] [CrossRef]
- Kong, R.; Zhang, Z.; Zhang, F.; Tian, J.; Zhu, B.; Zhu, M.; Wang, Y. Spatial and Temporal Dynamics of Forest Carbon Storage and Its Driving Factors in the Yangtze River Basin. Res. Soil Water Conserv. 2020, 27, 60–66. [Google Scholar] [CrossRef]
- Sharma, P.; Rai, S. Carbon sequestration with land-use cover change in a Himalayan watershed. Geoderma 2007, 139, 371–378. [Google Scholar] [CrossRef]
- Ouyang, Z.; Zheng, H.; Xiao, Y.; Polasky, S.; Liu, J.; Xu, W.; Wang, Q.; Zhang, L.; Xiao, Y.; Rao, E.; et al. Improvements in ecosystem services from investments in natural capital. Science 2016, 352, 1455–1459. [Google Scholar] [CrossRef]
- Nunes, C.; Augé, J.I. Land-Use and Land-Cover Change (LUCC): Implementation Strategy. In Environmental Policy Collection; IGBP Secretariat: Stockholm, Sweden, 1999; 126p. [Google Scholar]
- Yang, L.; Feng, Q.; Yin, Z.; Wen, X.; Si, J.; Li, C.; Deo, R.C. Identifying separate impacts of climate and land use/cover change on hydrological processes in upper stream of Heihe River, Northwest China. Hydrol. Process. 2017, 31, 1100–1112. [Google Scholar] [CrossRef]
- Zhang, Y.; Song, C.; Zhang, K.; Cheng, X.; Band, L.E.; Zhang, Q. Effects of land use/land cover and climate changes on terrestrial net primary productivity in the Yangtze River Basin, China, from 2001 to 2010. J. Geophys. Res. Biogeosciences 2014, 119, 1092–1109. [Google Scholar] [CrossRef]
- Qu, S.; Wang, L.; Lin, A.; Zhu, H.; Yuan, M. What drives the vegetation restoration in Yangtze River basin, China: Climate change or anthropogenic factors? Ecol. Indic. 2018, 90, 438–450. [Google Scholar] [CrossRef]
- Fang, J.; Kong, F.; Fang, J.; Zhao, L. Observed changes in hydrological extremes and flood disaster in Yangtze River Basin: Spatial–temporal variability and climate change impacts. Nat. Hazards 2018, 93, 89–107. [Google Scholar] [CrossRef]
- Wilson, K.B.; Hanson, P.J.; Mulholland, P.J.; Baldocchi, D.D.; Wullschleger, S.D. A comparison of methods for determining forest evapotranspiration and its components: Sap-flow, soil water budget, eddy covariance and catchment water balance. Agric. For. Meteorol. 2001, 106, 153–168. [Google Scholar] [CrossRef]
- Campioli, M.; Gielen, B.; Göckede, M.; Papale, D.; Bouriaud, O.; Granier, A. Temporal variability of the NPP-GPP ratio at seasonal and interannual time scales in a temperate beech forest. Biogeosciences 2011, 8, 2481–2492. [Google Scholar] [CrossRef]
- Song, C.; Zhang, Y.; Mei, Y.; Liu, H.; Zhang, Z.; Zhang, Q.; Zha, T.; Zhang, K.; Huang, C.; Xu, X.; et al. Sustainability of Forests Created by China’s Sloping Land Conversion Program: A comparison among three sites in Anhui, Hubei and Shanxi. For. Policy Econ. 2014, 38, 161–167. [Google Scholar] [CrossRef]
- Agrawal, A.; Nepstad, D.; Chhatre, A. Reducing Emissions from Deforestation and Forest Degradation. Annu. Rev. Environ. Resour. 2011, 36, 373–396. [Google Scholar] [CrossRef]
- Zhang, J. China Forest Resources Report. 2019. Available online: http://www.forestdata.cn/index.html (accessed on 18 May 2019).
- Jia, Z. Forest Resources Statistics of China: China Science Publishing & Media Ltd. (CSPM). 2010. Available online: https://www.forestry.gov.cn/main/65/20100128/326341.html (accessed on 13 October 2010).
- Huang, W.; Wang, Q.; Li, H.; Fan, H.; Qian, Y.; Klemeš, J.J. Review of recent progress of emission trading policy in China. J. Clean. Prod. 2022, 349, 131480. [Google Scholar] [CrossRef]
Disclaimer/Publisher’s Note: The statements, opinions and data contained in all publications are solely those of the individual author(s) and contributor(s) and not of MDPI and/or the editor(s). MDPI and/or the editor(s) disclaim responsibility for any injury to people or property resulting from any ideas, methods, instructions or products referred to in the content. |
© 2023 by the authors. Licensee MDPI, Basel, Switzerland. This article is an open access article distributed under the terms and conditions of the Creative Commons Attribution (CC BY) license (https://creativecommons.org/licenses/by/4.0/).