Article

Development of an Advanced-Generation Multi-Objective Breeding Population for the 4th Cycle of Chinese Fir (Cunninghamia lanceolata (Lamb.) Hook.)

1
State Key Laboratory of Tree Genetics and Breeding, Co-Innovation Center for Sustainable Forestry in Southern China, College of Forestry, Nanjing Forestry University, Nanjing 210037, China
2
Rugao City Forestry Technical Guidance Station, Nantong 226500, China
3
Key Laboratory of Timber Forest Breeding and Cultivation for Mountainous Areas in Southern China, Fujian Academy of Forestry Science, Fuzhou 350012, China
4
Yangkou State-Owned Forest Farm, Nanping 353200, China
5
Guangzhou Genedenovo Biotechnology Company Limited, Guangzhou 510720, China
6
Department of Forest Genetics and Plant Physiology, Umeå Plant Science Centre, Swedish University of Agricultural Sciences, 901-83 Umeå, Sweden
7
The Commonwealth Scientific and Industrial Research Organization National Collection Research Australia, Black Mountain Laboratory, Canberra, ACT 2601, Australia
*
Author to whom correspondence should be addressed.
Forests 2023, 14(8), 1658; https://doi.org/10.3390/f14081658
Submission received: 18 May 2023 / Revised: 2 August 2023 / Accepted: 13 August 2023 / Published: 16 August 2023
(This article belongs to the Special Issue Long-Term Genetic Improvement and Molecular Breeding of Chinese Fir)

Abstract

:
Chinese fir (Cunninghamia lanceolata (Lamb.) Hook.) is an important timber species native to southern China. While the single, unstructured breeding strategy was employed in the past three cycles of breeding, it is no longer adequate for managing a more advanced breeding population. In this study, we utilized restriction-site-associated DNA-sequencing (RAD-seq) to estimate the genetic diversity of breeding populations and phenotypic values or breeding values to estimate the genetic gain of hundred-grain weight, diameter at breast height, and wood basic density. To achieve a balance between genetic gain and genetic diversity, we combined the multiple populations and core-main populations methods to construct the fourth cycle breeding population. Finally, the fourth cycle breeding population was made up of a core population of 50 individuals with an inbreeding coefficient of ~0, and an additional main population of 183 individuals, with an effective population size of 108. Crossings made within and/or between different trait-targeted subpopulations could facilitate bidirectional gene flow between the core and main populations, depending on the breeding objectives. This structured breeding population of Chinese fir could aim for both short- and long-term genetic gains and has the potential to support the preservation of germplasm resources for future climate change.

1. Introduction

Chinese fir (Cunninghamia lanceolata (Lamb.) Hook.) is a fast-growing timber conifer species widely distributed from the south of the Qinling Mountains in China to northern Vietnam (19°30′–34°03′ N, 101°30′–121°53′ E) (Figure 1) [1]. Its relatively straight tree trunk and high cellulose content provide wood and fiber products. As such, the Chinese fir is an important tree species for industrial raw materials, widely used in the construction, interior decoration, and wood fiber bio-composites industries. Meanwhile, in China, it spans management zones, as it not only represents a valuable source of timber but is also situated within ecological remediation areas and public welfare forests. In fact, according to the ninth National Forest Resources Inventory in China [2], the Chinese fir plantations cover an area of 9.9 million hectares, accounting for 17.3% of China’s total dominant tree species in plantations, while the standing timber volume is 755.45 million cubic meters, accounting for 22.3% of the total plantation volume.
Breeding populations are composed of elite trees that are mated for subsequent breeding cycles, providing the genetic foundation for long-term selection and breeding. Therefore, a breeding population must maintain a certain level of genetic diversity while reflecting genetic improvements [3,4]. Currently, a structured breeding population concept has been introduced to address the need for advanced-generation and multi-objective breeding, where the single, unstructured whole population could be divided into the core/nucleus and main populations, multiple populations, and sublines (Figure 2A–C) [5,6]. Recently, several breeding models, including single-population, inbred hybrid, and rolling-front strategies, have been proposed in tree breeding programs (Figure 2D–F) [7,8]. For example, a model of dividing the breeding population into several sublines with a composite population mating design was adopted for loblolly pine (Pinus taeda) [9] and slash pine (Pinus elliottii) [10]. Meanwhile, an alternative strategy was used for New Zealand radiata pine (Pinus radiata) [11] by dividing the breeding population into main and core populations with unequal sizes as a means to ensure genetic diversity while effectively preventing inbreeding and controlling the rate of coancestry (Table 1). Based on simulations, a single breeding population with a coancestry control strategy or a core-main population breeding strategy provides the highest genetic gain for intermediate (5–10 generations) and long-term (15–20 generations) breeding [8]. Indeed, breeding population construction is consistently one of the priority areas of forest genetic breeding research, particularly in terms of the composition and scale of the core breeding population, the design of subline and the super line group structures, and division of the main and elite populations.
The construction of an advanced-generation breeding population should aim to maintain genetic diversity while improving the genetic gain of the target population. The breeding population of Chinese fir in the first three cycles has shown high genetic diversity and genetic gain [18,19]. However, Chinese fir breeding has recently entered the 4th cycle of genetic improvement. After 4 years of observation, 233 unique genotypes with strong flowering and fruiting abilities were selected as the 4th cycle Chinese fir breeding population [18]. 343,644 high-quality single nucleotide polymorphism (SNP) markers have been developed to resolve the genetic diversity and population genetic structure of 233 Chinese fir [20]. In this study, we aimed to use these markers to clarify the genetic diversity and genetic gain of the 4th cycle of the Chinese fir breeding population and construct an advanced-generation structured breeding population. Finally, we proposed a strategy for constructing and managing the 4th cycle breeding population of the Chinese fir using two structural breeding population construction methods, i.e., the core-main population and multiple population models.

2. Materials and Methods

2.1. Test Material

The experimental materials were obtained from the 4th cycle selection/candidate population of Chinese fir for breeding and deployment, comprising 233 individuals. These individuals were selected based on the volume, disease resistance, survival, and wood density from a range of experiments, including the 2nd and 3rd cycle breeding populations [21,22], long-term range-wide provenance tests, and the regional deployment test of a selected national elite family line and family lines for infertile sites [23,24,25]. According to the pedigree analysis (Supplementary Figure S1), the test material could be divided into four generations: 1st (n = 2), 2nd (n = 56), 3rd (n = 146), and 4th (n = 29) (Supplementary Table S1).
The selected individuals were grafted at the Daoping site (26°49′ N, 117°53′ E) of Yangkou State-owned Forest Farm, Fujian Province. Yangkou is in the central production area for Chinese fir, within the low mountainous and hilly area of the Wuyi Mountains, with a subtropical monsoon climate, an annual average temperature of 18.5 °C, and a summer high temperature of 40.3 °C. The lowest temperature was −6.8 °C, the average annual precipitation was 1880 mm, the annual frost-free period was approximately 280 days, and the average relative humidity was 82% in 2022. The dominant soil is a type of yellow-red mountain soil developed from granite, with a deep soil layer and a site condition classified as grade II. The location is at an altitude of 175–240 m and formerly consisted of mixed coniferous and broadleaved forest crops with multiple tree species, including Chinese fir, Pinus massoniana, and Superba spp. After clearing the site by removing existing trees in autumn 2014, rows of large holes (60 × 40 × 40 cm) spaced 3 × 3 m apart for each rootstock plant were prepared. The scions were grafted in 2016–2017, and a minimum of eight ramets were grafted for each selected individual.

2.2. SNP Marker Development

Whole genome DNA from the 233 samples was extracted from the fresh needles of Chinese fir using the DP-320-02 kit from the Tiangen Biotechnology Company (Beijing, China). Genomic DNA was sequenced using restriction-site-associated DNA-sequencing (RAD-seq) technology. The population RAD-tag collection was used as the assembled reference sequence, sequencing reads were compared using TopHat software v2.1.0 (TopHat, Toronto, ON, USA), and population SNP detection was performed using GATK variant detection software v4.1.9. Marker filtering was performed using Plink v1.9 with the following criteria to keep SNPs: integrity > 0.8, minimum allele frequency ≥0.05, and loci conforming to the Hardy–Weinberg equilibrium. The more detailed description is shown in Jing et al. [20].

2.3. Trait Determination

In this study, we measured diameter at breast height (DBH) and wood basic density (WBD) in 31 progeny trials (Supplementary Table S2), including 18 and 13 progeny trials from the 2nd and 3rd generations, respectively. Two experimental designs, namely a randomized complete block design [24] and a balanced lattice design [23], were used in the 31 trials. The details of the experimental design for each trial are shown in Table S2. The DBH was measured at a breast height of 1.3 m using a perimeter ruler at field age seven [23,24]. For WBD, 5 mm increment cores at breast height were obtained using a tree growth core at field age 25. Using the saturated water content method, the weight (kg) of the wood increment cores at saturated water content was recorded as W1; the mass (kg) after drying in an oven at 105° was recorded as W2. WBD was calculated using Equation (1):
W B D = 1 / ( W 1   W 2 0.346 ) ,
Seeds were collected from the grafted trees on Yangkou State-owned Forest Farm, and the mass of one hundred randomly sampled seeds was weighed on a balance; the average of three replicates was taken as the hundred-grain weight (HGW) of the genotype.
The genetic gains of HGW, DBH, and WBD in the selected population at different diversity levels were based on the estimated breeding values of the 2nd and 3rd cycle breeding programs; the genetic gains of HGW, DBH, and WBD were recorded as Δ G H G W , Δ G D B H , and Δ G W B D , respectively.

2.4. Statistical Analysis

2.4.1. Estimates of Breeding Values

Chinese fir typically has a very low genetic correlation between WBD and DBH. Therefore, we estimated the breeding values of DBH and WBD using a univariate linear mixed model across sites based on adjusted phenotypic data from 31 progeny trials. First, we used a linear mixed model to adjust environmental/design effects, such as block effects, for phenotypic value [23]. Secondly, an individual-tree linear mixed mode was used to estimate the final breeding values, which can be expressed in matrix form as
y = X b + Z u + e
where y is a vector of adjusted phenotypic values for sites 1 to 31, b is a vector of a fixed effect of the general mean with its design matrix X, u is a vector of random effects with its corresponding design matrix Z, e is a vector of residuals. Fixed and random effect solutions are obtained by solving the linear mixed model equations:
[ X R 1 X X R 1 Z Z R 1 X Z R 1 Z + G 1 ] [ b ^ u ^ ] = [ X R 1 y Z R 1 y ]
where R is the variance–covariance matrix of the residuals and G is the variance–covariance matrix of each of the random effects. Residuals are assumed to be independent among sites, and the residual matrix (R) is
R = [ σ 1 2 I 1 0 0 σ 31 2 I 31 ]
where σ i 2 is the residual variance for trial i,   I i   is   the   identity   matrix   for   trial   i . To make the model converge, a factor analytic variance structure was used to fix the G matrix. ASReml R V4.1 was used to fit the model for both traits [26].

2.4.2. Genetic Diversity Analysis

The genetic diversity and structure of breeding populations were estimated through an analysis of the detected SNPs. Using Plink v1.9 [27], effective allele number (Ne), expected heterozygosity (He), observed heterozygosity (Ho), and the proportion of missing SNP loci (PN) were measured. Minor allele frequency (MAF), Shannon–Wiener index (Shi), and polymorphic information content (PIC) were calculated by the Perl programming-based method. The genetic diversity index (Nei) and genetic differentiation index (Fst) were calculated using Vcftools v0.1.14 [28]. The genetic distances between individuals were calculated using MEGA7 [29]. The population structure was analyzed using Admixture (Version 1.3.0), assuming K values from 1 to 9, and the minimum value of the cross-validation error rate was used as the optimal number of bins for the population.

2.4.3. Core Subpopulation Collection Strategy

For core subpopulation collection/selection, a step-wise pruning procedure was implemented, and Core Hunter [30] was used for evaluation. Core Hunter is a tool to sample diverse, representative subsets from large germplasm collections with minimum redundancy. Such so-called core collections have general applications in plant breeding and genetic resource management. Core Hunter can construct cores based on genetic marker data or phenotypic traits, optimizing one of the many provided evaluation measures depending on the precise purpose of the core (e.g., high diversity or representativeness).
Core hunter was used to classify core collections based on SNP markers using a rate between 10% and 70%, with an increment of 5%, for a total of 13 core collections, designated the S collections. Genetic gain for different S collections of Chinese fir breeding populations was calculated based on estimated breeding values. Based on the genetic gain from the largest to the smallest of the three traits (HGW, DBH, and WBD), the core subpopulations were selected from the largest to the smallest gain, with a selection rate of 10% to 70% and a 10% increment. The seven phenotypic subpopulation collections were classified as the MP1 collection for HGW, the MP2 collection for DBH, and the MP3 collection for WBD.
Significant differences between core collections and the whole population were assessed using an independent sample t-test with the following model and R software v4.0.2:
t = X 1 X 2 ( n 1 1 ) S 1 2 + ( n 2 1 ) S 2 2       n 1 + n 2 2 ( 1 n 1 + 1 n 2 )
where X ¯ 1 and X ¯ 2 are two population means, S 1 2 and S 2 2 represent two population variances, and n 1 and n 2 are the number of samples in the two populations.

2.4.4. Structured Breeding Population Construction

Using a multi-group structured breeding population construction method suitable for multiple breeding objectives, four Chinese fir collections with genetic diversity in HGW, DBH, and WBD were plotted with Venn diagrams using the TB tools (https://github.com/CJ-Chen/TBtools) software v1.109. Based on the plots, the four subpopulations could be divided into two subgroups: the main breeding population and the core population. The intersection of the four subpopulations represented the core population, which combined high genetic diversity and genetic gain; the remainder constituted the main population. Within the core population, the genetic gain of the three target traits was used as the basis for classification, and the core population was divided into three categories (MP1, MP2, and MP3) to construct an advanced-generation structured breeding population of Chinese fir.

3. Results

3.1. Construction of Subpopulations Based on Molecular Data

The S collection based on SNP data and their genetic parameters are presented in Table 2. The MAF, He, Ho, and Nei of the 13 proposed core subpopulations gradually decreased with increasing selection rates, and the number of effective alleles, PIC, Shi, and Fst, gradually increased with increasing selection rates. However, the genetic parameters of these proposed core subpopulations differed from the whole population by a p-value ≥ 0.05 without significant changes, indicating that the genetic diversity of the S collection was relatively preserved.
To retain the high-quality SNP loci, the MAF was set to >0.05. When the selection rate was set to 50% and 116 selected individuals were included, the conservation rate of allelic information for the proposed core subpopulation was 100%, and the polymorphic information of all SNP loci was retained. The genetic structure reflects the genetic diversity of the population, while the genetic structure of the core subpopulation should mimic the original population to better retain all genetic information from the original population [31]. When the selection rate reached 60% and 140 selected individuals were included, the optimal number of four available structured populations in the whole population was approached. Therefore, considering the genetic diversity, allele conservation, and specific genetic structure, the SNP-based core population comprised 140 individuals.
The mean values of HGW, DBH, and WBH for the core population constructed based on SNP loci were 0.560 g, 23.73 cm, and 324.12 kg/m3, respectively, with genetic gains of −1.59%, 2.82%, and −0.85%, respectively. However, no significant differences were observed in the performance of the three phenotypic traits between the selected and whole populations (Supplementary Table S3).

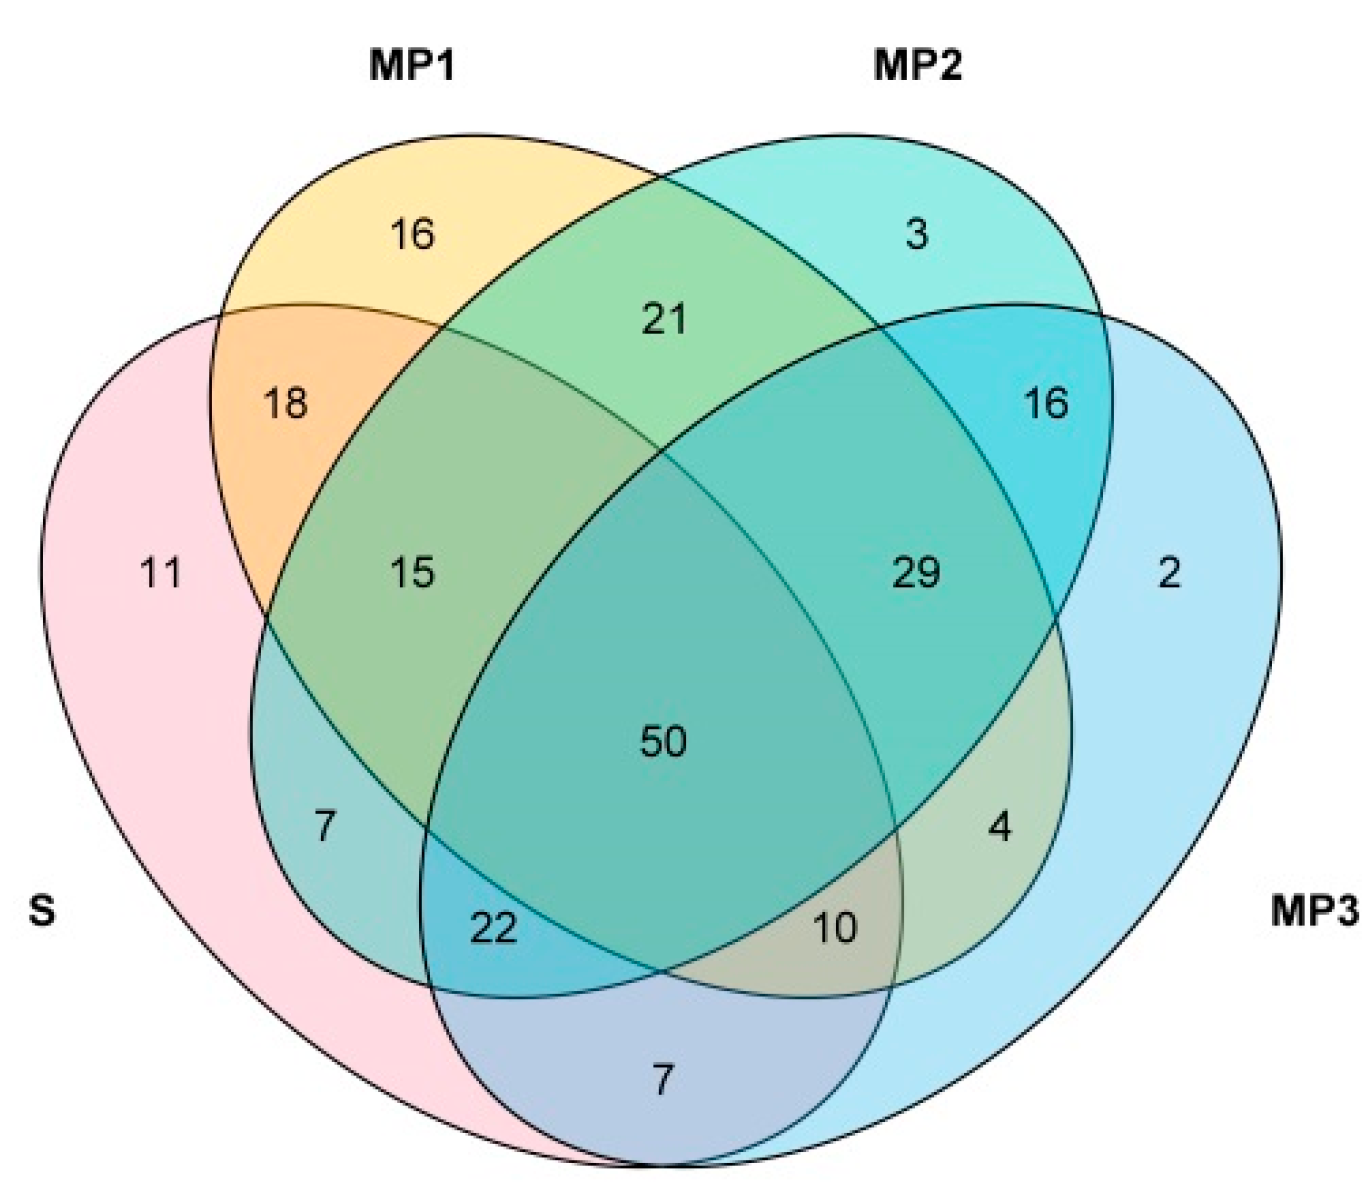
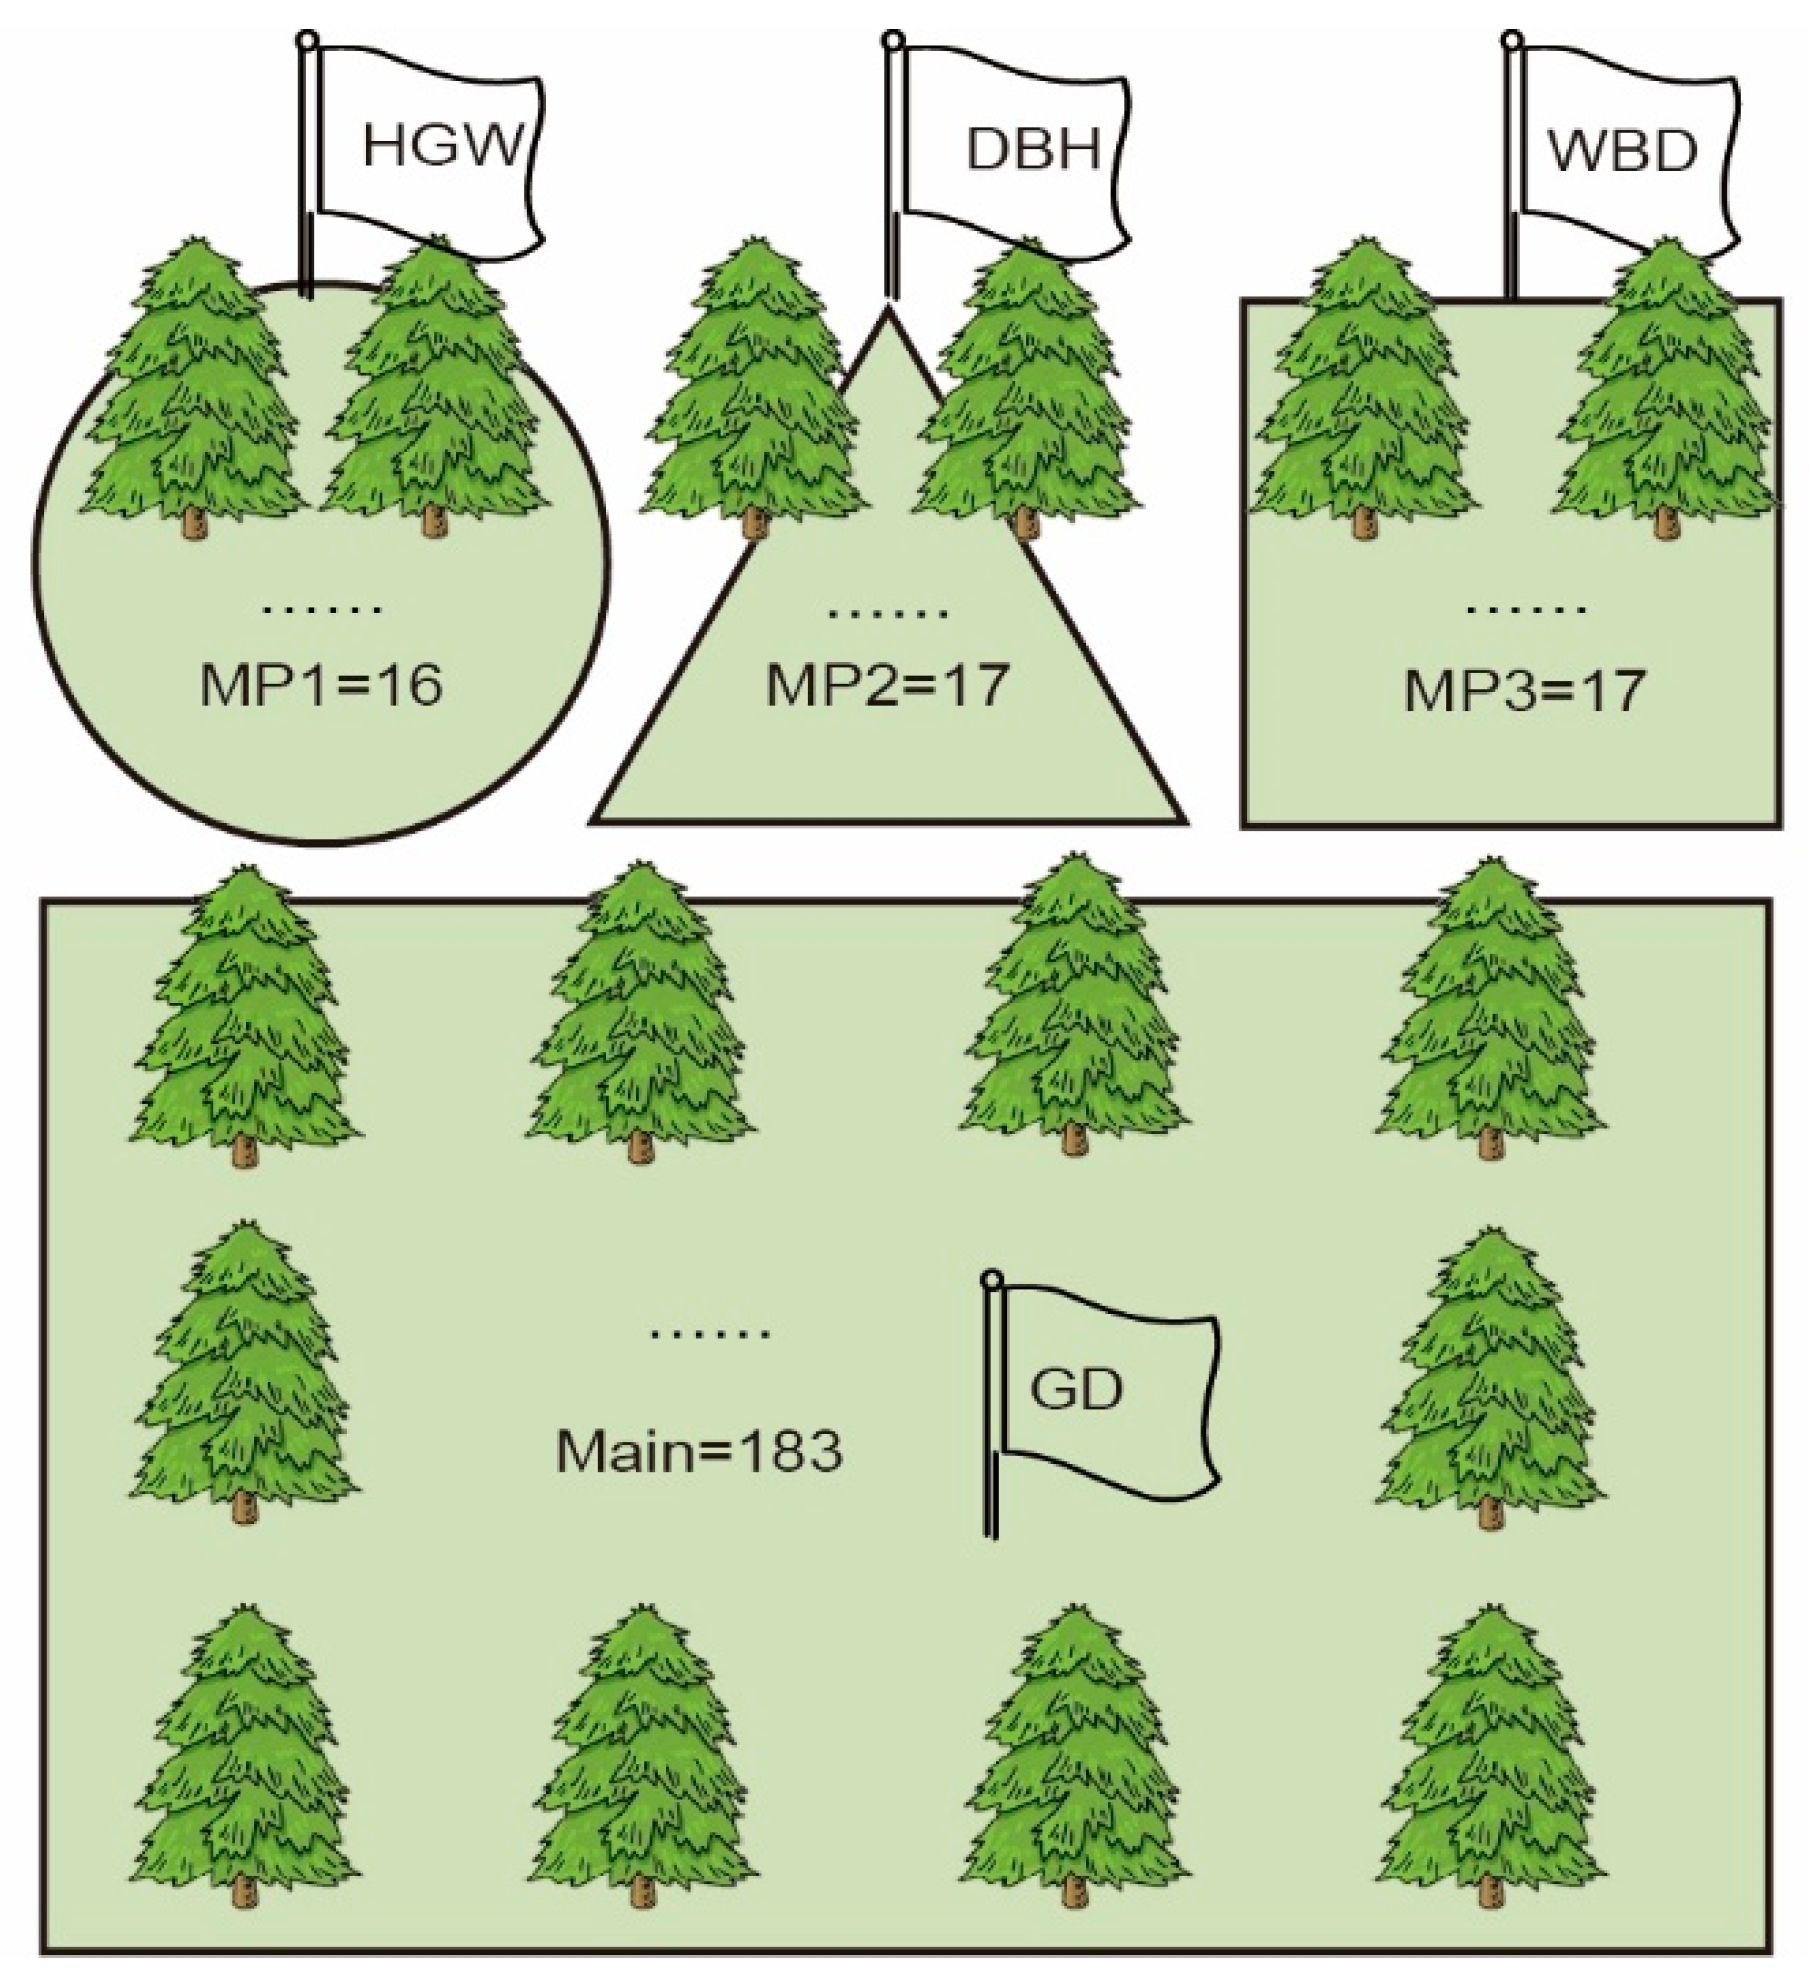
3.2. Construction of Multiple Populations of Chinese Fir Based on Phenotypic Data

The genetic parameters of each of the seven Chinese fir subpopulations constructed based on HGW are presented in Table 3; the overall changes were consistent with the trend in the core subpopulation constructed based on SNP loci. When the selection rate was 70%, the genetic diversity, alleles, and specific genetic structure of the tested population were preserved. There were 163 individuals selected in the Chinese fir subpopulation based on HGW, and the subpopulation had mean HGW, DBH, and WBD values of 0.638 g, 23.10 cm, and 324.12 kg/m3, respectively, with genetic gains of 12.12%, −0.87%, and −0.82%, respectively. The HGW of the selected population showed a significant difference from that of the whole population (p < 0.05); however, there were no significant differences for DBH and WBD (Supplementary Table S3).
The genetic parameters of each of the seven fir subpopulations constructed based on DBH are presented in Table 3; the overall changes were consistent with the trend in the core subpopulation constructed based on SNP loci. When the selection rate was 60%, the genetic diversity, alleles, and specific genetic structure of the test population were preserved. The Chinese fir subpopulation constructed based on DBH had 140 selected individuals, with mean HGW, DBH, and WBD values of 0.556 g, 25.57 cm, and 337.35 kg/m3, respectively, and genetic gains of −2.29%, 9.73%, and 3.20%, respectively. The DBH and WBD of the selected populations differed significantly from those of the whole population (p < 0.05; Supplementary Table S3). The negative genetic gain for HGW could result from a non-significant negative Pearson correlation between breeding values of DBH and environmental-adjusted phenotypic values of HGW (Supplementary Table S4).
The genetic parameters of each of the seven Chinese fir subpopulations constructed based on WBD are presented in Table 3; the overall changes were consistent with the trend in the core population constructed based on SNP loci. When the selection rate was 70%, the genetic diversity, alleles, and specific genetic structure of the test population were preserved. The subpopulation of Chinese fir based on WBD had 163 selected individuals, with mean HGW, DBH, and WBD values of 0.561g, 24.34 cm, and 346.40 kg/m3, respectively, and genetic gains of −1.41%, 4.32%, and 5.97%, respectively. The genetic gains for HGW, DBH, and WBD for the selected subpopulation were −1.41%, 4.32%, and 5.97%, respectively. The DBH and the WBD of the selected populations differed significantly from those of the test populations (p < 0.05; Supplementary Table S3).

3.3. Construction of a Core Breeding Chinese Fir Population

The 4th cycle breeding Chinese fir population was divided into core and main populations according to the breeding objectives. In the previous two sections, four subpopulations were selected based on marker-based genetic diversity: HGW, DBH, and WBD, respectively, and the intersection of the four subpopulations with 50 individuals was selected as the core population (Figure 3, Supplementary Table S5); the remaining 183 individuals constituted the main population.
The average minor allele number, Ne, average He, average Ho, PIC, Shi, Nei, and population differentiation index of the core population were 0.1550, 1.3997, 0.2345, 0.2359, 0.2168, 0.4160, 0.2393, and 0.1805, respectively. A total of 441 SNP loci had an MAF of 0 and missing polymorphic information of 0.12%, retaining 99.88% genetic diversity. A total of 39,193 SNP loci had an MAF < 0.05, while >88.59% of the SNP loci had an MAF > 0.05, which maximized the genetic diversity from the original germplasm. The HGW of the core population ranged from 0.484 to 1.088 g, including the highest seed weight of the whole population, with an average HGW of 0.612 g and a genetic gain of 7.49%; the DBH of the core population ranged from 21.40 to 44.30 cm, including the fast-growing tree of the test population, with an average DBH of 27.98 cm and a genetic gain of 20.08%. The WBD of the core population ranged from 304.15 kg/m3 to 451.39 kg/m3, and the average WBD was 343.69 kg/m3, with a genetic gain of 5.14%. The statistical analysis showed significant differences in the phenotypic traits between the core population and the original whole population, indicating that the genetic gain of the core population was significant.

3.4. Strategies for Managing Core Populations of Chinese Fir

The genetic similarity (kinship) heatmap and clustering dendrogram of the core Chinese fir population (n = 50) are shown in Figure 4. According to the pedigree analysis (Supplementary Figure S4), the core population could be divided into three generations: 2nd (n = 20), 3rd (n = 27), and 4th (n = 3). Excluding two pairs of individuals between E66 and E110 (0.1222) and between E42 and C22 (0.1174), whose genetic similarity was >0.1, the genetic similarity between the remaining individuals was <0.1. Among the genetic similarities between the 1225 individual pairs, only 104 pairs had a genetic similarity >0, accounting for only 8.48% of all related pairs. The relationship pairs based on the pedigree of the core population with kinship coefficients of 0.5, 0.25, 0.125, 0.0625, and 0.03125 were 2, 1, 32, and 26, respectively. Thus, the overall kinship between individuals in the core population was low.
A schematic diagram of the structured breeding population construction for Chinese fir is shown in Figure 5. The core population will be used for intensive breeding to achieve a genetic gain of target traits in the short term, and the main population will be used to maintain population genetic diversity as well as provide genetic material for new breeding objectives in future generations. The mating designs for the core population and the main population differed. Specifically, the core population, as a source of high-performing material, has a full sibling mating design according to specific breeding objectives. Meanwhile, for the main population, a multilineage pollination mating design or an open pollination mating design will be applied to create more variation and provide a genetic basis for the increase or change in breeding objectives in future generations. Simultaneously, each material from the core population was allowed to participate in other hybrid groupings to maximize the use of genetic information from the core population.
Two designs can be considered to increase the genetic gain per unit of time. First, in the case of a fixed breeding target, a directional inbreeding-control design can be carried out based on the kinship matrix, and the effect of increasing the genetic gain of the target trait can be achieved by artificially controlling the inbreeding level. Second, the use of different selection intensities or different genetic assay designs can be adopted for the core and main populations to accelerate the breeding cycle of the core population.
Different management strategies are suggested for the core and main subpopulations to control the inbreeding level of the Chinese fir advanced-generation breeding population (Figure 6). Within different lines of the core subpopulation, successive high-intensity crosses may be used for different breeding objectives without controlling the inbreeding level within the group. Different lines of the same breeding target can be selected for cross-mating to reduce the inbreeding level while achieving a high genetic gain. Different lines with different breeding targets can also be selected for cross-mating to achieve multi-objective breeding. Meanwhile, different subpopulations can be selected in the main population for new breeding targets, thus meeting the need for advanced-generation breeding of forest trees.

4. Discussion

4.1. Breeding Objectives of Chinese Fir

Chinese fir has finished three cycles of breeding, and the goal of the fourth cycle is to maintain genetic diversity while maximizing genetic gain and reproductivity. In this study, we have proposed an alternative approach for the construction of a core breeding population by taking the intersection of four subpopulations representing genetic diversity and three different phenotypic traits, which are HGW, DBH, and WBD. The DBH and WBD are the most important breeding traits related to growth and wood quality, respectively. Meanwhile, the HGW is to evaluate reproductive ability [32].

4.2. The Breeding Population Size

The size of the breeding population directly affects the genetic outcomes. A large population size can delay inbreeding; however, it may result in a smaller breeding gain. Moreover, a small population size with the best trees may initially accelerate breeding progress; however, the genetic variation will decrease rapidly. In fact, a small population can result in the loss of favorable alleles, particularly for low-frequency or non-selected traits. Thus, the 2nd generation breeding populations of the slash pine and loblolly pine in the southeastern region of the United States and the radiata pine in Australia are composed of hundreds to thousands of superior trees [12,14]. The New Zealand radiata pine (Pinus radiata D. Don) breeding cooperative had a target effective population size of 400 individuals [11]. In the present study, the overall kinship of the whole population studied was 0.0023, and the effective population size (Ne) was 108 for the 4th cycle breeding population of the Chinese fir. The results showed that when the effective population size is greater than 50, a low frequency of favorable genes can theoretically maintained in the breeding population, ensuring genetic gains for multiple generations [33].

4.3. How to Maintain Genetic Diversity and Control Inbreeding

Genetic diversity is the basis of long-term breeding, and higher genetic diversity guarantees the sustainability of breeding effects and genetic gain. It was reported that genetic diversity (0.49–0.66) for Mason pine (P. massoniana) breeding was maintained and balanced with a high genetic gain in three rounds of selective breeding [34]. Typically, heterozygous plants have high genetic diversity [35], and Chinese fir is a predominantly heterozygous plant with dioecious flowers that rely on wind pollination. Many studies have shown high levels of genetic diversity for Chinese fir using SSR (Simple Sequence Repeat) [19], RAPD [36], and SNPs [37] to study the 1st, 2nd, and 3rd cycles of breeding populations, respectively. This study found that the 4th cycle breeding population of Chinese fir possessed a high level of genetic diversity. Such maintenance of diversity, in combination with the reported high genetic gain of Chinese fir breeding [38], indicated that the breeding strategy and advanced-generation method for Chinese fir in China were scientifically effective.
Inbreeding depression poses a significant challenge to conifer breeding, resulting in reduced fertility, slower growth, and lower survival rates [39,40]. In this study, we observed that the inbreeding coefficient of the core population was ~0. The average kinship of 233 individuals based on pedigree and molecular markers was 0.0067 and −0.0226, respectively (Supplementary Table S6, Supplementary Figures S2 and S3). In the present study, the genomic relationship matrix calculated from SNP loci using RAD-seq was applied to control inbreeding, which may be more effective than pedigree analysis.
In traditional tree breeding, discrete generations are maintained, and new cycles of testing and selection are started only after the completion of crosses between previous generations [7]. Several important conifer species have shifted from previously discrete generation breeding programs to a rolling-front breeding strategy with overlapped generations [8,41]. The rolling-front breeding strategy could potentially yield higher overall returns per unit of time than the discrete generation strategy, with potentially higher inbreeding accumulation [7]. For example, within the 3rd cycle, a rolling-front breeding strategy was implemented in radiata pine. This strategy could increase the genetic gain by 25%–35% after 40 years compared to that of the previous strategy, primarily owing to the shorter breeding cycles [42]. To implement the rolling-front strategy, a dynamic genetic evaluation system such as TREEPLAN® should be developed for Chinese fir.

4.4. Construction and Management of the Core Breeding Population

Given that phenotypic traits are easy to measure and their differences among individuals are relatively large, they are often used as the basis for core population construction in crops. However, as molecular marker technology advances, molecular markers, which are not influenced by the external environment, provide a large amount of genetic information and can be used for core population construction [43,44,45]. In this study, we also employed RAD-seq genomic data to control inbreeding.
The size of the core population is related to the biological characteristics of the species, the level of genetic diversity of the population, and the objectives of core population construction, depending on the specific situation. Brown et al. [46] derived from the neutral theory that more than 70% of the genetic variation of the base population can be covered using 5%–10% of the individuals of the base population as the core germplasm. According to available reports [47], most of the core samples of various crops account for 10%–30% of the base population, for example, 17%, 10%, and 10% in alfalfa (Medicago sativa) [48], peach (Prunus persica) [49], and rice (Oryza sativa) [50], respectively. In this study, 50 core materials were selected from 233 selected individuals based on SNP markers in combination with three phenotypic traits, and the core population accounted for 21% of the 4th cycle Chinese fir breeding population, which can maximize the genetic diversity of the entire breeding population; however, inclusion of a smaller number of genotypes could reduce management costs. Finally, the core (or nucleus) and main populations are bidirectional in germplasm exchange. Bidirectional gene exchange between the two parts of the breeding population reduces the difference between the main and core populations to exchange selected trees.
The structured population construction method with the combination of the core and main populations with multiple populations is expected to achieve a common genetic gain in multi-objective breeding while maintaining high genetic diversity in the 4th breeding Chinese fir population. Based on other studies [8], the genetic gain of different sublines constructed for breeding populations is higher. However, the core and main population strategies were more effective in maintaining the inbreeding level than those of subline breeding and multiple breeding strategies. Therefore, we propose a structured breeding strategy for forest trees considering genetic diversity and genetic gain, in which those at the intersection of different subpopulations based on each trait constitute the core population and the other materials are retained as the main population.

5. Conclusions

The present work mainly focuses on the analysis of genetic diversity and genetic gain in the 4th cycle of the Chinese fir breeding population. Using a core-main population and multiple population models, we successfully constructed an advanced-generation structured breeding population. The population was divided into core and main populations to maintain genetic diversity and obtain genetic gain. The core population consisted of individuals from multiple populations that overlapped according to the different breeding objectives. Through different mating schemes between different subpopulations, the needs of multi-objective breeding can be met. The findings permitted us to gain insight into the mating system, maintain genetic diversity, control inbreeding, and achieve a high genetic gain.

Supplementary Materials

The following supporting information can be downloaded at: https://www.mdpi.com/article/10.3390/f14081658/s1, Figure S1: Pedigree analysis of 233 individuals; Figure S2: Kinship based on pedigree of the 233 individuals; Figure S3: Kinship based on molecular analysis of the 233 individuals; Figure S4: Pedigree analysis of 50 individuals. Table S1: 233 individuals of Chinese fir from generation 1 to generation 4 used in this trial; Table S2: Basic information of 31 progeny trials. Table S3: T-test results of the core subpopulation; Table S4: Pearson correlation between HGW, DBH and WBD; Table S5: Genetic gain of phenotypic traits of various quality resources in the core population; Table S6: Pedigree relationship of 233 individuals.

Author Contributions

Conceptualization, B.Z., L.B., Q.F. and J.W.; methodology, B.Z., L.B., Q.F., J.W. and X.Z. (Xuefeng Zhang); software, B.Z., L.B., Q.F., J.W. and X.Z. (Xuefeng Zhang); validation, B.Z., L.B., Q.F., J.W. and J.S.; formal analysis, B.Z., L.B., Q.F., J.W., X.Z. (Xuefeng Zhang), Z.Y. and Z.C.; investigation, B.Z., L.B., Q.F., J.W., X.Z. (Xueyan Zheng) and X.Z. (Xuefeng Zhang); Rrsources, L.B.; data curation, B.Z., L.B., Q.F., J.W. and X.Z. (Xuefeng Zhang); writing—original draft preparation, B.Z., Q.F., J.W. and R.Z.; writing—review and editing, B.Z., L.B., Z.C., R.Z. and H.X.W.; visualization, B.Z., Q.F., J.W., Z.Y. and X.Z. (Xueyan Zheng); supervision, L.B., H.X.W., Z.C. and J.S. All authors have read and agreed to the published version of the manuscript.

Funding

This work was supported by the National Natural Science Foundation of China (32171818), the National Key Research and Development Program of China (2022YFD2200201), Fujian Province Science and Technology Research Funding on the Fourth Tree Breeding Program of Chinese fir (Min Lin Ke 2016-35, ZMGG-0701, 2022FKJ05), and the Priority Academic Program Development of Jiangsu Higher Education Institutions (PAPD).

Data Availability Statement

The raw data supporting the conclusions of this article will be made available by the authors without undue reservation. The marker data used were derived from the data sets provided by NCBI: PRJNA910811 and PRJNA909424.

Acknowledgments

We are grateful to Peizhong Ye and Yuewu Chen for initiating Chinese fir breeding, investigating the economic and social effects of improved varieties, and providing valuable germplasm resources. We also thank the Fujian Provincial Department of Forestry for its continuous focus on supporting the genetic improvement of the Chinese fir for the past 65 years, not only supporting the project approval but also for their contributions to logistics and human resources.

Conflicts of Interest

The authors declare no conflict of interest. The funders had no role in the design of the study; in the collection, analyses, or interpretation of data; in the writing of the manuscript; or in the decision to publish the results.

References

  1. Zhao, Y.; Deng, X.; Xiang, W.; Chen, L.; Ouyang, S. Predicting potential suitable habitats of Chinese fir under current and future climatic scenarios based on Maxent model. Ecol. Inform. 2021, 64, 101393. [Google Scholar] [CrossRef]
  2. Cui, H.O.; Liu, M. Analysis on the results of the 9th national forest inventory. J. West China For. Sci. 2020, 49, 90–95. [Google Scholar]
  3. Kang, X. Thoughts on tree breeding strategies. J. Beijing For. Univ. 2019, 41, 15–22. [Google Scholar] [CrossRef]
  4. Kang, X. Research progress of forest genetics and tree breeding. J. Nanjing For. Univ. 2020, 44, 1–10. [Google Scholar] [CrossRef]
  5. Burdon, R.D.; Namkoong, G. Multiple populations and sublines. Silvae Genet. 1983, 32, 221–222. [Google Scholar]
  6. Cotterill, P.P.; Jackson, N. Gains expected from clonal orchards under alternative breeding strategies. For. Sci. 1989, 35, 183–196. [Google Scholar]
  7. Borralho, N.M.G.; Dutkowski, G.W. Comparison of rolling front and discrete generation breeding strategies for trees. Can. J. For. Res. 1998, 28, 987–993. [Google Scholar] [CrossRef]
  8. Wu, H.X.; Hallingbäck, H.R.; Sánchez, L. Performance of seven tree breeding strategies under conditions of inbreeding depression. G3 2016, 6, 529–540. [Google Scholar] [CrossRef]
  9. McKeand, E.; Beineke, F. Sublining for half-sib breeding populations of forest trees. Silvae Genet. 1980, 29, 14–17. [Google Scholar]
  10. White, T.L.; Hodge, G.R.; Powell, G.L. An advanced-generation tree improvement plan for slash pine in the southeastern United States. Silvae Genet. 1993, 42, 359–371. [Google Scholar]
  11. Jayawickrama, K.J.S.; Carson, M.J. A breeding strategy for the New Zealand radiata pine breeding cooperative. Silvae Genet. 2000, 49, 82–89. [Google Scholar]
  12. McKeand, S.E.; Bridgwater, F.E. A strategy for the third breeding cycle of loblolly pine in the Southeastern US. Silvae Genet. 1998, 47, 223–234. [Google Scholar]
  13. Isik, F.; McKeand, S.E. Fourth cycle breeding and testing strategy for Pinus taeda in the NC State University Cooperative Tree Improvement Program. Tree Genet. Genom. 2019, 15, 70–82. [Google Scholar] [CrossRef]
  14. White, T.L.; Huber, D.A.; Powell, G.L. Third-cycle breeding strategy for slash pine by the Cooperative Forest Genetics Research Program. In Proceedings of the 27th Southern Forest Tree Improvement Conference, Stillwater, OK, USA, 24–27 June 2003. [Google Scholar]
  15. Tóth, E.G.; Vendramin, G.G.; Bagnoli, F.; Cseke, K.; Höhn, M. High genetic diversity and distinct origin of recently fragmented Scots pine (Pinus sylvestris L.) populations along the Carpathians and the Pannonian Basin. Tree Genet. Genom. 2017, 13, 47. [Google Scholar] [CrossRef]
  16. Chen, Z.Q.; Zan, Y.; Milesi, P.; Zhou, L.; Chen, J.; Li, L.; Cui, B.; Niu, S.; Westin, J.; Karlsson, B. Leveraging breeding programs and genomic data in Norway spruce (Picea abies L. Karst) for GWAS analysis. Genome Biol. 2021, 22, 179. [Google Scholar] [CrossRef]
  17. Rosvall, O.; Ståhl, P.; Almqvist, C.; Anderson, B.; Berlin, M.; Ericsson, T.; Eriksson, M.; Gregorsson, B.; Hajek, J.; Hallander, J.J.S. Review of the Swedish Tree Breeding Programme; Skogforsk: Uppsala, Sweden, 2011. [Google Scholar]
  18. Bian, L.; Huang, D.; Zhang, X.; Tong, X.; Ye, D.; Shi, J. Analysis on flowering phenology and synchronization indexes of Chinese fir clonal archive. J. Nanjing For. Univ. 2020, 44, 207–212. [Google Scholar] [CrossRef]
  19. Ouyang, L.; Chen, J.; Zheng, R.; Xu, Y.; Lin, Y.; Huang, J.; Ye, D.; Fang, Y.; Shi, J. Genetic diversity among the germplasm collections of the Chinese fir in 1st breeding population upon SSR markers. J. Nanjing For. Univ. 2014, 38, 21–26. [Google Scholar]
  20. Jing, Y.; Bian, L.; Zhang, X.; Zhao, B.; Zheng, R.; Su, S.; Ye, D.; Zheng, X.; El-Kassaby, Y.A.; Shi, J. Genetic diversity and structure of the 4th cycle breeding population of Chinese fir (Cunninghamia lanceolata (lamb.) hook). Front. Plant Sci. 2023, 14, 1106615. [Google Scholar] [CrossRef]
  21. Chen, Y.; Shi, J. Some basic problems in genetic improvement of Chinese fir. J. Nanjing For. Univ. 1983, 7, 5–19. [Google Scholar]
  22. Yu, R. Study on establishing Cunninghamia lanceolata breeding poputation of the third generation. J. Fujian Coll. For. 2008, 28, 69–72. [Google Scholar] [CrossRef]
  23. Bian, L.; Shi, J.; Zheng, R.; Chen, J.; Wu, H.X. Genetic parameters and genotype–environment interactions of Chinese fir (Cunninghamia lanceolata) in Fujian Province. Can. J. For. Res. 2014, 44, 582–592. [Google Scholar] [CrossRef]
  24. Zheng, R.; Hong, Z.; Su, S.; Bian, L.; Xiao, H.; Shi, J.; Wu, H.X. Inheritance of growth and survival in two 9-year-old, open-pollinated progenies of an advanced breeding population of Chinese firs in southeastern China. J. For. Res. 2016, 27, 1067–1075. [Google Scholar] [CrossRef]
  25. Kerr, R.J.; Dutkowski, G.W.; Jansson, G.; Persson, T.; Westin, J. Connectedness among test series in mixed linear models of genetic evaluation for forest trees. Tree Genet. Genom. 2015, 11, 67. [Google Scholar] [CrossRef]
  26. Butler, D.; Cullis, B.; Gilmour, A.; Gogel, B.; Thompson, R. ASReml-R Reference Manual Version 4; VSN International Ltd.: Hemel Hempstead, UK, 2017. [Google Scholar]
  27. Slifer, S.H. PLINK: Key functions for data analysis. Curr. Protoc. Hum. Gen. 2018, 97, e59. [Google Scholar] [CrossRef] [PubMed]
  28. Ulintz, P.J.; Wu, W.; Gates, C.M. Bioinformatics analysis of whole exome sequencing data. Methods Mol. Biol. 2019, 1881, 277–318. [Google Scholar] [CrossRef]
  29. Hall, B.G. Building phylogenetic trees from molecular data with MEGA. Mol. Biol. Evol. 2013, 30, 1229–1235. [Google Scholar] [CrossRef]
  30. Thachuk, C.; Crossa, J.; Franco, J.; Dreisigacker, S.; Warburton, M.; Davenport, G.F. Core Hunter: An algorithm for sampling genetic resources based on multiple genetic measures. BMC Bioinform. 2009, 10, 243. [Google Scholar] [CrossRef]
  31. Jeong, N.; Kim, K.S.; Jeong, S.; Kim, J.Y.; Park, S.K.; Lee, J.S.; Jeong, S.C.; Kang, S.T.; Ha, B.K.; Kim, D.Y.; et al. Korean soybean core collection: Genotypic and phenotypic diversity population structure and genome-wide association study. PLoS ONE 2019, 14, e0224074. [Google Scholar] [CrossRef]
  32. Wang, N.N.; Jiang, H.W.; Zhang, Z.G.; Li, Y.Y.; Li, C.D.; Song, Y.B.; Li, Y.; Yu, Y.; Liu, C.Y.; Hu, Z.B. Gene mining of 100-grain weight and the number of four-seed pods in soybean (Glycine max). Plant Breed. 2022, 141, 143–158. [Google Scholar] [CrossRef]
  33. White, T.; Adams, W.; Neale, D. Forest genetics-concepts, scope, history and importance. In Forest Genetics; CABI: Wallingford, UK, 2007; pp. 1–14. [Google Scholar]
  34. Feng, Y.; Yang, Z.; Li, H.; Xu, H. Changes of genetic gain & genetic diversity in the breeding process of Pinus massoniana. J. Nanjing For. Univ. 2018, 61, 196–200. [Google Scholar] [CrossRef]
  35. López-Villalobos, A.; Eckert, C.G. Consequences of multiple mating-system shifts for population and range-wide genetic structure in a coastal dune plant. Mol. Ecol. 2018, 27, 675–693. [Google Scholar] [CrossRef] [PubMed]
  36. Li, M.; Shi, J.; Li, F.; Gan, S. Molecular characterization of elite genotypes within a second-generation Chinese fir (Cunninghamia lanceolata) breeding population using RAPD markers. Sci. Silvae Sin. 2007, 43, 50–55. [Google Scholar]
  37. Zheng, H.; Hu, D.; Wei, R.; Yan, S.; Wang, R. Chinese fir breeding in the high-throughput sequencing era: Insights from SNPs. Forests 2019, 10, 681. [Google Scholar] [CrossRef]
  38. Ye, P.; Chen, Y.; Ruan, Y.; Chen, S.; Liu, D.; Guo, M.; Lin, Q. A study of the early selection of Chinese fir. J. Nanjing For. Univ. 1981, 24, 106–116. [Google Scholar] [CrossRef]
  39. Wu, H.X.; Owen, J.V.; Abarquez, A.; Matheson, A.C. Inbreeding in Pinus Radiata-V. the effects of inbreeding on fecundity. Silvae Genet. 2004, 53, 80–88. [Google Scholar] [CrossRef]
  40. Wu, H.X.; Ker, R.; Chen, Z.; Ivkovic, M. Balancing breeding for growth and fecundity in radiata pine (Pinus radiata D. Don) breeding programme. Evol. Appl. 2021, 14, 834–846. [Google Scholar] [CrossRef]
  41. Kerr, R.J.; McRae, T.A.; Dutkowski, G.W.; Tier, B. Managing the rate of increase in average co-ancestry in a rolling front tree breeding strategy. J. Anim. Breed. Genet. 2015, 132, 109–120. [Google Scholar] [CrossRef]
  42. Wu, H.X.; Eldridge, K.G.; Matheson, A.C.; Powell, M.B.; McRae, T.A.; Butcher, T.B.; Johnson, I.G. Achievements in forest tree improvement in Australia and New Zealand 8. Successful introduction and breeding of radiata pine in Australia. Aust. For. 2007, 70, 215–225. [Google Scholar] [CrossRef]
  43. Hoshikawa, K.; Lin, Y.-P.; Schafleitner, R.; Shirasawa, K.; Isobe, S.; Nguyen, D.C.; Ohsawa, R.; Yoshioka, Y. Genetic diversity analysis and core collection construction for Amaranthus tricolor germplasm based on genome-wide single-nucleotide polymorphisms. Sci. Hortic. 2023, 307, 111428. [Google Scholar] [CrossRef]
  44. Zhu, Y.; Liang, D.; Song, Z.; Tan, Y.; Guo, X.; Wang, D. Genetic Diversity Analysis and Core Germplasm Collection Construction of Camellia oleifera Based on Fruit Phenotype and SSR Data. Genes 2022, 13, 2351. [Google Scholar] [CrossRef]
  45. Li, N.; Yang, Y.; Xu, F.; Chen, X.; Wei, R.; Li, Z.; Pan, W.; Zhang, W. Genetic Diversity and Population Structure Analysis of Castanopsis hystrix and Construction of a Core Collection Using Phenotypic Traits and Molecular Markers. Genes 2022, 13, 2383. [Google Scholar] [CrossRef] [PubMed]
  46. Brown, A.H.D. The case for core collections. In The Use of Plant Genetic Resources; Brown, A.H.D., Frankel, O.H., Marshall, D.R., Williams, J.T., Eds.; Cambridge University Press: Cambridge, UK, 1989; pp. 136–156. [Google Scholar]
  47. Wang, J.; Guan, Y.; Wang, Y.; Zhu, L.; Wang, Q.; Hu, Q.; Hu, J. A strategy for finding the optimal scale of plant core collection based on Monte Carlo simulation. Sci. World J. 2014, 2014, 503473. [Google Scholar] [CrossRef] [PubMed]
  48. Diwan, N.; McIntosh, M.S.; Bauchan, G.R. Methods of developing a core collection of annual Medicago species. Theor. Appl. Genet. 1995, 90, 755–761. [Google Scholar] [CrossRef] [PubMed]
  49. Li, Y.X.; Li, T.H.; Zhang, H.L.; Qi, Y.W. Sampling strategy for a primary core collection of peach (Prunus persica (L.) Batsch.) germplasm. Eur. J. Hort. Sci. 2007, 72, 268–274. [Google Scholar]
  50. Roy Choudhury, D.; Singh, N.; Singh, A.K.; Kumar, S.; Srinivasan, K.; Tyagi, R.K.; Ahmad, A.; Singh, N.K.; Singh, R. Analysis of genetic diversity and population structure of rice germplasm from north-eastern region of India and development of a core germplasm set. PLoS ONE 2014, 9, e113094. [Google Scholar] [CrossRef] [PubMed]
Figure 1. Natural distribution of Chinese fir.
Forests 14 01658 g001
Figure 2. Breeding strategies commonly used in forest tree breeding programs. P: a population selected to enter the next breeding cycle.
Forests 14 01658 g002
Figure 3. Venn diagram of the number of individuals selected in each of the four types of collections. S, collection based on genetic diversity; MP1, collection based on the phenotypic trait of HGW; MP2, collection based on the phenotypic trait of DBH; and MP3, collection based on the phenotypic trait of WBD.
Forests 14 01658 g003
Figure 4. Heatmap of kinships among genotypes within the core population (n = 50). To make the color more noticeable, the value in diagonal of the matrix are subtracted by 1.
Forests 14 01658 g004
Figure 5. A schematic diagram of the 4th cycle structured breeding population of Chinese fir. The main population was used to maintain long-term genetic diversity (GD) in breeding populations; MP1, MP2, and MP3 are the core subpopulations used to achieve high short-term genetic gains for the target traits.
Forests 14 01658 g005
Figure 6. Management strategy of the core Chinese fir population. The subpopulations were selected according to the breeding target traits and can be mated with each other within the core subpopulation to achieve single-target breeding, and mating between subpopulations can achieve multi-target breeding, thus realizing advanced-generation multi-target breeding of Chinese fir. MP4, MP5, and MP6 are the core subpopulations that were used to achieve short-term high genetic gains for future target traits. BG1, BG2, and BG3 were the breeding target traits of MP4, MP5, and MP6, respectively. Single-objective breeding (STB); multi-objective breeding (MTB); hundred-grain weight (HWG); diameter at breast height (DBH); wood basic density (WBD).
Forests 14 01658 g006
Table 1. Breeding strategies used in forest tree species.
SpeciesProgramCycleNStrategyReference
Pinus radiataTBA2 (1996–2011)340Subline and multiple populations[11]
3–4 (2012–)NARolling-front[8]
Pinus teadaNCSU3 (1995–2015)1017Subline within nucleus[12]
4 (2010–2024)NARolling-front[13]
Pinus elliottiiCFGRP1 (1953–1986)2516Unstructured[14]
2 (1987–2002)1017Subline within nucleus[14]
3 (2003–2013)NASubline within nucleus[14]
Pinus sylvestrisSkogforsk1NAMultiple populations[15]
2NAMultiple populations[15]
3NAMultiple populations and partial rolling-front[15]
Picea abiesSkogforsk1NAMultiple populations[16]
2NAMultiple populations and partial rolling-front[17]
TBA, Tree Breeding Australia Ltd., previously called the Southern Tree Breeding Association; NCSU, North Carolina State University; Skogforsk, the Forestry Research Institute of Sweden; CFGRP, the Cooperative Forest Genetics Research Program.
Table 2. Parameters of genetic diversity and genetic gain of the core subpopulation.
Core
Collection
Size (n)MAFNeHeHoPICShiNeiFstPN/%CV/%The Most Feasible K Value
S-10%230.16131.38810.24280.25280.21470.41320.25380.16521.712298.28781
S-15%350.16031.38910.24260.24870.21500.41360.24970.16500.334499.66561
S-20%470.15831.39000.24040.24090.21520.41380.24560.16550.101899.89821
S-25%580.15741.39110.23950.23820.21540.41400.24370.16730.027199.97291
S-30%700.15691.39210.23920.23690.21560.41430.24270.16870.006499.99362
S-35%820.15631.39320.23860.23480.21580.41460.24150.16970.000999.99912
S-40%930.15671.39440.23930.23670.21600.41510.24190.17070.000399.99972
S-45%1050.15611.39550.23840.23480.21620.41520.24070.17160.000399.99973
S-50%1160.15641.39640.23900.23580.21640.41520.24110.172501003
S-55%1280.15631.39730.23890.23550.21650.41580.24080.172901003
S-60%1400.15601.39820.23860.23470.21680.41580.24030.173601004
S-65%1510.15621.39940.23890.23530.21710.41590.24050.175001004
S-70%1630.15621.40040.23880.23620.21730.41620.24030.176701004
MP1-10%230.15161.39440.22920.22340.21600.41500.23960.18493.109996.89011
MP1-20%470.15421.39540.23480.23000.21620.41510.23990.18310.149399.85071
MP1-30%700.15501.39640.23650.22890.21640.41520.23990.18360.007099.99302
MP1-40%930.15521.39730.23710.23290.21670.41570.23970.182601002
MP1-50%1170.15531.39850.23750.23280.21690.41590.23950.180901003
MP1-60%1400.15521.39920.23750.23250.21710.41590.23920.179801003
MP1-70%1630.15501.40040.23730.23190.21730.41620.23880.179201004
MP2-10%230.15251.39420.23060.22910.21620.41490.24110.18572.985997.01411
MP2-20%470.15301.39530.23310.22870.21640.41540.23820.18280.185799.81431
MP2-30%700.15361.39630.23450.22980.21660.41540.23790.18400.013199.98692
MP2-40%930.15381.39730.23520.22970.21680.41580.23780.18250.000399.99973
MP2-50%1170.15431.39830.23600.22980.21690.41570.23800.18110.000399.99973
MP2-60%1400.15471.39920.23660.23180.21710.41600.23830.178601004
MP2-70%1630.15471.40020.23670.23020.21720.41630.23820.178201004
MP3-10%230.15301.39430.23080.23050.21600.41490.24130.18603.603196.39691
MP3-20%470.15401.39530.23420.23200.21630.41530.23930.18440.265499.73461
MP3-30%700.15421.39640.23500.23270.21650.41550.23840.18290.042299.95782
MP3-40%930.15491.39730.23630.23460.21660.41570.23890.18260.008199.99192
MP3-50%1170.15481.39840.23630.23220.21680.41590.23830.18150.000999.99913
MP3-60%1400.15491.39930.23680.23310.21700.41610.23850.180101003
MP3-70%1630.15511.40030.23720.23270.21720.41630.23870.177801004
Entire
collection
2330.15521.40130.23770.23230.21750.41650.23870.177301004
Note: S collection was based on Genetic Diversity; MP1 collection was based on the phenotypic trait of HGW; MP2 collection was based on the phenotypic trait of DBH; MP3 collection was based on the phenotypic trait of WBD; minor allele frequency (MAF); effective numbers of alleles (Ne); expected heterozygosity (He); observed heterozygosity (Ho); polymorphic information content (PIC); Shannon–Wiener index (Shi); Nei’s gene diversity index (Nei); genetic differentiation index (Fst); the proportion of non-informative alleles in the proposed core population relative to non-informative alleles in the breeding population (PN%); the proportion of allele coverage of proposed core populations compared to allele coverage of breeding populations (CV%); The most feasible K value represents the number of groups inferred using ADMIXTURE in each core collection.
Table 3. Mean values and genetic gains of subpopulation phenotypic traits.
Core
Collection
Size (n)HGW/gDBH/cmWD/(kg/m3)ΔGHGWΔGDBHΔGWBD
S-10%230.57521.92306.571.05%−5.94%−6.21%
S-15%350.57023.30316.210.17%−0.02%−3.27%
S-20%470.57023.32326.230.17%0.07%−0.20%
S-25%580.56623.39327.15−0.53%0.37%0.08%
S-30%700.56323.48325.39−1.06%0.76%−0.46%
S-35%820.55624.10327.18−2.29%3.42%0.09%
S-40%930.56824.15326.88−0.18%3.63%0.00%
S-45%1050.55924.35327.32−1.76%4.49%0.13%
S-50%1160.55924.17326.73−1.76%3.72%−0.05%
S-55%1280.56723.97324.92−0.36%2.86%−0.60%
S-60%1400.56023.96324.12−1.59%2.82%−0.85%
S-65%1510.55623.73325.71−2.29%1.83%−0.36%
S-70%1630.57324.00326.900.70%2.99%0.00%
MP1-10%230.87321.60324.9153.42%−7.31%−0.60%
MP1-20%470.79222.52327.7139.18%−3.36%0.25%
MP1-30%700.74823.03328.3331.45%−1.17%0.44%
MP1-40%930.71522.79322.2225.65%−2.20%−1.43%
MP1-50%1170.68622.98322.3320.55%−1.39%−1.39%
MP1-60%1400.66122.94322.3316.16%−1.56%−1.39%
MP1-70%1630.63823.10324.2112.12%−0.87%−0.82%
MP2-10%230.58733.13361.143.16%42.17%10.48%
MP2-20%470.55830.54351.94−1.94%31.05%7.66%
MP2-30%700.53029.33345.33−6.86%25.86%5.64%
MP2-40%930.53528.40344.13−5.98%21.87%5.28%
MP2-50%1170.54027.45342.00−5.10%17.79%4.62%
MP2-60%1400.55625.57337.35−2.29%9.73%3.20%
MP2-70%1630.55825.73332.34−1.94%10.41%1.67%
MP3-10%230.51126.76405.17−10.20%14.83%23.95%
MP3-20%470.52425.82387.76−7.91%10.80%18.62%
MP3-30%700.54325.57376.87−4.58%9.73%15.29%
MP3-40%930.54625.03367.95−4.05%7.41%12.56%
MP3-50%1170.55024.77359.84−3.35%6.29%10.08%
MP3-60%1400.55724.48325.69−2.12%5.05%−0.37%
MP3-70%1630.56124.31346.40−1.41%4.32%5.97%
Entire
Collection
2330.56923.30326.89
Note: ΔGHGW, ΔGDBH, and ΔGWBD refer to the genetic gains of hundred-grain seed weight, diameter at breast height, and wood basic density, respectively.
Disclaimer/Publisher’s Note: The statements, opinions and data contained in all publications are solely those of the individual author(s) and contributor(s) and not of MDPI and/or the editor(s). MDPI and/or the editor(s) disclaim responsibility for any injury to people or property resulting from any ideas, methods, instructions or products referred to in the content.

