Article

High-Density Genetic Map and QTL Analysis in Cunninghamia lanceolate: Insights into Growth and Wood-Color Traits

1
Jiangxi Provincial Key Lab for Plant Biotechnology, Jiangxi Academy of Forestry, Nanchang 330013, China
2
Baiyun Mountain Forest Farm of Qingyuan District, Ji’an 343000, China
*
Author to whom correspondence should be addressed.
Forests 2023, 14(8), 1591; https://doi.org/10.3390/f14081591
Submission received: 30 June 2023 / Revised: 31 July 2023 / Accepted: 2 August 2023 / Published: 5 August 2023
(This article belongs to the Special Issue Long-Term Genetic Improvement and Molecular Breeding of Chinese Fir)

Abstract

:
Cunninghamia lanceolata is one of the most important tree species in China due to its significance both in economy and ecology. The aims of the present study were to construct a high-density genetic map and identify a quantitative trait locus (QTL) for C. lanceolata. In this study, an F1 population comprising 81 individuals was developed. Using specific length amplified fragment sequencing (SLAF-seq) technology, a total of 254,899 loci were found to be polymorphic. After linkage analysis, 2574 markers were used to construct genetic linkage maps. Specifically, 1632 markers were allocated to 11 linkage groups (LGs) for the female map, 1038 for the male map, and 2574 for the integrated map. The integrated map consisted of 4596 single-nucleotide polymorphisms (SNPs) loci, resulting in an average of 1.79 SNP loci per SLAF marker. The marker coverage was 1665.76 cM for the female map, 1436.39 cM for the male map, and 1748.40 cM for the integrated map. The average interval between two adjacent mapped markers was 1.03 cM, 1.40 cM, and 0.68 cM for the female map, male map, and integrated map, respectively. Using the integrated map, we performed interval mapping (logarithm of odds, LOD > 2.0) to detect traits of interest. We identified a total of 2, 1, 2, 5, 1, 2, 1, and 3 QTLs for diameter at breast height, heartwood diameter, heartwood proportion, heartwood a*, heartwood b*, heartwood L*, sapwood a*, and sapwood L*, respectively. The number of markers associated with each QTL ranged from 1 to 14, and each marker explained phenotypic variances ranging from 12.70% to 23.60%. Furthermore, a common QTL was identified for diameter at breast height and heartwood color a*, while another common QTL was observed for heartwood color L* and heartwood color a*. These findings suggest possible pleiotropic effects of the same genes on these traits. In conclusion, we successfully constructed high-density genetic maps for C. lanceolata using the SLAF-seq method with an F1 population. Notably, these linkage maps represent the most comprehensive and densest ones available to date for C. lanceolata and will facilitate future chromosome assignments for C. lanceolata whole-genome sequencing. These identified QTLs will serve as a valuable resource for conducting fine-scale QTL mapping and implementing marker-assisted selection in C. lanceolata, particularly for growth and wood-color traits.

1. Introduction

Chinese fir (Cunninghamia lanceolata (Lamb.) Hook) is a significant indigenous evergreen coniferous tree in China and is naturally distributed in 17 provinces in southern China [1]. This tree species has gained widespread recognition and is extensively utilized for forestation due to its favorable characteristics, such as high productivity, superior wood quality, resistance to diseases and insects, and versatile applications [2]. The cultivation of C. lanceolata has a rich historical background, spanning over 3000 years in China, as evidenced by historical records. Presently, approximately 4 million hectares of C. lanceolata plantations exist, accounting for around 25% of the total plantation area in China [3].
Over the last fifty years, significant progress has been made in the genetic improvement of C. lanceolata, encompassing the collection of elite germplasm, development of third-generation seed orchards, identification of superior clones, and so on [4]. C. lanceolata has produced numerous provenances following a long period of lineage divergence. One notable provenance is red-heart C. lanceolata, which originated in Jiangxi Province. The heartwood of red-heart C. lanceolata exhibits a high proportion of shiny, chestnut-brown xylem surrounding the pith. The heartwood percentage of this species exceeds 50.5% and can reach as high as 80% in mature trees. Additionally, in comparison to other provenances, red-heart C. lanceolata stands out as fine-grained, aromatic, and tough, exhibiting exceptional compressive strength. These unique characteristics make it an excellent raw material for crafts, architecture, and interior decoration [5]. Heartwood, which is the innermost and older wood within a tree, is characterized by the presence of deposits of resinous, phenolic, and other compounds. The presence of these deposits plays a crucial role in enhancing the wood’s color and durability [6]. The red-heart characteristic of red-heart C. lanceolata enhances its visual appeal and increases its overall value. As a result, red-heart C. lanceolata has gained rapid popularity in recent years. Previous reports have revealed high heritability estimates for heartwood diameter (heartwood length) in red-heart C. lanceolata [7,8]. Genetic variation in heartwood diameter or heartwood percentage has also been observed in a variety of other tree species, such as Pinus sylvestris [9], Eucalyptus bosistoana [10], Larch [11], and Tectona grandis [12]. Apart from heartwood diameter, wood color is considered another vital attribute for red-heart C. lanceolata [13]. Despite the absence of literature reports on the genetic control of wood color in red-heart C. lanceolata, relevant findings have been reported in other tree species, such as Calycophyllum spruceanum [14], Tectona grandis [15], Quercus petraea and Q. robur [16], Picea abies [17]. However, the molecular genetic basis underlying heartwood diameter and wood color remains unexplored across all tree species.
In the last two decades, various molecular markers such as allozymes [18], sequence-related amplified polymorphism (SRAP) [2,19,20], random amplified polymorphic DNA (RAPD) [21,22,23], simple sequence repeats (SSR) [24,25,26], and inter-simple sequence repeats (ISSR) [27,28,29] have been employed to assess the germplasm resources of C. lanceolata. Genetic maps are valuable tools for understanding the genomic structure of a species and identifying quantitative trait loci (QTL) associated with important traits [30,31]. However, the linkage maps previously built for C. lanceolata using RAPDs and amplified fragment length polymorphisms (AFLPs) have certain drawbacks, including a restricted number of markers and anonymous information [32,33]. Furthermore, since de novo genome sequencing of C. lanceolata has not been carried out thus far, high-density genetic maps constructed using sequence-based markers are highly desired for C. lanceolata.
The integration of high-throughput sequencing technologies with restriction enzymes has greatly facilitated the production of numerous sequence-based markers. These markers are crucial for constructing high-density genetic linkage maps due to their abundance, even distribution across the genome, and their association with specific genomic sequences [34,35]. One such technique that has been recently developed is specific length amplified fragment sequencing (SLAF-seq) [36]. This approach utilizes reduced-representation libraries and high-throughput sequencing for large-scale genotyping and the identification of a substantial number of single-nucleotide polymorphisms (SNPs). SLAF-seq has been widely applied in constructing genetic maps for various plant species, demonstrating its remarkable efficacy [37,38,39]. So, in this study, high-density genetic linkage maps for C. lanceolata were constructed using the SLAF-seq approach. Then, QTLs linked with growth and wood-color traits were identified. These results will facilitate chromosome assignments, fine-scale QTL mapping and molecular marker-assisted breeding for C. lanceolata.

2. Materials and Methods

2.1. Mapping Population

To create the mapping population, a cross-pollination between R1 and C23 was conducted in the spring of 1998, and the resulting seeds were collected in the fall of the same year. The maternal parent (R1) was sourced from the Rongshui provenance in Guangxi Zhuang Autonomous Region, exhibiting a lower heartwood proportion of 24%. On the other hand, the male parent (C23) was obtained from the red-heart C. lanceolata first-generation seed orchard, situated in Baiyun Mountain Forest Farm in Jiangxi Province, and displayed a higher heartwood proportion of 67%. Subsequently, the collected seeds were then sown in a commercial nursery in March 1999. In 2000, the progeny trial was established at Baiyun Mountain Forest Farm with a spacing of 2 × 2 m. As of 2018, there were 81 remaining progenies in the trial. Needle samples were collected during the summer of 2018, and DNA extraction was performed using the cetyltrimethylammonium bromide (CTAB) protocol [40]. The DNA concentrations were determined using a NanoDrop™ 2000/2000c spectrophotometer (Thermo Scientific, Waltham, MA, USA), and the extracted DNA samples were stored at −80 °C until further utilization.

2.2. Measurement of Heartwood Traits

To assess wood-color traits, a core sample with a diameter of 5.15 mm was taken at breast height from each parent and F1 progeny during the winter of 2018. The visual method was employed to determine heartwood delimitation, as the distinctive color of heartwood in C. lanceolata differs from the sapwood. The over-bark diameter (diameter at breast height) and heartwood diameter were first measured. Subsequently, the heartwood proportion was calculated. The collected core samples were dried at room temperature. For color measurement, a blade was utilized to horizontally remove half of each core, revealing the dressed radial surfaces suitable for the assessment. To reduce oxidation and photochemical impacts, the color measurements were promptly conducted right after cutting, without any prior treatment. A NR10QC colorimeter (Shenzhen 3nh Technology, Shenzhen, China) was utilized for color measurements, and the color parameters were determined using the CIELab system. The CIELab system estimates three variables: coordinate L* for lightness, representing the positoin on the black–white axis (L* = 0 for black, L* = 100 for white); coordinate a* for the position on the red–green axis (positive values for red, negative values for green), and coordinate b* for the position on the yellow–blue axis (positive values for yellow, negative values for blue) [13]. At 8 mm radial intervals, color measurements were obtained on both sides of the core. The average value of these measurement data represented the color values for either the heartwood or sapwood.

2.3. SLAF Marker Generation

To generate SLAF (specific locus amplified fragment) markers, SLAF-predict software (V1.0, Biomarker, Beijing, China) was utilized, using the genome sequences of Picea abies as a reference. The restriction enzyme RsaI was chosen for constructing the SLAF library. The library-construction process followed the protocol described by Sun et al. [36] with minor modifications. Initially, 0.5 μg of genomic DNA from each progeny was digested with 5 U of RsaI at 37 °C for 6 h. Subsequently, the mixture was incubated at 65 °C for 20 min with T4 DNA ligase, ATP, and RsaI adapters. This was followed by an additional incubation at 20 °C for 12 h. PCR reactions were performed using a dNTP mix, diluted restriction-ligation DNA samples, Q5® High-Fidelity DNA Polymerase, blunting buffer, and primers with the sequences 5′-AATGATACGGCG ACCACCGA-3′ and 5′-CAAGCAGAA GACGGCATACG-3′ (PAGE purified, Life Technologies, New York, NY, USA). The PCR products were purified using Agencourt AMPure XP beads (Beckman Coulter, High Wycombe, UK). Purified products were then subjected to 2% agarose gel electrophoresis. Fragments ranging from 414 to 464 base pairs in size were excised from the gel and purified using a QIAquick gel-extraction kit (Qiagen, Hilden, Germany). The gel-purified products were diluted, and pair-end sequencing with each end being 125 base pairs in length was performed on an Illumina HiSeq 2500 system (Illumina, Inc., San Diego, CA, USA) following the manufacturer’s recommendations.

2.4. SLAF-Seq Data Analysis and Genotyping

Reads with a quality score lower than 20e were removed from the analysis. The remaining reads were sorted to each progeny [36]. Clean reads were clustered together based on a similarity threshold of 90%. Clusters of sequences were defined as SLAF loci. Single-nucleotide polymorphism (SNP) loci within each SLAF locus were detected by comparing the sequences between the parents. Only SLAFs with two to four alleles were retained as potential polymorphic markers and were sorted into eight segregation types (aa × bb, ab × cc, ab × cd, cc × ab, ef × eg, hk × hk, lm × ll and nn × np). High-quality SLAF markers for genetic mapping were filtered based on the following criteria: (1) The average sequence depths should be greater than 14.74-fold in each progeny and greater than 58.21-fold in the parents. (2) Markers with more than 58.21% missing data were filtered out. (3) The chi-square test was performed to examine segregation distortion. Markers with significant segregation distortion (p > 0.05) were initially excluded from map construction but could be added later as accessory markers. By applying these filtering criteria, high-quality SLAF markers suitable for genetic mapping were selected, ensuring the reliability and accuracy of the subsequent analysis.

2.5. Map Construction

Marker loci were initially grouped into linkage groups using modified logarithm of odds (MLOD) scores greater than 5. Recombinant frequencies and LOD scores were calculated using two-point analysis. Enhanced Gibbs sampling, spatial sampling and simulated annealing algorithms were employed for marker ordering [41]. Skewed markers were added to the map using a multipoint method of maximum likelihood. Map distances were estimated using the Kosambi mapping function. Haplotype maps and heat maps were employed to evaluate the quality of the constructed map, following the approach described by West et al. [42].

2.6. QTL Analysis

The QTL analysis of the growth and wood-color traits was conducted using the MapQTL V5.0 software [43]. Interval mapping was employed to detect the QTL loci within the 11 linkage groups (LGs) of the integrated map. The threshold of odds ratio (LOD) was used as the criterion for identifying QTL. A LOD threshold >2.0 was considered to have a significant QTL.

3. Results

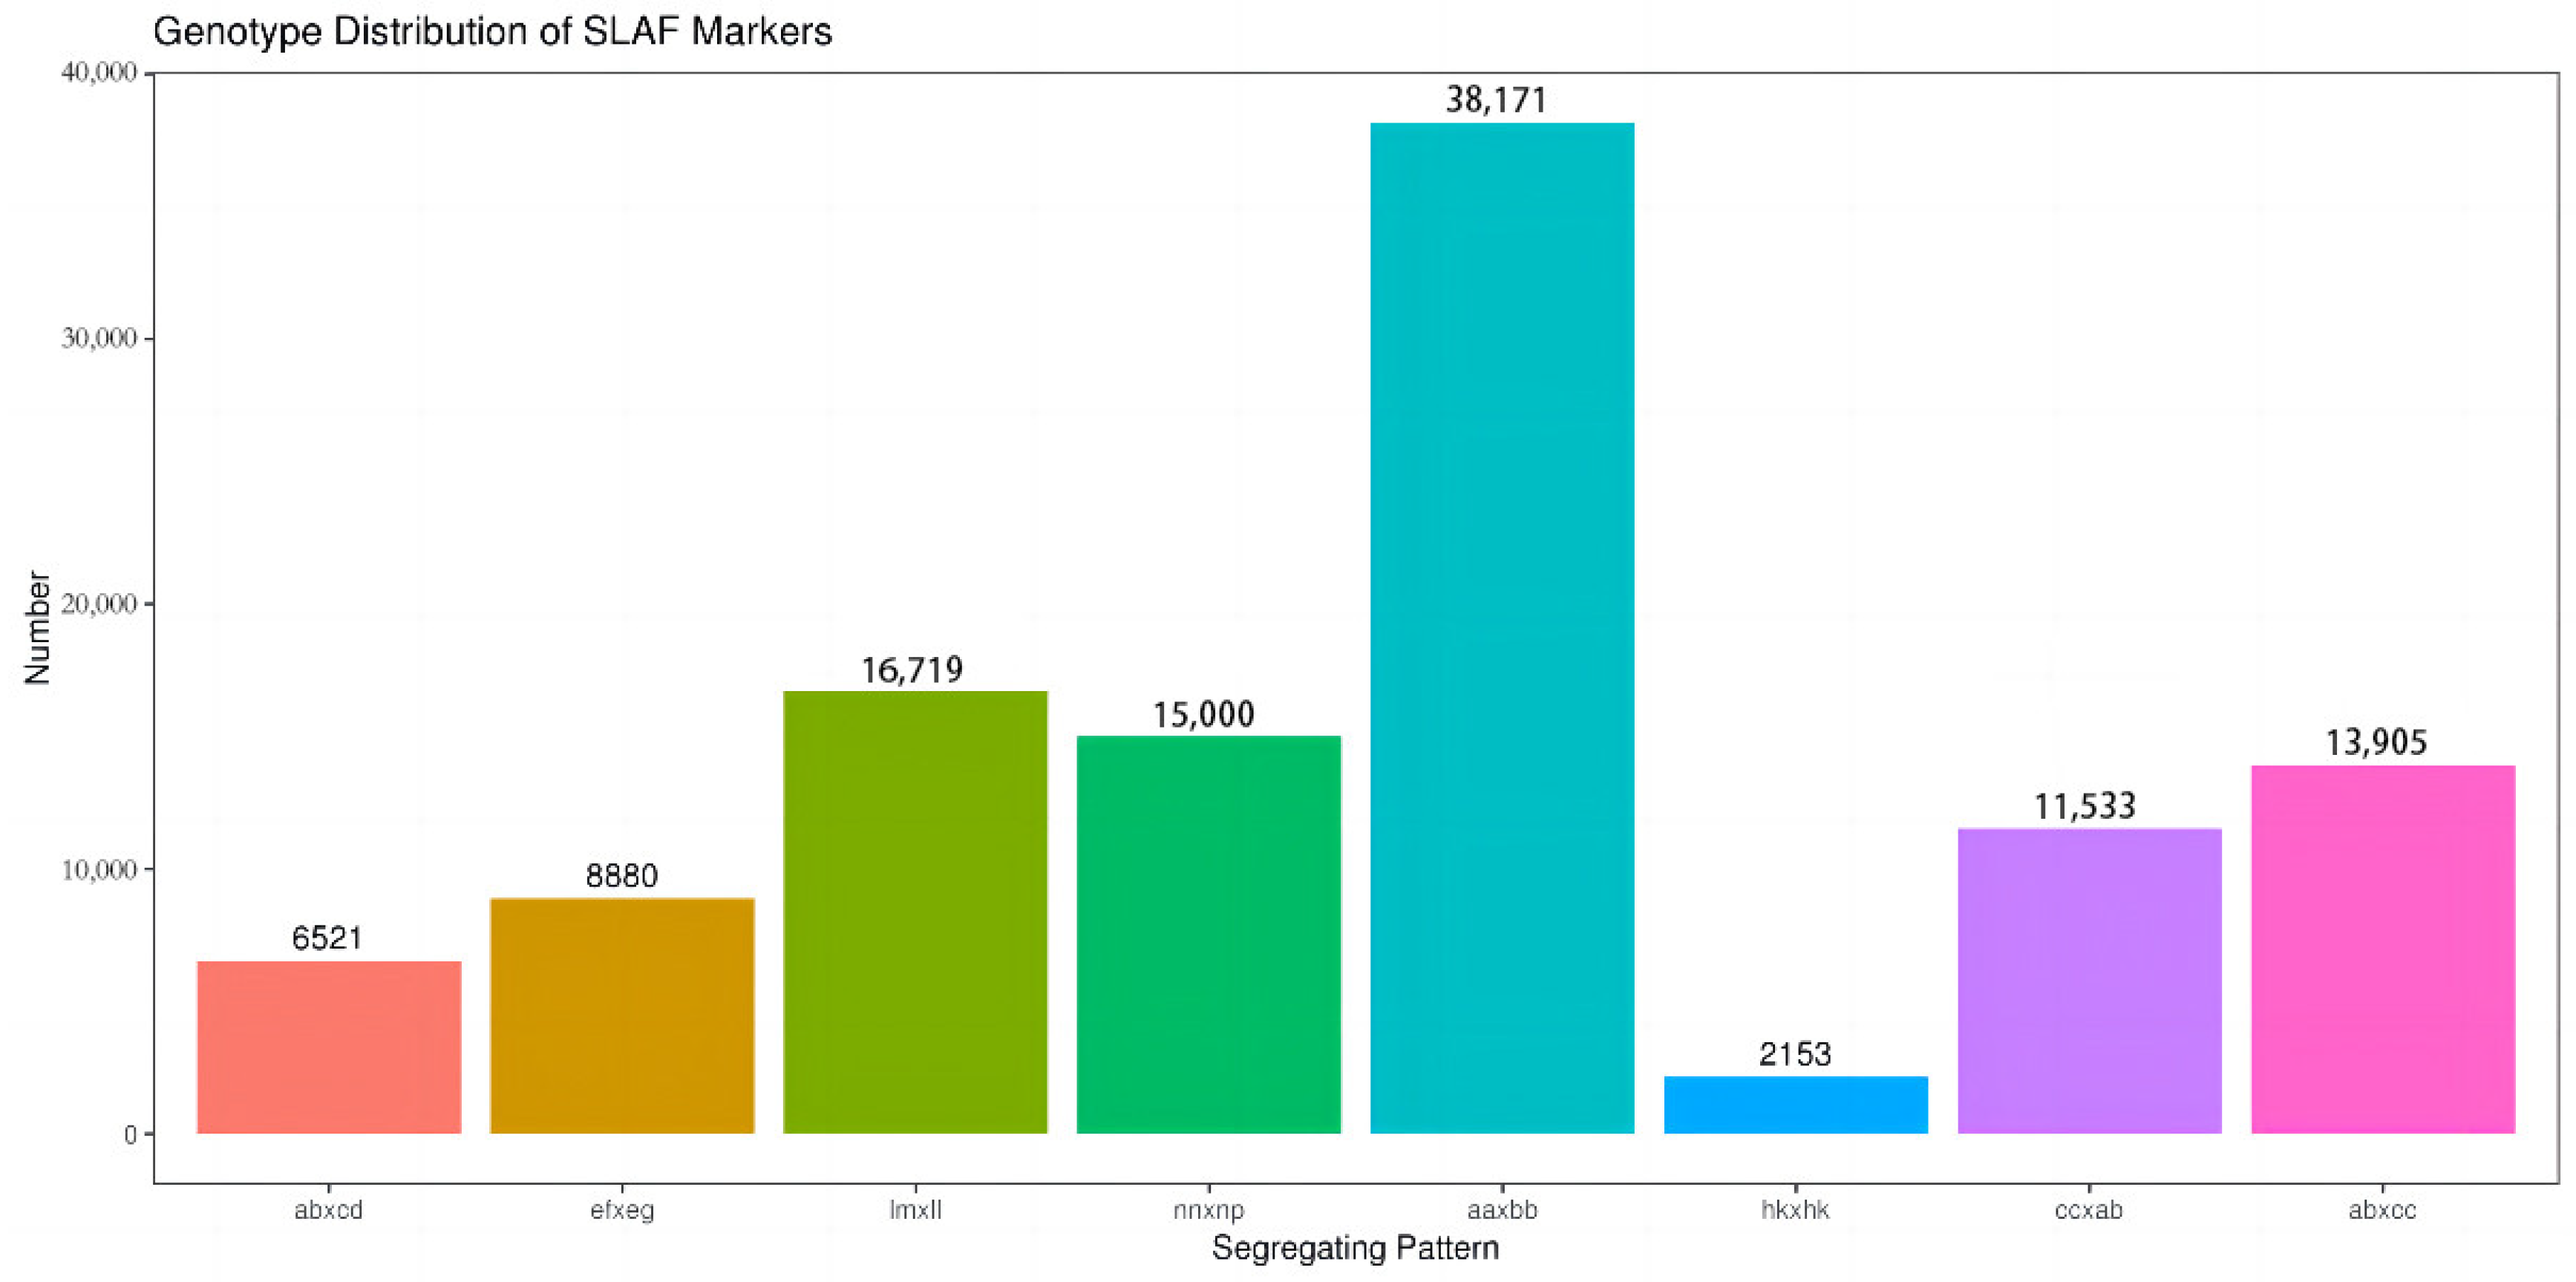
3.1. Analysis of SLAF-Seq Data and SLAF Markers

A total of 120 million reads were generated through SLAF-seq. The sequencing data quality was evaluated using the average Q30 ratio, which was found to be 93.78% in this investigation, indicating a high level of sequencing accuracy. Additionally, the average guanine cytosine (GC) content, which is a measure of the DNA composition, was found to be 37.75% (Table 1). After the removal of low-quality reads, a total of 532,450 SLAFs were obtained from the sequencing data. Among the 532,450 SLAF markers, 254,899 (47.87%) were identified as polymorphic. The average sequence depths for the parents and the progeny were 39.89 and 10.72, respectively. After excluding SLAF markers that lacked parent information and those containing repeat sequences, a total of 112,882 markers were successfully genotyped. These markers were then classified into eight segregation types: ab × cd (6521), ef × eg (8880), Im × II (16,719), nn × np (15,000), aa × bb (38,171), hk × hk (2153), cc × ab (11,533), and ab × cc (13,905) (Figure 1). Low-quality SLAF markers, markers displaying segregation distortion, and markers unsuitable for map construction were excluded. As a result, 4264 polymorphic markers remained, which were classified into four segregation types: ef × eg (52), hk × hk (153), lm × ll (2165), and nn × np (1894). These markers were considered suitable for subsequent map construction and further analysis.

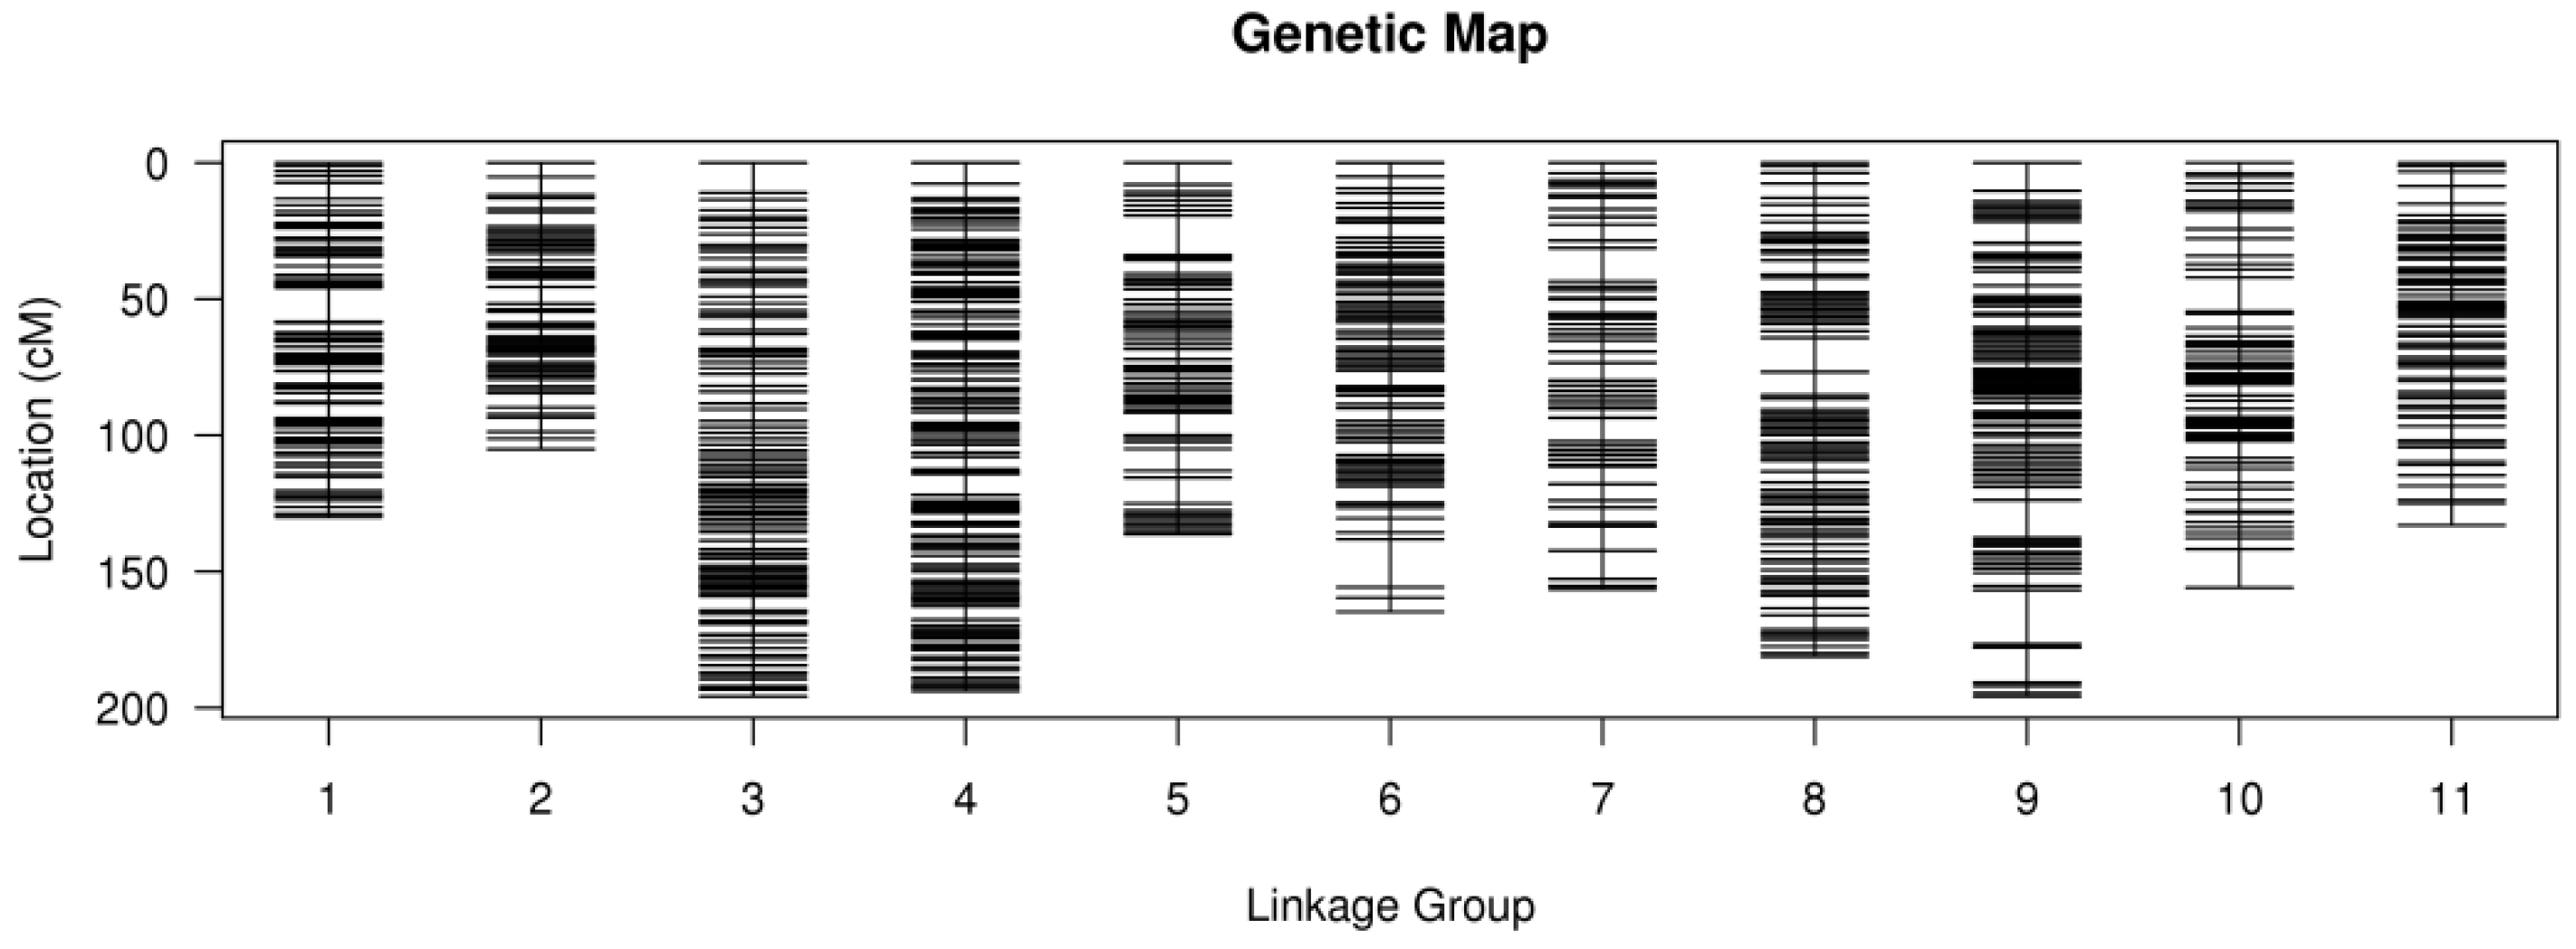
3.2. The C. lanceolata Genetic Maps

After linkage analysis, 2574 (Supplementary Files S1 and S2) of the 4264 markers were mapped onto the genetic map. A total of 173 markers (6.72%) deviated from the Mendelian segregation patterns. The average marker integrity on the map was 99.94%. The female map had 1632 markers, the male map contained 1038 markers and the integrated map comprised 2574 markers, with each of the three genetic maps consisting of 11 linkage groups (LGs) (Figure 2, Supplementary File S3). The female map’s linkage groups had a total size of 1665.76 cM, the male map’s linkage groups spanned 1436.39 cM, and the integrated map’s linkage groups covered 1748.40 cM (Table 2). The average interval between two adjacent mapped markers was 1.03 cM for the female map, 1.40 cM for the male map, and 0.68 cM for the integrated map. Among the linkage groups (LGs), LG3 exhibited the highest number of markers in the female map (354 markers), LG4 also displayed the highest number in the male map (279 markers), and LG3 also had the highest number in the integrated map (387 markers). On the other hand, LG10 had the fewest markers in the female map (15 markers), LG2 had the least number of markers in the male map (5 markers), and LG10 also exhibited the lowest count in the integrated map (98 markers). In the female map, LG9 had the longest length (188.19 cM), while in the male map, LG10 had the longest length (192.01 cM). In the integrated map, LG3 exhibited the longest length (195.82 cM). On the other hand, the shortest LGs were LG10 for the female map (81.33 cM), LG2 for the male map (30.70 cM), and LG2 for the integrated map (105.10 cM). Among the 2574 mapped markers, a total of 4596 SNP loci were detected, resulting in an average of 1.79 SNP loci per SLAF marker (Supplementary File S4). The majority of the detected SNPs were of the transition type, accounting for 69.69% (3203 loci) of all SNPs, while the remaining SNPs were of the transversion type.

3.3. Evaluation of the Genetic Map

To evaluate the quality of the genetic map constructed for C. lanceolata, haplotype maps were created for each parent and the 81 progenies using the SLAF markers. These haplotype maps allowed for the visualization of double crossovers. The analysis revealed that the ratio of double crossovers was approximately 9.54%. The percentage of missing data for each linkage group (LG) was close to 0.00%, indicating a high level of data completeness (Table 3). Heat mapping was another method employed to assess the quality of the genetic map. The heat maps were generated based on the pairwise recombination values of the mapped SLAF markers. An important observation was that as the genetic distance between mapped markers increased, the pairwise linkage became looser. This trend suggested that the markers within each LG were accurately ordered (Supplementary File S6). Overall, the analysis demonstrated that the genetic map constructed for C. lanceolata was of high quality.

3.4. Analysis of Variation in Quantitative Traits

The quantitative traits of growth and wood color were analyzed based on statistical data from 70 F1 offspring (Supplementary File S7). Descriptive statistics of the traits are shown in Table 4. The diameter at breast height varied from 5.4 cm to 25.14 cm, while heartwood diameter ranged from 2.62 cm to 16.87 cm, and heartwood proportion varied from 37% to 77%. Additionally, heartwood a* ranged from 7.34 to 10.73, heartwood b* varied from 15.45 to 21.20, and heartwood L* ranged from 65.95% to 78.20%. Moreover, the ranges of sapwood a*, sapwood b*, and sapwood L* were from 3.75 to 6.72, 13.05 to 17.57, and 79.40 to 86.40, respectively. Among the measured traits, heartwood diameter exhibited the highest phenotypic variation, with a value of 0.391. On the other hand, sapwood L* exhibited the lowest phenotypic variation, with a value of 0.019. Frequency distribution graphs were constructed for each trait, and they exhibited a close approximation to a normal distribution (Kolmogorov–Smirnov p > 0.05) (Supplementary File S8).

3.5. QTL Description

QTL analysis was conducted using both phenotypic and genotypic data on the F1 offspring, and a total of 17 quantitative trait loci (QTLs) were identified using interval mapping with a LOD > 2.0 (Supplementary File S9). Two QTLs were identified for diameter at breast height, one located at 78.89 cM on LG5, and another one at 12.709 cM on LG7. The QTL on LG5 contained 3 markers, while the QTL on LG7 comprised 14 markers. The phenotypic variance explained by each marker ranged from 13.30% to 13.40%, with an average of 13.38%. Their LOD scores varied from 2.11 to 2.12, with an average of 2.12. One QTL was detected for heartwood diameter, located at 98.823 cM on LG1. This QTL contained one marker. The phenotypic variance explained by this marker was 12.80%. The LOD score for this QTL was 2.02. Two QTLs were discovered for heartwood proportion, one QTL was located between 127.771 and 129.321 cM on LG3, while the other was found at 64.961 cM on LG5. The QTL on LG3 contained eleven markers, while the QTL on LG5 had two markers. The phenotypic variance explained by each marker ranged from 15.60% to 15.90%, with an average of 15.65%. The LOD scores varied from 2.51 to 2.56, with an average of 2.52. Five QTLs were detected for heartwood a*, with positions at 13.744 cM, between 43.119 and 43.53 cM, between 72.103 and 74.63 cM, at 78.89 cM on LG5, as well as between 140.072 and 142.751 cM on LG8. The number of markers associated with each QTL varied from one to fourteen. The phenotypic variance explained by each marker ranged from 12.60% to 14.10%, with an average of 13.48%. The LOD scores ranged from 2.04 to 2.19, with an average of 2.19. One QTL was identified for heartwood b*, located at 59.907 cM on LG11. This QTL contained three markers. The phenotypic variance explained by each marker was 16%. The LOD score for this QTL was 2.66. Two QTLs were detected for heartwood L* on LG5, with one located between 43.119 and 43.53 cM, and the other at 46.367 cM, respectively. Each of the two QTLs contained seven markers. The phenotypic variance explained by each marker ranged from 23.20% to 23.60%, with an average of 23.40%. The LOD scores varied from 4.01 to 4.09, with an average of 4.05. One QTL was identified for sapwood a*, located between 178.158 and 181.940 cM on LG3. This QTL contained three markers. The phenotypic variance explained by each marker ranged from 15.20% to 15.60%, with an average of 15.33%. The LOD scores varied from 2.50 to 2.57, with an average of 2.53. A total of three QTLs were identified for sapwood L*. One QTL was located between 135.802 and 137.718 cM on LG10, another was between 72.570 and 73.820 cM on LG11, and the third one was found at 21.831 cM on LG8, respectively. The QTL on LG10 contained four markers, the QTL on LG11 included four markers, and the QTL on LG8 was associated with one marker. The phenotypic variance explained by each marker ranged from 12.08% to 14.00%, with an average of 12.95%. The LOD scores varied from 2.07 to 2.30, with an average of 2.13. No QTL was detected for sapwood b*. Furthermore, two common QTL were observed. Namely, a common QTL was found for diameter at breast height and heartwood a*, located at 78.89 cM on LG5. Another common QTL was identified for heartwood L* and heartwood a*, located on LG5 between 43.119 and 43.53 cM.

4. Discussion

4.1. Mapping Population

Selecting mapping population is a crucial factor in building genetic-linkage maps. The construction of inbred lines for tree species like C. lanceolata presents challenges due to their biological characteristics. However, tree species exhibit high heterozygosity, enabling the generation of large progenies through full-sib or half-sib crosses. The pseudo-testcross strategy, proposed by Grattapaglia and Sederoff in 1994 [44], is a widely employed method for genetic-linkage mapping in forest trees. This strategy involves selecting single-dose markers that are present in one parent and absent in the other. In the present study, an F1 population was created by controlled pollination between an ordinary C. lanceolata (R1) with a lower heartwood proportion and a red-heart C. lanceolata (C23) with a higher heartwood proportion. The main objective of this breeding strategy is to improve the heartwood quality, representing an important goal for C. lanceolata breeding in China.

4.2. The Segregation of SLAF Markers

SLAF-seq is a sequencing technique that can generate a large number of markers and is particularly useful for species without a reference genome sequence, such as C. lanceolata. In this study, SLAF-seq was employed to generate a total of 254,899 polymorphic SLAFs (Table 1), resulting in 112,882 successfully genotyped markers. These markers were then categorized into eight different segregation types based on their inheritance patterns (Figure 1). It is worth noting that the ratios of these segregation types were not uniform, as the recombination frequency can vary across different chromosomes during meiosis [35]. After linkage analysis, a subset of 2574 SLAF markers was selected to construct the genetic maps. Within these markers, a total of 4596 SNP loci were detected, with an average of 1.79 SNP loci per SLAF marker (Table 3, Supplementary File S4). This demonstrates the successful development of SNP markers using SLAF-seq for C. lanceolata. Segregation distortion, which refers to the deviation of allele frequencies from the expected Mendelian ratios, is a common phenomenon observed in many plant species [45,46]. In the present study, a relatively low percentage of markers (6.72%) on the integrated map showed significant segregation distortion. This suggests that the majority of markers followed the expected Mendelian ratios. Interestingly, previous studies in other plant species have reported higher rates of segregation distortion. For instance, in tea plants, approximately 25.3% of the mapped markers exhibited partial separation [47], and in apricot, around 35% of the mapped markers deviated from Mendelian segregation patterns [48]. Segregation distortion can be caused by various factors such as self-incompatibility alleles, deleterious recessive alleles, structural rearrangements, or differences in DNA content [40,46]. These segregation distortion markers were still used in the construction of the genetic map in this study. This decision was based on previous findings that segregation distortion markers can actually increase the coverage of the genome and improve the detection of linked QTLs [49,50].

4.3. Linkage Mapping

The construction of a high-density genetic linkage map is crucial for accurate QTL mapping of important traits. He et al. [32] constructed the first genetic linkage map of C. lanceolata by using RAPD markers and intraspecific cross (J0 × F11) with a total of 78 progenies. A total of 22 markers were assigned to eight LGs of the female map, while 13 markers were assigned to four LGs of the male map. Tong et al. [33] utilized the Jurong0 × Rouye F1 population to construct a genetic map based on AFLP makers. The female map included 101 markers, while the male map had 94 markers. These genetic maps of C. lanceolata were limited in their ability to accurately detect QTLs due to the lack of a large number of molecular markers with sufficient sequence information. However, in the present study, a total of 2574 markers were utilized to construct genetic-linkage maps. The average intervals between adjacent mapped markers were 0.68 cM for the integrated map, indicating a higher marker density compared to previous maps. The 11 LGs corresponded to the haploid genome of C. lanceolata, which consists of 11 chromosomes [51]. The marker density of 10 cM is considered sufficient for the accurate estimation of QTL positions in populations with sizes ranging from 100 to 200 individuals [52,53]. Therefore, the constructed linkage map could meet the requirements for QTL analysis. In the integrated map, the percentage of the gaps between markers < 5 cM was 97.55%, with a maximum gap of 19.79 cM in LG 9. This shows that there may be some recombinations that have not been found in these areas. Mapping population size and different enzyme combinations in SLAF library construction may affect the gaps between adjacent markers [54]. The total linkage distance of the integrated map was 1748.40 cM. However, in the study of Tong et al. [36], they obtained two maps: 2282.6 cM for the female map and 2565.8 cM for the male map. Many factors may cause the inconsistency in total genetic distance, such as genetic backgrounds of mapping population, population types, marker density, segregation distortion, and mapping algorithms [55,56]. Furthermore, the quality of the genetic map was confirmed to be efficient, accurate, and saturated through assessments using the haplotype map (Supplementary File S5) and the heat map (Supplementary File S6).

4.4. QTL Mapping

Tree breeding is difficult and challenging due to the large plant size, the long life cycle, and high heterozygosity. However, the use of molecular marker-assisted techniques can expedite the identification of seedlings with desirable traits, thus reducing tree breeding time. Heartwood diameter and wood color are two crucial traits in C. lanceolata that can significantly increase its timber price. The desire of consumers to pay a premium for red-heart C. lanceolata has resulted in a strong focus on breeding cultivars with high heartwood percentages for C. lanceolata breeding [57]. In this study, wood-color traits were evaluated using the CIELab color system, which is widely used for determining wood-color variables [14,15]. The quantitative nature of growth and color traits, as indicated by the variable coefficient (VC) and frequency distribution graphs, makes them suitable for QTL mapping. The QTL mapping analysis conducted in this study focused on evaluating heartwood growth and wood-color traits in C. lanceolata, marking it as the pioneering study of its kind in tree species. LOD is a critical factor to judge loci linkage in QTL mapping; it is affected by mapping population size, trait heritability and so on [50]. There are no strict rules for the LOD threshold in QTL mapping. Churchill et al. [58] and Chen et al. [59] considered that an LOD threshold of 2–3 could effectively reduce false positives and control the error rate within 0.05 in QTL-mapping analysis. Furthermore, Lander, E. S., and Botstein, D. [60] suggested an LOD > 2.0 to ensure an overall false positive (type 1 error) rate for detecting QTL. So, utilizing interval mapping with a LOD threshold greater than 2.0 and the high-density genetic map for C. lanceolata, a total of 17 QTLs were identified herein. The number of markers associated with each QTL ranged from 1 to 14, and the phenotypic variance explained by each marker ranged from 12.80% to 23.60%. Moreover, QTLs that explain more than 10% of the phenotypic variance are often considered “major” QTLs [6]. In this study, the identified QTLs all met this criterion. The QTL cluster is a part of the chromosome having multiple QTL loci linked with several traits [61,62]. Breeders are interesting in such cluster because they can focus their work on these QTL regions. In this study, we identified two QTL clusters on LG5, each comprising three QTLs. The approximate positions of these two clusters were identified at around 43.119–46.367 cM and 64.961–78.89 cM, respectively. However, for a QTL to be classified as a “major” QTL, it should also exhibit stability across different seasons or locations [63]. Further investigations are required to determine the stability and consistency of these identified QTLs in different years. Furthermore, the presence of common QTLs for diameter at breast height and heartwood a*, as well as for heartwood L* and heartwood a*, indicates the potential pleiotropic effects of the same genes influencing these traits. In summary, the QTLs identified in this study can be utilized in future experiments to develop efficient markers for C. lanceolata growth and wood-color traits, thus facilitating the progress of C. lanceolata-breeding projects.

5. Conclusions

In conclusion, this study successfully constructed high-density genetic-linkage maps for C. lanceolata using the SLAF-seq method. To our knowledge, the maps we constructed were the densest ones to date for C. lanceolata, which will provide a valuable resource for chromosome assignments in C. lanceolata genome sequencing. Furthermore, QTL mapping analysis identified 17 QTLs associated with growth and wood-color traits, which present the first QTL identification for heartwood growth and wood-color traits in tree species. These findings will have practical implications to improve the breeding efficiency as well as wood quality for C. lanceolata and other tree species through marker-assisted selection and genetic manipulation in the future.

Supplementary Materials

The following supporting information can be downloaded at https://www.mdpi.com/article/10.3390/f14081591/s1: File S1: Sequences of per SLAF marker on 11 linkage groups (LGs) for the integrated map. File S2: Markers genotypes of per SLAF marker for each F1 individual. File S3: The SLAF markers as well as their locations on 11 linkage groups (LGs) for the integrated map. File S4: Sequences containing SNPs. SNP loci are all in lowercase. File S5: Haplotype maps for the integrated map. File S6: Heat maps for the integrated map. File S7: Phenotype data of F1 offspring individuals. File S8: The frequency distribution graphs for each trait. File S9: Quantitative trait loci for each trait.

Author Contributions

This study was designed by X.C. and F.X.; data collections were performed by X.C., C.X., H.X., Q.C. and S.S.; data analysis was performed by X.C. and Y.L.; authors X.C. and F.X. wrote the paper. All authors have read and agreed to the published version of the manuscript.

Funding

This work was funded by the National Key Research and Development Plan Project Sub-subject (No. 2022YFD2200201-04); the Key Research and Development Project of Jiangxi Province (No. 20223BBF61005); the Scientific and Technological Innovation Project of Jiangxi Province Department of Forestry [No. (2021)11]; and the Young scientific and technical talents cultivation Project in Jiangxi Academy of Forestry (No. 2023521101).

Data Availability Statement

All relevant data are within the paper and its Supplementary Materials Files.

Conflicts of Interest

The authors declare no conflict of interest.

References

  1. Bian, L.; Shi, J.; Zheng, R.; Chen, J.; Wu, H. Genetic parameters and genotype–environment interactions of Chinese fir (Cunninghamia lanceolata) in Fujian Province. Can. J. For. Res. 2014, 44, 582–592. [Google Scholar] [CrossRef]
  2. Duan, H.; Hu, D.; Li, Y.; Zheng, H. Characterization of a collection of Chinese fir elite genotypes using sequence-related amplified polymorphism markers. J. For. Res.-Jpn. 2016, 27, 1105–1110. [Google Scholar] [CrossRef]
  3. Shi, J.; Zhen, Y.; Zheng, R. Proteome profiling of early seed development in Cunninghamia lanceolata (Lamb.) Hook. J. Exp. Bot. 2010, 61, 2367–2381. [Google Scholar] [CrossRef] [Green Version]
  4. Zheng, R.; Shi, J.; Xiao, H.; Su, S.; Xu, L.; Ouyang, L.; Zhang, Z.; Ye, D.; Fang, Y. Genetic variation and early selection of growth traits in 8-year-old open-pollinated progenies of the 3rd germplasm of Chinese fir. J. Nanjing For. Univ. Nat. Sci. Ed. 2014, 6, 38–42. [Google Scholar]
  5. Wen, H.; Deng, X.; Zhang, Y.; Wei, X.; Wang, G.; Zhou, B.; Xiang, W.; Zhu, N. Cunninghamia lanceolata variant with red-heart wood: A mini-review. Dendrobiology 2018, 79, 156–167. [Google Scholar] [CrossRef] [Green Version]
  6. Searle, S.D.; Owen, J.V. Variation in basic wood density and percentage heartwood in temperate Australian Acacia species. Aust. For. 2005, 68, 11. [Google Scholar] [CrossRef]
  7. Zeng, Z.; Yang, X.; Xiao, F.; Ye, J.; Yu, J.; Wang, X. Study on variability of timber characters and gene resources utilization for Chenshan Red-heart Chinese fir. Jiangxi For. Sci. Technol. 2001, 3, 1–6. [Google Scholar]
  8. Chen, X.; Xiao, F.; Yu, L.; Lou, Y.; Xu, H. Estimation of genetic parameters of Cunninghamia lanceolata growth traits based on mixed linear model. J. For. Environ. 2018, 38, 419–424. [Google Scholar]
  9. Ericsson, T.; Fries, A. High heritability for heartwood in north Swedish Scots pine. Theor. Appl. Genet. 1999, 98, 732–735. [Google Scholar] [CrossRef]
  10. Yanjie, L.; Apiolaza, L.A.; Clemens, A. Genetic variation in heartwood properties and growth traits of Eucalyptus bosistoana. Eur. J. For. Res. 2018, 137, 565–572. [Google Scholar]
  11. Pâques, L.E. Genetic Control of Heartwood Content in Larch. Silvae Genet. 2001, 50, 69–75. [Google Scholar]
  12. Schenk, L.; Ellert, U.; Neuhauser, H. Inheritance Pattern of Growth and Wood Traits in Teak (Tectona grandis L.f.). Silvae Genet. 2009, 58, 97–101. [Google Scholar]
  13. Róger, M.; Berrocal, A. Wood colour variation in sapwood and heartwood of young trees of Tectona grandis and its relationship with plantation characteristics, site, and decay resistance. Ann. For. Sci. 2010, 67, 109. [Google Scholar]
  14. Montes, C.S.; Hernández, R.E.; Beaulieu, J.; Weber, J.C. Genetic variation in wood color and its correlations with tree growth and wood density of Calycophyllum spruceanum at an early age in the Peruvian Amazon. New For. 2008, 35, 57–73. [Google Scholar] [CrossRef]
  15. Moya, R.; Marín, J.D.; Murillo, O.; Leandro, L. Wood physical properties, color, decay resistance and stiffness in Tectona grandis clones with evidence of genetic control. Silvae Genet. 2013, 62, 142–152. [Google Scholar] [CrossRef] [Green Version]
  16. Mosedale, J.; Charrier, B.; Janin, G. Genetic control of wood colour, density and heartwood ellagitannin concentration in European oak (Quercus petraea and Q. robur). Forestry 1996, 69, 111–124. [Google Scholar] [CrossRef] [Green Version]
  17. Hannrup, B.; Cahalan, C.; Chantre, G.; Grabner, M.; Karlsson, B.; Bayon, I.L.; Jones, G.L.; Müller, U.; Pereira, H.; Rodrigues, J.C.; et al. Genetic parameters of growth and wood quality traits in Picea abies. Scand. J. For. Res. 2004, 19, 14–29. [Google Scholar] [CrossRef]
  18. Shao, S.; Yu, M.; Qian, H.; Jin, Z.; De, Y.I. Study on genetic diversity of an artificial Chinese fir forest under interference and natural conditions. J. Zhejiang For. Sci. Technol. 2004, 24, 12–14. [Google Scholar]
  19. Zheng, H.; Hu, D.; Wang, R.; Wu, S. Genetic divergence of the Chinese Fir fast-growing genotypes revealed by SRAP markers. J. Southwest For. Univ. 2017, 37, 14–20. [Google Scholar]
  20. Li, M.; Chen, X.; Huang, M.; Wu, P.; Ma, X. Genetic diversity and relationships of ancient Chinese fir (Cunninghamia lanceolata) genotypes revealed by sequence-related amplified polymorphism markers. Genet. Resour. Crop. Evol. 2017, 64, 1087–1099. [Google Scholar] [CrossRef]
  21. You, Y.; Hong, J. Application of RAPD marker to genetic variation of Chinese fir provenances. Sci. Silvae Sin. 1998, 34, 32–38. [Google Scholar]
  22. Li, M.; Shi, J.; He, Z.; Yi, N. Study on molecular genetic variation of superior trees in Chinese fir (Cunninghamia lanceolata) (Lamb.) Hook. Sci. Silvae Sin. 2001, 37, 137–141. [Google Scholar]
  23. Li, M.; Shi, J.; Li, F.; Gan, S. Molecular characterization of elite genotypes with in a second-generation Chinese fir (Cunninghamia lanceolata) breeding population using RAPD markers. Sci. Silvae Sin. 2007, 43, 50–55. [Google Scholar]
  24. Ouyang, L.; Chen, J.; Zheng, R.; Xu, Y.; Lin, Y.; Huang, J.; Ye, D.; Fang, Y.; Shi, J. Genetic diversity among the germplasm collections of the Chinese fir in 1st breeding population upon SSR markers. J. Nanjing For. Univ. Nat. Sci. Ed. 2014, 38, 21–26. [Google Scholar]
  25. Xu, Y.; Chen, J.; Zhao, Y.; Wang, Y.; Wang, X.; Liu, W.; Shi, J.; Zheng, R.; Ouyang, L.; Zhang, Z.; et al. Variation of EST-SSR molecular markers among provenances of Chinese fir. J. Nanjing For. Univ. Nat. Sci. Ed. 2014, 38, 1–8. [Google Scholar]
  26. Duan, H.; Hu, R.; Wu, B.; Chen, D.; Huang, K.; Dai, J.; Chen, Q.; Wei, Z.; Cao, S.; Sun, Y.; et al. Genetic characterization of red-colored heartwood genotypes of Chinese fir using simple sequence repeat (SSR) markers. Genet. Mol. Res. 2015, 14, 18552–18561. [Google Scholar] [CrossRef]
  27. Li, M.; Huang, M.; Su, L.; Chen, X.; Ma, X. Genetic diversity of germplasm resources of the king of Chinese fir in Fujian provenances. J. For. Environ. 2016, 36, 312–318. [Google Scholar]
  28. Qi, M. Genetic diversity of wide cross population of Cunninghamia lanceolata and Platycladu orientalis. Bull. Bot. Res. 2008, 28, 299–303. [Google Scholar]
  29. Qi, M.; Wang, H.; Peng, J.; Zhou, J.; Weng, C.; He, G. Genetic diversity and heterotic grouping of Cunninghamia lanceolata breeding garden. South China For. Sci. 2018, 46, 21–25. [Google Scholar]
  30. Muchero, W.; Guo, J.J.; DiFazio, S.P.; Chen, J.G.; Ranjan, P.; Slavov, G.T.; Gunter, L.E.; Jawdy, S.; Bryan, A.C.; Sykes, R.; et al. High-resolution genetic mapping of allelic variants associated with cell wall chemistry in Populus. BMC Genom. 2015, 16, 24. [Google Scholar] [CrossRef] [Green Version]
  31. Bdeir, R.; Muchero, W.; Yordanov, Y.; Tuskan, G.A.; Busov, V.; Gailing, O. Quantitative trait locus mapping of Populus bark features and stem diameter. BMC Plant Biol. 2017, 17, 224. [Google Scholar] [CrossRef] [PubMed]
  32. He, Z.; Shi, J.; Wang, M.; Yu, R.; Chen, X. The construction of molecular linkage frame map in Chinese fir. J. Nanjing For. Univ. Nat. Sci. Ed. 2000, 24, 22–26. [Google Scholar]
  33. Tong, C.; Shi, J. Constructing Genetic Linkage Map Chinese Fir s in Chinese Fir Using F1 Progeny. Acta Genet. Sin. 2004, 31, 1149–1156. [Google Scholar] [PubMed]
  34. Bindler, G.; Plieske, J.; Bakaher, N.; Gunduz, I.; Ivanov, N.; Hoeven, R.V.; Ganal, M.; Donini, P. A high density genetic map of tobacco (Nicotiana tabacum L.) obtained from large scale microsatellite marker development. Theor. Appl. Genet. 2011, 123, 219–230. [Google Scholar] [CrossRef] [PubMed] [Green Version]
  35. Wang, N.; Fang, L.; Xin, H.; Wang, L.; Li, S. Construction of a high-density genetic map for grape using next generation restriction-site associated DNA sequencing. BMC Plant Biol. 2012, 12, 148. [Google Scholar] [CrossRef] [Green Version]
  36. Sun, X.; Liu, D.; Zhang, X.; Li, W.; Liu, H.; Hong, W.; Jiang, C.; Guan, N.; Ma, C.; Zeng, H.; et al. SLAF-seq: An efficient method of large-scale de novo SNP discovery and genotyping using high-throughput sequencing. PLoS ONE 2013, 8, e58700. [Google Scholar] [CrossRef] [Green Version]
  37. Yu, S.; Su, T.; Zhi, S.; Zhang, F.; Wang, W.; Zhang, D.; Zhao, X.; Yu, Y. Construction of a sequence-based bin map and mapping of QTLs for downy mildew resistance at four developmental stages in Chinese cabbage (Brassica rapa L. ssp. pekinensis). Mol. Breed. 2016, 36, 44. [Google Scholar] [CrossRef]
  38. Tao, A.; Huang, L.; Wu, G.; Afshar, R.K.; Qi, J.; Xu, J.; Fang, P.; Lin, L.; Zhang, L.; Lin, P. High-density genetic map construction and QTLs identification for plant height in white jute (Corchorus capsularis L.) using specific locus amplified fragment (SLAF) sequencing. BMC Genom. 2017, 18, 355. [Google Scholar] [CrossRef] [Green Version]
  39. Fang, L.; Liu, H.; Wei, S.; Wei, S.; Keefover-Ring, K.; Yin, T. High-density genetic map of Populus deltoides constructed by using specific length amplified fragment sequencing. Tree Genet. Genomes 2018, 14, 10. [Google Scholar] [CrossRef]
  40. Chen, X.B.; Xu, H.N.; Xiao, F.M.; Sun, S.W.; Lou, Y.F.; Zou, Y.X.; Xu, X.Q. Genetic diversity and paternity analyses in a 1.5th generation seed orchard of Chenshan red-heart Chinese fir. J. Nanjing For. Univ. Nat. Sci. Ed. 2021, 45, 87–92. [Google Scholar]
  41. Liu, D.; Ma, C.; Hong, W.; Huang, L.; Liu, M.; Liu, H.; Zeng, H.; Deng, D.; Xin, H.; Song, J.; et al. Construction and Analysis of High-Density Linkage Map Using High-Throughput Sequencing Data. PLoS ONE 2014, 9, e98855. [Google Scholar] [CrossRef]
  42. West Mal Van, L.; Leeuwen, H.V.; Kozik, A.; Daniel, J.K.; Doerge, R.W.; Clair, D.A.S.; Michelmore, R.W. High-density haplotyping with microarray-based expression and single feature polymorphism markers in Arabidopsis. Genome Res. 2006, 16, 787–795. [Google Scholar] [CrossRef] [PubMed] [Green Version]
  43. Van Ooijen, J.W. MapQTL®5: Software for the Mapping of Quantitative Trait Loci in Experimental Populations; Kyazma BV: Wageningen, The Netherlands, 2004. [Google Scholar]
  44. Grattapaglia, D.; Sederoff, R. Genetic linkage maps of Eucalyptus grandis and Eucalyptus urophylla using a pseudotestcross: Mapping strategy and RAPD markers. Genetics 1994, 137, 1121–1137. [Google Scholar] [CrossRef]
  45. Hall, M.C.; Willis, J.H. Transmission ratio distortion in intraspecific hybrids of Mimulus guttatus: Implications for genomic divergence. Genetics 2005, 170, 375–386. [Google Scholar] [CrossRef] [PubMed] [Green Version]
  46. MaKnox, M.R.; Ellis, T.H.N. Excess heterozygosity contributes to genetic map expansion in pea recombinant inbred populations. Genetics 2002, 162, 861–873. [Google Scholar]
  47. Jin, J.; Li, C.; Wang, R.; Zheng, H.; Yao, M.; Chen, L. Large-scale SNP discovery and genotyping for constructing a high-density genetic map of tea plant using specific-locus amplified fragment sequencing (SLAF-seq). PLoS ONE 2015, 10, e0128798. [Google Scholar]
  48. Zhang, Q.; Liu, W.; Liu, N.; Zhang, Y.; Liu, S.; Wei, X.; Liu, Y. Segregation type of heterozygous loci in F1 and construction of molecular markers linkage map in Apricot. Acta Hortic. Sin. 2011, 38, 1983–1990. [Google Scholar]
  49. Luo, L.; Zhang, Y.M.; Xu, S. A quantitative genetics model for viability selection. Heredity 2005, 94, 347–355. [Google Scholar] [CrossRef] [Green Version]
  50. Zhang, L.; Deng, Q.; Li, P.; Wang, S.; Zheng, A.; Li, Z.; Li, H.; Li, S.; Wang, J. Effects of missing marker and segregation distortion on QTL mapping in F2 populations. Theor. Appl. Genet. 2010, 121, 1071–1082. [Google Scholar] [CrossRef]
  51. Xu, J.; Shi, J. C banding and fluorescent banding pattern of the chromosomes of Cunninghamia lanceolate. Mol. Plant Breed. 2007, 5, 515–520. [Google Scholar]
  52. Li, H.; Hearne, S.; Bänziger, M.; Li, Z.; Wang, J. Statistical properties of QTL linkage mapping in biparental genetic populations. Heredity 2010, 105, 257–267. [Google Scholar] [CrossRef] [Green Version]
  53. Doerge, R.W. Mapping and analysis of quantitative trait loci in experimental populations. Nat. Rev. Genet. 2002, 3, 43–52. [Google Scholar] [CrossRef] [PubMed]
  54. Lu, J.; Liu, Y.; Xu, J.; Mei, Z.; Shi, Y.; Liu, P.; He, J.; Wang, X.; Meng, Y.; Feng, S.; et al. High-density genetic map construction and stem total polysaccharide content-related QTL exploration for Chinese endemic dendrobium (Orchidaceae). Front. Plant Sci. 2018, 9, 398. [Google Scholar] [CrossRef] [PubMed] [Green Version]
  55. Zhu, C.; Wang, C.; Zhang, Y. Modeling segregation distortion for viability selection. I. Reconstruction of linkage maps with distorted markers. Theor. Appl. Genet. 2007, 114, 295–305. [Google Scholar] [CrossRef]
  56. Lowe, K.M.; Riaz, S.; Walker, M.A. Variation in recombination rates across Vitis species. Tree Genet. Genomes 2009, 5, 71–80. [Google Scholar] [CrossRef]
  57. Cao, S.; Deng, H.; Zhao, Y.; Zhang, Z.; Tian, Y.; Sun, Y.; Li, Y.; Zheng, H. Metabolite profiling and transcriptome analysis unveil the mechanisms of red-heart Chinese fir (Cunninghamia lanceolata (lamb.) hook) heartwood coloration. Front. Plant Sci. 2022, 13, 594. [Google Scholar] [CrossRef]
  58. Churchill, G.A.; Doerge, R.W. Empirical threshold values for quantitative trait mapping. Genetics 1994, 138, 963–971. [Google Scholar] [CrossRef] [PubMed]
  59. Chen, L.; Storey, J.D. Relaxed significance criteria for linkage analysis. Genetics 2006, 173, 2371–2381. [Google Scholar] [CrossRef] [PubMed] [Green Version]
  60. Lander, E.S.; Botstein, D. Mapping mendelian factors underlying quantitative traits using RFLP linkage maps. Genetics 1989, 121, 185–199. [Google Scholar] [CrossRef] [PubMed]
  61. Kochevenko, A.; Jiang, Y.; Seiler, C.; Surdonja, K.; Kollers, S.; Reif, J.C.; Korzun, V.; Graner, A. Identification of QTL hot spots for malting quality in two elite breeding lines with distinct tolerance to abiotic stress. BMC Plant Biol. 2018, 18, 106. [Google Scholar] [CrossRef] [Green Version]
  62. Guan, P.; Shen, X.; Mu, Q.; Wang, Y.; Peng, H. Dissection and validation of a QTL cluster linked to Rht-B1 locus controlling grain weight in common wheat (Triticum aestivum L.) using near-isogenic lines. Theor. Appl. Genet. 2020, 133, 2639–2653. [Google Scholar] [CrossRef] [PubMed]
  63. Daniela, T.M.; Nadia, V.; Ezio, P.; Alberto, A.; Chiara, B.; Shawn, A.M.; Todd, C.M.; Erik, R.R.; Roberto, B. High density SNP mapping and QTL analysis for time of leaf budburst in Corylus avellana L. PLoS ONE 2018, 13, e0195408. [Google Scholar]
Figure 1. Eight segregation patterns and number of SLAF markers. Number of polymorphic SLAF markers for eight segregation patterns. The x-axis shows segregation patterns, and the y-axis shows the number of SLAF markers.
Forests 14 01591 g001
Figure 2. High-density genetic map of C. lanceolata based on 2574 SLAF markers. The abscissa is the linkage group and the ordinate is the location.
Forests 14 01591 g002
Table 1. Description of SLAF-seq results.
Reads number (M)120,007
Q30 percentage (%)93.78
Guanine cytosine (GC) percentage (%)37.75
SLAF amount532,450
The parents’ mean sequencing depth of SLAFs39.89×
The progeny’ mean sequencing depth of SLAFs 10.72×
Markers for Mapping2574
Table 2. Basic characteristics of 11 C. lanceolata linkage groups.
Number of MarkersSize (cM)Average Interval between Markers (cM)
Female
Map
Male
Map
Integrated
Map
Female
Map
Male
Map
Integrated
Map
Female
Map
Male
Map
Integrated
Map
LG110686177155.63100.13130.061.481.180.74
LG21055108113.7230.70105.101.097.670.98
LG335441387182.20145.13195.820.523.630.51
LG4181279444184.10183.25193.821.020.660.44
LG512883193130.3389.61136.311.031.090.71
LG622652269149.69139.87164.800.672.740.61
LG774180243157.64132.28156.312.160.740.65
LG826923288175.74160.64181.240.667.300.63
LG980192266188.19175.11195.792.380.920.74
LG1015889881.33192.01155.935.812.211.61
LG11949101147.1987.66133.021.5810.961.33
Total1632103825741665.761436.391748.401.031.400.68
Table 3. Double crossovers and missing data per linkage group (LG) constructed based on SLAF markers.
LG IDPercentage of Double Crossovers (%)Percentage of Missing Data (%)
LG116.170.00
LG25.340.00
LG36.880.00
LG410.090.00
LG516.140.00
LG69.280.00
LG711.230.00
LG86.890.00
LG96.920.00
LG1010.090.00
LG115.960.00
Table 4. Mean, variable coefficient, minimum, and maximum values of different traits measured in F1 offspring.
TraitsMeanVCMinMaxN
Diameter at breast height (cm)14.380.2995.425.1470
heartwood diameter (cm)8.120.3912.6216.8770
heartwood proportion (%)55.430.158377770
heartwood a*8.990.0867.3410.7370
heartwood b*17.490.06215.4521.2070
heartwood L*72.340.03665.9578.2070
sapwood a*5.420.1333.756.7270
sapwood b*15.390.06213.0517.5770
sapwood L*82.320.01979.4086.4070
a* stands for the position on the red–green axis (positive values for red, negative values for green); b* for the position on the yellow–blue axis (positive values for yellow, negative values for blue); and L* for lightness, representing the position on the black–white axis (L* = 0 for black, L* = 100 for white).
Disclaimer/Publisher’s Note: The statements, opinions and data contained in all publications are solely those of the individual author(s) and contributor(s) and not of MDPI and/or the editor(s). MDPI and/or the editor(s) disclaim responsibility for any injury to people or property resulting from any ideas, methods, instructions or products referred to in the content.

