1. Introduction
Balsam fir (
Abies balsamea) is the primary species cultivated for the Christmas tree and greenery industry in Northeastern North America. In addition to form, colour, and fragrance, needle retention is of increasing importance as many consumers in the United States display their Christmas trees for four or more weeks during the holiday season [
1].
Climate change models predict that the mean annual temperature in Atlantic Canada will increase by approximately 1.3–1.9 °C by the year 2050, and between 1.9 and 5.2 °C by the end of the century [
2], resulting in multiple species ranges shifting northward [
3] and a significant decline in balsam fir habitat in the Maritimes over the next 100 years [
4]. Warmer temperatures and an extended growing season can create problems for Christmas trees in both the spring and fall. Growth patterns of Fraser fir (
Abies fraseri) at different elevations in the Southern Appalachian Mountains were studied, and it was revealed that Christmas tree growers will need to adapt their management techniques to account for the warming climate [
5]. Early and warm springtime temperatures can result in early bud flush and an increased risk of late spring frost damage to young expanding shoots [
6]. Warmer temperatures later into the fall can delay cold acclimation. Needle retention and cold acclimation are positively correlated; thus, with warmer fall temperatures, trees will be prone to early post-harvest needle loss [
7,
8].
Cold acclimation in conifers is a complex process that involves numerous signaling pathways, including changes in phytohormones due to low temperatures, the circadian clock, and changes to light quality and photoperiod [
9]. These processes can begin as early as July in response to photoperiod changes and its primary purpose is the protection of cell membranes from injuries during cold temperatures [
10,
11,
12]. However, the most important of these factors is low temperatures [
9,
13].
To meet the demand for Christmas trees by early December, balsam fir trees in the Maritime provinces of Canada must be harvested in late October or early November to allow for shipping to the markets. Under warm fall temperatures, trees harvested in late October or early November often have not yet been exposed to the freezing temperatures generally required for the cold acclimation process and its associated positive effect on needle retention [
1,
14,
15,
16].
Testing two harvest dates, one early and one late during the normal harvest season for Christmas tree growers, can be used to identify trees that perform well under warmer conditions as well as after a period of cold acclimation. It has been suggested that trees with a natural resistance to post-harvest needle abscission will perform well regardless of harvest date, and trees that do not feature this ability will perform better when harvested later in the season after they have been exposed to cooler temperatures [
17]. Early season harvesting and testing are beneficial for two reasons: (1) This mimics a season of high demand that results in growers needing to harvest sooner, and (2) the warmer temperatures that come with harvesting earlier will potentially become the new norm later in the fall because of the changing climate. So, individuals that perform well regardless of the amount of cold acclimation will be vitally important in future breeding programs.
Balsam fir has a range that almost spans the width of Canada [
18]. As would be expected in a species with a trans-continental range, there is significant genetic variation in the species [
19,
20]. Needle retention in Christmas trees varies with genotype [
21], date of collection [
8], and environmental factors [
22]. While correlations between needle abscission and carbohydrates such as raffinose have been reported [
23], no causal relationships have yet to be identified [
22,
23]. Needle abscission cannot be prevented entirely; however, the selection of individuals with high needle retention abilities can lead to improving this issue [
24].
Breeding programs for balsam fir Christmas trees in New Brunswick (NB), Nova Scotia (NS), and Quebec (QC), Canada, have focused primarily on phenotypic selection for crown density (number of internodal buds and internodal branch length), acceptable crown taper, needle colour (green and blue-green variations), age class retention (trees that maintain juvenile growth patterns throughout development), branch angle (acute angle of insertion into the stem), needle configuration (spiral orientation of needles), and freedom from insects/diseases or deformities. Grafted seed orchards and seed production areas (natural stands and/or plantations managed to favour these phenotypically good trees) have been used to produce seed for the Christmas tree sector in these provinces since the 1990s. However, testing for needle retention in these programs has been limited and has not focused on identifying trees with good needle retention following early harvesting [
25].
The two main objectives of this study were to (1) evaluate needle retention from a subset of trees in a clonal seed orchard (NB), a multi-aged natural seed production area (NS), and selected trees in an operational plantation (QC). The common goal in all three sample areas was to identify parents that warrant including in breeding programs targeted at producing Christmas trees that will perform well under a warming climate in the Northeast; (2) determine if rates of moisture loss from branches can be used to improve or be used alone to better identify trees with good needle retention properties than traditional needle rub tests alone.
2. Materials and Methods
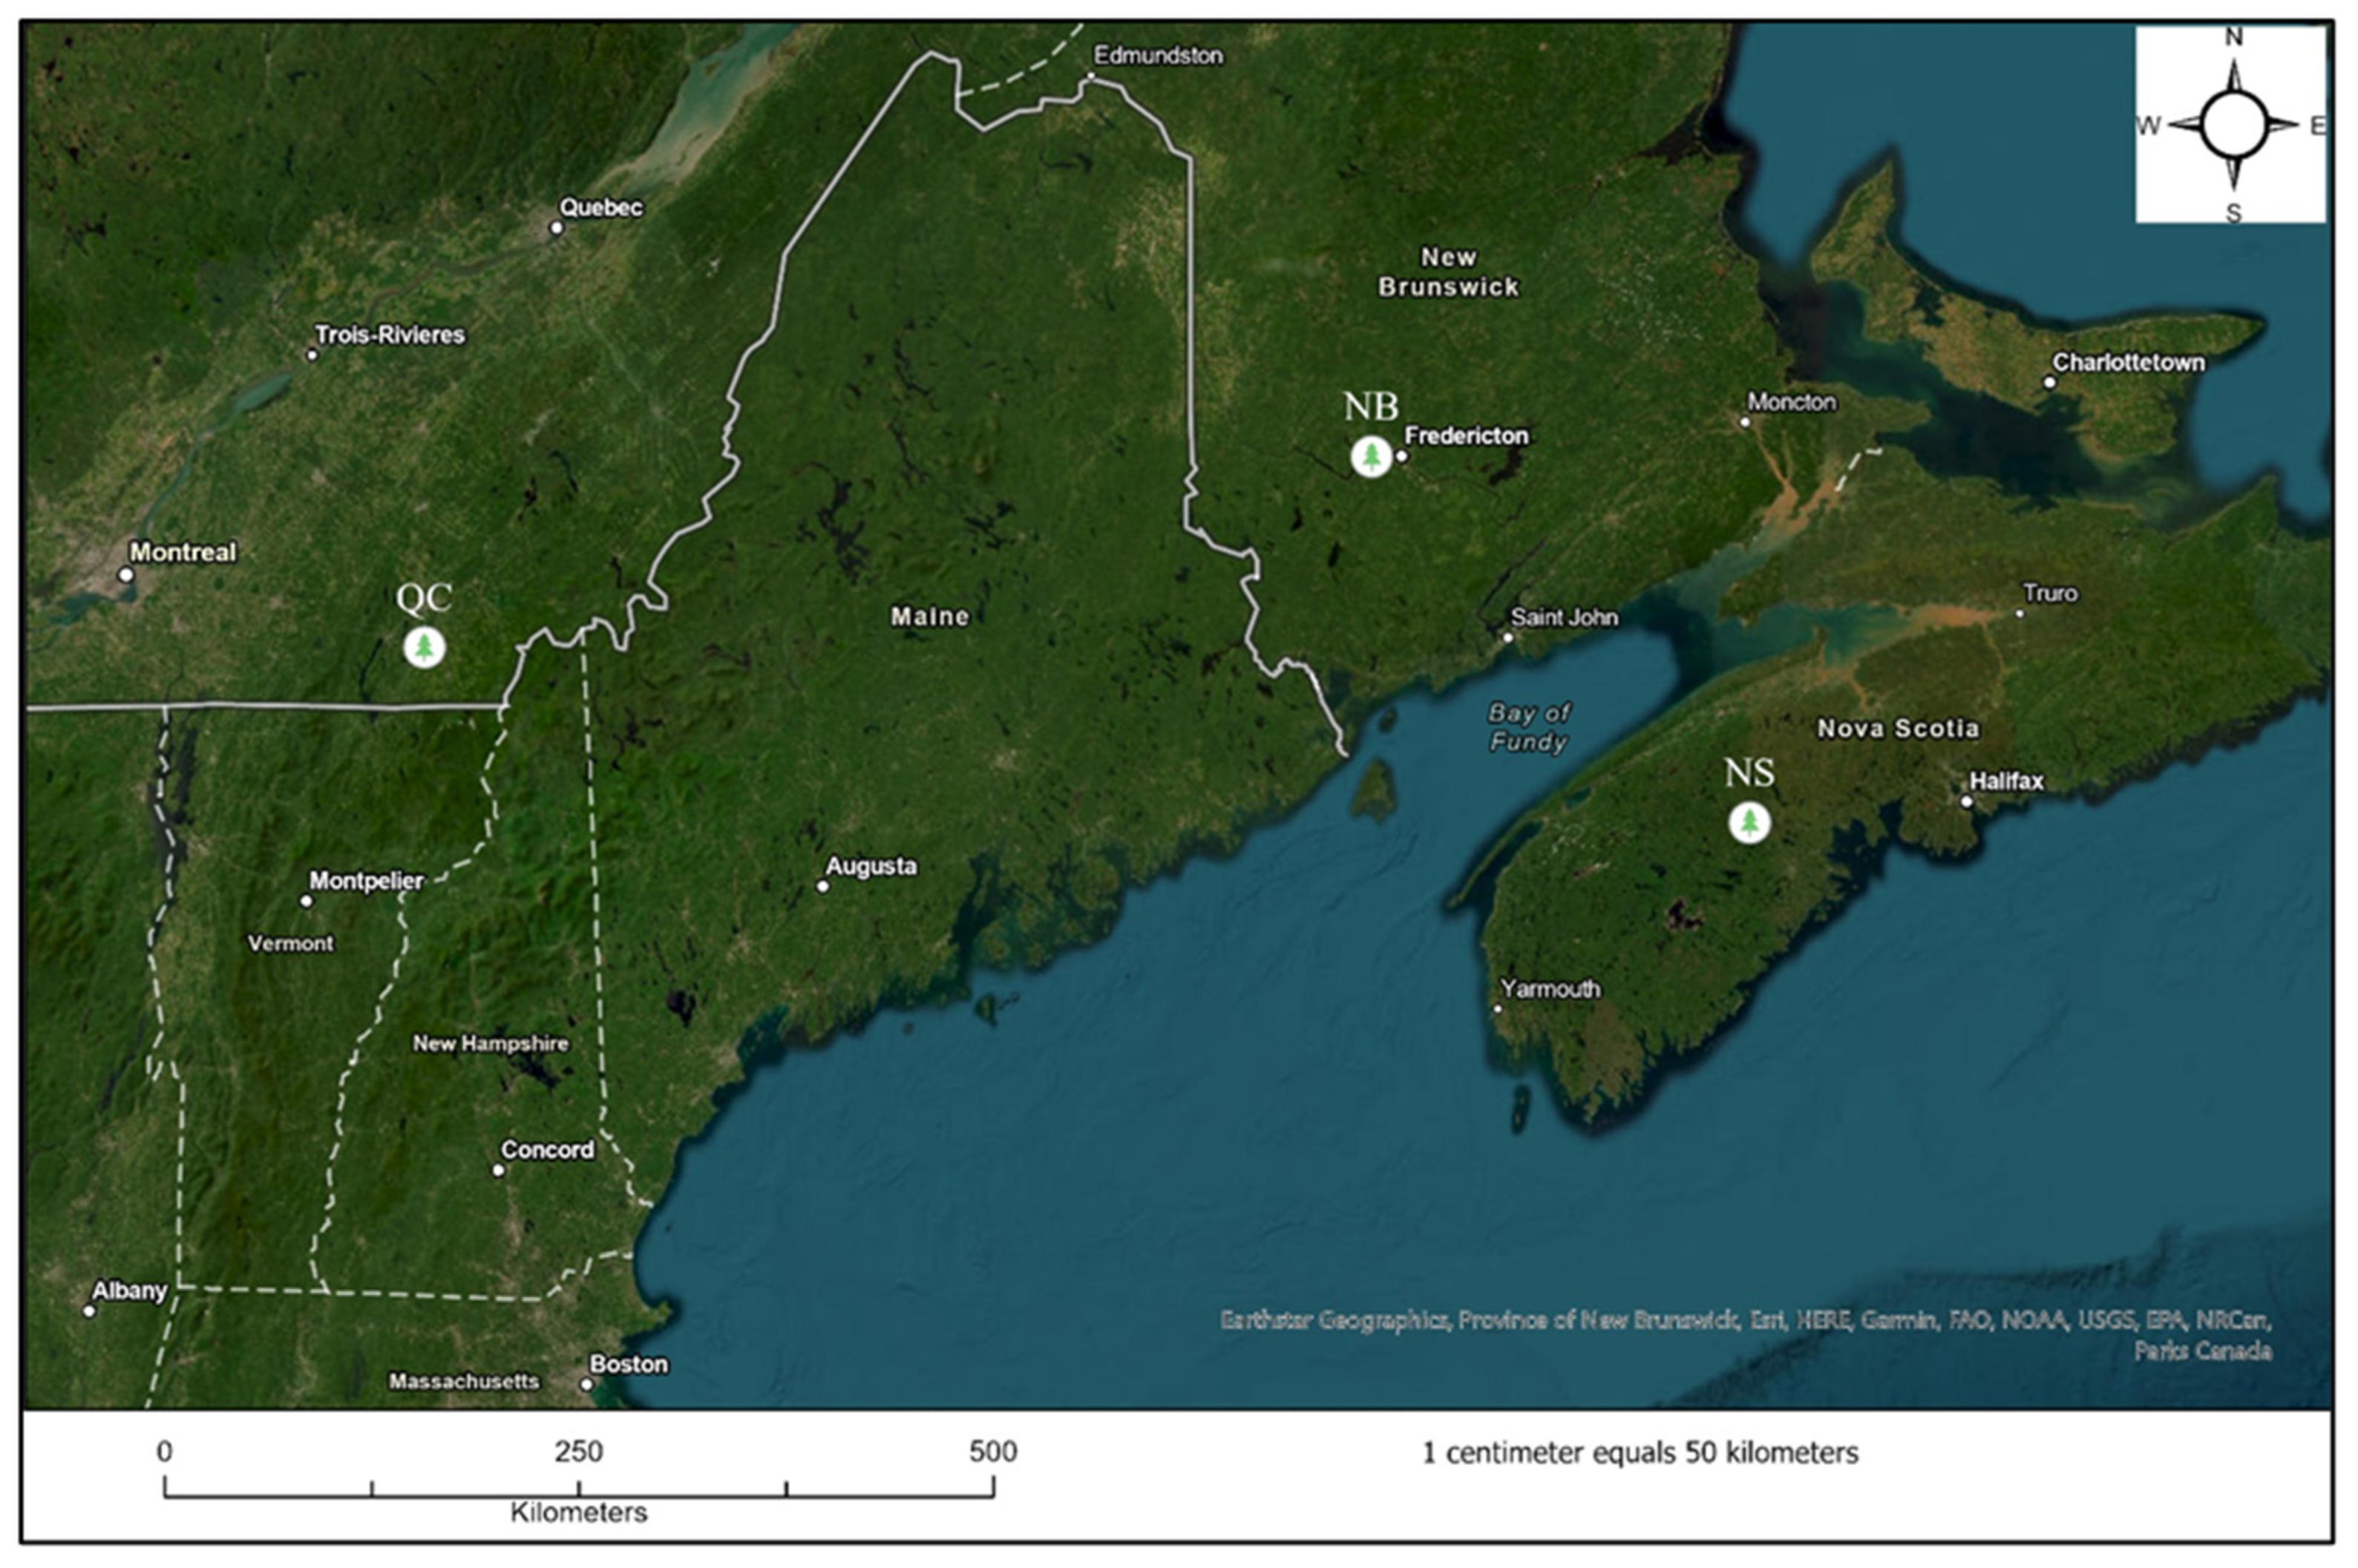
2.1. Sample Site Descriptions
Three areas were selected for this study: a provincial clone bank in Kingsclear, NB, Canada (45°57′31.5″ N 66°48′07.2″ W); a multi-aged natural Christmas tree stand (seed production area) in New Germany, NS, Canada (44°33′48.5″ N 64°45′09.5″ W); and a Christmas tree plantation in Hatley, QC, Canada (45°14′05.6″ N 71°56′13.5″ W) (
Figure 1).
A clonal seed orchard, comprising grafts from ‘plus tree’ selections produced by Christmas tree growers and provincial forest extension staff from around the province was established at the Kingsclear provincial tree nursery in the early 1990s [
26]. A clone bank comprising regrafts of two ramets from each of the parent trees in the seed orchard was established in 2005–2006 as the trees in the original orchard had become too large to work with. All of the clones in both the original seed orchard and the clone bank were evaluated for growth and form in 2019, and twenty-one clones were selected for this study. None of the individual selections at Kingsclear were related.
The trees from the Nova Scotia seed production area were from a six-hectare natural stand of mixed ages. The trees in this stand have undergone recurrent selection to favour late flushing. There are currently three age classes in this stand ranging from 8 to 30 years, with many being progeny of but a few trees i.e., there is a high likelihood of significant relatedness among the trees in the stand [
25].
The Quebec location was originally used for agricultural purposes but developed into a Christmas tree farm after it was inherited by the current owner. The plantation from which the trees in this study originated was established using superior stock from their own open-pollinated seed orchard. The degree of relatedness among trees in this plantation is not known, and the ages of the material range from 30 to 40 years [
27].
All the trees included in this study had previously been selected for good growth and form, traits desirable in Christmas trees. However, none had previously been tested for needle retention.
2.2. Tree Selection, Branch Sampling, and Handling
A total of 62 healthy, phenotypically good balsam fir trees were selected for branch sampling and testing; 21, 20, and 21 from the NB, NS, and QC sites, respectively. In the second year of the project, two trees from Nova Scotia were replaced, resulting in a total of 64 trees being tested. Branches were sampled twice annually from 2020 to 2022 (inclusive) (
Table 1).
Three branches were harvested during each early and late collection period, for a total of six per tree per year. A total of 186 branches were collected twice per year, yielding a total of 1116 branches for testing at the University of New Brunswick Wood Science and Technology Centre (WSTC) in Fredericton NB, over the three-year study. At each collection time, a duplicate number of the branches were harvestedand shipped to a secondary location in Hatley, QC (Downey Tree Farm & Nursery) for an additional replicate of testing.
Branches in this study were randomly collected from different aspects and positions within the upper third of the tree crowns. Most samples were collected from the top five whorls, but for a few of the larger trees, a few branches were collected from as low as the eighth whorl, usually to avoid large numbers of reproductive buds. All the trees in the study were open-grown, and even the few branches collected from as low as the eighth whorl were not shade-grown.
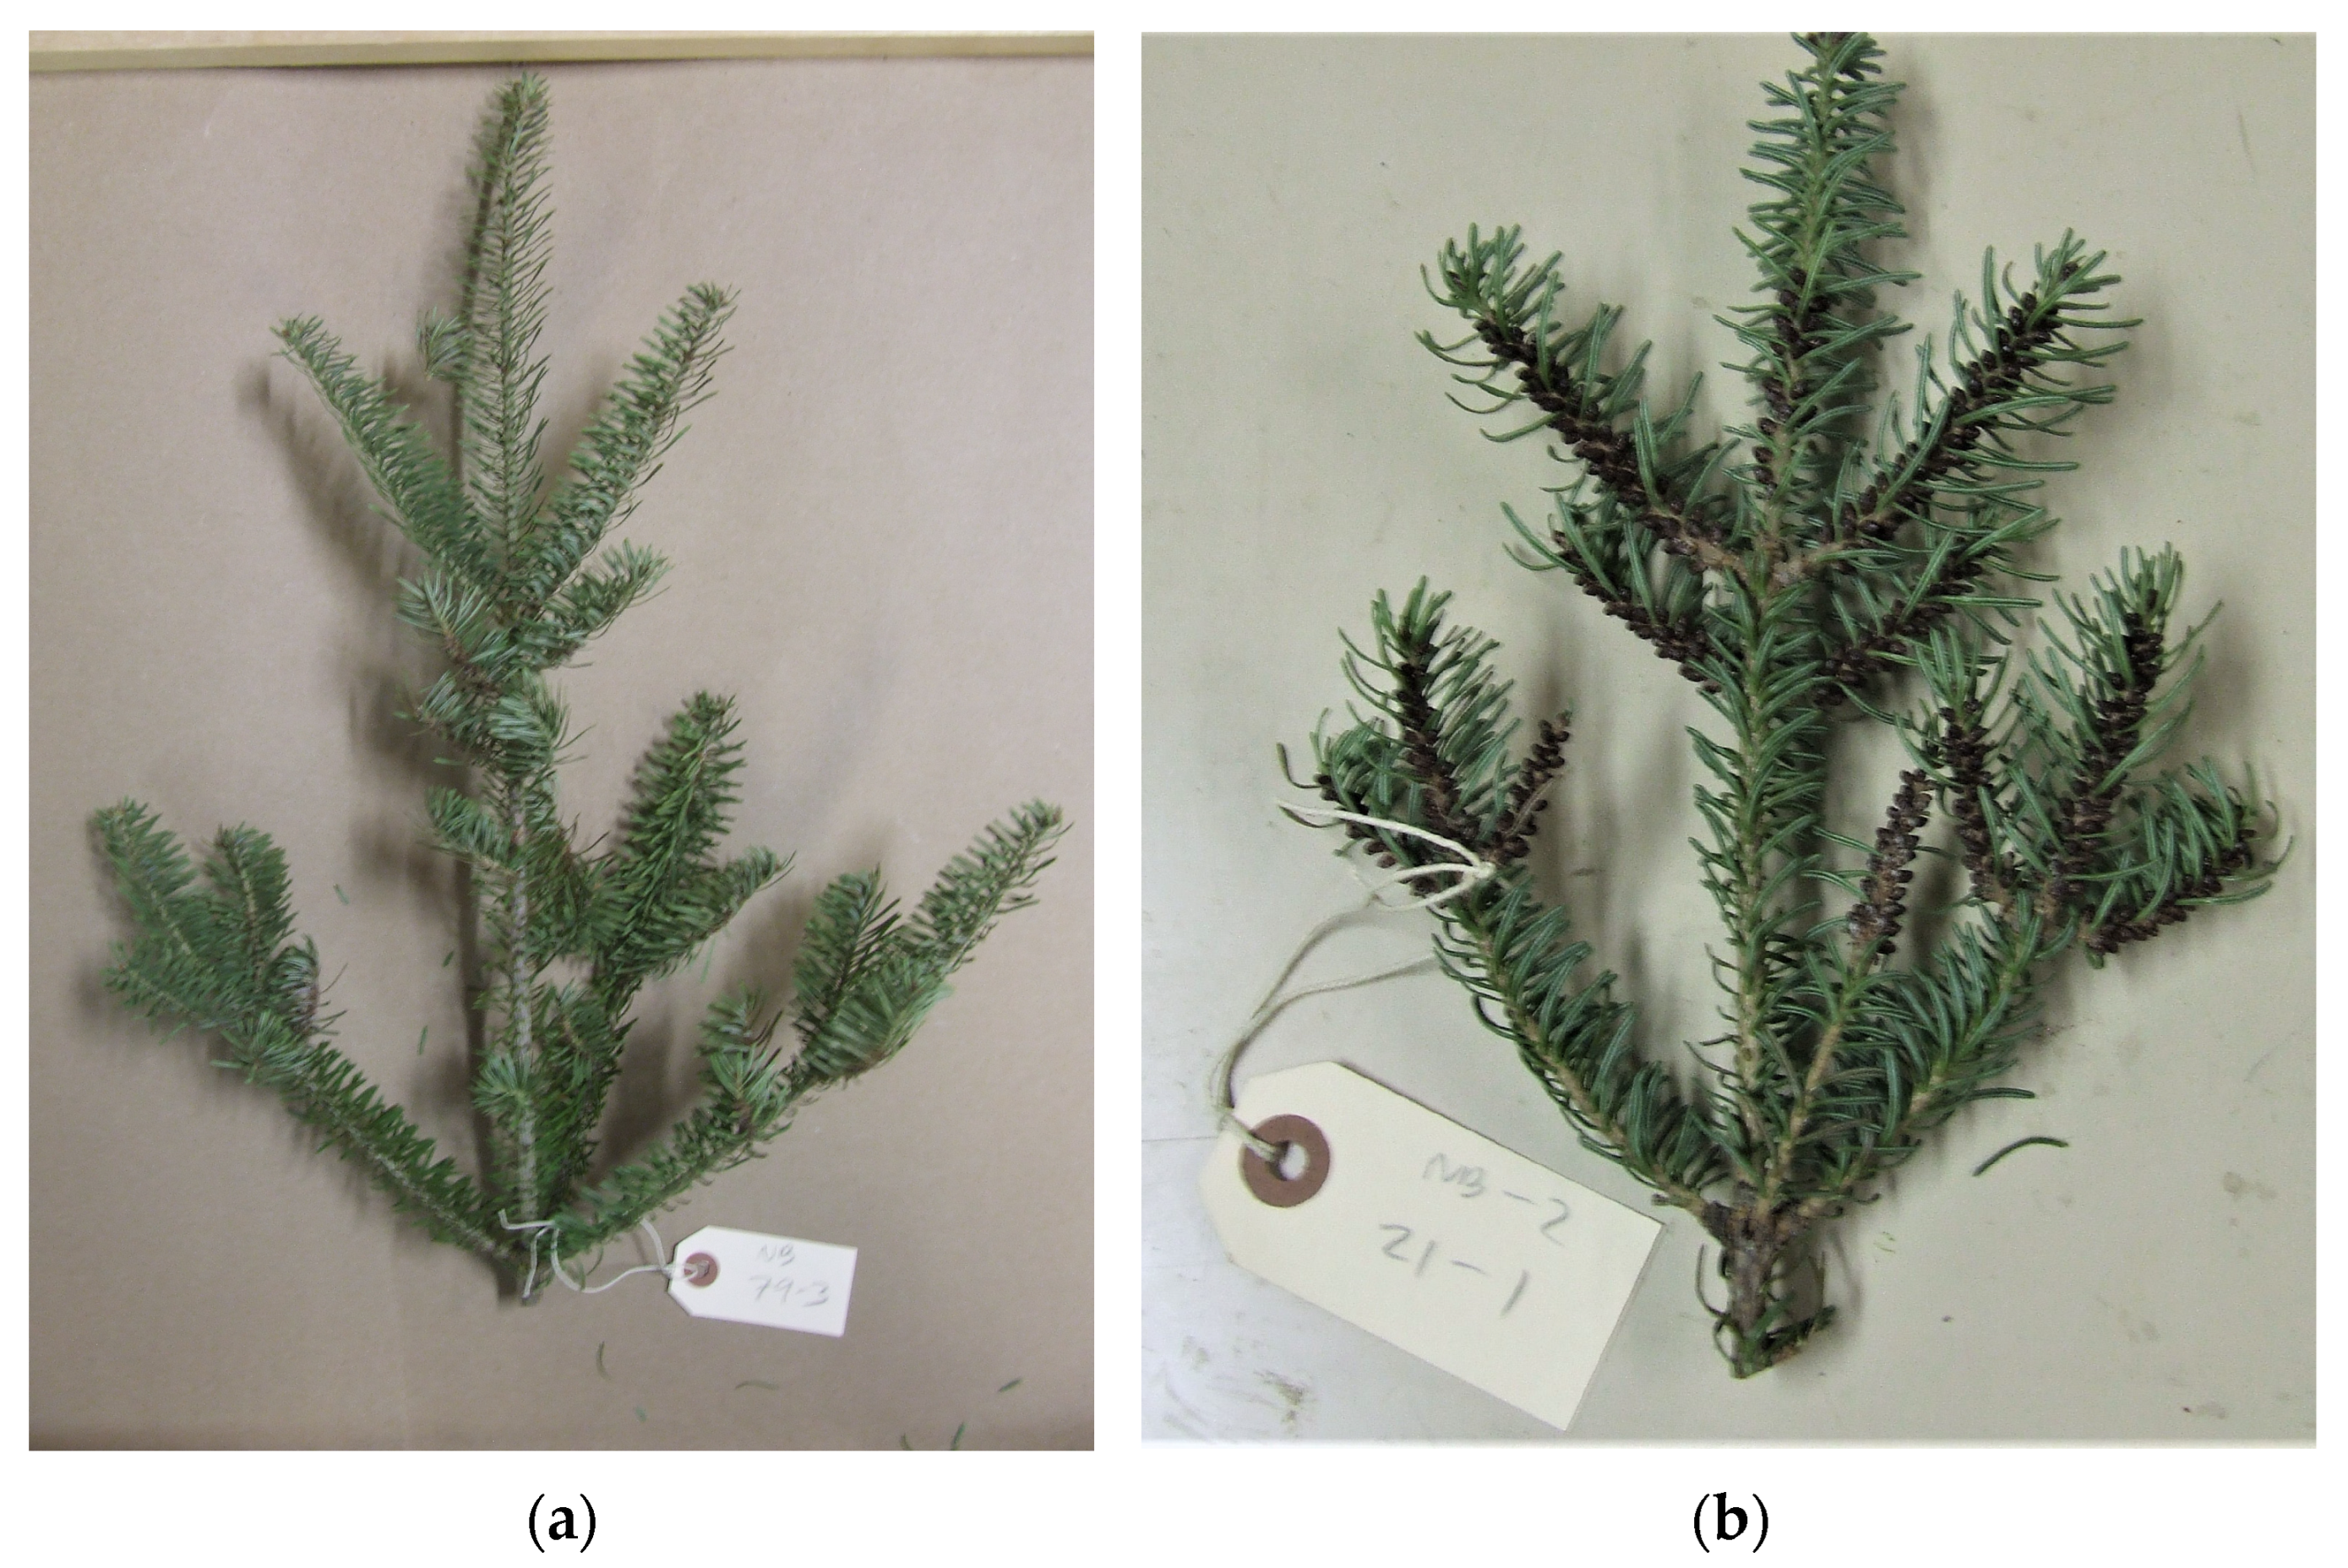
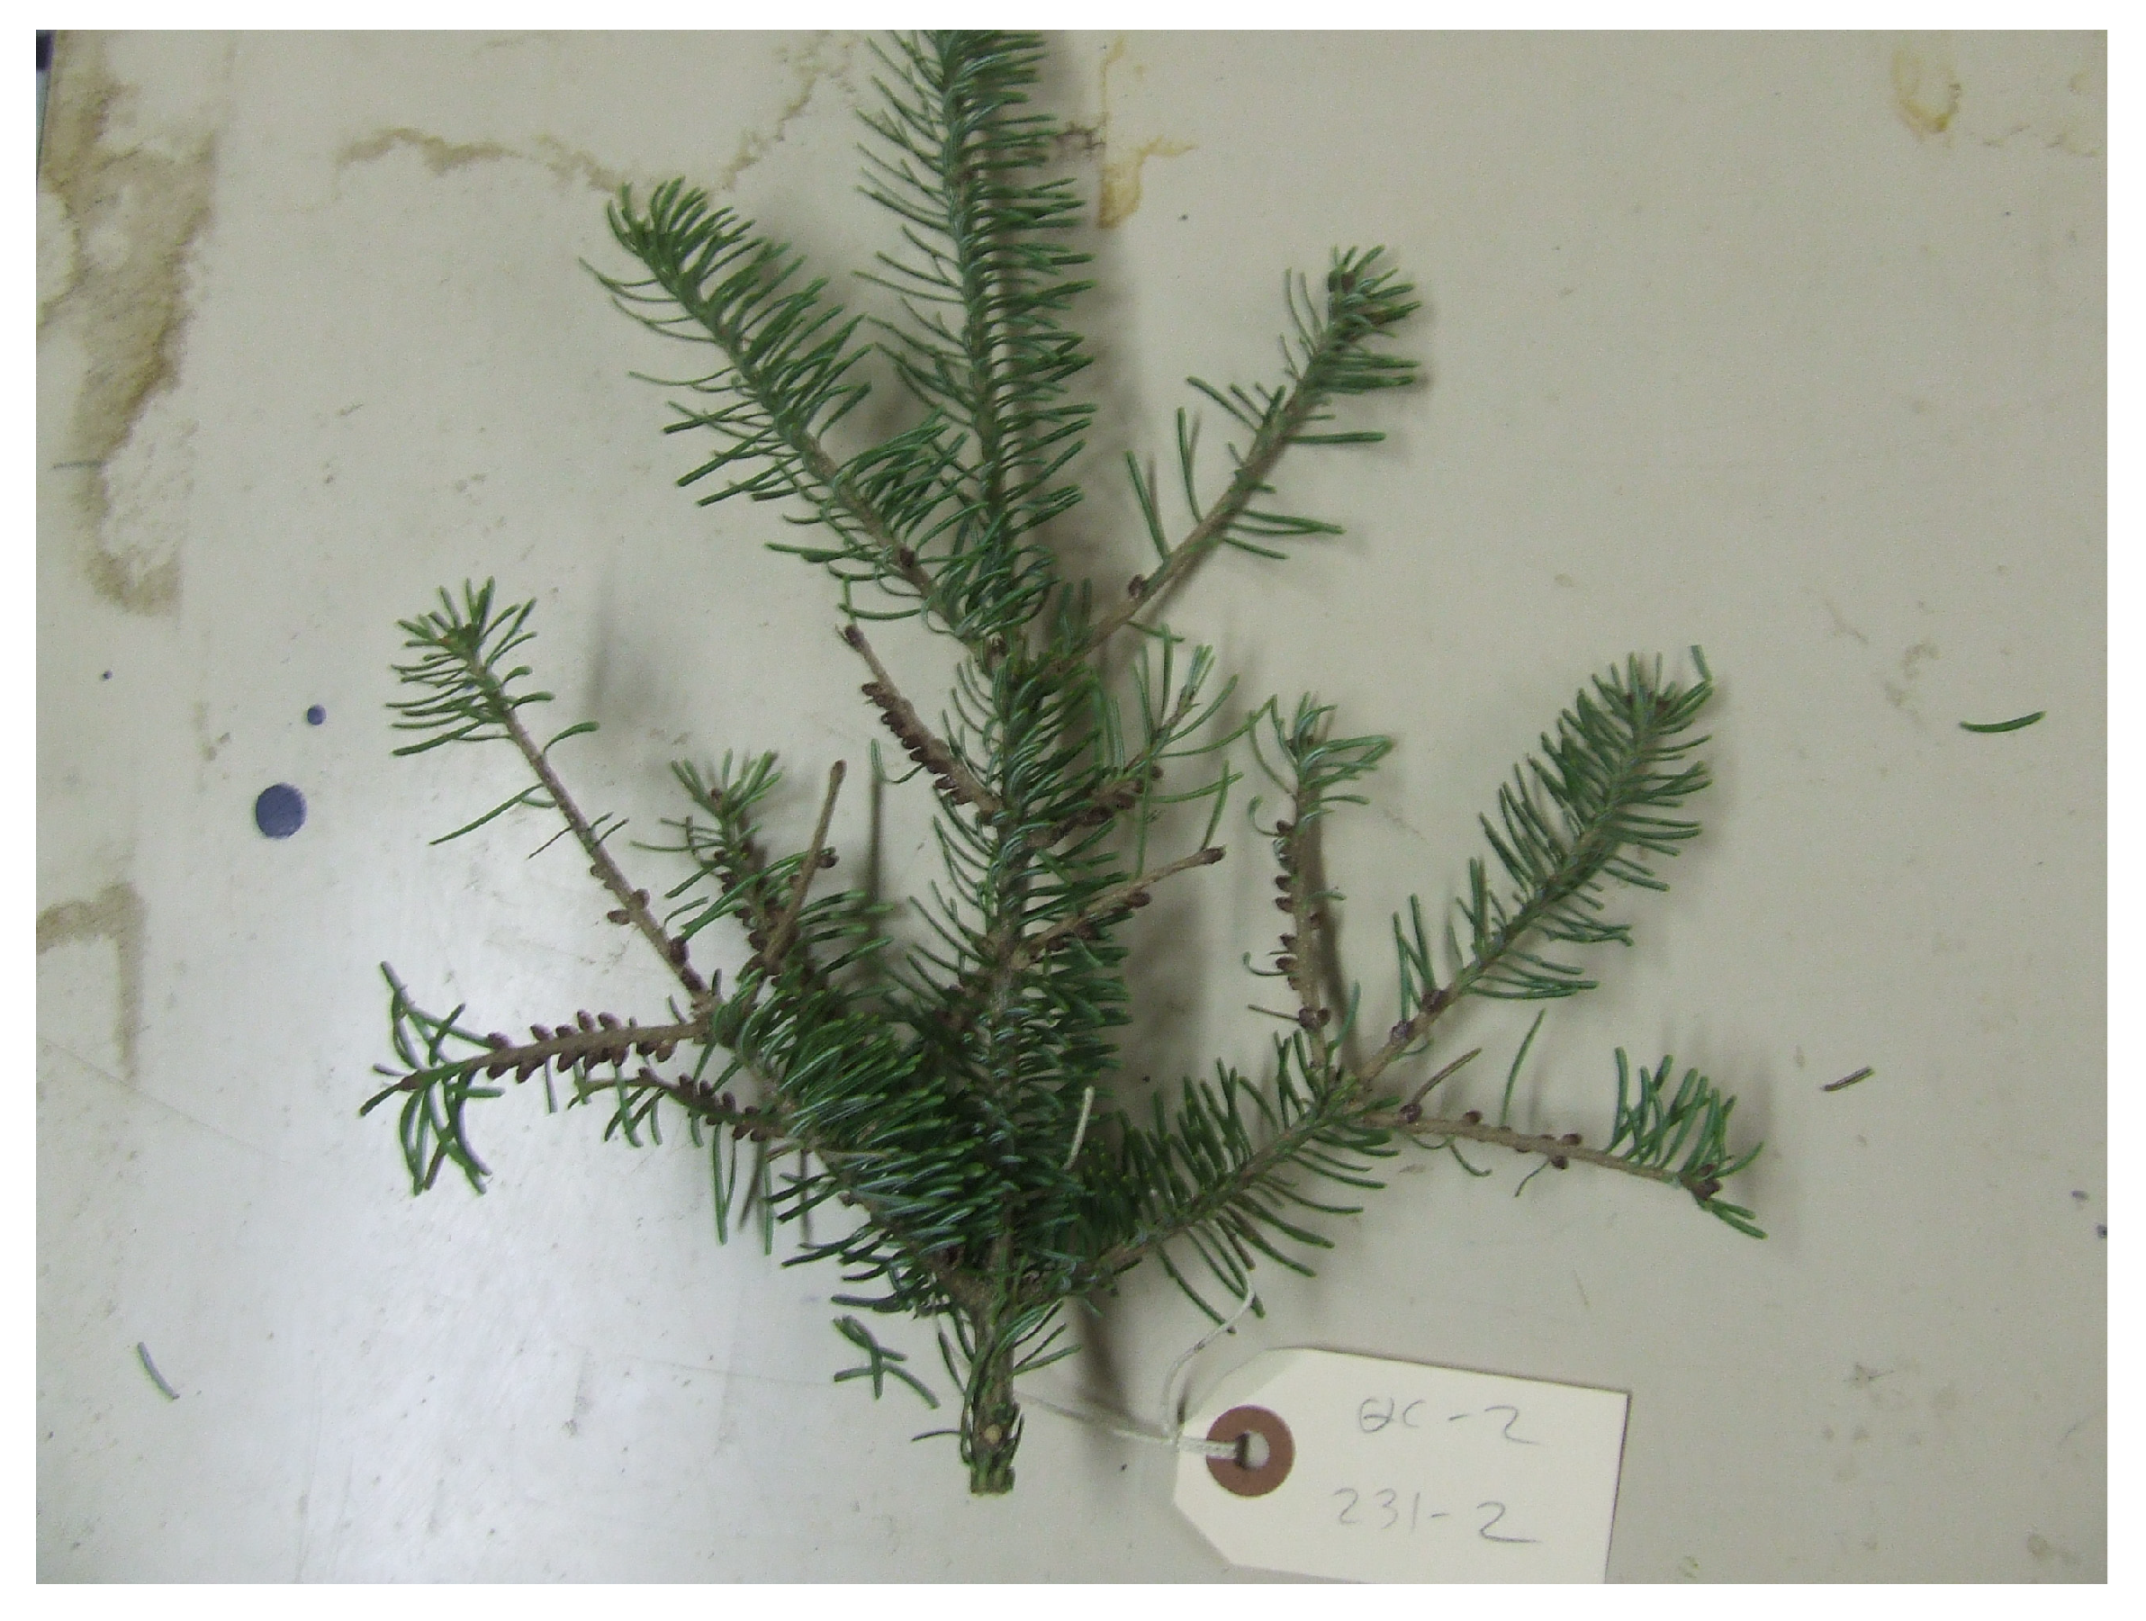
The branches collected from the Kingsclear provincial tree nursery, local to Fredericton, were transported immediately to the WSTC. The branches collected from the NS and QC locations were shipped to the WSTC via ground mail on ice and in sealed coolers to minimize drying during the transportation process. The branches shipped from NS to QC followed the same methods. Upon delivery to the test sites, branches were cut approximately 1 cm below the two-year-old lateral shoots and hung for needle retention testing (
Figure 2).
2.3. Testing Branches for Needle Retention
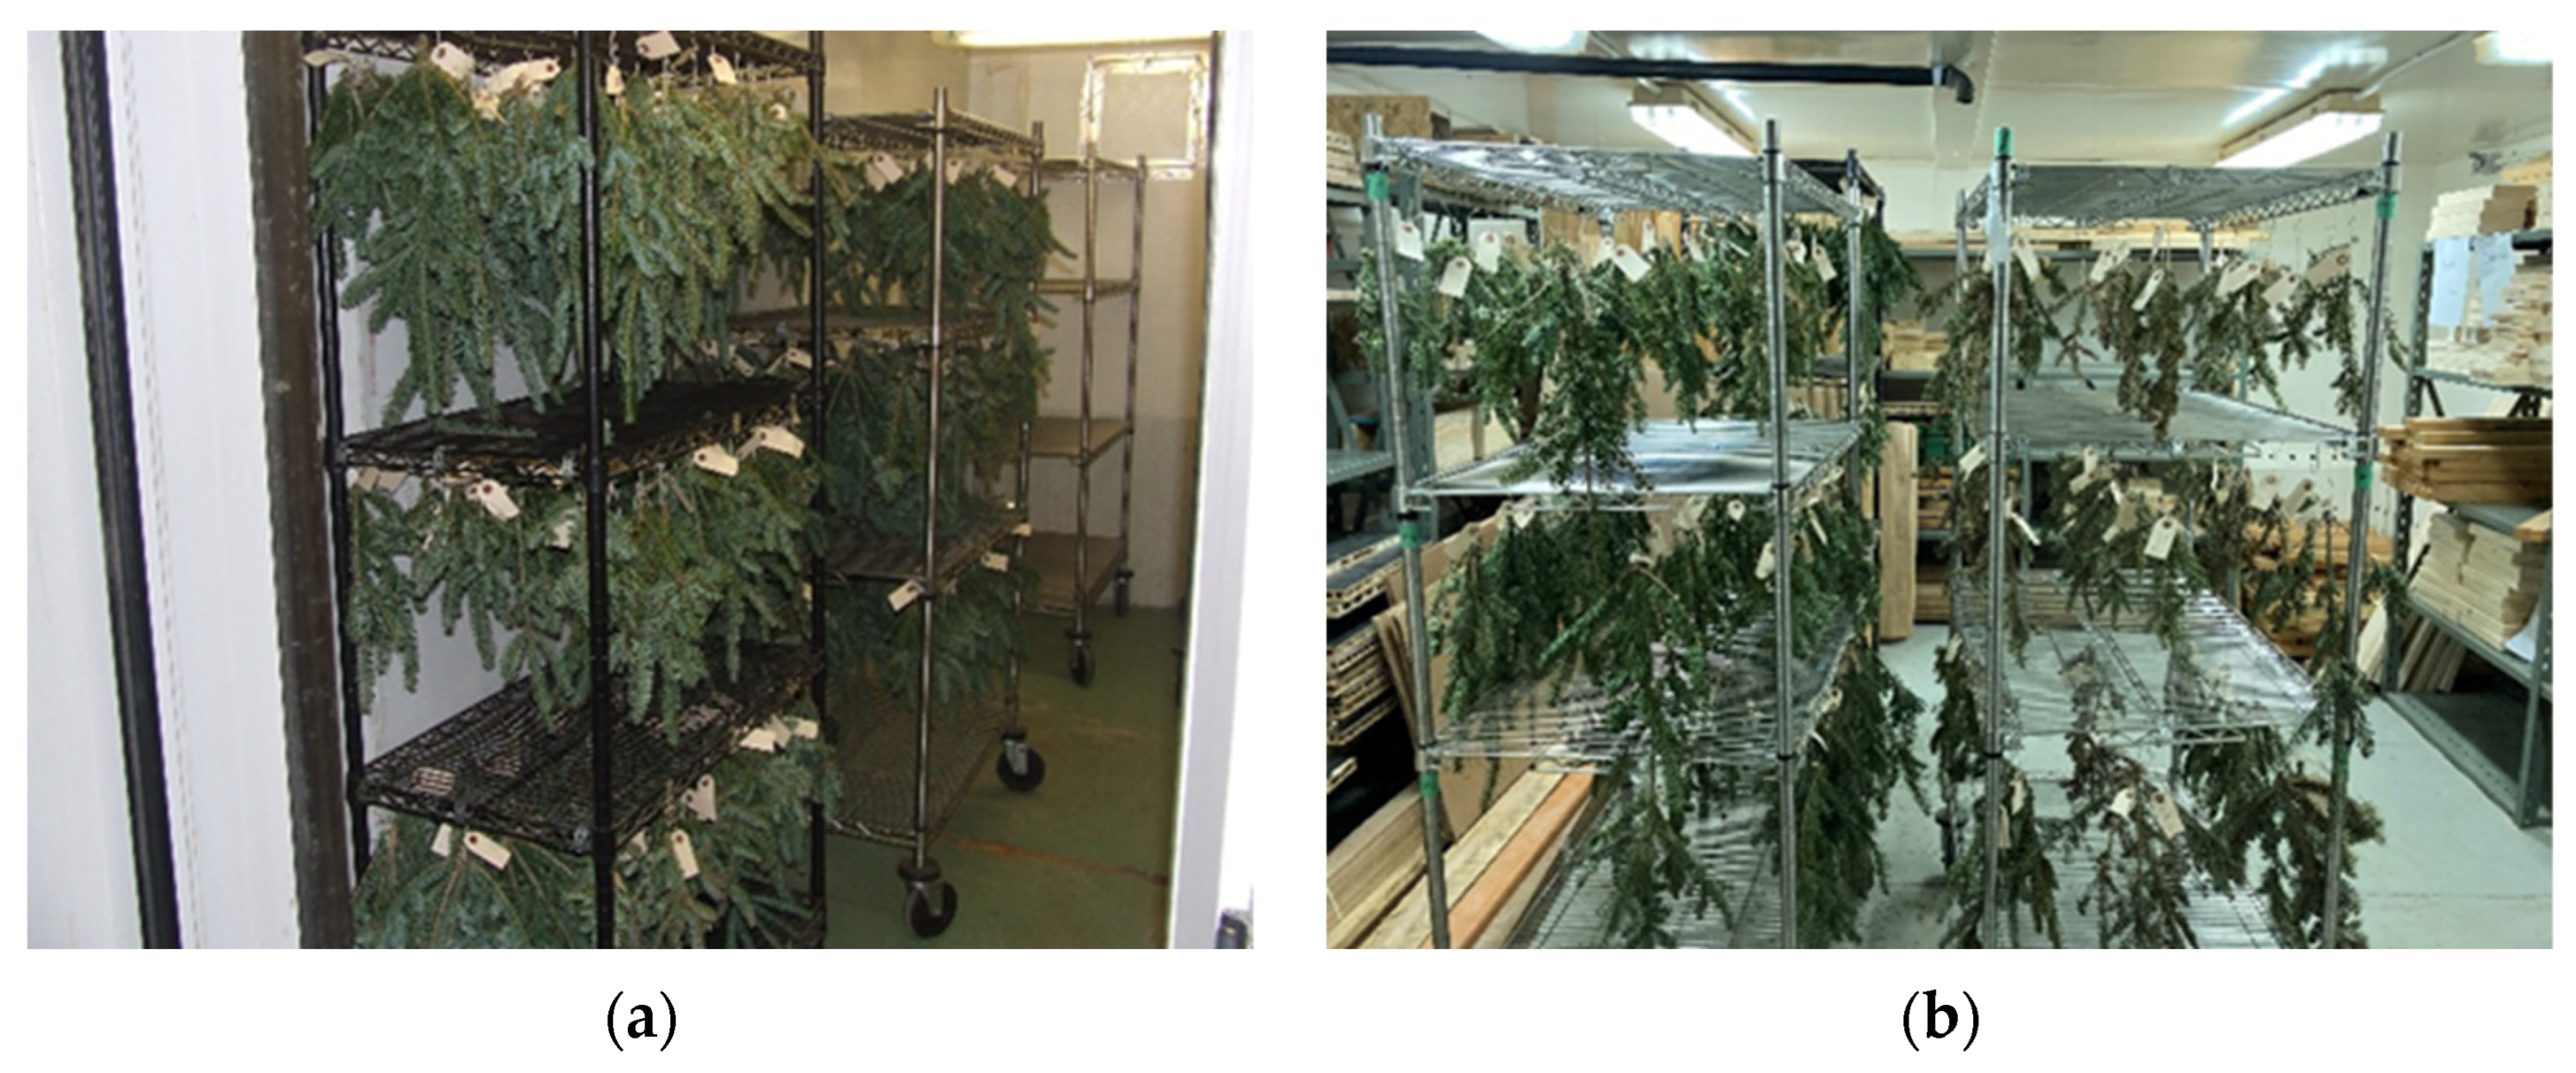
WSTC test site: Testing at the WSTC in Fredericton was carried out in growth chambers. The temperature of the chamber was maintained at 20 °C (+/−2 °C) and 50% (+/−5%) relative humidity throughout the tests. Fluorescent lighting was provided for 24 h during the tests. There was one difference in 2021 from 2020 and 2022 in that a different growth chamber was used. The same conditions were maintained, but in 2021, a larger chamber was used compared with the other two years. Branches were hung on racks within the growth chambers (
Figure 3). Each rack supported three rows of branches vertically and horizontally. One branch from each tree was hung on the top, middle, and bottom shelf. Branches were grouped by province and were measured and returned to the same row and shelf throughout the test.
In 2020, the needle retention tests ran for a total of six weeks. There were a few branches that had retained the majority of their needles and were still pliable after six weeks. In 2021 and 2022, the tests at the WSTC were run for a total of eight weeks.
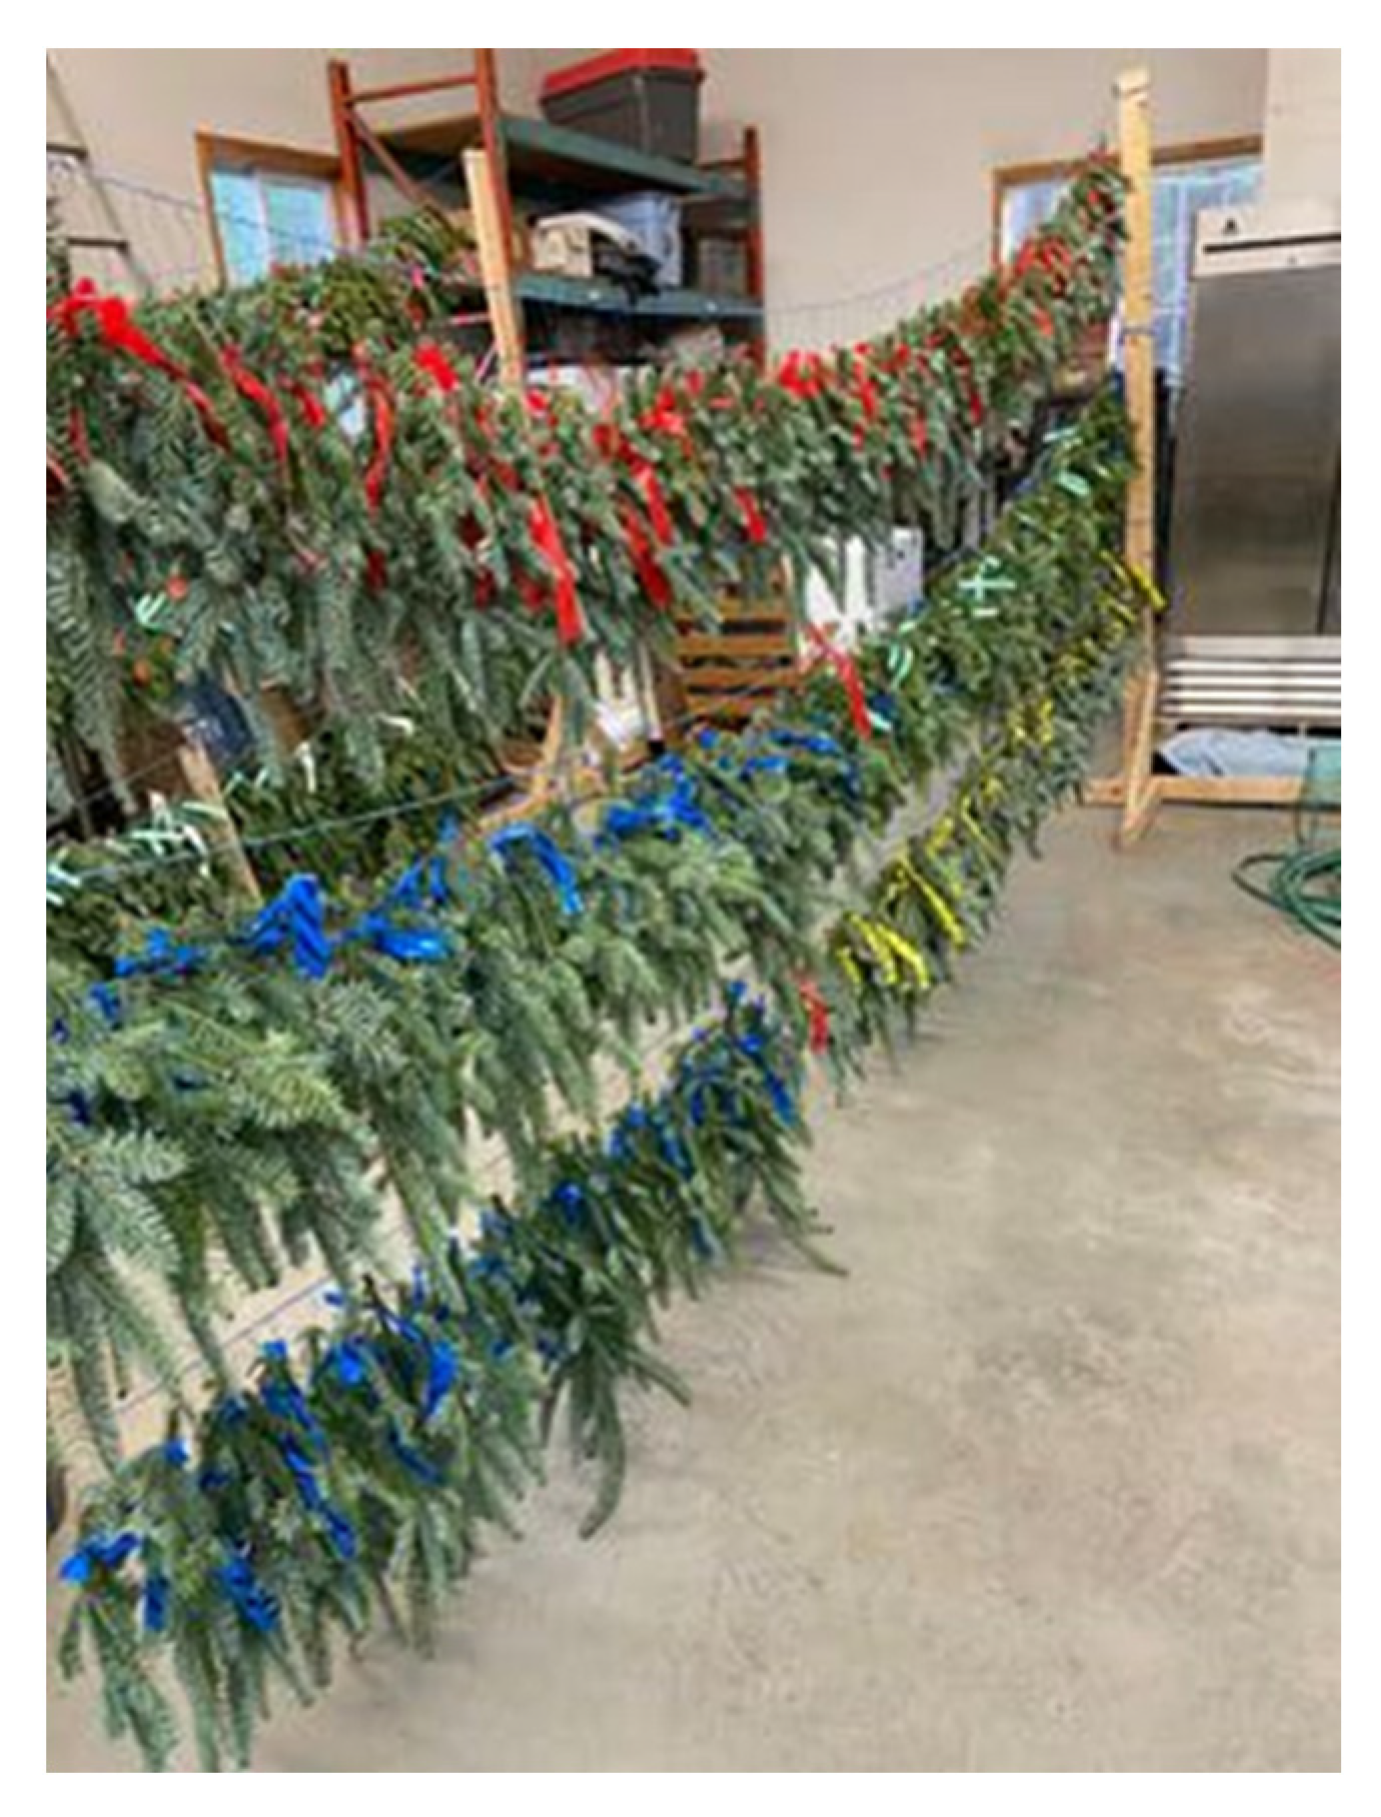
Downey test site: In Quebec, the branches were tagged and hung in a garage/shop. There was limited temperature control and no formal humidity control at this location, but this is where their routine needle retention testing is carried out (
Figure 4). Conditions in this building are generally stable at around 20 °C to 22 °C and relative humidity of approximately 60% [
27]. No supplemental light was provided to the branches, and all tests ran for six weeks.
2.4. Branch ‘Quality’ Measurements
During sample collection, the goal was to try to avoid branches with high numbers of pollen buds, but this was often not possible, especially in 2021 (
Figure 2). Therefore, to try to account for the presence of pollen buds on the branches and their potential impact on needle retention, the branches were assigned a rating of 0 to 3; 0—no pollen, 1 and 2—low and moderate numbers of pollen buds, respectively; and 3—abundant pollen buds present. This quantitative assessment of the number of pollen buds was only performed for the branches tested at the WSTC.
In addition to rating the branches for the relative number of pollen buds, branches were assigned a needle configuration rating of 1 to 3, where 1 corresponds to needles with a fairly flat configuration, 2 corresponds to needles partially oriented around the shoot, and 3 corresponds to a ‘bottle Brush’ configuration, where needles are oriented all around the shoot.
This assessment was carried out to try to determine if there were any tendencies for needle retention to be higher for trees with a bottle-brush configuration than for the other two configurations.
The initial total branch fresh weight was measured and attributed to a size class of 1 (0–26 g), 2 (>26–51 g), 3 (>51–76 g), or 4 (>76 g).
2.5. Testing for Moisture Loss and Needle Retention
Needle retention was monitored weekly at both the Downey and the WSTC sites. However, moisture loss measurements were not performed at the Downey site. Needle retention results for the two test sites are reported separately.
At the WSTC, each branch was weighed weekly. On each sample measurement day, branches were removed from the rack, weighed, and then held over an aluminum tray, and gently rubbed by hand (wearing a cotton glove) until needles stopped falling. The number of needles was counted, and the branch was classified on a 0 to 8 scale (
Table 2). Branches were discarded when they either lost half of their needles or half of their weight and had mummified needles (hard and brittle).
At the WSTC, in 2020, the needle retention tests ran for a total of 6 weeks (41 and 43 days post-harvest) for the early and late collections, respectively. In 2021 and 2022, the tests were run for six weeks, but the branches that remained pliable were retained for eight weeks at which time a final assessment was performed. Testing at the Downey location consisted of rub tests for six weeks for all three years, and the branches were assessed for total needle loss at the end of each test period.
Some branches retained their needles even though the branch was brittle. When this occurred, class ‘m’ for mummified was used. A shoot was classified as mummified when needles broke during the rub test rather than falling off. For mummified branches, the lateral shoots often snapped off.
2.6. Criteria for Choosing the Select Individuals
A two-step process was used to identify and separate the ‘Select’ and ‘Population’ groups of trees for the statistical analyses and to be included in next-generation tree improvement programs in the three provinces. These steps were used to assess all the branches tested at the WSTC during each of the early and late harvests for all three years, totaling six different testing periods.
Step 1: Qualitative assessments, including pliability and colour, were carried out weekly (
Table 3). These were generally subjective assessments of whether the branch was supple (not brittle) and whether needles started to turn yellow or brown. A needle loss rub test was also conducted weekly, and the needles shed during this test were counted and categorized on a 0–8 scale (
Table 2). When identifying branches for each grouping, the ‘Select’ branches had to first satisfy these criteria of remaining green and supple and retaining over 50% of their needles by the end of the study.
Step 2: Branch moisture loss was measured weekly and ranked. For each of the six testing periods, the top ten individuals were identified by first ranking all branches in descending order of moisture loss and then considering the criteria in Step 1. To be considered in the top ten, the branches that met the colour, pliability, and needle retention criteria were chosen, starting with the branches that had retained the highest amount of their initial fresh weight. In some instances, fewer than ten branches were selected as only those that met the criteria in Step 1 were included. The frequency of each tree that qualified in the top ten for each of the six periods was determined. Only trees that were present in the top ten for all six periods were chosen as ‘Select’ trees. This ensured that one or more branches from these ‘Select’ trees exhibited minimal weight loss and needle loss, remained pliable, and had acceptable colour at the end of every test period. Individuals that qualified less than six times could still merit future study; however, for the purpose of this study, only individuals with a frequency of six were selected. Of the 64 trees that were tested at the WSTC, 7 ‘Select’ trees were identified: 4 trees from NB, 1 tree from NS, and 2 trees from QC.
2.7. Statistical Analyses
All statistical analyses were carried out using R Studio version 4.1.0 [
28]. The rate of moisture loss followed a curvilinear pattern. Different nonlinear models were examined, and the following exponential decay model, using the Dose–Response Curves package, was chosen to calculate the slope values for each individual branch for further analyses [
29].
where
Yi, the response variable, is the moisture content of each branch
i. The initial branch weight starts at
d and decays to
c. Time is
x, and
e describes the rate of moisture loss.
A linear mixed effects model (lme) was used to compare the individual rates of moisture loss between the selected and unselected branch types while controlling the random effects of harvest timing and year as well as province of origin [
30].
where
, the response variable, is the rate of moisture loss for each branch
I;
is the general intercept; and
is the parameter associated with the fixed effect type. The random effects were year, province in year, and harvest in province in year. The lme was fitted in R using the nlme package with a restricted maximum likelihood approach.
The residuals from the model were positively skewed, and a log10 transformation was used to normalize them.
Initial analyses indicated that 29 branches lost moisture at a rapid rate (within one to two weeks post-harvest). Upon further analyses, an additional 80 branches were identified as having too few data points (lost moisture rapidly) to be properly tested. These branches significantly skewed the distribution of the data and were dropped from the analysis of the full dataset. The remaining 999 branches were included in the statistical analyses.
In complement to the lme described above, a series of t-tests were performed to further analyze the data and significance between the groups. A two-sample t-test assuming equal variances was used to test for differences in the rate of moisture loss (slope coefficient) among shelves at the WSTC test site. All shelf comparisons within each test series were evaluated, and no significant differences were found (data on file). Therefore, shelf was not included as a factor in subsequent analyses. The rate of moisture loss generally did not differ by branch size; thus, no further analysis of branch size was deemed necessary.
Two-sample t-tests were used to test for differences between rates of moisture loss between collection dates within the ‘Select’ and ‘Population’ groups, assuming equal variances. Comparisons between the ‘Select’ and ‘Population’ groups were performed using a Welch two-sample t-test and assuming unequal variances.
4. Discussion
The decision not to include tree age as a factor in this study was predicated on the results from a companion study in 2020 in which the needle retention of branches from fifteen 30- and 12-year-old grafts of the same clones (regrafts from the older trees) were tested at the WSTC following the same protocols as in this study [
31].
Not all branches from single trees exhibited the same needle retention pattern, possibly because of the slight differences in the presence or absence of pollen buds, and the aspect and position within the crowns. All the tested branches had two years of growth and were collected from the upper crowns of the trees. This was implemented so that the age classes of needles were the same for all branches. Needle drop and replacement naturally occur in trees and increase as needles age. Balsam fir needles that are one and two years old will experience a needle drop of less than 10 percent, but this percentage increases yearly thereafter [
32].
When collecting samples for testing, the branches with fewer pollen buds were prioritized but not always available. During testing, needles adjacent to pollen buds generally shed quickly compared with the other needles on the same shoots and branches. Male and female flower buds in balsam fir differentiate on elongating shoots in July [
33]. Drought and other stressors that are associated with increasing the proportion of buds that differentiate reproductively also impact needle primordia development [
34]. During years with heavy flower production, overall shoot growth, including length and number of needles, as well as size and shape of needles, is severely affected as nutrients and hormones are preferentially diverted to the developing reproductive structures [
33,
35].
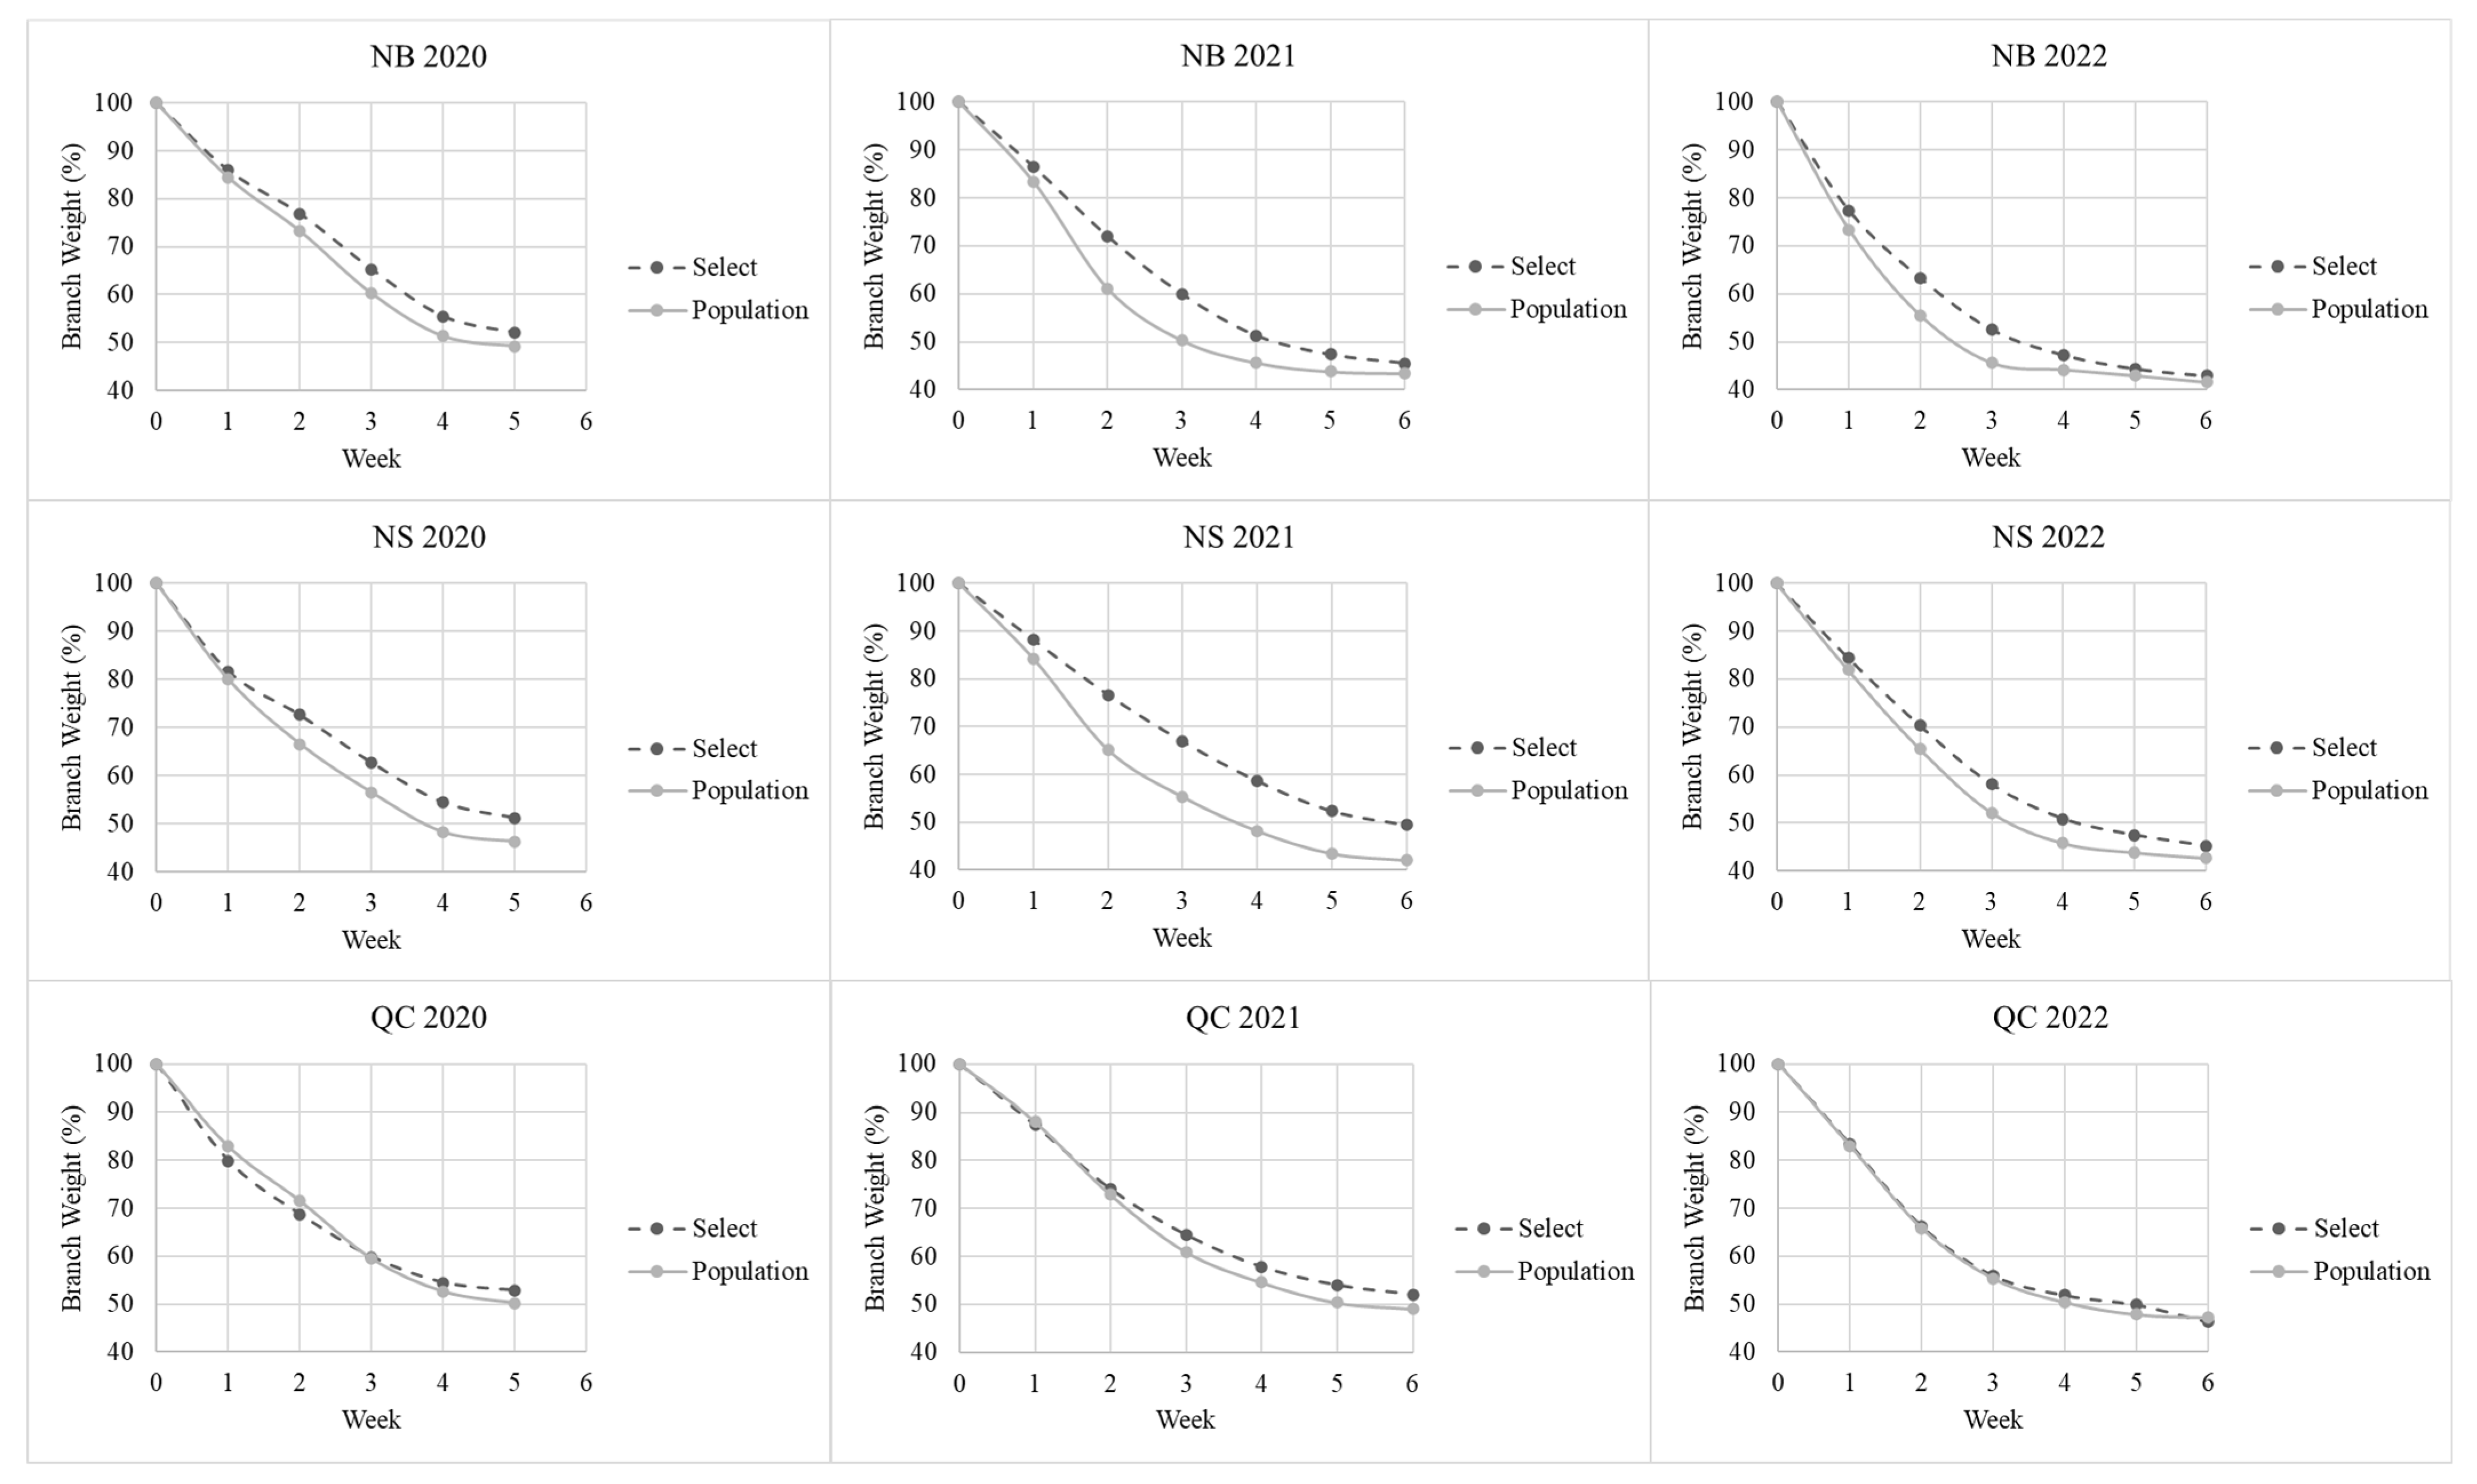
The rate of moisture loss was slower for the ‘Select’ group than for the ‘Population’ group (slopes of moisture loss over time) in all comparisons. However, these differences were only statistically significant (p < 0.05) for six of the nine single-year within-province comparisons, with the differences being significant for all three years for Quebec branches. The ‘Select’ and ‘Population’ groups differed significantly for Quebec and Nova Scotia branches in the pooled analyses (all three years combined) as well as in the full dataset comparison involving all three provinces and years.
The lack of statistical significance in New Brunswick tests is likely related to the population history of previously being selected for inclusion in a clonal seed orchard based on identified superior traits. This is also supported by New Brunswick having the most identified ‘Select’ trees, in total, four of the seven between the three provinces.
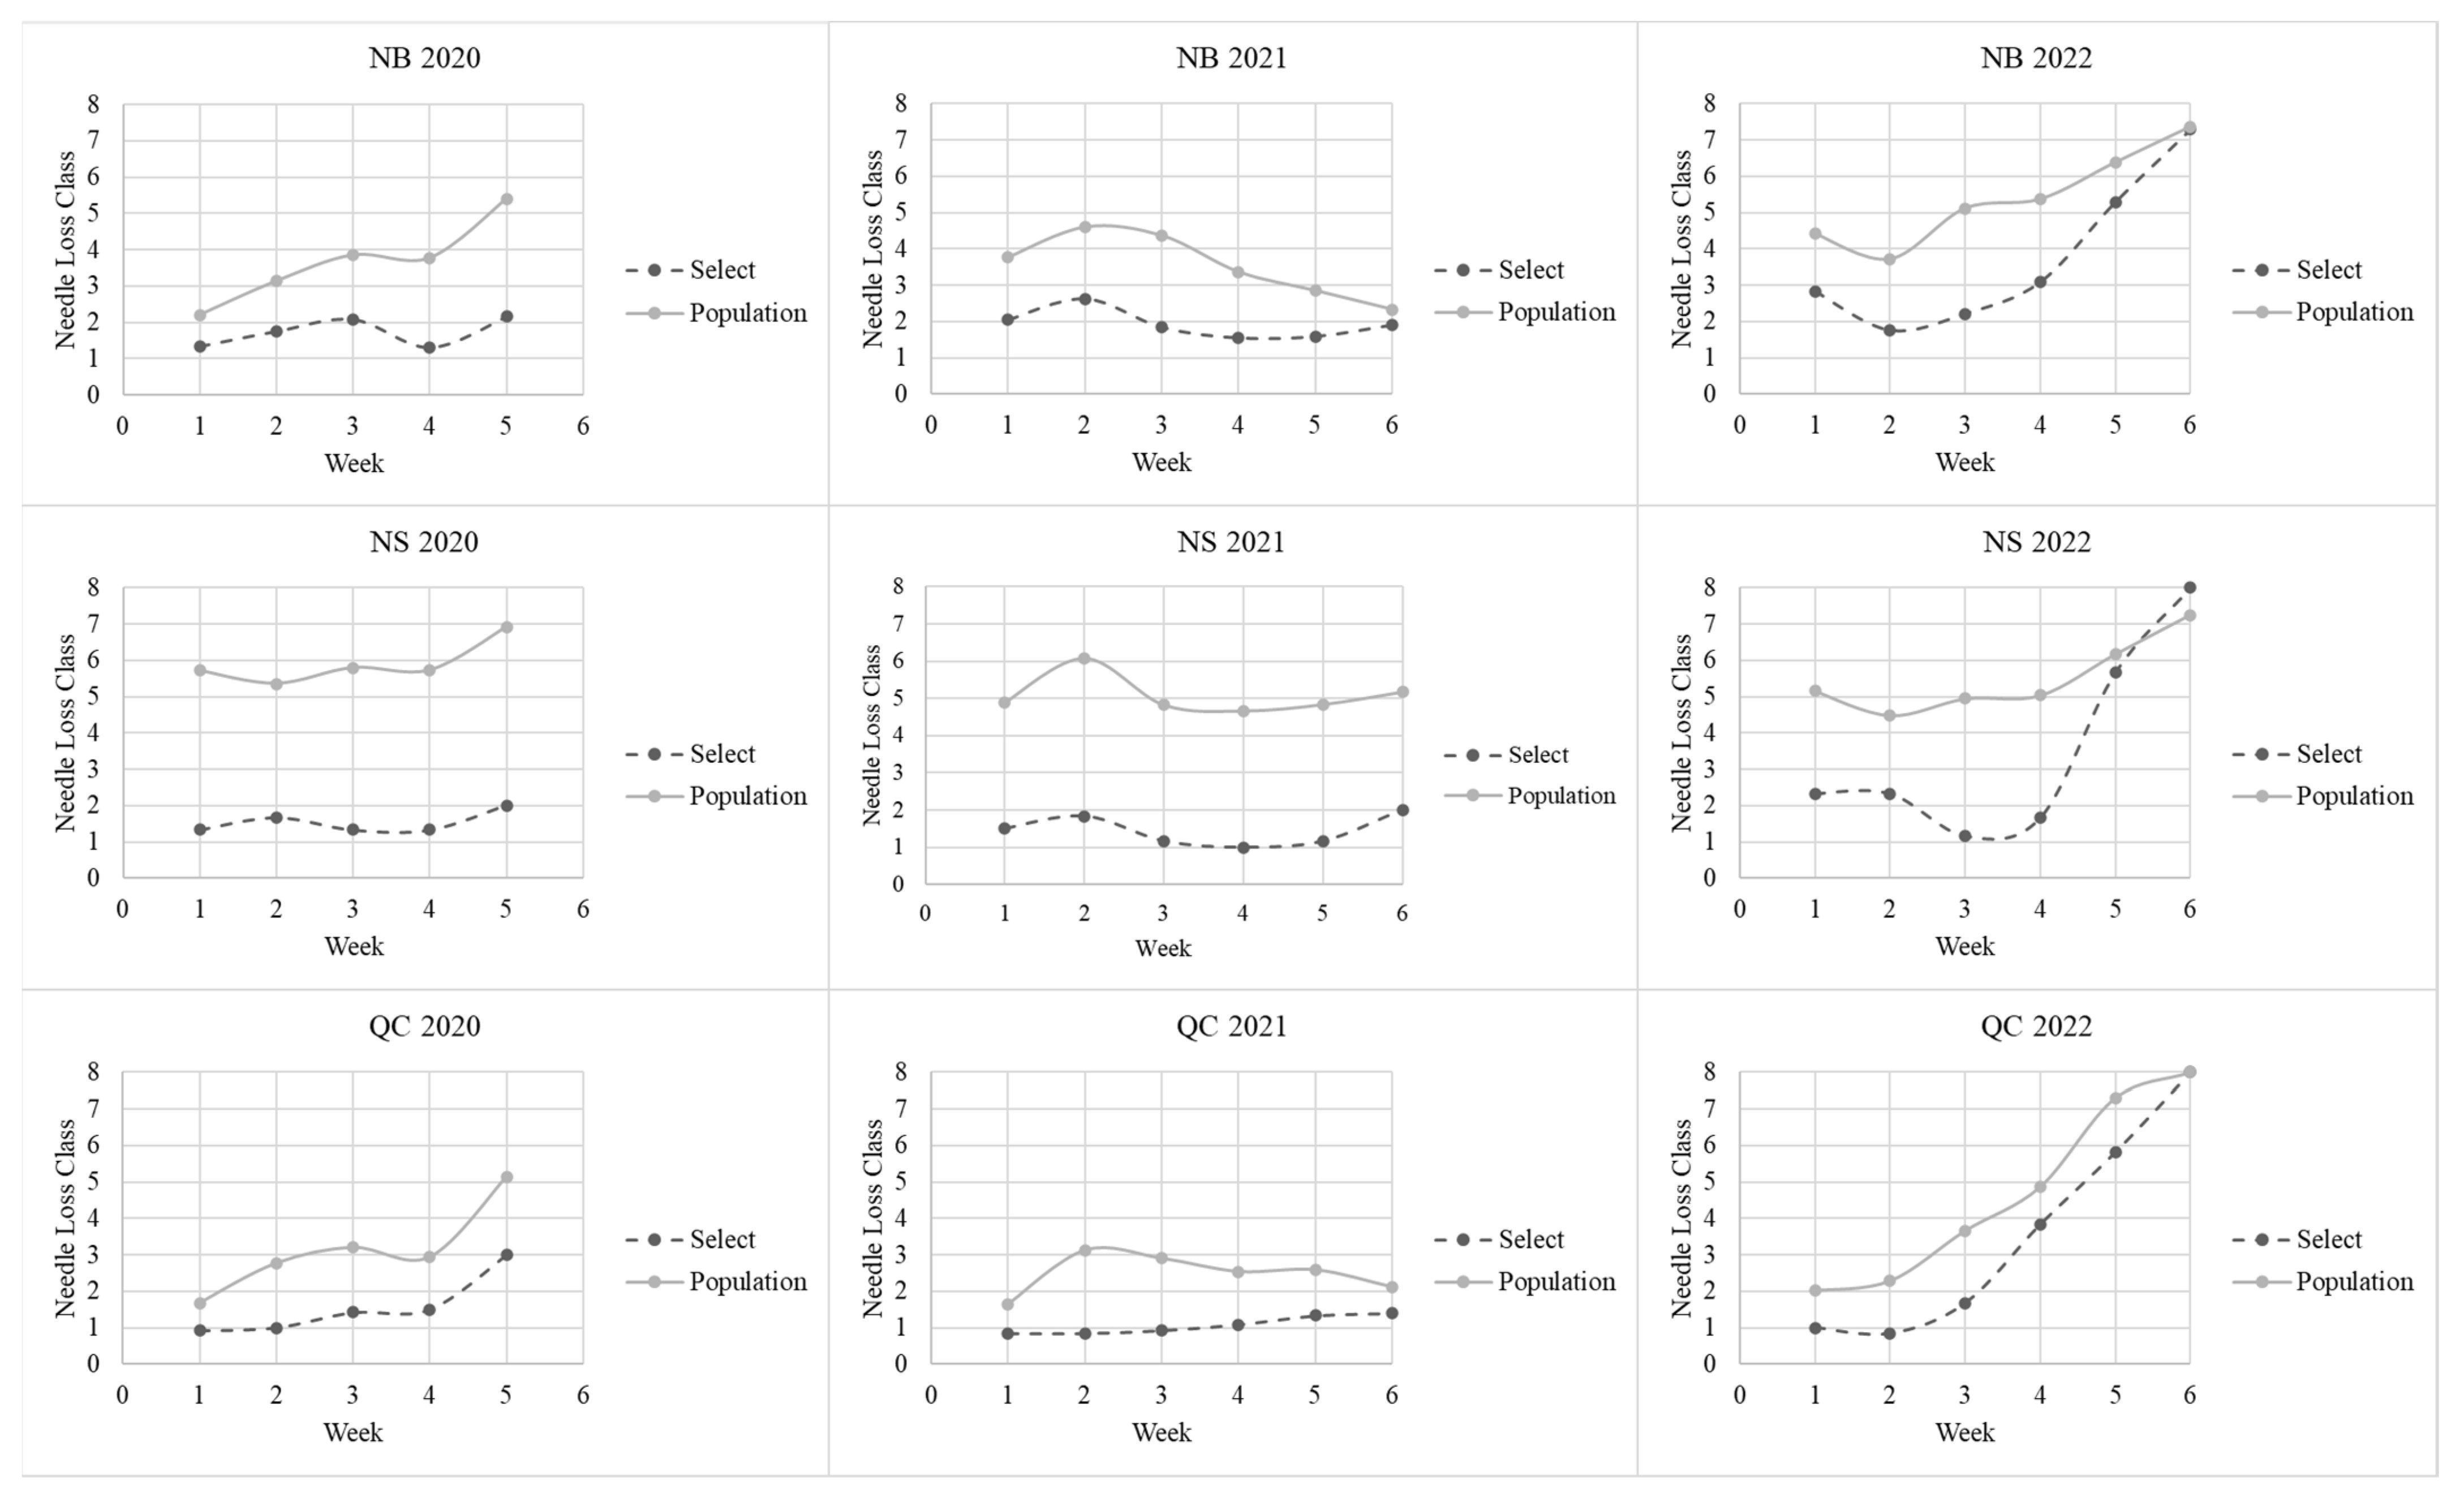
The differences in the rates of moisture loss between the early and late collections for the ‘Population’ trees were statistically significant for five of nine comparisons. Conversely, for the ‘Select’ trees, the differences were only significant for three of the nine comparisons. This observation agrees with that reported for balsam fir in which collecting branches later in the season improved needle retention more for trees with lower needle abscission resistance (NAR) than for high-NAR trees [
17].
Needle retention was generally better for branches from the late than early collections, in agreement with that generally observed for balsam fir [
22] and other Christmas tree species [
8], but not all of the differences in this study were statistically significant.
Physiological changes that have been correlated with cold acclimation and reduced post-harvest needle loss in fir species were not measured in this study, but other studies have included the accumulation of raffinose in Fraser fir [
8,
23], and raffinose, galactose, and ABA in balsam fir [
17]. In these and other studies, delaying harvesting improved overall post-harvest needle retention, but changes in the aforementioned compounds were not directly linked to needle abscission.
One limitation of using rub tests to evaluate needle loss is that it is a single quantitative measure that is affected by differences in branch size and the concomitant number of needles on the branches. Post-harvest moisture content has a direct influence on needle retention and branch quality. Multiple studies using various Christmas tree species have concluded that lower moisture levels lead to increased needle abscission and poor branch quality [
1,
8]. Because moisture loss and needle loss are directly correlated, the former was chosen as a suitable proxy for measuring the branches’ needle retention capabilities. Despite the greater control of temperature, humidity, and light at the WSTC compared with the Downey test site, both effectively identified trees that lost their needles quickly and those that kept the needles for five or more weeks.
Two different patterns of needle drop were associated with moisture loss in this study. The trees that lost needles rapidly often also exhibited rapid loss of moisture, whereas there were some that lost moisture rapidly but for which needle loss did not occur. For those trees, needles became hard and brittle but did not abscise from the shoot, i.e., they were mummified. Abscission is an energy-dependent process, and if trees dehydrate too quickly, then abscission cannot occur. Needles may still crumble or break off due to brittleness, but they do not truly abscise [
36].
The rate of needle loss in this study was predominantly not correlated with initial branch size (weight), contrary to that observed for Norway spruce [
37]. The rates of moisture loss for the four branch size classes were compared using a Welch two-sample
t-test, and of the six combinations, only the comparison between the largest and smallest classes was significant. MacDonald et al. (2014) conducted a study of 45 branches, comprising 15 each from high-, medium-, and low-NAR trees, and observed that high-NAR trees generally had smaller diameter (9.1%) and weight (25%) branches than the low-NAR genotypes. Among the other physical traits they assessed, needle density (needles/cm shoot) and needle breakage strength (force required to remove a needle from a stem) were both negatively correlated with needle retention, but neither of these measurements would be practical to use operationally.
When testing branches for weight loss, a measurement was taken each week prior to that week’s needle loss rub test, and a percentage value was generated for each of the eight weeks comparing branch weight to the samples’ original fresh weight in week zero. This percentage was used to standardize the rate of moisture loss between the samples regardless of branch size. The standardized percentages were used to calculate the slope coefficients for each branch that was used in the primary analysis. This approach was effective in differentiating between the ‘Select’ and ‘Population’ trees.
The rate of moisture loss was inversely correlated with needle retention, similar to that previously reported for whole-tree harvesting studies in balsam fir [
38] and for noble and Nordmann firs (
Abies procera and
Abies nordmanniana) [
1]. Whole-tree harvesting and monitoring can be used to assess the treatment effects on needle retention that can be applied to optimize the post-harvesting handling of Christmas trees. However, it is not a tool that can be effectively used for selecting and testing trees in a tree improvement program.
Needle retention can be considered as both a quantitative and qualitative trait. Cumulative needle loss was not, by itself, the most consistent means to select superior trees. Differences in the initial number of needles present on branches of different sizes were not factored into this study. Weight measurements were an indirect measure of needle biomass. Expressing needle loss as a percentage of total needles might have accounted for this. However, moisture loss was expressed as a percentage of branch weights, and a combination of needle and moisture loss with the qualitative assessments of needle colour and branch pliability was used. Given the different testing methods at the two test sites, slightly different criteria were used to rank the trees and a combination of the rankings was used to determine the final selections in
Table 4.
Several trees from all three provinces, although ranking high in the needle retention tests, exhibited needle discolouring and some mummification and thus were not selected. The combination of qualitative and quantitative methods resulted in four, one, and two trees being selected from NB, NS, and QC, respectively (highlighted in green in
Table 4). For example, Clone no. 1 from NB ranked in the top five in four tests at the Downey site, but at the WSTC, it ranked fourth and fifth in both harvests, respectively, only in 2021. This clone is an example of a tree that generally performed well but did not meet the specific criteria for selection when the qualitative traits were included in the selection process.
One of the potential shortfalls of using needle rub tests alone for selecting trees with good needle retention is that the number of needles lost is generally proportional to branch size. Therefore, selecting branches of equal size could have improved the comparison among trees at the Downey test site.
The results from this study indicate the importance of using the quantitative assessment of moisture loss as part of the process of selecting trees with good needle retention. The branches that lost moisture rapidly often became mummified without a significant loss of needles. These branches can be identified early in the testing process and discarded early, thereby reducing the workload. The rate of moisture loss in the ‘Select’ trees was significantly lower than in the ‘Population’ group (
Figure 7). Differences in the rate of moisture loss could be attributed to factors such as the rate, timing, and amount of wax deposition on the needles, but this was not examined in this study. Variability due to environmental conditions regarding stomatal response and wax deposition in conifers have been recorded [
39,
40].
All the trees included in this study were phenotypically good trees, having been selected for good growth and form, including crown density, acceptable crown taper, needle colour, age class retention, branch angle and needle configuration that has been associated with good needle retention [
25]. As well as freedom from insects/diseases or deformities. The number of identified ‘Select’ trees differed for the three sample sites. No direct measures of genetic variability were analyzed as part of this study. Variation in needle retention within each site was likely influenced by the relative amount of genetic variation among the trees and thus would have influenced the number of trees exhibiting superior needle retention, i.e., selection intensity. The ‘Select’ trees in this study were grafted in 2021 and 2022, and future plans include further testing for the heritability of needle retention in these trees.
5. Conclusions
The two objectives of this study were (1) to identify balsam fir parent trees for inclusion in long-term Christmas tree improvement programs in the Northeast and (2) to determine if the rates of moisture loss from branches can be used to improve or be used alone to better identify trees with good needle retention properties than traditional needle rub tests. Both of these objectives were met. These results further support the importance of assessing both quantitative and qualitative traits over multiple years in the process of selecting balsam fir Christmas trees that will be well adapted under future climate change conditions.
The next step in the program will be to evaluate the heritability of needle retention using open-pollinated family tests. The family tests will be established in each of the three provinces using all of the ‘Select’ trees plus additional selections as they are identified. These replicated family tests will be used to identify the parents that produce offspring with good growth and needle retention under different growing conditions and thus best suited for growers to use.
The trees identified in this study, and other trees as they are identified, will be used to establish seed orchards in the three partner provinces. Grafts of all seven ‘Select’ trees will be out-planted in the fall of 2023 at each of the three respective locations. The orchard in New Brunswick has already been designed, using the Computer Organized Orchard Layout (COOL) program, and the design includes 20 ramets of 40 different clones. The COOL program maximizes the distance between the ramets of the same clone, minimizing selfing as much as practicable. The designs and number of clones for the orchards in Quebec and Nova Scotia are yet to be determined. However, these orchards will be designed using the COOL program or an alternative program [
41,
42].
All the trees in this study had previously been selected because they were phenotypically good trees. The testing component for needle retention was carried out to add a criterion intended to select trees that would likely perform well under climate change conditions and be suitable for early harvesting and/or harvesting in the warmer fall seasons that are predicted for the Northeast. The results from part two of this study, identifying late-flushing trees and relating the timing of bud flush with needle retention, will be reported in a second paper and as part of the MScF thesis of Joel Tremblay.
Neither the factors that regulate needle abscission nor the number of genes that control this natural process are fully understood. Moving forward, the intention is to graft the selected trees into seed orchards and establish family tests, the results of which will be used to confirm the level of genetic heritability for needle retention. Given the significant genetic variation in morphological traits in balsam fir provenances [
20], it should be possible to select trees for traits such as the timing of cold acclimation and increased needle retention that may be associated with this process.
The second main objective of this study was to determine if combining moisture loss measurements with traditional needle rub tests could be a more reliable method for identifying trees with good needle retention properties. Our results indicate that the testing process followed here can help tests in two ways: (1) eliminating poor trees after two weeks, thereby reducing the number of trees that need to be followed for the full duration of the testing period; and (2) increasing selection intensity (i.e., selecting fewer trees), possibly increasing the likelihood of selecting genetically superior trees for a breeding program. This conclusion has to be verified with the field testing of progeny from the ‘Select’ trees.


