Abstract
As global warming intensifies, plant carbon sequestration is becoming increasingly important. Studies have shown that Ginkgo biloba L. is a kind of tree with a high carbon sequestration capacity and is one of the dominant tree species suitable for urban ecosystems. Predicting the changes in the potential suitable areas, carbon sequestration amount and carbon sink value of G. biloba under current and future climate change will provide some references for the resource utilization of urban green tree species and the realization of carbon sink value. In this study, we used ‘kuenm’, an R package that uses MaxEnt, as a modeling algorithm to predict the potential suitable areas of G. biloba under nine climate scenarios, and the carbon sequestration and the carbon sink values under the fair-value measurement model were calculated. We found that: (1) the optimized MaxEnt model improved the prediction accuracy (AUC = 0.97 ± 0.004) significantly. (2) The total current potential suitable area of G. biloba was 175.11 × 10⁴-km2, representing 21.63% of China’s total territorial area, and the highly suitable area was 26.86 × 10⁴-km2, accounting for 2.83% of China’s total territorial area, concentrated primarily in the regions of Sichuan and Chongqing, southern Jiangsu, and Zhejiang Province. (3) The eight future climate scenarios predict that the suitable area of G. biloba will initially decrease and then increase, and the newly expanded area will be distributed primarily in the middle and upper reaches of the Yangtze River as well as near the estuary of the Yangtze River, while the region suffering losses will move from Sichuan and Chongqing to Hunan, Jiangxi and Zhejiang Province as well. Hf and bio2 are the major factors affecting the distribution of G. biloba. (4) The total annual carbon sequestration of G. biloba was 1.60 × 10⁶-t, 1.50 × 10⁶-t and 1.57 × 10⁶-t under different environmental conditions in the present, the 2050s and the 2090s, respectively. Over these three time periods, we obtained total carbon sequestration values of 5.63 × 10⁷ CNY, 5.28 × 10⁷ CNY and 5.53 × 10⁷ CNY.
1. Introduction
Relict plants, also known as living fossil plants, were once continuously distributed in the warm-humid climate zone of the middle and high latitudes of the Northern Hemisphere as well as in the vicinity of the Arctic [1]. During the early Oligocene (approximately 33.6 million years ago), however, because of the cooling climate, they gradually retreated to the lower latitudes [2]. During the Late Tertiary to Quaternary, they retreated further into the three main refugia of the glacial period in Southwestern Europe, North America, and East Asia [1,2,3]. Due to the limited glacier coverage in East Asia during the Quaternary glaciation and the numerous mountains and valleys spread across Southern China, which buffered drastic climatic fluctuations and provided stable long-term habitats for species to remain on site, many Tertiary plants migrated to the refuge of China and survived to the present day [4]. Ginkgo biloba L. is a species of deciduous tree in the family Ginkgo and the class Gymnosperma G. biloba. It is a rare relic tree from the Mesozoic era and a specialty of China. Confirmed fossils of G. biloba date to the beginning of the Permian, approximately 270 million years ago [5]. The earliest G. biloba fossil in China is the Yima G. biloba from the Nanjing Institute of Geology and Paleontology in Yima, Henan Province, and it dates back to approximately 180 million years ago. Currently, there are many precious ancient G. biloba tree resources in China, mainly distributed in Sichuan, Guizhou, Hebei, Henan, Jiangsu and Hubei Provinces [6]. G. biloba is not only a common landscaping and urban greening tree species but also an important economic tree species in China. The plant has been in cultivation for hundreds of years. The leaf forests, fruit forests and timber forests of G. biloba have been widely cultivated [7]. At present, research on G. biloba focuses on component extraction [8], ancient tree resources [9], resource status analysis [10], molecular phylogeography [11] and so on. At the turn of this century, there were approximately 142 G. biloba products on the world market [12]. In response to commercial demand for G. biloba products, planting G. biloba has been established in China, the United States, France and other countries for pharmaceutical preparations based on G. biloba leaves [13]. Gong W. [9] investigated the molecular phylogeography of 13 G. biloba populations in China using genetic sequence analysis and concluded that both of the G. biloba refugia in China are located within the border zone of Hubei, Chongqing and Guizhou Provinces in Southwest China as well as in the Tianmushan region of Zhejiang Province in the Southeast China region. Based on the current state of G. biloba growth, he further proposed corresponding protection strategies [14]. Studies now estimate that the distribution of the quaternary ice age of G. biloba in China implies sporadic shelter [15], but research on the amount of G. biloba populations or their habitat response to climate change has been limited, and research on carbon sequestration and the carbon sequestration value of single G. biloba tree species has also been relatively limited.
Since the turn of the century, climate change has been the most concerning global issue. The temperature in the Southern Hemisphere has risen in all seasons so far, whereas warming in the Northern Hemisphere is concentrated primarily in spring, fall and winter [16]. China has a similar temperature variation to the Northern Hemisphere [17]. According to the Sixth Assessment Report of the United Nations Intergovernmental Panel on Climate Change (IPCC), all emission scenarios assessed predict a rise in the global average surface temperature in the 21st century, which will seriously affect the ecosystem balance [18,19]. Global climate change affects the abundance and habitat distribution of tree species, and suitable areas of species will migrate in the face of climate change, thereby altering the geographic distribution pattern of species [20,21]. The pattern of carbon sink function distribution of G. biloba was also affected by the suitability of different regions. Global human carbon emissions are currently around 9.6 × 10⁹ t·a−1. As the largest emitter of carbon, China is responsible for 28% of the world’s total carbon emissions [22]. Cities, as the basis of all economic activities, are widely recognized as the primary carbon source for a region. Seventy percent of China’s carbon emissions originate in cities and towns. China’s urbanization rate rose to 63.9% in 2020. Distinct from other terrestrial ecosystems, vegetation, soil and other natural elements as well as man-made elements in urban ecosystems have been shown to have carbon sequestration functions. China’s construction of urban green spaces and carbon storage showed a year-on-year increasing trend in recent years. As of 2017, the carbon sink of vegetation in urban districts of China was 1.19 × 10⁷-t, representing 10.1% of the total carbon sink of the vegetation [23]. The urban green space area of the built up areas was 209.91 × 10⁴-hm2 by 2017, and the urban green space area had increased to 239.81 × 10⁴-hm2 by 2020. Year-on-year growth was 14.2% [24]. The carbon sink reserves of urban ecosystems cannot be underestimated, so urban ecosystem carbon sinks play a significant role in offsetting carbon emissions and enhancing the local climate [25]. In the face of the urgent demand to achieve carbon neutrality, how to alleviate the pressure of emission reduction by improving the carbon sequestration function of urban carbon sinks has become a pressing problem to address. To date, studies of carbon sequestration have primarily focused on other terrestrial ecosystems, such as forests, grasslands and wetlands, but have rarely focused on urban ecosystems, and the carbon sequestration function of urban greening tree species has not been given adequate attention [26].
The carbon storage of arbor forests in China was mainly concentrated in the northeastern and southwestern regions, accounting for 59.83% of the total carbon storage (2050). The areas with low carbon storage included Southern China (with a high population density), Southeastern China (with a high population density), Northwestern China (with drought) and Northern China (with semi-drought) [27]. Given the concentration of cities and high population densities in Eastern and Southeastern China, the lack of a vertical belt of subtropical mountains makes the urban ecosystem especially important. Urban green spaces are located in a special environment and are greatly affected by human activities and administrative divisions; they have a large surface area and a dispersed distribution. In addition, different urban vegetation communities and tree species have different rates of photosynthesis and carbon sequestration. The only way to better game the carbon sink function of urban ecosystems is to select suitable urban greening tree species. Studies have shown that different species of trees also play important roles in slowing down the process of climate warming by sequestering carbon and releasing oxygen from the tree [28,29]. The most important role of forest ecosystems as a carbon sink is to achieve carbon neutrality. The selection of suitable carbon sequestration tree species is an important foundation for achieving carbon neutrality [30]. Different methods have been used to estimate the carbon sequestration potential of different species of trees and ecosystems. The accumulation biomass conversion equation and the eddy correlation observation technique are the primary methods used to estimate the capacity of terrestrial ecosystems to sequester carbon, of which the eddy correlation observation technique is one of the primary methods used to calculate net ecosystem CO2 exchange (NEE) between land vegetation and the atmosphere of diverse ecosystems [31] and has been widely recognized in flux observation networks. The accumulative biomass conversion equation is a linear equation used to describe the relationship between the biomass of a certain tree species and the carbon storage of that tree species. The quantitative relationship between the biomass of a tree species and the carbon storage of that tree species was calculated using a carbon coefficient of 0.5, which was used in the present study. Finally, the biological carbon sequestration potential of this tree species was calculated as the difference between the carbon storage of this tree species at a certain time [32]. Plants use photosynthesis as the primary means of carbon fixation, and chlorophyll-containing plant tissues are the primary sites for plants to carry out photosynthesis. Under certain light conditions, sources of CO2 and hydrogen (such as water) act to form carbohydrate. Different tree species, different times and different photosynthetic rates will result in carbon sequestration capacities. According to the biological characteristics, the preciousness, the current distribution of the tree species, climate, soil and other factors, G. biloba is a suitable carbon sink tree species for planting [33].
To further estimate the carbon-sequestering function of plant groups and realize the economic value of plants, in this domain, a method based on the distribution of suitable regions is gradually applied. Zhang D. et al. [34] combined the MaxEnt model and PLUS model to predict the area of carbon storage conversion and the potential sink of carbon sources in China’s terrestrial ecosystem in 2030 as a function of net primary productivity. Likewise, on the basis of the species distribution model, Dza B. et al. [35] used the index assessment system and MaxEnt method to predict potential forest habitats within the “Three-North” shelter-belt construction zone and evaluate its carbon storage. As a result, the species distribution model, as a widely used tool, has gradually been favored by researchers in the field of carbon sink assessment. The species distribution model (SDM) [36,37], also known as the niche model (ENM), is a tool for predicting the potential distribution of species and for assessing the suitability of species for habitats in the natural environment on the basis of niche theory. Numerous algorithms have been developed for ENMs [38], of which MaxEnt is one of the most widely recognized and widely used algorithms [39,40]. Yi Y. J. et al. [41] used the optimized MaxEnt model, location variables, terrain variables and bioclimatic variables to predict the distribution of suitable areas of Homonoia Lour., an endangered medicinal plant, in the past and future periods, and the important factors affecting the growth of Homonoia Lour were analyzed and obtained. This method has also been used to explore the tendency of Salix species to migrate through their habitat as they adapt to climate change. Using the relict plant G. biloba as an object of research, Liu J. [1] used random forest (RF) and MaxEnt models to make predictions about changes in the distribution of G. biloba in the past, current and future in four different concentration pathways, used the AUC index to assess the constructed model, and then analyzed the influence of the range of environmental factors on the distribution of G. biloba suitability. In this study, we evaluated the effects of climate change on the spatial distribution pattern and expansion or contraction trend of G. biloba.
Based on previous studies of the spatial distribution of G. biloba and calculation of the amount of carbon sequestered in the soil, the MaxEnt model was used to simulate and forecast the potential geographic distribution of G. biloba under the current and future climate scenarios. In addition, key climatic factors affecting G. biloba species distributions were analyzed, and the value of carbon sequestration and carbon sequestration of G. biloba in the mid-high suitability range was calculated. The results of this study provide a scientific foundation for resource conservation of G. biloba, an ancient relic plant, and a scientific benchmark for achieving carbon neutrality and sustainable urban ecosystem development.
2. Materials and Methods
2.1. Study Area
China was chosen as the research area for this study. G. biloba covers most of the eastern monsoon region of China and is a protected species of Class I in Mainland China. G. biloba grows primarily in hot, humid areas with annual rainfall between 700 and 1500 mm. It stretches northwards into the high mountains and valleys of Liaoning Province as well as Xinjiang Uygur Autonomous Region, southwards to Guangdong and other locations, westwards to eastern Sichuan and Gansu Province, and eastward to warm temperate and subtropical temperate regions along the southeastern coast [42]. From the G. biloba range, it is distributed throughout much of the eastern monsoon region, with concentrations in Hunan, Hubei, Anhui, Zhejiang, Jiangsu and other Provinces, and a small amount in the valleys of the Yunnan, Gansu and Xinjiang rivers in the western regions. The terrain consists of relatively flat plains and hilly areas, and the climate is predominantly monsoon, with abundant rainfall in the summer, sufficient heat, rainfall and warmth at the same time and a mild winter with less rainfall.
2.2. Occurrence Collection
In order to obtain occurrence records for G. biloba across its range, we performed a comprehensive search of the literature using online databases and referenced the Global Biodiversity Information Facility (GBIF, https://www.gbif.org/ (accessed on 5 July 2023)) and the Chinese Virtual Herbarium Databases (CVH, https://www.cvh.ac.cn/ (accessed on 5 July 2023)). Where occurrence records did not have exact geo-coordinates, we used Google Earth (http://ditu.google.cn/ (accessed on 5 July 2023)) to determine latitude and longitude. Based on the above sources, G. biloba distribution localities were compiled into a database. To ensure reliability of the data and reduce errors caused by the clustering effect, all sample point records were from the year 2000, and duplicate records were removed and spatially filtered such that a single point occurred within each grid cell (10 km × 10 km). An observation point map was created using ArcGIS 10.7 software (Esri, Redlands, CA, USA). This resulted in 149 documented G. biloba presence records for model building (Figure 1).
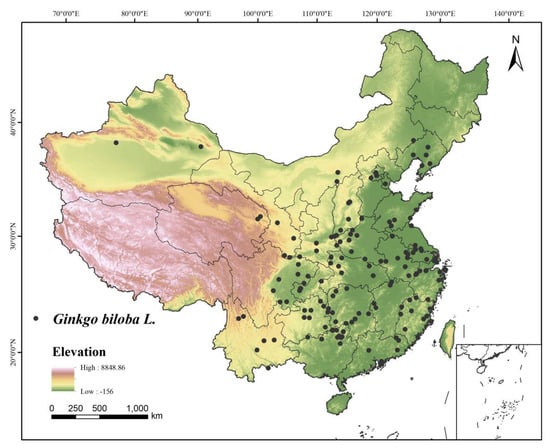
Figure 1.
Distribution records of G. biloba in China.
2.3. Environmental Variable Screening and Data Processing
(1) The comparison Program (CMIP6) WorldClim database (http://worldclim.org (accessed on 5 July 2023)), primarily temperature and precipitation data, was used. Both were the standard annual mean data for 1970–2000, while solar radiation (Srad) and vapor pressure (Vapr) were the standard monthly mean data for 1970–2000 [43]. Four climate scenarios (SSP126, SSP245, SSP370 and SSP585) in the modern period and the future time periods of 2050s (2041–2060) and 2090s (2081–2100) were chosen for simulation, with a spatial resolution of 30″ (approximately 1 km2), in order to improve the accuracy of the prediction. The future climate data used in this study were generated by the second generation of the National Climate Center Medium Resolution Climate System Model (BCC-CSM2-MR), which can more reliably simulate rainfall and temperature in China [44]. (2) The following data were collected on the environmental factors of the soil: Chinese soil characteristics of the data set (Clay1, Clay2, Sand1, Sand2) were taken from the National Science Data Center (http://data.tpdc.ac.cn/zh-hans/ (accessed on 5 July 2023)) of the Qinghai-Tibet Plateau, and the data for soil quality (Sq1–Sq7) were taken from the database World of Soil (https://www.fao.org/soils-portal/ (accessed on 5 July 2023)). (3) The topographical environmental factors were elevation (Elev), slope (Slop) and aspect (Asp), all of which were taken from the FAO Soil Portal (https://www.fao.org/soil-portal/data-hub/en (accessed on 5 July 2023)). (4) Human activity factors included human footprints (Hfs) [45] as well as global human population densities (Dens) [46] and land system change (Ter) [47]; these variables came from the Social and Economic data and Application Center (http://sedac.ciesin.columbia.edu (accessed on 5 July 2023)). Hf provides a global map of the cumulative human pressure on the environment. The human pressure is measured using eight variables, including built-up environments, population density, electric power infrastructure, crop lands, pasture lands, roads, railways and navigable waterways.
To avoid overfitting in the final model due to strong correlations between environmental variables, the 23 environmental variables were filtered using Spearman’s correlations in R [48]. We retained the variables with a correlation coefficient ≤|0.8|, and only one factor was eliminated if the values were ≥|0.8| (Table 1).

Table 1.
Environment variables involved in modelling.
2.4. Model Construction and Evaluation
In this study, we used the optimized maximum entropy model (Maxent, version 3.4.1 k; http://www.cs.princeton.edu/wschapire/Maxent/ (accessed on 5 July 2023)) [49] with the Kuenm data package, exploited parameters, RM (regularization multiplier) and FC (feature combination multiplier), and we set the value of RM to 0.5~4, with an interval of 0.5. There are 8 kinds of regulation frequencies; a total of 232 candidate models were created using 29 combinations of 5 feature class settings of FC (l, q, p, t, h) [50]. The area under the receiver operating characteristic (ROC) curve (AUC) is an indicator of model performance. The significance (partial ROC, 1000 iterations and 25% data for bootstrapping), omission rate (E = 5%) and model complexity (AICc) were used to evaluate the performance of candidate models, and the best model was selected according to the following criteria: (1) model significance; (2) omission rate E ≤ 5%; and (3) ΔAICc ≤ 2. Finally, the linear and threshold feature class (i.e., FC = q) and regularization multiplier of 3 were used to fit G. biloba.
Then, MaxEnt 3.4.1 software was used to predict the potential distribution area of G. biloba in different periods. The maximum number of iterations was set to 1000 and repeated 10 times. The cross-validation method was selected to extract test samples. This method randomly partitions all distributed records into 10 subsets. One subset is used as a test set, and the remaining nine subsets are used as the training set for each replication. Other parameters are the default values. Once model parameters were fixed, MaxEnt prediction accuracy was assessed via AUC. AUC values range from 0 to 1, and the larger the value, the higher the fidelity. An AUC ≤ 0.5 simulation means that the model fails completely, 0.5 < AUC ≤ 0.8 indicates a low fidelity and AUC > 0.8 indicates a high fidelity [51].
The prediction results of the potential suitable habitats of G. biloba output by the MaxEnt model were binary raster data in ASCII format. In ArcGIS 10.7, the ASCII format is converted into raster format. The Habitat suitability index (HSI) of G. biloba in each grid was obtained, and the average logical value was used to divide the suitability into four levels (I: 0%–40%; II: 40%–60%; III: 60%–80%; IV: 80%–100%), representing the unsuitable area, the low-suitability area, the medium-suitability area and the high-suitability area, respectively. Finally, according to the suitability index corresponding to each grid, the corresponding area of different suitability was calculated.
2.5. Calculation of Spatial Distribution Pattern
In order to account for changes in spatial patterns in potential suitable areas of G. biloba under the background of future climate change, in this study, we took the region with a logical Q ≥ 40% value as the appropriate region; that is, the low-suitability area, medium-suitability area and high-suitability area were included and represented by “1”. An area with a logical value less than 40% was defined as an uninhabitable area, which was represented by “0”. Four types of suitable area change were defined in this study: new area, loss area, reserved area and non-study area. Future changes in the suitable area were calculated and compared on the basis of the area of the current suitable area for G. biloba. Matrix 0→1 represents the newly added suitable area, 1→0 represents the unsuitable area, 1→1 represents the reserved suitable area and 0→0 represents the unsuitable area [52]. Lastly, the matrix change values were loaded into ArcGIS 10.7 in order to realize the visual expression of changes in the spatial patterns of G. biloba’s suitable regions.
2.6. Carbon Sink Estimation and Carbon Trading Price Calculation
Using a literature review and data collection, the present study took as its base the stock of the species of G. biloba tree investigated in the Forest Resources Planning and Design Investigation. The choice of the biomass conversion factor method as the carbon sink calculation method allowed the biomass to be calculated with the biomass expansion factor of G. biloba tree species and obtained the dry biomass weight of G. biloba via the base wood density of the G. biloba tree species. Lastly, depending on the carbon content of the biomass, the average amount of carbon sequestration of relict G. biloba in one year was 2.08-t/km2 [53]. The formula is as follows [54]:
where Ct is the carbon storage of the tree species; Tt is the total stock of the tree species; Dm is the basic density of wood of the tree species. BEF is the biomass expansion factor. R is the ratio of above-ground biomass to trunk biomass; BD is the dry matter carbon content of biomass. Table 2 shows the calculation parameters of carbon storage of G. biloba [55].

Table 2.
Calculation parameters of G. biloba carbon storage indices.
Market transactions can be used to realize the ecological value of forestry carbon sinks. In existing accounting studies, the unit price of carbon sinks consists primarily of five modes of measurement: historical cost, replacement cost, fair value, net achievable value and present value [56]. In terms of calculating the carbon trading price, there are five existing domestic exchanges, each of which has a large difference in the share of the trade in carbon, and the carbon trading price per unit of carbon sequestration also differs. In order to objectively and reasonably calculate the carbon sink value of tree species of G. biloba, for this study, the 2021 annual carbon trading price (Table 3) was chosen based on the carbon trading price disclosed by the five exchanges. The price of each unit of carbon sequestration was multiplied by the amount of carbon sequestration in order to arrive at the total value of the carbon sink. Recently, it was calculated from China’s carbon emissions trading market because the domestic carbon trading market is relatively active, and the exchange price is available and always fluctuates. A fair value can be chosen that reliably reflects the true value and changes in carbon sinks. As a result, the carbon sink value of G. biloba was 35.23 CNY/t based on the fair value measurement model. The carbon sink value of relict G. biloba trees in moderately-highly suitable areas under the current and eight future scenarios was calculated based on the 2021 fair value.

Table 3.
Price statistics of five carbon trading markets in 2021 (price: CNY/t).
3. Results
3.1. Model Optimization and Accuracy Evaluation
Based on 149 distribution sites and 23 environmental variables of G. biloba, the Kuenm dataset was used to call MaxEnt in order to predict the potential current and future distributions of G. biloba. When FC = Q, RM = 3 and delta.AICc = 0, this parameter is the optimal model (Table 4). The values of the optimized AICc and the omission rate were superior to the default values, which indicated that the optimized parameters were beneficial for reducing the fitting degree and complexity of the model. Under this parameter, the MaxEnt prediction results showed that the area under the receiver operating characteristic curve (AUC) was 0.974 ± 0.004, indicating that the prediction results were extremely accurate.

Table 4.
Kuenm optimization evaluation indices of MaxEnt model.
The position of the selected models in the distribution of all candidate models with respect to statistical significance, omission rates and AICc values is shown in Figure 2.
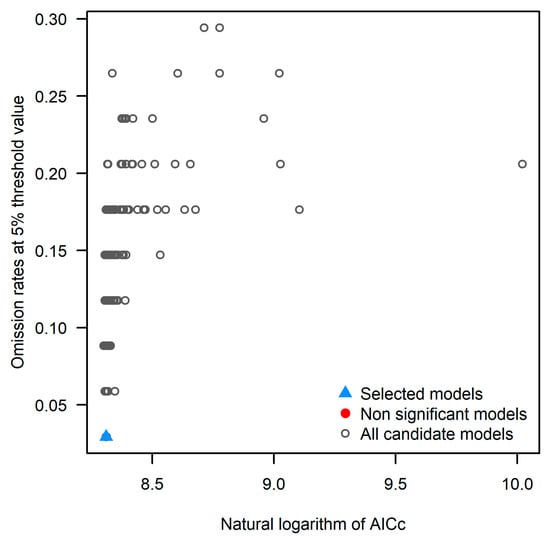
Figure 2.
Distribution of allmodels, non-statistically significant models and selected models.
3.2. Importance of Environmental Variables
Table 5 shows that the cumulative proportion of the eight environmental variables that had the highest contribution rate in the current scenario was 93.4%, followed by the human footprint (Hf, 57.5%), and the proper range was over 20. The average diurnal temperature amplitude (Bio2, 13.5%) had an appropriate range of 5.09–18.58 °C. The global human modification of terrestrial systems (Ter, 5.9%) had a suitable range of 0.2–0.984. The coefficient of variation of precipitation (Bio15, 5.5%) had a suitable range of 24.84–86. The elevation above sea level (Elev, 3.8%) had a suitable range below 2000 m. Solar radiation (Srad, 2.5%) had a suitable range below 16500. For soil type (Soil, 2.4%), the suitable range was 1–4. For temperature seasonality (Bio4, 2.3%), the suitable range was below 900.

Table 5.
Contribution rate of main environmental variables of G. biloba.
The results in Table 6 show that under the eight future scenarios, excluding the rate of contribution of hf to G. biloba distribution, the rate of bio2 contribution in climatic factors to the potential distribution of G. biloba was higher, consistently above 10%, and will increase with increasing concentration of emissions in 2050 and 2090.

Table 6.
Contribution rate of bio2 in future scenarios.
3.3. Current Potential Suitable Areas of G. biloba
As shown in Figure 3, the G. biloba suitable area was divided into four levels: highly suitable area, moderately suitable area, marginally suitable area and unsuitable area. Under current environmental conditions, the total potential suitability area of G. biloba was 175.11 × 10⁴-km2, accounting for 21.63% of the total territorial area of China. The highly suitable area covered an area of 26.86 × 10⁴-km2, representing 2.83% of the total land area, and was mostly distributed in the south Jiangsu, east Sichuan, northeast Taiwan, the Guangdong Pearl River Delta, Zhejiang, Chongqing, Shanghai, Beijing, Tianjin and Guanzhong Plain of Shaanxi. The moderately suitable area was spread around the highly suitable area and expanded outward with the highly suitable area in the center, covering 50.44 × 10⁴-km2, which made up 5.32% of the national area. The marginally suitable area was 127.81 × 10⁴-km2, representing 13.48% of the national area, which was mostly distributed in most parts of the eastern monsoon region of China, with the exception of Northeast China. By comparing the distribution of China’s isoprecipitation line, we found that the distributional limit of the suitable area of G. biloba fundamentally coincided with the 400 mm isoprecipitation line. It was mostly distributed in areas with annual rainfall in excess of 400 mm.
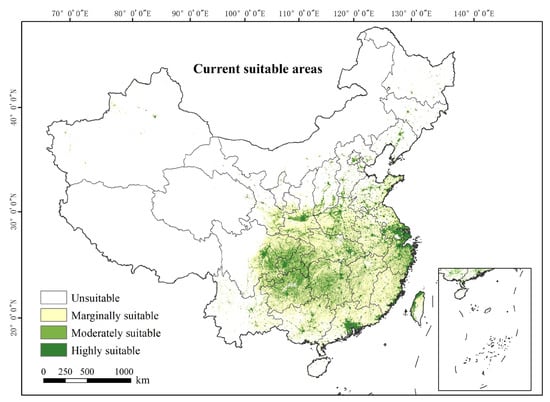
Figure 3.
All levels of distribution of G. biloba currently.
3.4. Changes in the Spatial Distribution of Potential Suitable Areas in the Future
The spatial distribution of suitable G. biloba areas under eight future climate scenarios was compared with the current suitable G. biloba areas (Table 7, Figure 4 and Figure 5), and the results demonstrated that under all eight future climate scenarios, first, the G. biloba suitable areas will decrease and then will increase, most of the new area will be distributed in the middle and upper reaches of the Yangtze River and in the vicinity of the Yangtze River estuary and the region with a loss will move out of Sichuan and Chongqing and into Hunan, Jiangxi and Zhejiang Province. The total area of the suitable area will reach the maximum under the 2090s-SSP370 scenario, at 222.18 × 10⁴-km2, the moderately–highly suitable area is approximately 82.76 × 10⁴-km2, 1.07-times the current area and the potential loss of suitable area is the smallest, at only 3.14 × 10⁴-km2, mainly in Hunan Province.

Table 7.
Change in suitable area of G. biloba in different periods (×104-km2).
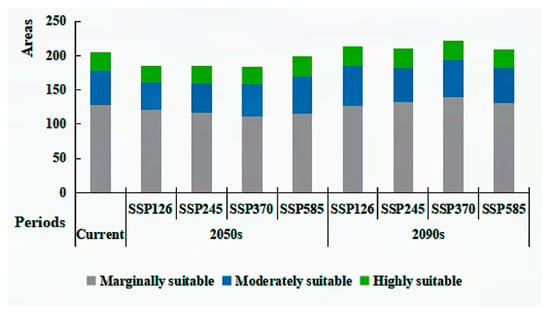
Figure 4.
Statistical map of the different G. biloba suitability areas in different periods.
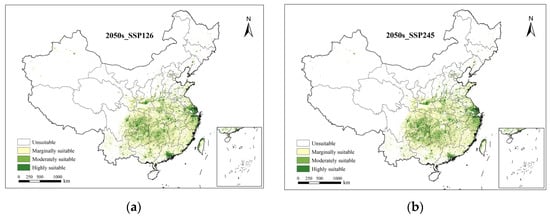
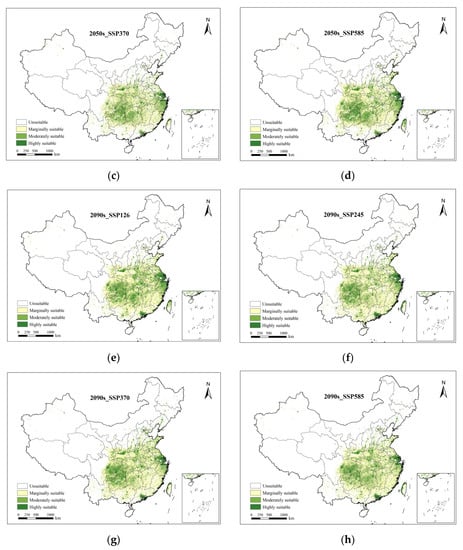
Figure 5.
Potential distribution of G. biloba under each climate scenario. The yellow, light green and deep green represent the marginally suitable, moderately suitable and highly suitable areas, respectively. (a) is the 2050s-SSP126 scenario, (b) is the 2050s-SSP245 scenario, (c) is the 2050s-SSP370 scenario, (d) is the 2050s-SSP585 scenario, (e) is the 2090s-SSP126 scenario, (f) is the 2090s-SSP245 scenario, (g) is the 2090s-SSP370 scenario and (h) is the 2090s-SSP585 scenario.
As shown as Figure 6 and Figure 7, in the 2050s-SSP126 emission scenario, the minimum area of increase was only 3.56 × 10⁴-km2, whereas the area of loss was relatively large, reaching 16.01 × 10⁴-km2. Major areas of loss include the Sichuan Basin, Chongqing, and the northern part of Guizhou. For the 2090s-SSP585 and 2050s-SSP585 emissions scenarios, the reserved suitable area was larger, and the reserved area was 70.49 and 69.92 × 10⁴-km2, respectively. The reserved areas in both scenarios were mostly concentrated in Chongqing, southern Jiangsu, and the greater part of Zhejiang Province. In the 2090s-SSP126 emission scenario, the newly added G. biloba suitable area was 19.12 × 10⁴-km2, and the amount of newly added land in Hubei and Henan was significantly larger than in the other emissions scenarios.
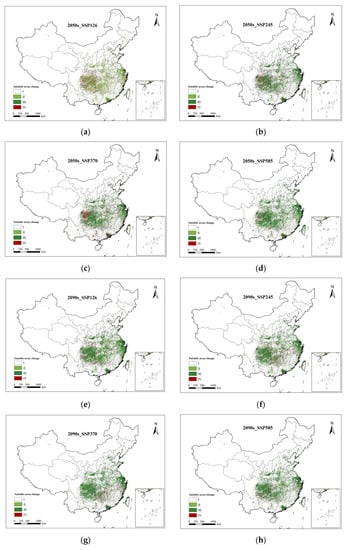
Figure 6.
Spatial pattern changes of suitable areas of G. biloba under future climate change scenarios (compared to the present). I, II, III and IV represent the unsuitable, reserve, increase and lost areas, respectively. (a) is the 2050s-SSP126 scenario, (b) is the 2050s-SSP245 scenario, (c) is the 2050s-SSP370 scenario, (d) is the 2050s-SSP585 scenario, (e) is the 2090s-SSP126 scenario, (f) is the 2090s-SSP245 scenario, (g) is the 2090s-SSP370 scenario and (h) is the 2090s-SSP585 scenario.
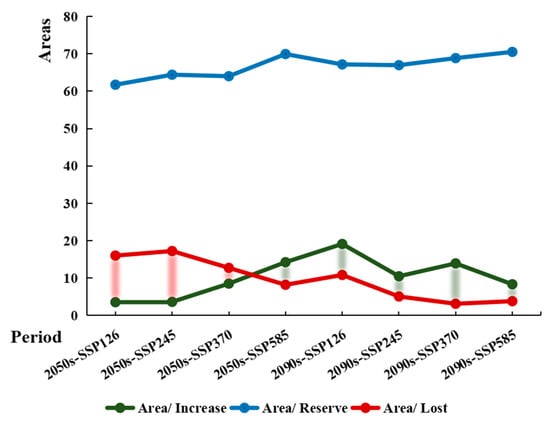
Figure 7.
Changes in the suitable distribution area of G. biloba under different climate scenarios.
In general, in all scenarios in the 2050s, the newly added suitable area and the total area suitable for living reached a maximum under the SSP585 scenario with the highest emission concentration, while in the 2090s, the newly added suitable area and the total area suitable for living decreased with increasing emission concentration.
3.5. Carbon Sequestration and Carbon Sink Value of G. biloba
Based on the value of G. biloba carbon sequestration and carbon sinks in Section 2.4, it is possible to calculate the potential carbon sequestration and carbon sink value of G. biloba in one year in moderately-highly suitable areas under the current and eight future scenarios. Table 8 shows the calculated results. The total annual amount of carbon sequestered by G. biloba under the current environmental conditions is 1.60 × 10⁶-t, and the total value of the carbon sink is 5.63 × 10⁷ CNY. The mean annual values of total carbon sequestration and total carbon sink for G. biloba over the 2050s were 1.50 × 10⁶-t and 5.28 × 10⁷ CNY, respectively. These two values were 1.57 × 10⁶-t and 5.53 × 10⁷ CNY, respectively, in the case of the 2090s. In the 2090s-SSP126 scenario, the values of total annual carbon sequestration and total carbon sink of G. biloba reached their highest values at 1.79 × 10⁶-t and 6.31 × 10⁷ CNY, respectively, in the same year.

Table 8.
The potential carbon sequestration and carbon sink value of G. biloba in a year in moderately and highly suitable areas under the current and future 8 scenarios.
4. Discussion
4.1. Reliability of Simulation Results
The reliability of the niche model simulation results depends primarily on three aspects, the first of which is the choice of model. Different models have very different prediction accuracies, and the MaxEnt model has been proven to perform better than other models [57,58]. The second factor is the range of sample collection and the uniformity of sample coverage. Thus, the closer the selection of sample points is to the true species distribution, the better the prediction accuracy. Third, the source, type and accuracy of the environmental factors must be considered. As the number of factor types that are selected in the simulation increases, so does the prediction accuracy. By calling the Kuenm data set to optimize MaxEnt, the degree of overfitting and sampling bias can be reduced to improve prediction accuracy. Figure 8 shows that AUC = 0.974 ± 0.004 was greater than 0.9 after optimization, indicating a high prediction accuracy as well as reliable simulation results.
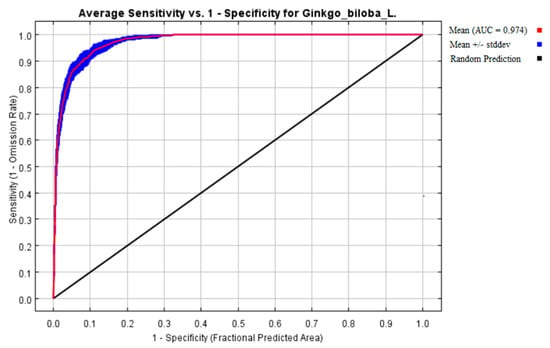
Figure 8.
The ROC of MaxEnt model.
4.2. Main Environmental Factors Affecting G. biloba Distribution
The results of MaxEnt’s analysis showed that Hf and Bio2 were the most significant factors limiting the spatial pattern of G. biloba distribution. The contribution rates of hf and Bio2 ranked first and second, respectively, over the 10 simulation iterations in this study. Thus, under current conditions in China, the major factors affecting the distribution of G. biloba are the human footprint as well as the selection and planning of greening species in a variety of administrative districts. In terms of climate, the average diurnal range of temperature has a large influence on the survival of G. biloba. If this index exceeds a range of 5.09–18.58 °C, G. biloba will be faced with the threat of normal plant growth.
Bio4 was found to be significantly correlated with Bio6, Bio7, Bio9 and Bio11 in correlation analysis. Based on the correlation coefficient |r| > 0.85 (p < 0.01) and these indices, it is possible that seasonal temperature differences and winter low temperature are the key factors constraining the northward diffusion of G. biloba.
In Eastern China, from tropical and subtropical to temperate zones, the change in temperature is quite drastic, the cool temperate zone and its northern regions have a large difference in annual temperature, fall and winter are vulnerable to cold waves, and the range of temperatures is very wide; these patterns indicate that the seasonal temperature variation is at a moderate level suitable for G. biloba growth. In addition, low temperature limited seed germination or the length of the growing season for G. biloba, and severe cold adversity challenged its cold tolerance and ultimately led to its normal growth and development in areas of low temperature. As a remnant plant, G. biloba gradually retreated to lower latitudes as a result of the cooling of the northern climate during the glacial period and eventually remained in the current range.
Species are constrained by their fundamental ecological niches in environmental space; however, in geographic space, their distributions also depend on biotic interactions and dispersal ability [59]. In this study, we were only interested in the effects of environmental factors on the current and future potential habitat of G. biloba and did not consider the species interaction (competition, synergies, etc.) and the species genetic plasticity to adapt in new areas or remain in unsuitable areas, under climate change scenarios, which is a deficiency.
4.3. Potential Suitable Area of G. biloba and Its Change Trend
In the eight future greenhouse gas emission concentration scenarios, MaxEnt predicted that the total potential area of suitable G. biloba habitat would first shrink and then expand, and in the SSP585 scenario with the highest concentration of emissions, the area of potential suitable surface was relatively large and evidently migrated northwards, which may have been a result of increased temperature and precipitation in the adjacent northern region of the modern suitable area of G. biloba, which may have provided an environment more conducive to its growth. There is also evidence from related studies that under future climate change conditions, G. biloba’s high-suitability zone will shrink and shift north [60]. Like many tree species, the suitability of Northern China’s habitat will benefit from climate change [61,62]. Despite the relatively limited distribution of G. biloba in Xinjiang at the present time, the genus is divided into moderately and marginally adapted regions of G. biloba; in the future, however, areas of moderately and highly suitable areas of G. biloba will be distributed in the northwest region of Xinjing and the river valley. In some parts of Jilin and Heilongjiang Province, climate warming will make G. biloba suitable for growing. Most suitable areas of G. biloba are located on the second and third steps in China, with elevations below 2000 m. Given the background of global warming, suitable new areas of G. biloba are also predominantly located on plains, hills and basins and close to the river estuary, and there is no obvious movement to higher altitudes.
Furthermore, the northward migration of potential suitable areas means that in all eight future scenarios, potential suitable areas in the southern part of modern G. biloba will be lost to a greater or lesser extent, especially in Sichuan, Chongqing and Guangdong Provinces, and the southwestern mountain has a concentrated area of distribution of old G. biloba trees. Therefore, there is an urgent need to study the resistance of G. biloba. At the same time, it is predicted that moderate warming (2050s-SSP126/245/370) will have a negative impact on the distribution of G. biloba, but in the extreme case (2050s-SSP585), the extent of suitable G. biloba will increase, and by the end of this century, the suitable area for G. biloba will be greater than the modern area. In related studies, the distribution of G. biloba has been shown to be the result of the global effects of many factors. As well as factors, such as temperature and precipitation, which may affect the spatial distribution of the species, factors, such as associated species, soil pollution and species diffusion, may constrain the potential range of the species to some degree. Future studies may find that increasing the aforementioned variables improves prediction accuracy [51].
4.4. Carbon Sequestration and Carbon Sink Value of G. biloba
Some studies have found that older trees have longer carbon sequestration times and, therefore, have a greater effect on the mitigation of climate change [33]. When complex urban space is limited, the selection of tree species with high carbon sequestration capacity is one of the important strategies for the Chinese government to deal with climate change and improve the capacity of urban ecosystem services. As shown in Figure 9, G. biloba is an ancient relict plant, and its carbon sequestration ability changes with changes in its potentially suitable area. Areas of moderate and high potential suitability for G. biloba, including Sichuan, Chongqing, southern Jiangsu, the Pearl River Delta and Zhejiang, have been shown to have high carbon sequestration value. We conclude that these areas are not only areas reserved for wild populations of G. biloba but are also active areas for economic activities and the carbon sink trade in China. And, in reality, much of the highly suitable areas for G. biloba coincide with dense human populations and land set aside for food production.
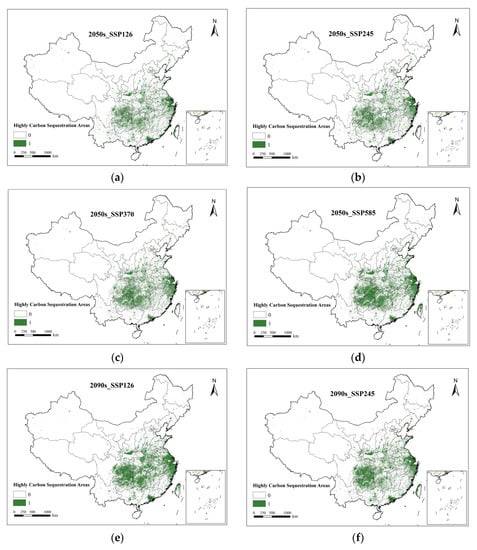
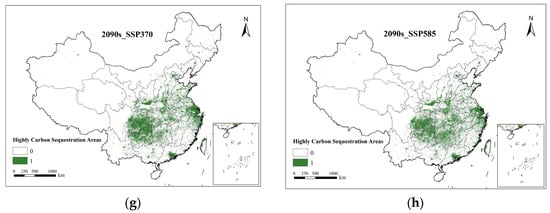
Figure 9.
Distribution of carbon sequestration in different periods. The 1 and 0 represent the existing carbon sequestration and no carbon sequestration, respectively. (a) is the 2050s-SSP126 scenario, (b) is the 2050s-SSP245 scenario, (c) is the 2050s-SSP370 scenario, (d) is the 2050s-SSP585 scenario, (e) is the 2090s-SSP126 scenario, (f) is the 2090s-SSP245 scenario, (g) is the 2090s-SSP370 scenario and (h) is the 2090s-SSP585 scenario.
Given the good baseline conditions, such as farmland water conservation and the tradition of long-term organic fertilizer application, if an improved agroforestry management system can be established, the productivity of G. biloba in this region will be enhanced to some degree, and the carbon density of G. biloba will be increased at a regional scale [63].
In comparison to developed nations, such as European nations and the United States, China’s carbon sink market is still in the early stages of exploration, if the market mechanism for trading carbon sinks is relatively imperfect. Academics have carried out a series of explorations and analyses of the value realization pathway of forestry carbon sinks. Guan Zhigi et al. [64] developed a carbon-inclusive trading platform with blockchain as an idea, calculated the amount of carbon sequestration from related ecosystems and assessed the feasibility of project development, providing a benchmark and direction for realizing the ecological value of Baiyangdian in the Xiong’an New Area. Cao Xianlei et al. [65] predicted the value of the carbon sink and the ecological value that could be realized in the later period on the basis of real option theory and afforestation projects of the relevant units, and this approach was conducive to promoting the development of forestry carbon-sink projects and provided a point of reference for the promotion of relevant policy formulation and improved market mechanisms.
The results of the calculation of carbon sequestration and carbon sink values indicate that increasing the potential suitable area of G. biloba increased its carbon sequestration and carbon sink value at the same time. G. biloba has a high value as a carbon sink and high potential for development, which may solve the problem of China’s insufficient supply of carbon sink projects to some degree. Reasonable and efficient selection of ancient trees such as G. biloba for use as urban greening species is conducive to the transformation of the ecological value of forestry into an economic one, to bring more economic revenue to China’s natural resources, forestry and other related departments and institutions, to relieve financial pressure for ecological compensation and, thus, to achieve the national “carbon peaking and carbon neutrality” goal.
4.5. Important Value and Future Outlooks about G. biloba in Urban Ecosystems
Distinct from natural forest ecosystems, urban forest green spaces tend to be small in area, consisting primarily of small, artificial green communities, sparsely planted single plants or sparse forested communities [66]. People have now increasingly recognized that through the development and construction of landscape planning, the establishment of the forest garden green space system in the city is the first choice for improvements in the ecological environment of the city.
Studies have shown that broad-leaved deciduous trees have higher carbon storage than broad-leaved evergreen trees and coniferous trees [67]. The carbon content of Ginkgo is at a higher level than that of common broad-leaved deciduous tree species, such as Quercus, Fagus, Poplus, Betula and so on [68]. In addition, the natural range of G. biloba is mainly the eastern monsoon zone, which belongs to the urban gathering zone in China. G. biloba, which has aesthetic value as well as carbon sequestration value, and has overlap with its natural habitat, is an excellent choice for greening trees in most of Eastern China’s cities. In many cities, such as Beijing, Xi’an, Nanjing and Chongqing, G. biloba has been widely planted as one of the important street trees in urban areas.
Thus, based on obtaining the present and future potential suitable areas of G. biloba, its high carbon sequestration capacity and distribution of carbon sink values were explored and rationally allocated green space through green carbon sink grid connectivity and coupling, the vertical extension of green ecological space and the intelligent guidance and control of green space function services so as to enhance the capacity of green space to sequester carbon, strengthening the link between urban green space and other functional urban spaces, opening up the green connecting corridor, realizing the positive interplay between urban green space and other land uses and building the green network of the urban ecosystem. Through the optimization of urban green tree species allocation, control of vegetation planting density and selection of vegetation with a high carbon sink under suitable conditions, there is scope to improve the carbon density and carbon sequestration capacity of urban greens, the high carbon sink value of the urban ecosystem can be realized and the ecological benefits, carbon sink benefits and urban ecosystem service functions of urban green space can be fully utilized.
5. Conclusions
Achieving the goal of “carbon peaking and carbon neutrality” means promoting high-quality development through environmental protection, and the urban ecosystem is an important carrier for achieving the “two-carbon” goal. The potential distribution of G. biloba under eight current and future scenarios was predicted on the basis of the distribution of G. biloba and a variety of environmental factors. The key factors affecting the distribution of G. biloba were hf and Bio2. Currently, moderate–high-suitability areas are mostly distributed in most of the eastern monsoon regions of China, with the exception of Northeast China, and future climate warming is likely to cause suitable areas to migrate northwards. The carbon sequestration capacity and carbon sink value of G. biloba are high. Under the different environmental conditions of the present and future periods, the total amount of carbon sequestration of G. biloba per year was 1.60 × 10⁶-t, 1.50 × 10⁶-t and 1.57 × 10⁶-t, respectively. The total value of carbon sequestration was 5.63 × 10⁷ CNY, 5.28 × 10⁷ CNY, and 5.53 × 10⁷ CNY, indicating that it is one of the dominant tree species that is suited to urban ecosystems. This provides some benchmark for resource use of urban green tree species and a method for exploring the realization of carbon sink values.
Author Contributions
Conceptualization, X.Z. and F.M.; methodology, X.Z.; software, X.Z. and P.H.; validation, L.G. and P.H.; investigation, X.Z. and P.H.; data curation, X.Z.; writing—original draft preparation, X.Z.; writing—review and editing, X.Z.; visualization, X.Z. and L.G.; supervision, P.H.; projection administration, F.M. All authors have read and agreed to the published version of the manuscript.
Funding
This work was funded by the National Natural Science Foundation of China (Grant No. 81072999).
Institutional Review Board Statement
Not applicable.
Informed Consent Statement
Not applicable.
Data Availability Statement
Not applicable.
Acknowledgments
We wish to express our gratitude to the reviewers of this paper. They provided useful feedback on an earlier version of the manuscript.
Conflicts of Interest
The authors declare no conflict of interest.
References
- Tiffney, B.H. The eocene north atlantic land bridge:its importance in tertiary and modern phytogeography of the northern Hemisphere. J. Arnold Arbor. 1985, 66, 243–273. [Google Scholar] [CrossRef]
- Tiffney, B.H. Perspectives on the origin of the floristic similarity between eastern Asia and eastern North America. J. Arnold Arbor. 1985, 66, 73–94. [Google Scholar] [CrossRef]
- Liu, J. Historical Distribution and Migration Trend of Relict Plant Ginkgo biloba Based on Random Forest Model; Shaanxi Normal University: Xian, China, 2019. [Google Scholar] [CrossRef]
- Qiu, Y.X.; Lu, Q.X.; Zhang, Y.H.; Cao, Y.N. Phylogeography of Tertiary relict plants in East Asia: Current situation and trend. Biodiv. Sci. 2017, 25, 136–146. [Google Scholar] [CrossRef]
- Fischer, T.C.; Meller, B.; Kustatscher, E.; Butzmann, R. Permian ginkgophyte fossils from the Dolomites resemble extant O-ha-tsuki aberrant leaf-like fructifications of Ginkgo biloba L. BMC Evol. Biol. 2010, 10, 337. [Google Scholar] [CrossRef] [PubMed]
- Uemura, K. Cenozoic history of Ginkgo in East Asia. In Ginkgo Biloba a Global Treasure; Springer: Tokyo, Japan, 1997. [Google Scholar]
- Xu, Y. Prediction of Suitable Areas of Relict Plants Ginkgo biloba L. and Davidia Involucrata Based on Maximum Entropy Model; North China Electric Power University: Beijing, China, 2019. [Google Scholar] [CrossRef]
- Zhou, J.Y. Composition Analysis of Ginkgo biloba L. Leaf Extract and Regulation of Its Active Components on Carbon METABOLISM in Lung Cancer; The Central University for Nationalities: Beijing, China, 2022. [Google Scholar] [CrossRef]
- Liu, X.J.; Xing, S.Y.; Wu, Q.G.; Sun, L.M.; Wang, X. Resources and growth characteristics of ancient Ginkgo biloba L. trees in Jiangxi Province. J. Southwest For. Univ. 2015, 35, 58–62. [Google Scholar]
- Zheng, N. Status quo, problems and countermeasures of Ginkgo biloba L. resources development and utilization. Hunan Chin. Med. J. 2014, 30, 159–160. [Google Scholar] [CrossRef]
- Gong, W. Molecular Phylogeography of Relict Plant Ginkgo biloba L.; Zhejiang University: Hangzhou, China, 2007. [Google Scholar]
- Fermino, B.L.; Milanez, M.C.; Freitas, B.; Nunes da Silva, W.; Pereira, R.; Rocha, J.; Bonini, J. Ginkgo biloba L.: Phytochemical components and antioxidant activity. Afr. J. Pharm. Pharmacol. 2015, 9, 950–955. [Google Scholar]
- Singh, B.; Kaur, P.; Singh, R.D.; Ahuja, P.S. Biology and chemistry of Ginkgo biloba L. Fitoterapia 2008, 79, 401–418. [Google Scholar] [CrossRef]
- Yan, X.L. Genetic Structure and Phylogeography of Ginkgo biloba L. Population Based on cpDNA Haplotype and SSR Analysis; Zhejiang University: Hangzhou, China, 2010. [Google Scholar]
- Xie, C.X. Small Scale Genetic Structure and Gene Flow of Ginkgo biloba L. “Sanctuary” Population in Tianmu Mountain; Zhejiang University: Hangzhou, China, 2014. [Google Scholar]
- Liu, H.B.; Mu, M.; Mu, C.C.; Wu, X.D. Interpretation of IPCC Sixth Assessment Report: Observations and Projections of Permafrost Carbon in the Northern Hemisphere. Glacial Permafrost. pp. 1–9. Available online: http://kns.cnki.net/kcms/detail/62.1072.p.20230326.1447.002.html (accessed on 18 May 2023).
- Ding, Y.H.; Wang, H.J. New understanding of climate change in China in the last century. Chin. Sci. Bull. 2016, 61, 1029–1041. [Google Scholar] [CrossRef]
- IPCC. Climate Change 2013: The Physical Science Basis, Contribution of Working I to the Sixth Assessment Report of the Intergovernmental Panel on Climate Change; Cambridge University Press: Cambridge, UK, 2020. [Google Scholar]
- Yao, Y.B.; Wang, Y.R.; Li, Y.H.; Zhang, X.Y. Climate warming and drying in Loess Plateau of China and its impact on ecological environment. Resour. Sci. 2005, 27, 146–152. [Google Scholar]
- Kozak, K.H.; Graham, C.H.; Wiens, J.J. Integrating GIS-based environmental data into evolutionary biology. Front. Zool. 2004, 1, 4. [Google Scholar] [CrossRef]
- Li, Y.; Gao, G.; Song, L.C. New understanding of climate change risk and risk management in the Fifth Assessment Report of IPCC. Clim. Chang. Res. 2014, 10, 260–267. [Google Scholar]
- Friedlingstein, P.; O’sullivan, M.; Jones, M.W.; Andrew, R.M.; Hauck, J.; Olsen, A.; Peters, G.P.; Peters, W.; Pongratz, J.; Sitch, S.; et al. Global carbon budget 2020. Earth Syst. Sci. Data 2020, 12, 3269–3340. [Google Scholar] [CrossRef]
- Chen, J.D.; Gao, M.; Cheng, S.L.; Hou, W.X.; Song, M.L.; Liu, X.; Liu, Y.; Shan, Y.L. County-level CO2 emissions and sequestration in China 1997–2017. Sci. Data 2020, 7, 391. [Google Scholar] [CrossRef]
- Ministry of Housing and Urban-Rural Development of the People’s Republic of China. 2020 Statistical Yearbook of Urban-Rural Construction (2021-10-12); Ministry of Housing and Urban-Rural Development of the People’s Republic of China: Beijing, China, 2021.
- McPherson, E.G.; Xiao, Q.; Aguaron, E. A new approach to quantify and map carbon stored, sequestered and emissions avoided by urban forests. Landsc. Urban Plan. 2013, 120, 70–84. [Google Scholar] [CrossRef]
- Yang, Y.; Shi, Y.; Sun, W.; Chang, J.; Zhu, J.; Chen, L.; Wang, X.; Guo, Y.; Zhang, H.; Yu, L.; et al. Carbon source sinks and their contribution to carbon neutrality in terrestrial ecosystems in China and the world. Sci. China Life Sci. 2002, 52, 534–574. [Google Scholar]
- Qiu, Z.; Feng, Z.; Song, Y.; Li, M.; Zhang, P. Carbon sequestration potential of forest vegetation in China from 2003 to 2050: Predicting forest vegetation growth based on climate and the environment. J. Clean. Prod. 2020, 252, 119715. [Google Scholar] [CrossRef]
- Wang, B.; Niu, X.; Song, Q.F. Analysis of carbon neutralization capacity of forests in China based on full-diameter carbon sink monitoring. Environ. Prot. 2021, 49, 30–34. [Google Scholar] [CrossRef]
- Zhang, L.M.; Yu, G.R.; Sun, X.M.; Wen, X.F.; Ren, C.Y.; Song, X.; Liu, Y.F.; Guan, D.X.; Yan, J.H.; Zhang, Y.P. Seasonal changes of carbon budget in typical ecosystems of forest transect in eastern China. Sci. China Ser. D Earth Sci. 2006, 36, 45–59. [Google Scholar]
- Cui, X.W.; Ding, C.H.; Wang, R.Q.; Wang, F.H. Carbon sink function and value of natural protected areas in Shandong under the background of “dual carbon”. J. Shandong Univ. 2023, 58, 10. [Google Scholar]
- Chen, Z.; Yu, G.; Ge, J.; Sun, X.; Hirano, T.; Saigusa, N.; Wang, Q.; Zhu, X.; Zhang, Y.; Zhang, J.; et al. Temperature and precipitation control of the spatial variation of terrestrial ecosystem carbon exchange in the Asian region. Agric. For. Meteorol. 2013, 182, 266–276. [Google Scholar] [CrossRef]
- Liu, Y.C.; Gao, X.L.; Fu, C.; Yu, G.; Liu, Z. Estimation of carbon sequestration potential of forest biomass in China based on forest resource inventory data. Acta Ecol. Sin. 2019, 39, 4002–4010. [Google Scholar]
- Guo, S.Y.; Wang, K.M.; Peng, L.C.; Yan, H.; Zhou, N. Selection of carbon sink tree species based on natural distribution of ancient trees. Hubei For. Sci. Technol. 2020, 49, 37–41. [Google Scholar]
- Zhang, D.; Zhao, Y.; Wu, J. Assessment of carbon balance attribution and carbon storage potential in China’s terrestrial ecosystem. Resour. Conserv. Recycl. 2023, 189, 106748. [Google Scholar] [CrossRef]
- Dza, B.; Xz, B.; Cz, B. Assessment of future potential carbon sequestration and water consumption in the construction area of the Three-North Shelterbelt Programme in China. Agric. For. Meteorol. 2021, 303, 108377. [Google Scholar]
- Austin, M.P. Spatial prediction of species distribution: An interface between ecological theory and statistical modeling. Ecol. Model. 2002, 157, 101–118. [Google Scholar] [CrossRef]
- Soberón, J.; Peterson, A.T. Interpretation of models of fundamental ecological niches and species’s distribtional areas. Biodivers. Inform. 2005, 2, 1–10. [Google Scholar] [CrossRef]
- Qiao, H.; Hu, J.; Huang, J. Theoretical basis, future directions, and challenges for ecological niche models. Sci. Sin. Vitae 2013, 43, 915–927. [Google Scholar] [CrossRef]
- Lu, C.Y.; Gu, W.; Dai, A.H.; Wei, H.Y. Assessing habitat suitability based on geographic information system (GIS) and fuzzy: A case study of Schisandra sphenanthera Rehd. et Wils. in Qinling Mountains, China. Ecol. Model. 2012, 242, 105–115. [Google Scholar] [CrossRef]
- Phillips, S.J.; Dudík, M.; Schapire, R.E. A maximum entropy approach to species distribution modeling. In Proceedings of the Twenty-First International Conference on Machine Learning, ACM, Banff, AB, Canada, 4–8 July 2004; p. 83. [Google Scholar]
- Yi, Y.J.; Cheng, X.; Yang, Z.F.; Zhang, S. Maxent modeling for predicting the potential distribution of endangered medicinal plant (H. riparia Lour) in Yunnan, China. Ecol. Eng. 2016, 92, 260–269. [Google Scholar] [CrossRef]
- Editorial Committee of Flora of China, Chinese Academy of Sciences. Flora of China; Science Press: Beijing, China, 1978; Volume 7, p. 18. [Google Scholar]
- Hijmans, R.J.; Cameron, S.E.; Parra, J.L.; Jones, P.G.; Jarvis, A. Very high resolution interpolated climate surfaces for global land areas. Climatol 2005, 25, 1965–1978. [Google Scholar] [CrossRef]
- Wu, T.W.; Lu, Y.X.; Fang, Y.J.; Xin, X.G.; Li, L.; Li, W.P.; Jie, W.H.; Zhang, J.; Liu, Y.M.; Zhang, L.; et al. The Beijing climate center climate system model(BCC-CSM): The main progress from CMIP5 to CMIP6. Geosci. Model Dev. 2019, 12, 1573–1600. [Google Scholar] [CrossRef]
- Venter, O.; Sanderson, E.W.; Magrach, A.; Allan, J.R.; Beher, J.; Jones, K.R.; Possingham, H.P.; Laurance, W.F.; Wood, P.; Fekete, B.M.; et al. Sixteen Years of Change in the Global Terrestrial Human Footprint and Implications for Biodiversity Conservation. Nat. Commun. 2016, 7, 12558. [Google Scholar] [CrossRef]
- Center for International Earth Science Information Network-CIESIN-Columbia University. Gridded Population of the World, Version 4 (GPWv4): Population Density, Revision 11; Center for International Earth Science Information Network-CIESIN-Columbia University: New York, NY, USA, 2018. [Google Scholar]
- Kennedy, C.M.; Oakleaf, J.R.; Theobald, D.M.; Baruch-Mordo, S.; Kiesecker, J. Global Human Modification of Terrestrial Systems; NASA Socioeconomic Data and Applications Center: Palisades, NY, USA, 2020.
- Graham, M.H. Confronting multicollinearity in ecological multiple regression. Ecology 2003, 84, 2809–2815. [Google Scholar] [CrossRef]
- Phillips, S.J.; Anderson, R.P.; Schapire, R.E. Maximum entropy modeling of species geographic distributions. Ecol. Model 2006, 190, 231–259. [Google Scholar] [CrossRef]
- Zhao, Z.Y.; Xiao, N.W.; Shen, M.; Li, J. Comparison between optimized MaxEnt and random forest modeling in predicting potential distribution: A case study with Quasipaa boulengeri in China. Sci Total Environ. 2022, 842, 156867. [Google Scholar] [CrossRef]
- Qiu, H.J.; Sun, J.J.; Xu, D.; Jiao, J.J.; Xue, M.; Yuan, W.G.; Shen, A.H.; Jiang, B.; Li, S. Distribution dynamics of red bean tree under different climate change scenarios since the last glacial maximum. Acta Ecol. Sin. 2020, 40, 3016–3026. [Google Scholar]
- Zhang, Y.B.; Liu, Y.L.; Qin, H.; Meng, Q.X. Spatial migration prediction of suitable distribution area of samara oleifera in Shanxi Province under climate change. Chin. J. Appl. Ecol. 2019, 30, 496–502. [Google Scholar]
- Wan, Q. Forest carbon storage analysis at county level based on second-class survey data of forest resources. For. Investig. Des. 2015, 60–62. [Google Scholar]
- Yang, C.J.; Yang, F.; Mei, H.; Liu, J.S.; Dai, Q.S. Methods for estimating regional forest carbon storage. South-Central For. Surv. Plan. 2012, 31, 62–66. [Google Scholar]
- State Forestry Administration. LY/T1721-2008 Guide for Monitoring Carbon Sinks in Afforestation Projects; Standards Press of China: Beijing, China, 2015. [Google Scholar]
- Gong, X.Q. GuanCenShan forest forestry carbon sequestration ability and the fair value to explore. Mod. Gard. 2022, 45, 156–157+160. [Google Scholar]
- Rong, Z.L.; Zhang, C.Y.; Liu, J.J.; Gao, Y.F.; Zhang, F.; Guo, Z.X.; Mao, Y.H.; Wang, L. Modeling the effect of climate change on the potential distribution of Qinghai Spruce (Picea crassifolia Kom.) in Qilian mountains. Forests 2019, 10, 62. [Google Scholar] [CrossRef]
- Rong, Z.L. Effects of Climate Change on the Distribution of Dominant Species and Vegetation Pattern in Qilian Mountains; Lanzhou University: Lanzhou, China, 2019. [Google Scholar]
- Wu, S.; Zhang, Z.; Wang, L.; Xu, X. Carbon storage of different community types in Hefei Ring Park. South. Agric. 2010, 4, 45. [Google Scholar]
- Guo, Y. Study on Environmental Response Mechanism of Distribution Prediction and Phenotypic Traits of Ginkgo Biloba under Climate Change; Nanjing Forestry University: Nanjing, China, 2021. [Google Scholar] [CrossRef]
- Boisvert-Marsh, L.; Perie, C.; Blois, S.D. Shifting with climate? Evidence for recent changes in tree species distribution at high latitudes. Ecosphere 2016, 5, 83. [Google Scholar] [CrossRef]
- Berger, S.; Söhlke, G.; Walther, G.R.; Pott, R. Bioclimatic limits and range shifts of cold-hardy evergreen broad-leaved species at their northern distributional limit in Europe. Phytocoenologia 2007, 37, 523–539. [Google Scholar] [CrossRef]
- Bebber, D.; Gurr, S. Biotic interactions and climate in species distribution modelling. bioRxiv 2019. bioRxiv:520320. [Google Scholar]
- Guan, Z.G.; Tian, X.B.; Kong, Y.H. Research on the realization path of Ecological value of Xiongan New Area based on blockchain technology. J. Hebei Univ. Econ. Bus. 2019, 40, 77–86. [Google Scholar]
- Cao, X.L.; Jia, X.R.; Shan, Y.J. Carbon sink value evaluation model and application of carbon sink afforestation project based on real option. J. Cent. South Univ. For. Technol. 2019, 41, 187–196. [Google Scholar]
- Barve, N.; Barve, V.; Jimenez-Valverde, A.; Noriega, A.L.; Maher, S.P.; Peterson, A.T.; Sober On, J.; Villalobos, F. The crucial role of the accessible area in ecological niche modeling and species distribution modeling. Ecol. Model. 2011, 222, 1810–1819. [Google Scholar] [CrossRef]
- Yang, X.; Xu, D.; Jin, W. Preliminary Study on the construction of Shanghai Urban forest ecological network system Engineering System. Coll. Shanghai Agric. Univ. 2000, 18, 132–137. [Google Scholar]
- Wang, L. Carbon Sequestration Capacity of Common Garden Tree Species and Communities in the Main Urban Area of Chongqing; Southwest University: Chongqing, China, 2013. [Google Scholar]
Disclaimer/Publisher’s Note: The statements, opinions and data contained in all publications are solely those of the individual author(s) and contributor(s) and not of MDPI and/or the editor(s). MDPI and/or the editor(s) disclaim responsibility for any injury to people or property resulting from any ideas, methods, instructions or products referred to in the content. |
© 2023 by the authors. Licensee MDPI, Basel, Switzerland. This article is an open access article distributed under the terms and conditions of the Creative Commons Attribution (CC BY) license (https://creativecommons.org/licenses/by/4.0/).