Abstract
Urban forests play a crucial role in both emitting and absorbing atmospheric pollutants. Understanding the ecological processes of biogenic volatile organic compounds (BVOCs) and secondary organic aerosols (SOAs) and their interactions in urban forests can help to assess how they influence air quality. Additionally, exploring the adaptation and feedback mechanisms between urban forests and their surrounding environments can identify new pollutants and potential risks in urban forests. However, the relationship between BVOC emissions and SOA formation is complex due to the influence of meteorological conditions, photochemical reactions, and other factors. This complexity makes it challenging to accurately describe this relationship. In this study, we used time-of-flight mass spectrometry and aerosol particle size spectrometry to monitor concentrations of BVOCs and particulate matter with a diameter less than 1 µm (PM1; representing SOAs) at a frequency of 10–12 times per min in an urban forest near Shanghai. We then analyzed the temporal changes in concentrations of BVOCs, SOAs, and other chemical pollutants in different periods of the day by using subsequence clustering and causal inference methods. The results showed that after using this method for diurnal segmentation, PM1 prediction accuracy was improved by 26.77%–47.51%, and the interaction rules of BVOCs and SOAs had sequential interaction characteristics. During the day, BVOCs are an important source of SOAs and have a negative feedback relationship with O3. From night to early morning, BVOCs have a positive, balanced relationship with O3, SOAs are affected by wind speed or deposition, BVOCs have no obvious relationship with O3, and SOAs are affected by temperature or humidity. This study is the first to apply Toeplitz inverse covariance-based clustering and causal inference methods for the high-frequency monitoring of BVOCs and SOAs, revealing the temporal effects and characteristics of BVOCs and SOAs and providing a scientific basis and new methods for understanding the dynamic effects of urban forest communities on the environment.
1. Introduction
Forests play a crucial role in urban composite ecosystems. They store a large amount of carbon and provide essential ecosystem services, such as climate regulation, water source protection, and biodiversity maintenance [1]. In recent years, studies have explored the dust retention [2,3], pollution adsorption and regulation [4,5], and urban air purification [4,5] abilities of urban forests.
Urban forests can purify and regulate pollutants, regulate climate, and protect soil and water [6]. Urban forests also emit a large amount of biogenic volatile organic compounds (BVOCs), which interact with anthropogenic pollutants [7] and affect air quality [8]. BVOCs emitted from forests react with oxidants in the atmosphere, resulting in the formation of various intermediate and final products, such as formaldehyde, acetic acid, and formic acid. These products can further participate in photochemical reactions that lead to the formation of ozone and secondary organic aerosols (SOAs) [9]. Ozone is a powerful oxidant that can damage both plant and human respiratory systems, which increases the risk of respiratory and cardiopulmonary diseases [10,11]. SOAs are fine particulates that scatter and absorb solar radiation and affect cloud formation, with effects on the radiation balance of Earth [12]. SOAs can enter the human respiratory and circulatory systems, causing lung inflammation and cardiovascular diseases [13,14]. Gaining deeper insights into how urban forest BVOCs interact with SOAs is crucial for assessing the effects of urban forests on air quality and climate change and the adaptation and response mechanisms of urban forests to the surrounding environment. It also helps in the discovery of new pollutants and potential risks in urban forests.
Urban vegetation exchanges materials and energy with the surrounding atmosphere [15]. This interaction has complex effects on pollutants, influencing the rate and direction of photochemical reactions for purification in urban forests [7]. At the macro level, urban vegetation can remove particulate matter (PM) and gaseous pollutants from the atmosphere through processes such as dust retention, adsorption, absorption, and metabolism [16]. Additionally, it affects the chemical composition of the atmosphere by emitting BVOCs [17]. The relationship between urban vegetation and atmospheric pollution is influenced by a range of factors, including vegetation type, functional traits, spatial distribution, seasonal changes, meteorological conditions, and pollution levels [18], which are difficult to determine through monitoring. At the micro level, emission amounts and BVOC types are influenced by various factors such as vegetation type, environmental factors, and human interference [17]. Similarly, the effect of urban vegetation on SOA formation is influenced by factors such as vegetation species, functional traits, seasonal changes, and light, temperature, and humidity conditions [19]. SOA formation involves complex atmospheric chemical reactions and has spatiotemporal variability [20].
Conventional ecological station observation methods can monitor pollutant concentrations, but not specific chemical reactions [21]. Therefore, short-term atmospheric observations of complex and variable forest ecological processes do not provide sufficient information to represent real chemical reactions. Additionally, statistical analyses can be influenced by nonstationarity and confounders [22,23]. To address these issues, a method is needed for obtaining short-term atmospheric observations that can identify common system characteristics over time. We believe that BVOC and SOA formation processes in urban forests have sequential interaction characteristics. High-frequency monitoring may reveal hidden states, because the emission and generation of BVOCs and SOAs are affected by factors such as sunlight, temperature, humidity, and human activities [24]. During specific periods with similar ecological processes, concentration changes exhibit distinct characteristics under high-frequency monitoring.
Analysis of high-frequency monitoring data can better demonstrate the sequential interaction between BVOCs and SOAs [24]. High-frequency monitoring data are accurate, reveal trends, and enable the extraction of features from different time intervals and the division of time subsequences using various data processing and machine learning methods. Toeplitz inverse covariance-based clustering (TICC) is effective for achieving temporal clustering of multivariate time series [25]. TICC has been successfully used for the analysis of atmospheric observations for identifying hidden temporal states between pollutants [25]. In urban forests, pollutants exhibit complex statistical characteristics, such as concentration changes that have causal relationships [26]. Causal discovery algorithms have emerged as important tools for feature selection for atmospheric observation data, helping to identify irrelevant and key factors [27]. By screening features and using other data fitting tools, higher prediction accuracy [28] and interpretability can be achieved. This approach enables the effective integration of high-frequency monitoring data for evaluating the ecological laws governing BVOC and SOA emissions in urban forests.
Therefore, this study collected high-frequency monitoring data and used TICC combined with causal inference methods to solve the key problems of variability and confounding in high-frequency monitoring in ecology, providing a new scheme for expanding high-frequency data research in ecology and revealing the ecological sequential interaction characteristics of SOAs in urban forest communities. Subsequence clustering was performed using TICC. Features were selected using conditional Granger causality [29], convergent cross mapping [30], partial correlation [31], multivariate transfer entropy [27], and the PCMCI algorithm [32]. Prediction tests were performed using linear regression [33], support vector machine [34], K-nearest neighbor regression [35], AdaBoost [36], and multilayer perceptron [37]. This paper mainly answers the following two questions:
- (a)
- How can BVOC and SOA emissions be clustered using TICC and causal inference methods?
- (b)
- Diurnal variations of concentrations of various photochemical pollutants in urban forests were analyzed. What are the ecological sequential interaction characteristics of BVOCs and SOAs in urban forests?
2. Methodology
2.1. Research Location
This study was conducted at the Pudong Jinhai Station (31.30278° N, 121.64167° E), which is a part of the Shanghai Urban Ecosystem National Observation and Research Station. The location and a photo of the observation station are shown in Figure 1. The observation point itself is located within a forest canopy at approximately 6–9 m above ground level. Observations were conducted on 5–6 August, 29–30 September, and 20–21 October, 2022. Table 1 demonstrates the general parameters of vegetation at the observation sites.
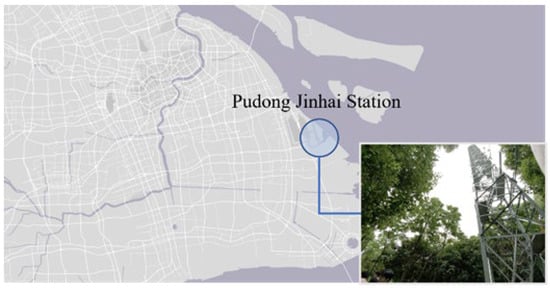
Figure 1.
Location of Pudong Jinhai Station.

Table 1.
Parameters of vegetation at the observation station.
The Pudong Jinhai Station is located in the Jinhai Wetland Park, a natural habitat conservation area in Pudong New Area, Shanghai. With an area of approximately 75 hm2, this forest community represents a typical example of artificial forest communities often found in large cities. At the observation point, the dominant tree species are evergreen broad-leaved vegetation, such as Magnolia grandiflora, Cinnamomum camphora, and Ligustrum lucidum, which are common in subtropical regions. According to the study by Lyu [38] on the release rate of BVOCs—marked by isoprene, from 10 common tree species in Shanghai—the release rate of the main tree species at the monitoring points in Shanghai from summer to autumn ranges between 0.50 and 14.94 μg·g−1·h−1. The forest community structure primarily consists of trees, shrubs, and grass. The park is surrounded by major roads, schools, and residential and commercial buildings and is in an area with a high population density.
2.2. Data Collection
This study used a proton transfer reaction time-of-flight mass spectrometer (4000, Beijing Sdl Technology, Beijing, China) to measure isoprene concentrations in the forest community. This instrument has high sensitivity and does not require pretreatment. It can analyze samples at the ppb level within one minute by using membrane concentration, enabling the real-time in situ measurement of isoprene in the environment. Due to its accuracy, the experimental period is greatly shortened.
SOA monitoring was conducted using a particle size spectrometer (11-R, GRIMM, Hamburg, Germany). This device uses the beta-ray method to measure the mass concentration and particle number in the environment. It displays information on particle size distribution across 31 channels ranging from 0.25 to 32 μm every 6 s. The first 16 channels are reserved for monitoring PM with a diameter of less than 1 µm (PM1) and 2.5 µm (PM2.5).
The monitoring of isoprene and aerosols requires the repeated installation and debugging of on-site monitoring equipment. The devices are mounted at a height of 6–9 m on an observation tower that matches the height of the tree canopy. Considering the influence of the phenological conditions of the vegetation, monitoring was conducted once a month for 24 h each time. Monitoring was conducted three times at each observation station.
To obtain the time-series data for each matching index, the monitoring duration and data acquisition frequency of isoprene and aerosols should be consistent across devices at the observation point (one data per minute). During the measurement process, the time-of-flight mass spectrometer collected one data point every 5 s, and the particle size spectrometer collected one data point every 6 s. The total amount of observation data collected in 24 h was more than 11,000. The parameters of the experimental equipment are shown in Table 2.

Table 2.
Parameters of the monitoring equipment.
Terpenoids, such as isoprene and butadiene, play a significant role in SOA formation in urban forests [39,40]. Additionally, SO2, O3, and NOs play important roles in the photochemical process leading to SOA formation [9]. In the present study, environmental indicators of pollutants were selected after careful screening. These include ground-level net radiation (GNR), ground-level temperature (temperature), ground-level humidity (humidity), and PM2.5, PM1, O3, NO, SO2, NO2, isoprene, butene, pentene, and 1,3-butadiene concentrations.
To align the timing of data points, sampling intervals were unified to 7 s using the Pandas software library (version 1.5.3) [41]. The main focus of the analysis was August data. September and October data were used to validate the method.
2.3. Data Analysis Model
TICC defines each cluster as a correlation network or a Markov random field (Figure 2). This approach enables the characterization of interdependence between different observations in the cluster, greatly enhancing the interpretability of the algorithm [25]. Each dataset contains SOA data obtained using the particle size spectrometer, BVOC data obtained using the mass spectrometer, and environmental and other chemical pollutant data from the ecological station. These three types of interrelated and interacting chemical substances constitute high-dimensional time-series data. This study first uses TICC to determine the time intervals with different change characteristics, and further analysis and verification are then performed on this basis.

Figure 2.
Time-invariant structure of multivariate time series obtained by TICC clustering.
For feature selection algorithms, we use methods based on correlation and causal discovery. Partial correlation is a causal test method based on a linear correlation coefficient that eliminates the interference of third-party variables and determines the direct correlation between two variables [31]. Conditional Granger causality is a frequency-domain-based causal test method that eliminates indirect causal effects and determines direct causal chains. Convergent cross mapping [30] is a causal test method based on phase space reconstruction that can analyze nonlinear and nonstationary time-series data. Multivariate transfer entropy is an information-theoretic causal test method [42] that measures information transfer and sharing among multiple variables. The higher the multivariate transfer entropy, the closer the information exchange between two variables. The PCMCI algorithm is a causal test method based on conditional independence testing that is used for high-dimensional, mixed, nonlinear and non-Markovian time-series data [32]. Its basic principle is that if variable Y still has conditional dependence with X after considering all other possible variables affecting X, then Y is considered to have PCMCI causality to X. The PCMCI algorithm reduces the candidate causal set by using time-lagged graphs, and it filters out true causal relationships by using conditional independence tests. For prediction, because only lagged terms can be used to predict the future, the Momentary Conditional Independence (MCI) process is not used; only the PC process is used.
To ensure applicability, we used as many different prediction models as possible. The default parameters of scikit-learn were used for all models [43]. Linear regression (LR), support vector machine (SVM), K-nearest neighbor regression (KNN), regression boosting tree (AdaBoost), and multilayer perceptron (MLP) are commonly used regression models. These models can be used to predict continuous target variables, such as pollutant concentrations in urban forests. The main difference between these models is that they have different assumptions and fitting methods for the data. Linear regression is a regression model based on the least squares method that assumes a linear relationship between the target and feature variables and estimates model parameters by minimizing the sum of squared residuals [33]. Support vector machine is a regression model based on kernel function and maximum margin principles that can map nonlinear and high-dimensional data to a high-dimensional feature space and can estimate model parameters by minimizing the regularized risk function [34]. The support vector machine model has good generalization ability but is sensitive to the choice of kernel function and parameter tuning, and it has high computational complexity. K-nearest neighbor regression is a regression model based on distance measure and voting principles that does not require advance model pretraining. K-nearest neighbor regression predicts target variables according to the similarity between test and training samples [35]. AdaBoost is a regression model based on an additive model and a forward stepwise algorithm that can combine multiple weak learners (such as decision trees) into a single strong learner and update sample and learner weights by minimizing the exponential loss function [36]. The regression boosting tree model has strong fitting ability and can analyze nonlinear and high-dimensional data, but it is prone to overfitting and sensitive to outliers. Multilayer perceptron is a regression model that uses an artificial neural network, and it consists of input, hidden, and output layers. Multilayer perceptron adjusts network weights and biases by using a backpropagation algorithm [37], and it can approximate functions of any complexity and analyze nonlinear and high-dimensional data; however, its training process is slow, and it is easily prone to falling into the local optimum.
We used PM1 as the dependent variable and other variables as independent variables for prediction and feature selection. To account for the effects of potential confounders on pollutant concentrations, we first performed TICC on the data. We then used causal inference methods to identify reasonable dependent variables and used the aforementioned regression models to establish the relationship between pollutant concentrations and various factors. We evaluated the contribution of each factor by using indicators such as the correlation coefficient, significance test, and variable importance. The study focuses on the influence of subsequence segmentation on prediction accuracy and compares the variation and interaction patterns of pollutant concentrations with various factors in different periods.
3. Results and Analysis
Temporal variations in the concentrations of isoprene (representing BVOCs), PM1 (representing SOAs), and O3 (representing other photochemical pollutants) were observed. The common quantity variation relationship among the three compounds was not obvious, and no absolute common relationship between their quantities was observed. These results indicate that the ecological process of BVOCs and SOA interaction has a sequential interaction (Figure 3).
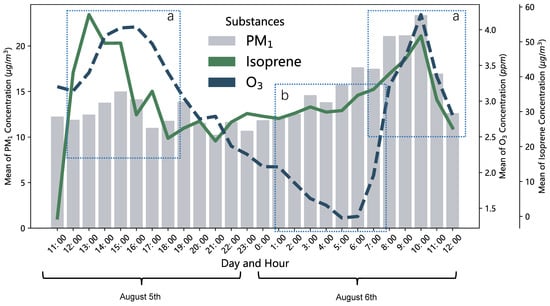
Figure 3.
Hourly average relationship of pollutants. Three substances reach peak simultaneously at point a; however, similar variation trends for O3 and isoprene were not observed at point b. This indicates that different periods have different variation relationships, which are caused by unobserved confounders.
3.1. Results of Feature Selection
Different feature extraction methods provided different results, which indicates that the statistical information of BVOC and SOA ecological processes is complex and diverse. Simple correlation models, such as partial correlation, provided more association relationships, whereas complex causal algorithms, such as multivariate transfer entropy, conditional Granger causality, and the PCMCI algorithm, provided more clear causal relationships (Figure 4). The relationship between different variables and PM1 in different selection methods is shown in Table 3.
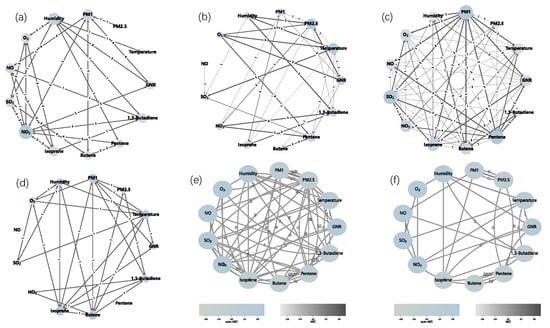
Figure 4.
Feature selection results for (a) partial correlation, (b) conditional Granger causality, (c) multivariate transfer entropy, (d) convergent cross mapping, (e) PCMCI, and (f) PCMCI+.

Table 3.
Relationship between different variables in different methods *.
Sequential clustering was performed using TICC, with the Bayesian information criterion as the main screening indicator (Figure 5). The results showed that when the data were divided into four classes, the Bayesian information criterion was the lowest in most cases, approximately 20,000, which is the most suitable. After segmentation, causal inference was performed on each segment using PCMCI+.
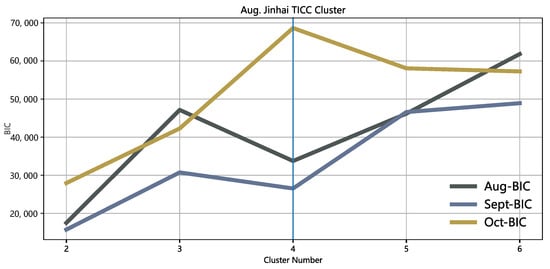
Figure 5.
Selection of number of clusters.
The causal relationship differed greatly in different periods compared with the whole period inference (Figure 6). In subsequence 0, an effect of isoprene generation on PM1 was detected. In subsequences 1, 2, and 3, a mutual feedback relationship between isoprene and O3 was detected. In subsequence 4, a direct mutual relationship between PM1 and O3 was detected. These findings indicate the presence of a certain feedback relationship between BVOCs, SOAs, and other photochemical pollutants.
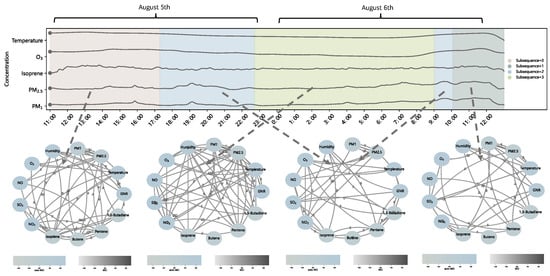
Figure 6.
Results of segmentation analysis using PCMCI+.
3.2. Accuracy of Prediction
In total, 20% of the data were used for testing, and 80% of the data were used for model training. Prediction accuracy was determined using various methods, and normalized root mean square error [44] was used to compare and eliminate the influence of data scale and to facilitate the comparison of different types of data or models. A t test was used to test the different errors between methods (Figure 7). The results showed that the prediction error was significantly reduced after TICC segmentation. The prediction error was reduced the most in linear regression, support vector machine, and multilayer perceptron (Table 4). Normalized root mean square error decreased from 2.771 to 0.614 for linear regression, from 2.183 to 0.713 for support vector machine, and from 1.462 to 0.606 for multilayer perceptron. TICC segmentation could identify more accurate correlation relationships. Compared with no subsequence segmentation, TICC improved accuracy by 26.77%–47.51%.
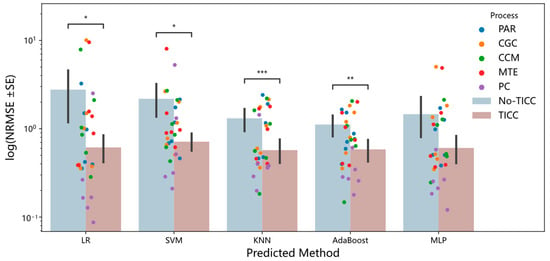
Figure 7.
Prediction errors of prediction methods, where the vertical coordinates are logarithmically treated for normalized root mean square error. Significance level: *** for 0.1%, ** for 1% and * for 5%.

Table 4.
Average values of normalized root mean square error (NRMSE) for different methods. Normalized root mean square error of all methods was clearly significantly reduced after TICC.
The prediction errors of the different feature selection and prediction methods, before and after TICC, are shown in Figure 8. The results show that the prediction error and the standard deviation of the error among different months were lower when using multilayer perceptron with the PC algorithm and that accuracy was higher and more stable after TICC, with a decrease in prediction error from 0.339 to 0.199.
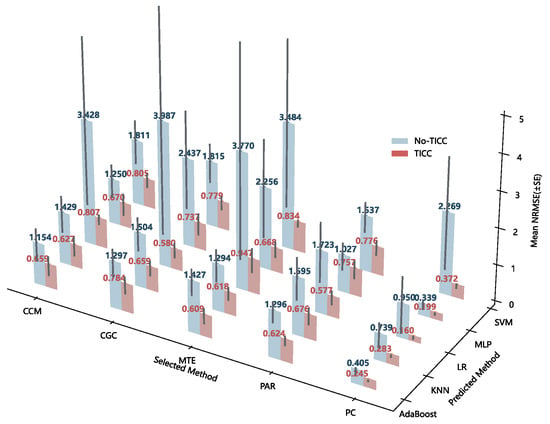
Figure 8.
Prediction errors of different methods. Errors using the PC algorithm in combination with other prediction methods were generally lower than in other methods.
3.3. Sequential Interaction of Air Pollutants in Urban Forests
The results in the previous section indicate that the ecological processes of BVOCs and SOAs have sequential interaction characteristics and should therefore be analyzed after TICC segmentation. The pollutant concentration distribution and variation in each period differed. The numerical characteristics of the pollutants in each period are presented in Table 5.

Table 5.
Statistical parameters of chemical composition and environmental variables after TICC, where All represents the statistical parameters within 24 h of not proceeding and Sub represents the statistical parameters of each subsequence (abbreviated as Sub).
The pollutant concentration distribution and variation in different subsequences were different. BVOCs and SOAs have different ecological characteristics in different periods, and their interaction relationship changes (Figure 9 and Table 4).

Figure 9.
Variation of pollutants in each subsequence.
Subsequence 0 was the period from 11:00 to 17:00, when ground-level net radiation and temperature were the highest, reaching 36.533 W/m2 and 37.081 °C, respectively, and humidity was the lowest (52.524%). The isoprene concentration was also relatively high, at 3.383 ppm, indicating the emission of more BVOCs at this time. BVOCs react with oxidants, such as O3 and NOx, in the atmosphere, producing a series of intermediate and final products, such as formaldehyde, acetic acid, and formic acid. These products can participate in further photochemical reactions, forming ozone and SOAs [9]. Accordingly, PM1 and O3 concentrations in this period were also relatively high, reaching 13.213 μg/m3 and 46.644 ppm, respectively. According to the results of the PCMCI algorithm, an effect of isoprene generation on the PM1 concentration was detected in this period, indicating that BVOCs are an important source of SOAs. Additionally, an effect of NO on SOA generation was detected in this period, indicating that traffic emissions influence photochemical reactions. This finding is consistent with those of studies showing that urban forests are the main source of urban BVOCs, and that BVOCs undergo complex chemical reactions in the atmosphere, affecting air quality [45].
Subsequence 1, which overlaps with subsequence 0, was the period from 10:00 to 12:00. Due to the diurnal pollutant characteristics affected by urban changes (Fares et al., 2016), PM1 concentrations were different in this period than those in subsequence 0, resulting in its separate segmentation. The isoprene concentration was still relatively high in this period (3.491 ppm). The O3 concentration was the highest (47.909 ppm) in this period, indicating that the photochemical reaction is still active. Isoprene and O3 concentrations were negatively correlated, indicating that isoprene is oxidized by O3, consuming O3. PM1 and PM2.5 concentrations significantly increased in this period, reaching the highest values (20.365 μg/m3 and 25.609 μg/m3, respectively); this result indicated that SOA formation exceeded particle diffusion. This may be due to a decrease in temperature, which enables BVOC oxidation products to more easily condense into particles [46]. NO and NO2 concentrations also significantly increased in this period, reaching 1.973 ppm and 19.409 ppm, respectively, which may be due to increased traffic flow or weakened photochemical reactions, releasing NOx.
Subsequence 2 was the periods from 17:00 to 23:00 and from 09:00 to 11:00, which are periods of low temperature and radiation. At night, ground-level net radiation and temperature decreased to low values (7.332 W/m2 and 33.382 °C, respectively), and solar radiation almost disappeared. The isoprene concentration significantly decreased to 2.730 ppm in this period, indicating the decreased contribution of forest vegetation to BVOCs in the atmosphere. The O3 concentration also significantly decreased to 34.903 ppm in this period, indicating that photochemical reactions had stopped. Isoprene and O3 concentrations were positively correlated, indicating a balanced relationship between isoprene and O3. PM1 and PM2.5 concentrations slightly decreased in this period, possibly due to increased wind speed or deposition, causing particle diffusion or deposition. NO and NO2 concentrations slightly decreased in this period, possibly due to reduced traffic flow or dry deposition, causing NOx consumption. In the early morning, temperatures are low, and humidity is high; therefore, BVOCs and photochemical reactions have not yet started, with similar resulting variation trends as that at night.
Subsequence 3 was the low-temperature period from late night to early morning (23:00–09:00), during which ground-level net radiation and temperature were the lowest (3.876 W/m2 and 30.288 °C, respectively). During this period, the isoprene concentration slightly increased, and the concentration in this period was higher than that in subsequence 2, reaching 2.908 ppm; this observation indicates that BVOC generation differs at night, possibly due to changes in plant cell division and elongation overnight [47,48,49]. The O3 concentration was the lowest (9.433 ppm), indicating that the photochemical reaction had stopped. The PM1 concentration slightly increased, indicating that SOA formation was slightly higher than the diffusion and deposition rate. NO and NO2 concentrations slightly increased, possibly due to increased traffic flow or increased O3 consumption.
Pollutant distribution trends were relatively uniform over the whole period. For example, O3 and PM1 concentrations were evenly spread in each concentration range, indicating that although the pollutant levels varied in each period, they remained balanced and stable overall. The observed pattern of one decreasing while the other increasing indicates feedback regulation between SOAs and BVOCs. By using TICC+PCMCI, the complex sequential interaction between BVOCs, SOAs, and other atmospheric pollutants and environmental factors in nature can be interpreted, which can reduce confounding to some extent, better reveal the dynamic characteristics of this relationship, and provide a basis for pollutant control and prediction.
Figure 10 illustrates the changing relationships and correlations of pollutants in different subsequences. The MCI value is used to assess whether two variables are independent given other variables. If the MCI value is far from 0, we can consider that these two variables are correlated given other variables, indicating a possible direct causal relationship between them. Based on the results of subsequence division, we discovered a sequential interaction effect among pollutants.
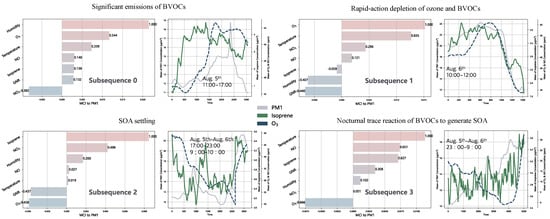
Figure 10.
MCI (normalize) characterization of contaminants with different subsequences.
In all subsequences, BVOCs have a positive effect on the generation of SOAs. Subsequence 0 is the stage of large-scale BVOC release, during which BVOCs and their oxides are at a high concentration level, and the source of SOAs is complex. However, a positive effect of isoprene on the generation of SOAs can be observed. Subsequence 1 is the stage where BVOCs and O3 undergo significant photochemical reactions. During this stage, both O3 and BVOCs have a positive effect on the generation of SOAs, and the concentration of BVOCs decreases as the photochemical reactions intensify. Subsequence 3 is the stage of nighttime SOA settlement reduction, during which the quantities of SOA, BVOCs, and O3 all decrease. Subsequence 4 is the early morning plant silent growth stage, with a small amount of BVOCs and SOAs generated. In subsequences 3 and 4, since photochemical reactions are not the main pathway for SOA generation, and O3 inhibits plant physiological activities, O3 currently has a negative effect on SOA.
High-frequency monitoring shows that these four stages alternate within a day, indicating that the relationship between BVOCs and SOAs varies as environmental conditions (mainly plant photoperiod and circadian rhythm) change. If this complex temporal variation relationship is not distinguished, the results of the analysis will be biased.
From the perspective of the sequential interaction effect of pollutants in forests, it is crucial for forest management and the evaluation of the impact of forests on human health. This method can predict changes in air quality in forests and develop more effective forest management strategies accordingly. During the day (9:00 a.m.–17:00 p.m.), the ground layer receives strong solar radiation, and vegetation releases a large amount of BVOCs. At the same time, industrial and traffic pollution is also emitted around the city. Currently, it is important to focus on monitoring the content and environmental impact of pollutants such as SOA, ozone, and nitrogen oxides. At night (23:00 p.m.–9:00 a.m.), the release of BVOCs is related to plant growth, and the plant growth status can be understood by monitoring the release of BVOCs during this period. There is a correlation between urban greening and particulate air pollution, and urban trees can improve air quality through deposition and diffusion. The study of sequential interaction can provide a basis for public health policy makers, helping them better understand and predict the impact of air quality in urban forests on human health, and develop more effective public health strategies accordingly. Since the morning and noon periods (10:00 a.m.–12:00 p.m. and 14:00 p.m.–16:00 p.m.) are the photochemical reaction periods for BVOCs and O3 to generate SOA, it is necessary to further evaluate the therapeutic effect of BVOCs in urban forests and the impact of O3 and SOA on human health.
In summary, through the sequential interaction effect, we can know that the atmospheric environment of urban forests changes with the alternation of light cycles, and the research can provide a theoretical basis and methodological foundation for further evaluation.
4. Conclusions
Urban forests play a crucial role in urban ecosystems. They emit large amounts of BVOCs, which undergo complex chemical reactions in the atmosphere, affecting air quality. However, understanding the relationship between BVOCs and SOAs emitted by plants is challenging due to the influence of meteorological conditions, photochemical reactions, and other factors, which confer complex sequential interaction characteristics between BVOCs and SOAs. To analyze the ecological processes of BVOCs and SOAs, we applied TICC and causal inference methods to analyze high-frequency monitoring data collected from an urban forest in Shanghai. TICC effectively divided a time series into subsequences with distinct statistical characteristics, improving the prediction accuracy of PM1 concentrations by 26.77%–47.51%. Different causal inference methods have different results. The PCMCI+ algorithm combined with multilayer perceptron achieved high and stable prediction accuracy.
Through TICC and causal inference analysis, the study divided BVOC and SOA ecological effects into distinct periods and analyzed their alternating ecological processes in detail. In most cases, BVOCs were an important source of SOAs during the day, and BVOCs had a negative feedback relationship with O3. BVOCs had a positive, balanced relationship with O3 at night and in the early morning, and SOAs were affected by wind speed or deposition. BVOCs had no obvious relationship with O3 in the afternoon, and SOAs were affected by temperature or humidity. The sequential interaction results in spatiotemporal heterogeneity in the concentration and effects of BVOCs and SOAs. BVOCs and SOAs in different periods and locations may have different sources, reaction pathways, and environmental effects.
This study is the first to apply TICC and causal inference methods to the high-frequency monitoring of BVOCs and SOAs, and the results can effectively explain their complex interactions in different time series. It provides a scientific basis and a new method for dynamically understanding how urban forest communities contribute to the total SOAs in the environment. This study also has several limitations, including a short observation period, limited number of pollutants measured, and lack of validation with other data sources. Future comprehensive and long-term studies are warranted to further explore the ecological processes of BVOCs and SOAs in urban forests under different conditions.
Author Contributions
Conceptualization, Y.L. and S.Y.; Methodology, Y.L.; Software, Y.L.; Formal analysis, Y.L. and S.Y.; Investigation, N.S. and S.Y.; Data curation, Y.L., N.S. and S.Y.; Writing—original draft, Y.L.; Writing—review & editing, S.Y.; Visualization, Y.L.; Supervision, W.Z., N.S., P.Z., J.Y. and S.Y.; Project administration, W.Z., N.S., P.Z., J.Y. and S.Y.; Funding acquisition, S.Y. All authors have read and agreed to the published version of the manuscript.
Funding
This work was co-supported by the National Natural Science Foundation of China (32171865), Shanghai Landscaping and City Appearance Administrative Bureau (G231208), and Evaluation of Forest Carbon Sequestration Function of Pudong Section of Urban Green Belt Research Project funded by the Ecological Environment Bureau of Pudong New Area.
Institutional Review Board Statement
Not applicable.
Informed Consent Statement
Not applicable.
Data Availability Statement
The data that support the findings of this study are available from the corresponding author upon reasonable request.
Conflicts of Interest
The authors declare no conflict of interest.
References
- Führer, E. Forest Functions, Ecosystem Stability and Management. For. Ecol. Manag. 2000, 132, 29–38. [Google Scholar] [CrossRef]
- Artaxo, P.; Hansson, H.-C.; Andreae, M.O.; Bäck, J.; Alves, E.G.; Barbosa, H.M.; Bender, F.; Bourtsoukidis, E.; Carbone, S.; Chi, J. Tropical and Boreal Forest Atmosphere Interactions: A Review. Tellus. Ser. B Chem. Phys. Meteorol. 2022, 74, 24–163. [Google Scholar] [CrossRef]
- Bridhikitti, A.; Khumphokha, P.; Wanitha, W.; Prasopsin, S. Dust Captured by a Canopy and Individual Leaves of Trees in the Tropical Mixed Deciduous Forest: Magnitude and Influencing Factors. Eur. J. For. Res. 2022. [Google Scholar] [CrossRef]
- Handayani, B.; Mardikaningsih, R. Urban Forest: The Role of Improving the Quality of The Urban Environment. Bull. Sci. Technol. Soc. 2022, 1, 25–29. [Google Scholar]
- Ramon, M.; Ribeiro, A.P.; Theophilo, C.Y.S.; Moreira, E.G.; de Camargo, P.B.; de Bragança Pereira, C.A.; Saraiva, E.F.; dos Reis Tavares, A.; Dias, A.G.; Nowak, D. Assessment of Four Urban Forest as Environmental Indicator of Air Quality: A Study in a Brazilian Megacity. Urban Ecosyst. 2023, 26, 197–207. [Google Scholar] [CrossRef]
- Legesse, F.; Degefa, S.; Soromesa, T. Ecological and Economic Impacts of REDD+ Implementation in Developing Countries. Eart Environ. Sci. Res. Rev. 2022, 5, 217–224. [Google Scholar]
- Kulmala, M.; Nieminen, T.; Chellapermal, R.; Makkonen, R.; Bäck, J.; Kerminen, V.-M. Climate Feedbacks Linking the Increasing Atmospheric CO2 Concentration, BVOC Emissions, Aerosols and Clouds in Forest Ecosystems. Biol. Control. Model. Tree Volatile Org. Compd. Emiss. 2013, 5, 489–508. [Google Scholar]
- Ma, M.; Gao, Y. Estimation of Biogenic Emission from Urban Green Spaces in China and Their Impact on Air Quality. In Proceedings of the AGU Fall Meeting Abstracts, Chicago, IL, USA, 12–16 December 2022; Volume 2022, p. A45B-02. [Google Scholar]
- Liu, H.; Liu, S.; Xue, B.; Lv, Z.; Meng, Z.; Yang, X.; Xue, T.; Yu, Q.; He, K. Ground-Level Ozone Pollution and Its Health Impacts in China. Atmos. Environ. 2018, 173, 223–230. [Google Scholar] [CrossRef]
- Chen, Q.; Chen, Q.; Wang, Q.; Xu, R.; Liu, T.; Liu, Y.; Ding, Z.; Sun, H. Particulate Matter and Ozone Might Trigger Deaths from Chronic Ischemic Heart Disease. Ecotoxicol. Environ. Saf. 2022, 242, 113931. [Google Scholar] [CrossRef]
- Sun, H.Z.; Yu, P.; Lan, C.; Wan, M.W.; Hickman, S.; Murulitharan, J.; Shen, H.; Yuan, L.; Guo, Y.; Archibald, A.T. Cohort-Based Long-Term Ozone Exposure-Associated Mortality Risks with Adjusted Metrics: A Systematic Review and Meta-Analysis. Innovation 2022, 3, 100246. [Google Scholar] [CrossRef]
- Tsigaridis, K.; Kanakidou, M. The Present and Future of Secondary Organic Aerosol Direct Forcing on Climate. Curr. Clim. Change Rep. 2018, 4, 84–98. [Google Scholar] [CrossRef]
- Kasdagli, M.-I.; Katsouyanni, K.; de Hoogh, K.; Lagiou, P.; Samoli, E. Investigating the Association between Long-Term Exposure to Air Pollution and Greenness with Mortality from Neurological, Cardio-Metabolic and Chronic Obstructive Pulmonary Diseases in Greece. Environ. Pollut. 2022, 292, 118372. [Google Scholar] [CrossRef] [PubMed]
- Yang, X.; Wang, Y.; Zhao, C.; Fan, H.; Yang, Y.; Chi, Y.; Shen, L.; Yan, X. Health Risk and Disease Burden Attributable to Long-Term Global Fine-Mode Particles. Chemosphere 2022, 287, 132435. [Google Scholar]
- Eisenman, T.S.; Churkina, G.; Jariwala, S.P.; Kumar, P.; Lovasi, G.S.; Pataki, D.E.; Weinberger, K.R.; Whitlow, T.H. Urban Trees, Air Quality, and Asthma: An Interdisciplinary Review. Landsc. Urban Plan. 2019, 187, 47–59. [Google Scholar] [CrossRef]
- Chen, D.; Yin, S.; Zhang, X.; Lyu, J.; Zhang, Y.; Zhu, Y.; Yan, J. A High-Resolution Study of PM2. 5 Accumulation inside Leaves in Leaf Stomata Compared with Non-Stomatal Areas Using Three-Dimensional X-Ray Microscopy. Sci. Total Environ. 2022, 852, 158543. [Google Scholar]
- Janhäll, S. Review on Urban Vegetation and Particle Air Pollution–Deposition and Dispersion. Atmos. Environ. 2015, 105, 130–137. [Google Scholar] [CrossRef]
- Liu, T.; Lin, Y.; Chen, J.; Chen, G.; Yang, C.; Xu, L.; Li, M.; Fan, X.; Zhang, F.; Hong, Y. Pollution Mechanisms and Photochemical Effects of Atmospheric HCHO in a Coastal City of Southeast China. Sci. Total Environ. 2023, 859, 160210. [Google Scholar] [CrossRef] [PubMed]
- Mahilang, M.; Deb, M.K.; Pervez, S. Biogenic Secondary Organic Aerosols: A Review on Formation Mechanism, Analytical Challenges and Environmental Impacts. Chemosphere 2021, 262, 127771. [Google Scholar] [CrossRef]
- Oak, Y.J.; Park, R.J.; Jo, D.S.; Hodzic, A.; Jimenez, J.L.; Campuzano-Jost, P.; Nault, B.A.; Kim, H.; Kim, H.; Ha, E.S. Evaluation of Secondary Organic Aerosol (SOA) Simulations for Seoul, Korea. J. Adv. Model. Earth Syst. 2022, 14, e2021MS002760. [Google Scholar]
- Artiola, J.F.; Brusseau, M.L. The Role of Environmental Monitoring in Pollution Science. In Environmental and Pollution Science; Elsevier: Amsterdam, The Netherlands, 2019; pp. 149–162. [Google Scholar]
- Runge, J. Discovering Contemporaneous and Lagged Causal Relations in Autocorrelated Nonlinear Time Series Datasets. In Proceedings of the Conference on Uncertainty in Artificial Intelligence, PMLR, Virtual, 3–6 August 2020; pp. 1388–1397. [Google Scholar]
- Yin, S.; Chen, D.; Zhang, X.; Yan, J. Review on the Multi-Scale Interactions of Urban Forests and Atmospheric Particles: Affecting Factors Are Scale-Dependent among Tree, Stand and Region. Urban For. Urban Green. 2022, 78, 127789. [Google Scholar] [CrossRef]
- Liu, Y.; Schallhart, S.; Taipale, D.; Tykkä, T.; Räsänen, M.; Merbold, L.; Hellén, H.; Pellikka, P. Seasonal and Diurnal Variations in Biogenic Volatile Organic Compounds in Highland and Lowland Ecosystems in Southern Kenya. Atmos. Chem. Phys. 2021, 21, 14761–14787. [Google Scholar] [CrossRef]
- Hallac, D.; Vare, S.; Boyd, S.; Leskovec, J. Toeplitz Inverse Covariance-Based Clustering of Multivariate Time Series Data. In Proceedings of the 23rd ACM SIGKDD International Conference on Knowledge Discovery and Data Mining, Halifax, NS, Canada, 13–17 August 2017; pp. 215–223. [Google Scholar]
- Sfetsos, A.; Vlachogiannis, D. An Analysis of Ozone Variation in the Greater Athens Area Using Granger Causality. Atmos. Pollut. Res. 2013, 4, 290–297. [Google Scholar] [CrossRef]
- Krich, C.; Runge, J.; Miralles, D.G.; Migliavacca, M.; Perez-Priego, O.; El-Madany, T.; Carrara, A.; Mahecha, M.D. Estimating Causal Networks in Biosphere–Atmosphere Interaction with the PCMCI Approach. Biogeosciences 2020, 17, 1033–1061. [Google Scholar] [CrossRef]
- Ren, W.; Li, B.; Han, M. A Novel Granger Causality Method Based on HSIC-Lasso for Revealing Nonlinear Relationship between Multivariate Time Series. Phys. A Stat. Mech. Its Appl. 2020, 541, 123245. [Google Scholar] [CrossRef]
- Geweke, J.F. Measures of Conditional Linear Dependence and Feedback between Time Series. J. Am. Stat. Assoc. 1984, 79, 907–915. [Google Scholar] [CrossRef]
- Sugihara, G.; May, R.; Ye, H.; Hsieh, C.; Deyle, E.; Fogarty, M.; Munch, S. Detecting Causality in Complex Ecosystems. Science 2012, 338, 496–500. [Google Scholar] [CrossRef]
- Ryali, S.; Chen, T.; Supekar, K.; Menon, V. Estimation of Functional Connectivity in FMRI Data Using Stability Selection-Based Sparse Partial Correlation with Elastic Net Penalty. NeuroImage 2012, 59, 3852–3861. [Google Scholar] [CrossRef]
- Runge, J.; Heitzig, J.; Petoukhov, V.; Kurths, J. Escaping the Curse of Dimensionality in Estimating Multivariate Transfer Entropy. Phys. Rev. Lett. 2012, 108, 258701. [Google Scholar] [CrossRef]
- James, G.; Witten, D.; Hastie, T.; Tibshirani, R. An Introduction to Statistical Learning; Springer: Berlin, Germany, 2013; Volume 112. [Google Scholar]
- Hearst, M.A.; Dumais, S.T.; Osuna, E.; Platt, J.; Scholkopf, B. Support Vector Machines. IEEE Intell. Syst. Appl. 1998, 13, 18–28. [Google Scholar] [CrossRef]
- Cover, T.; Hart, P. Nearest Neighbor Pattern Classification. IEEE Trans. Inf. Theory 1967, 13, 21–27. [Google Scholar] [CrossRef]
- Freund, Y.; Schapire, R.E. A Decision-Theoretic Generalization of on-Line Learning and an Application to Boosting. J. Comput. Syst. Sci. 1997, 55, 119–139. [Google Scholar] [CrossRef]
- Longstaff, I.D.; Cross, J.F. A Pattern Recognition Approach to Understanding the Multi-Layer Perception. Pattern Recognit. Lett. 1987, 5, 315–319. [Google Scholar] [CrossRef]
- Lyu, J.; Xiong, F.; Sun, N.; Li, Y.; Liu, C.; Yin, S. Photosynthesis and Related Physiological Parameters Differences Affected the Isoprene Emission Rate among 10 Typical Tree Species in Subtropical Metropolises. Int. J. Environ. Res. Public Health 2021, 18, 954. [Google Scholar] [CrossRef] [PubMed]
- Li, J.; Han, Z.; Wu, J.; Tao, J.; Li, J.; Sun, Y.; Liang, L.; Liang, M.; Wang, Q. Secondary Organic Aerosol Formation and Source Contributions over East China in Summertime. Environ. Pollut. 2022, 306, 119383. [Google Scholar] [CrossRef]
- McGlynn, D.F.; Frazier, G.; Barry, L.E.; Lerdau, M.T.; Pusede, S.E.; Isaacman-VanWertz, G. Minor Contributions of Daytime Monoterpenes Are Major Contributors to Atmospheric Reactivity. Biogeosciences 2023, 20, 45–55. [Google Scholar] [CrossRef]
- Harvey, C.C.; Schwartz, S.J. Time Series Resampling Methods. In Analysis Methods for Multi-Spacecraft Data; Paschmann, G., Ed.; International Space Science Institute: Bern, Switzerland, 1998. [Google Scholar]
- Wollstadt, P.; Lizier, J.T.; Vicente, R.; Finn, C.; Martinez-Zarzuela, M.; Mediano, P.; Novelli, L.; Wibral, M. IDTxl: The Information Dynamics Toolkit Xl: A Python Package for the Efficient Analysis of Multivariate Information Dynamics in Networks. arXiv 2018, arXiv:1807.10459. [Google Scholar] [CrossRef]
- Fabian, P. Scikit-Learn: Machine Learning in Python. J. Mach. Learn. Res. 2011, 12, 2825. [Google Scholar]
- Shcherbakov, M.V.; Brebels, A.; Shcherbakova, N.L.; Tyukov, A.P.; Janovsky, T.A.; Kamaev, V.A. A Survey of Forecast Error Measures. World Appl. Sci. J. 2013, 24, 171–176. [Google Scholar]
- Dennis, A.; Fraser, M.; Anderson, S.; Allen, D. Air Pollutant Emissions Associated with Forest, Grassland, and Agricultural Burning in Texas. Atmos. Environ. 2002, 36, 3779–3792. [Google Scholar] [CrossRef]
- Shrivastava, M.; Cappa, C.D.; Fan, J.; Goldstein, A.H.; Guenther, A.B.; Jimenez, J.L.; Kuang, C.; Laskin, A.; Martin, S.T.; Ng, N.L. Recent Advances in Understanding Secondary Organic Aerosol: Implications for Global Climate Forcing. Rev. Geophys. 2017, 55, 509–559. [Google Scholar] [CrossRef]
- Fricke, W. Night-Time Transpiration–Favouring Growth? Trends Plant Sci. 2019, 24, 311–317. [Google Scholar] [CrossRef] [PubMed]
- Iijima, Y. Recent Advances in the Application of Metabolomics to Studies of Biogenic Volatile Organic Compounds (BVOC) Produced by Plant. Metabolites 2014, 4, 699–721. [Google Scholar] [CrossRef] [PubMed]
- Kegge, W.; Pierik, R. Biogenic Volatile Organic Compounds and Plant Competition. Trends Plant Sci. 2010, 15, 126–132. [Google Scholar] [CrossRef] [PubMed]
Disclaimer/Publisher’s Note: The statements, opinions and data contained in all publications are solely those of the individual author(s) and contributor(s) and not of MDPI and/or the editor(s). MDPI and/or the editor(s) disclaim responsibility for any injury to people or property resulting from any ideas, methods, instructions or products referred to in the content. |
© 2023 by the authors. Licensee MDPI, Basel, Switzerland. This article is an open access article distributed under the terms and conditions of the Creative Commons Attribution (CC BY) license (https://creativecommons.org/licenses/by/4.0/).