Article

Insight into the Complex Genetic Relationship of Chinese Fir (Cunninghamia lanceolata (Lamb.) Hook.) Advanced Parent Trees Based on SSR and SNP Datasets

1
College of Forestry and Landscape Architecture, South China Agricultural University, Guangzhou 510642, China
2
Guangdong Provincial Key Laboratory of Silviculture, Protection and Utilization, Guangdong Academy of Forestry, Guangzhou 510520, China
*
Author to whom correspondence should be addressed.
These authors contributed equally to this work.
Forests 2023, 14(2), 347; https://doi.org/10.3390/f14020347
Submission received: 6 December 2022 / Revised: 1 February 2023 / Accepted: 6 February 2023 / Published: 9 February 2023
(This article belongs to the Special Issue Long-Term Genetic Improvement and Molecular Breeding of Chinese Fir)

Abstract

:
Accurate estimation of genetic relationships among breeding materials and their genetic diversity contributes to the optimal design of breeding programs. For Chinese fir (Cunninghamia lanceolata (Lamb.) Hook.), an important indigenous tree species in China, breeders have attempted to employ different molecular markers to address the genetic architecture of their target population, but the power of an advanced parent tree population with a complex pedigree relationship is still rather limited. In this study, a partly known pedigree map combined with marker-derived (SSRs and SNPs) information was implemented for the first time in the assessment of the genetic relatedness of a complex advanced parent tree population (n = 50) in Chinese fir. The bivariate analysis showed that relatedness coefficients between individuals based on SSRs were significantly correlated with SNPs (r = 0.690, p < 0.01). Moreover, the heatmap generated by the SSR-based coefficient matrix was largely consistent with that derived from the SNP-based matrix. Additionally, STRUCTURE and ADMIXTURE analyses based on the two markers showed an analogical genetic clustering result. When compared to the recorded pedigree information, the genetic relationships estimated by the two molecular markers were broadly parallel with pedigree relatedness. These results indicated that SSRs and SNPs can be used as effective tools to clarify genetic relationships when complete pedigree records are not available in Chinese fir. Based on the two markers, the present study revealed a relatively wide genetic variation (SSRs: PIC = 0.573; SNPs: PIC = 0.231) in the selected parent trees. This investigation provides important input into the progress of Chinese fir advanced-generation breeding.

1. Introduction

Knowledge of genetic relationships among elite breeding materials and their genetic diversity is essential in the optimal design of plant breeding programs [1,2], which is particularly applicable to the selection of appropriate parents for establishing new breeding populations that can maintain genetic diversity and sustain long-term selection gains [3,4,5]. With the advancement of breeding cycles, the advanced-generation seed orchards of commercial tree species appear to have complex pedigrees among parents due to various degrees of relatedness among them [6,7,8,9]. This would raise the possibility of inbreeding (e.g., selfing, sib-mating, parent offspring, grandparent offspring, etc.) resulting from the selection and inclusion of related individuals as parents [6,7,8,9]. Inbreeding usually leads to a reduction of genetic diversity and, particularly, inbreeding depression, thus resulting in lower seed yield in seed orchards and suboptimal genetic gain [6,10,11,12], e.g., 13% less height growth and 25% less stem volume caused by full-sibs mating in Pinus taeda L. [13]. On the contrary, crosses between parents with large genetic distances are expected to produce a more extensive genetic variance among progeny, increasing the probability of generating superior progeny [14]. Consequently, it is necessary to clarify the relationships among parents in an advanced-generation seed orchard and evaluate their genetic diversity.
The precision of genetic relationship estimates depends largely on the methods implemented. Previously, genetic relatedness among breeding materials has been based primarily on pedigree records [15]. However, pedigree information may not be available in some cases due to incomplete historical breeding records. Molecular markers have been proven to be effective alternative methods to assess genetic relationships and diversity directly at the DNA level, such as restriction fragment length polymorphism (RFLP) markers, amplified fragment length polymorphism (AFLP) markers, sequence-related amplified polymorphism (SRAP), simple sequence repeat (SSR) and single-nucleotide polymorphism (SNP) [16,17,18,19]. The various types of molecular marker-based technologies differ in nature; therefore, breeders need to give careful thought to selecting the appropriate method(s). Among the various molecular markers, SSRs, as powerful genetic markers, have been extensively and successfully applied to clarify genetic relationships because of their co-dominant, multi-allelic, highly polymorphic, and reproducible properties [20,21,22], while single-nucleotide polymorphisms (SNPs) markers have the most abundant source of genetic polymorphism and show base changes between two individuals at certain locations [23]. Furthermore, with the development of new sequencing technologies, the throughput of SNPs is increasing while costs are reducing [24,25]. In modern breeding programs, the two marker systems (i.e., SNPs and SSRs) are the predominant markers used in the identification of genetic relationships [7]. Due to their properties, SSR and SNP markers have been used separately as well as in combination for genetic analyses that are used in breeding programs, such as for barley [26,27], maize [28], citrus [29], rice [30], juniper [31], and pigeon pea [32,33].
Chinese fir (Cunninghamia lanceolata (Lamb.) Hook.) is an important indigenous tree species in China and has been extensively utilized for afforestation and landscape enhancement in southern China owing to its fast growth, high yield, and good timber quality [34]. The species is also naturally found in Vietnam and Laos, has been historically introduced to many ex-regions, such as New Zealand and Brazil [35,36], and has become an important planted species in artificial forests [37]. Chinese fir breeding programs started in the 1960s, and after five decades of effort, a high-generation breeding stage has been reached in China [38,39]. Today, the improvement of Chinese fir has encountered the fact that the selected breeding materials of advanced breeding populations have a complicated genetic relationship, mainly caused by cross-mating between individuals during several breeding cycles. Although some efforts have been made to clarify the genetic diversity and relationships of Chinese fir germplasm resources using SRAP, SSR, and SNP markers [24,38,39,40,41,42], genetic diversity and relatedness among the selected parent trees for the next round of the breeding program still remain to be resolved. Furthermore, previous studies rarely considered pedigree-based relationships—the most reliable relationship records. During our Chinese fir breeding studies, fifty elite parent trees from third-generation breeding gardens were selected as potential parents for the establishment of third-generation seed orchards according to their breeding values for growth traits, cone production traits, anthracnose resistance ability, and other important traits (e.g., wood basic density, heartwood colors) [24,43,44]. Pedigree relatedness between some of the individuals was recorded in detail, providing valuable information for the selection of parents. However, the details of relationships among most individuals are still unclear, which significantly hampers the progress of Chinese fir high-generation breeding.
In this study, SSR- and SNP-based technologies, in combination with documented pedigree information, were first applied to elucidate genetic relationships among the Chinese fir parent trees that have complex relations and estimate their genetic variation.

2. Materials and Methods

2.1. Plant Materials

The study was performed on a parent population of 50 elite individuals highlighted by the Chinese fir breeding program of Guangdong (China) for their potential use in third-generation seed orchards. The material was part of the breeding population previously studied, and detailed germplasm and generation information has been illustrated in previous studies [24,43,44]. The recorded pedigree relatedness among the individuals is shown in Figure 1. Briefly, the 50 individuals were separated into 2 pan-relational groups and 1 scatter set. The two pan-relationship groups harbored 30 and 9 individuals, respectively, while the scattered collection consisted of 11 individuals. Parental and offspring relationships are connected by arrows, while those with historical genetic relationships but no detailed records are indicated by straight lines. The individuals without any pedigree records were considered independent of the others.

2.2. Genomic DNA Extraction

Total genomic DNA was extracted from the mature and healthy leaves using a DNAsecure Plant Kit (TIANGEN, Beijing, China) according to the manufacturer’s instructions. The quality and concentration of DNA were then evaluated by 1% agarose gel electrophoresis and an ultraviolet spectrophotometer (NanoDrop-2000, Wilmington, DE, USA).

2.3. SSR Assay

Twenty-one highly polymorphic and stable SSR markers developed by Wen et al. [45] and re-screened by Duan et al. [40] were used in this study. The polymerase chain reaction (PCR) was performed in a 25 µL final volume containing 11 µL of double-distilled water, 0.5 µL of 10 µmol/L forward primer, 0.5 µL of 10 µmol/L reverse primer, 12.5 µL 2× Taq Plus PCR MasterMix, and 0.5 µL of genomic DNA (~50 ng). The PCR amplification was carried out in a T100TM Thermal Cycler using the following program: initial denaturation at 94 °C for 5 min, followed by 35 cycles of denaturation at 94 °C for 30 s, annealing at 55 °C for 30 s, extension at 72 °C for 30 s, and final extension at 72 °C for 10 min. An ABI3730xl DNA Analyzer (Applied Biosystems, Carlsbad, CA, USA) was used to separate PCR products. The amplicons were analyzed using Gene-Marker 2.2.0 (SoftGenetics LLC, State College, PA, USA).

2.4. SLAF-Seq and SNP Development

Genotyping-by-sequencing was performed using the specific-locus amplified fragment sequencing (SLAF-seq) method as described by Zheng et al. [24]. Briefly, the genomic DNA of Chinese fir samples was double digested with the enzyme digestion combination EcoR V and Sca I. Then, we constructed the SLAF library using the restriction fragments (digestion efficiency = 97.79%) generated by enzyme digestion according to the procedure described by Sun et al. [46]. Next, pair-end sequencing (2 × 100 bp) was performed on the selected DNA fragments with a size of 264–294 bp using the Illumina High-seqTM2500 system (Illumina, San Diego, CA, USA). After sequencing, the reads of each sample were identified using dual-indexing, and the clean reads (integrity > 0.8, minor allele frequency > 0.05) from one SLAF fragment (SLAF tag) were clustered based on sequence similarity. The SLAF reads were aligned to reference sequences (the most-depth read) with the Burrows-Wheeler Alignment tool (BWA) (version 0.7.10-r789) [47]. Meanwhile, SNPs were developed using both the Genome Analysis Toolkit (GATK, version 3.1.1) [48] and SAM tools (version 0.1.19) [49], and the overlapping SNP markers identified by these two methods were regarded as the authentic SNP markers. Subsequently, highly consistent SNPs were obtained for genetic analysis by filtering according to SNP missingness (--geno 0.05) and minor allele frequency (--maf 0.05) using PLINK (version 1.9) [50].

2.5. Statistical Analysis

For SSRs, we applied the moment-based estimator of Lynch and Ritland (1999) [51] implemented in GenAlEx V 6.5 [52] to examine relatedness between all pairs of individuals. Based on the relationship coefficient matrix, a heatmap was plotted using the pheatmap package (version 1.0.12) in the R environment. To further infer population genetic structure, Bayesian model-based cluster analysis with STRUCTURE 2.3.4 [53] was performed. Five independent runs with K values from 1 to 10 were performed under the admixture model with a burn-in length of 100,000, followed by 1,000,000 iterations. The most likely value of K was determined using the freely available online program STRUCTURE HARVESTER [54]. Then, the software CLUMPP 1.1 [55] was employed to average the 5 independent simulations, and the output result was visualized using Microsoft Excel 2016. Subsequently, genetic diversity was evaluated using GenAlEx V 6.5 [52], with parameters including observed heterozygosity (Ho), expected heterozygosity (He), and Shannon’s information index (I) for each SSR locus and the parent tree population. The polymorphism information content (PIC) value and Nei’s gene diversity (H) were calculated using PowerMarker V 3.25 [56].
For SNPs, a matrix of kinship relationships was generated on GCTA [57] software to evaluate the genetic relationship among individuals. The genetic relationship matrix was then visualized using the R package pheatmap. Next, population structure analysis was conducted by ADMIXTURE version 1.3.0 [58] based on the maximum-likelihood method with K values ranging from 1 to 10. The optimal value of K was determined by the cross-validation error rate according to Alexander and Lange’s method [59]. To understand the polymorphism level of this breeding population, the observed heterozygosity (Ho), expected heterozygosity (He), Shannon’s information index (I), polymorphism information content (PIC) value, and Nei’s gene diversity (H) were calculated using RStudio in the R environment [60].

3. Results

3.1. Polymorphism Analysis of Markers and Genetic Diversity

A total of 103 alleles were detected across the 21 SSR markers. On average, 7.143 ± 0.882 (ranging from 3 to 16) alleles per locus were observed (Table S1). Among the 21 loci, SSR1 and SSR11 produced the largest number of alleles, while SSR3 and SSR19 had the fewest alleles. The observed heterozygosity (Ho) ranged from 0.120 to 0.980 among loci, and the expected heterozygosity (He) varied from 0.115 to 0.891. The average values of Ho and He were 0.639 and 0.610, respectively (Table S1), and the mean polymorphism information content (PIC) value and Shannon’s information index (I) equaled 0.573 and 1.312, respectively. For SNPs, the summary statistics are illustrated in Table S2. The minor allele frequencies (MAF) of 41,864 polymorphic SNPs with good quality averaged 0.189, with a range from 0.050 to 0.500. Ho and He showed a variation from 0.020 to 0.840 and from 0.095 to 0.500, respectively. The mean values of Ho, He, PIC, and I were 0.233, 0.278, 0.231, and 0.440, respectively.

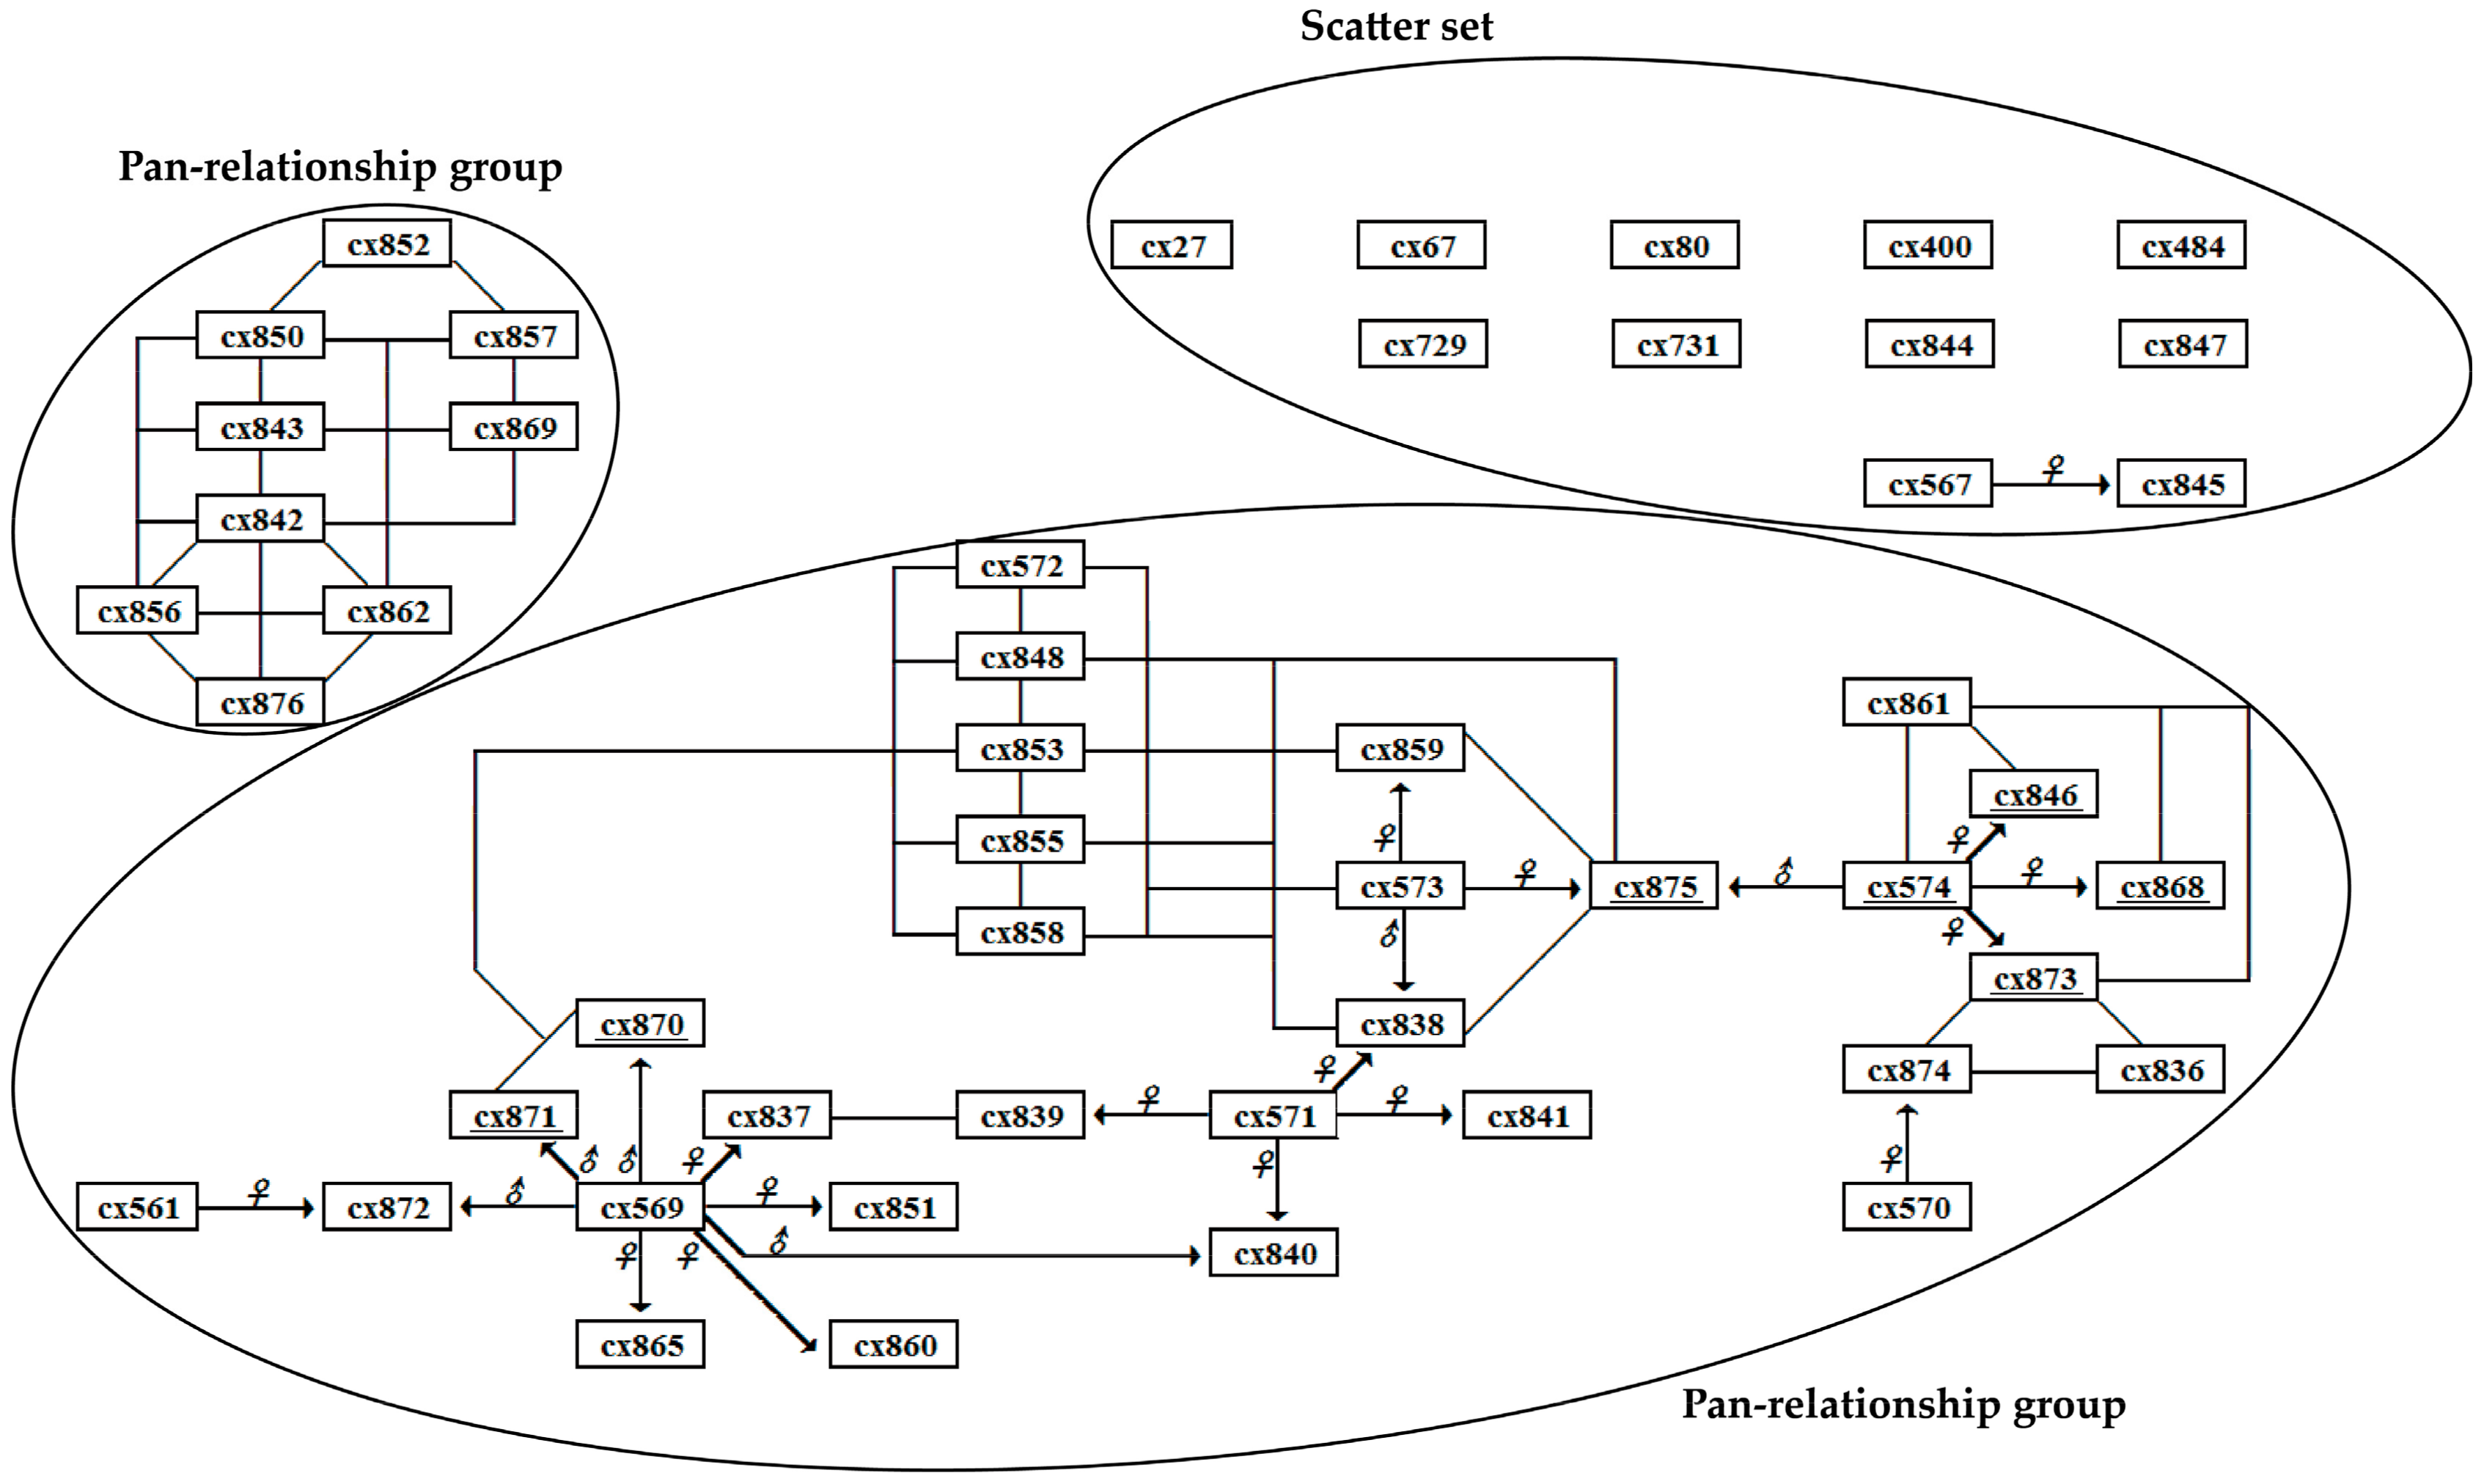
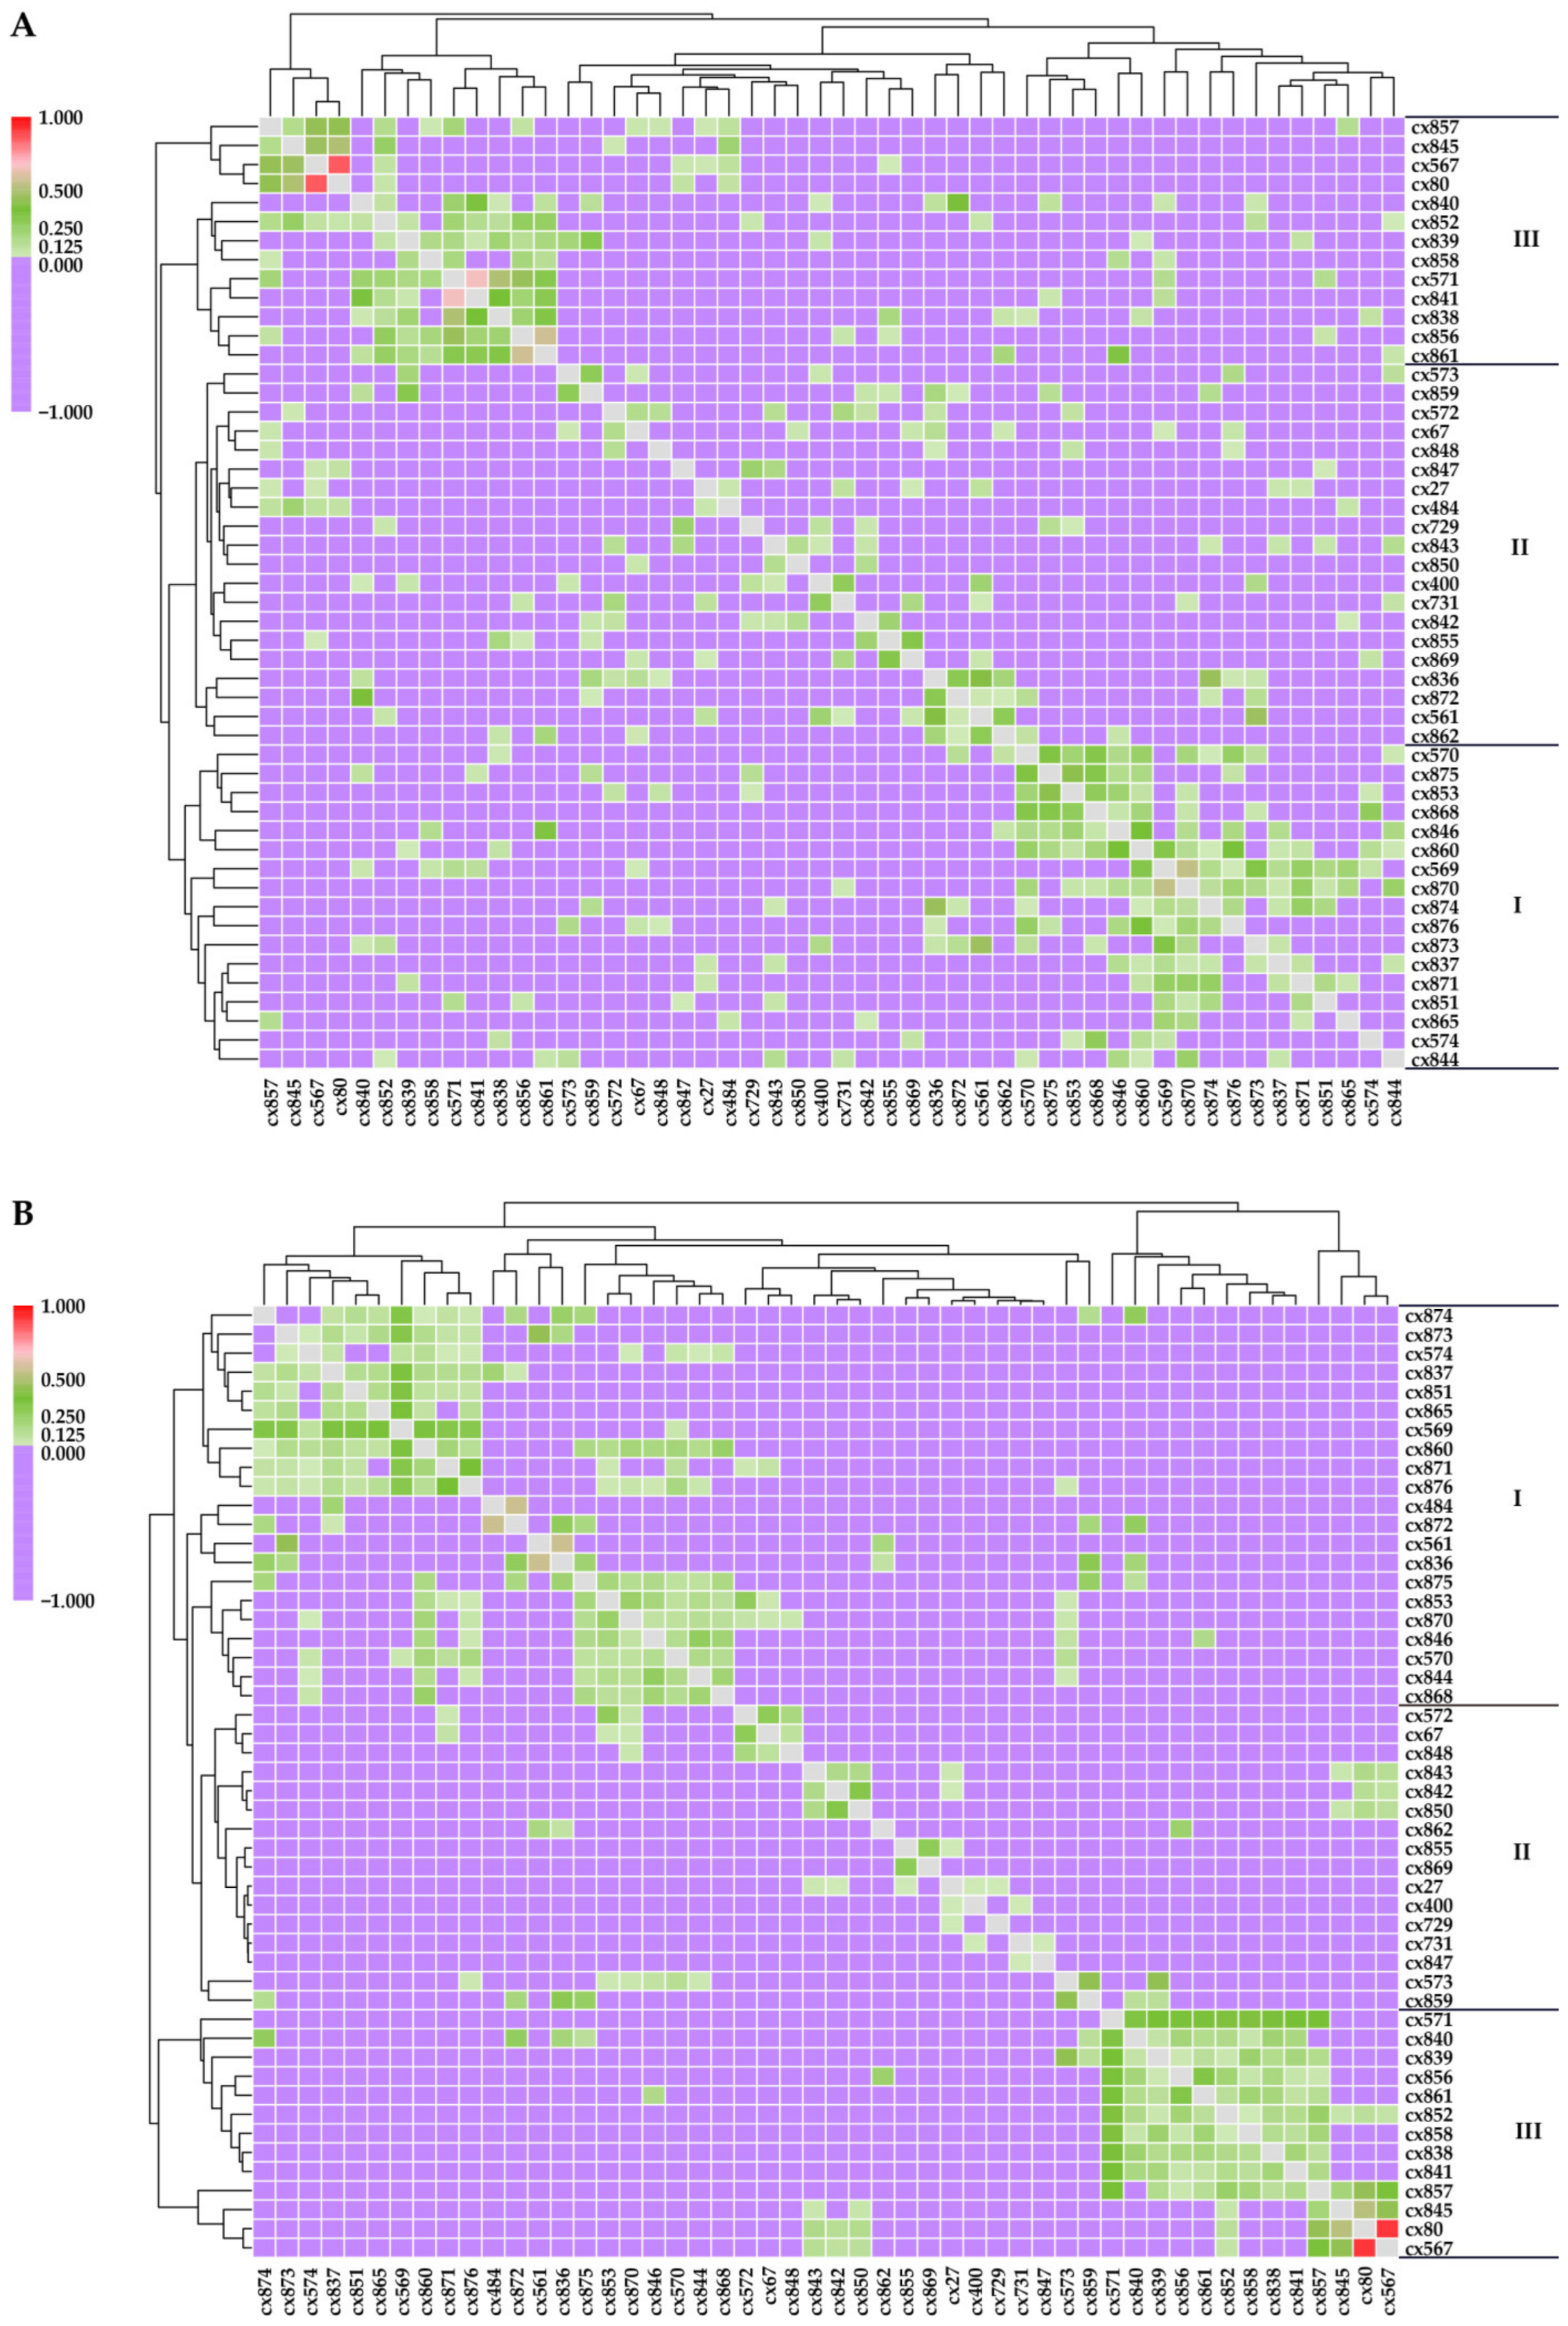
3.2. Genetic Relationships of Parent Trees

The genetic relationship among parent trees was reflected by the relatedness coefficient based on the SSR and SNP datasets, as shown in Table S3 and Figure 2. The relatedness coefficient among parent trees obtained with SSR ranged from −0.311 to 0.860. Among all pairs of parent trees, six pairs (cx567-cx80, cx80-cx845, cx571-cx838, cx571-cx841, cx856-cx861, and cx569-cx870) had a relatedness coefficient higher than 0.500. Additionally, 37 and 74 pairs had a relatedness coefficient over 0.250 and 0.125, respectively. Based on SNP, the coefficient of pairwise relationships between parent trees fell between −0.187 and 0.917. Four paired parent trees (cx567-cx80, cx80-cx845, cx561-cx836, and cx484-cx872) had a relatedness coefficient over 0.500, while 35 and 83 pairs displayed a relatedness coefficient higher than 0.250 and 0.125, respectively. The bivariate analysis performed in IBM SPSS Statistics 23 demonstrated a significant correlation between the SSR- and SNP-deduced relatedness coefficient matrices, with a Pearson value of r = 0.690 (p-value < 0.01).
Heatmaps based on the relationship coefficient matrix were plotted to further visualize the genetic relatedness of Chinese fir parent trees (Figure 3). The result based on SSRs was broadly consistent with that of SNPs. The heatmap results inferred by both markers showed that all the parent trees could be divided into three major clusters (clusters I–III). Fifteen individuals from the largest pan-relational group and two from other groups (Figure 1) were grouped into cluster I in SSR-based heatmaps (Figure 3A), while an additional four individuals (three from the largest pan-relational group and one from the scattered collection) were also assigned to cluster I when using the SNP dataset (Figure 3B). Among the individuals in cluster I, most were offspring of ‘cx569’ and ‘cx574’. Cluster II consisted of sixteen individuals in SNP-based heatmaps, including ten from the pan-relational groups and six from the scattered collection; however, an additional four individuals were clustered into cluster II in SSRs. cx571 and its recorded offspring (cx838, cx839, cx840, and cx841), as well as another eight individuals, were grouped into cluster III.

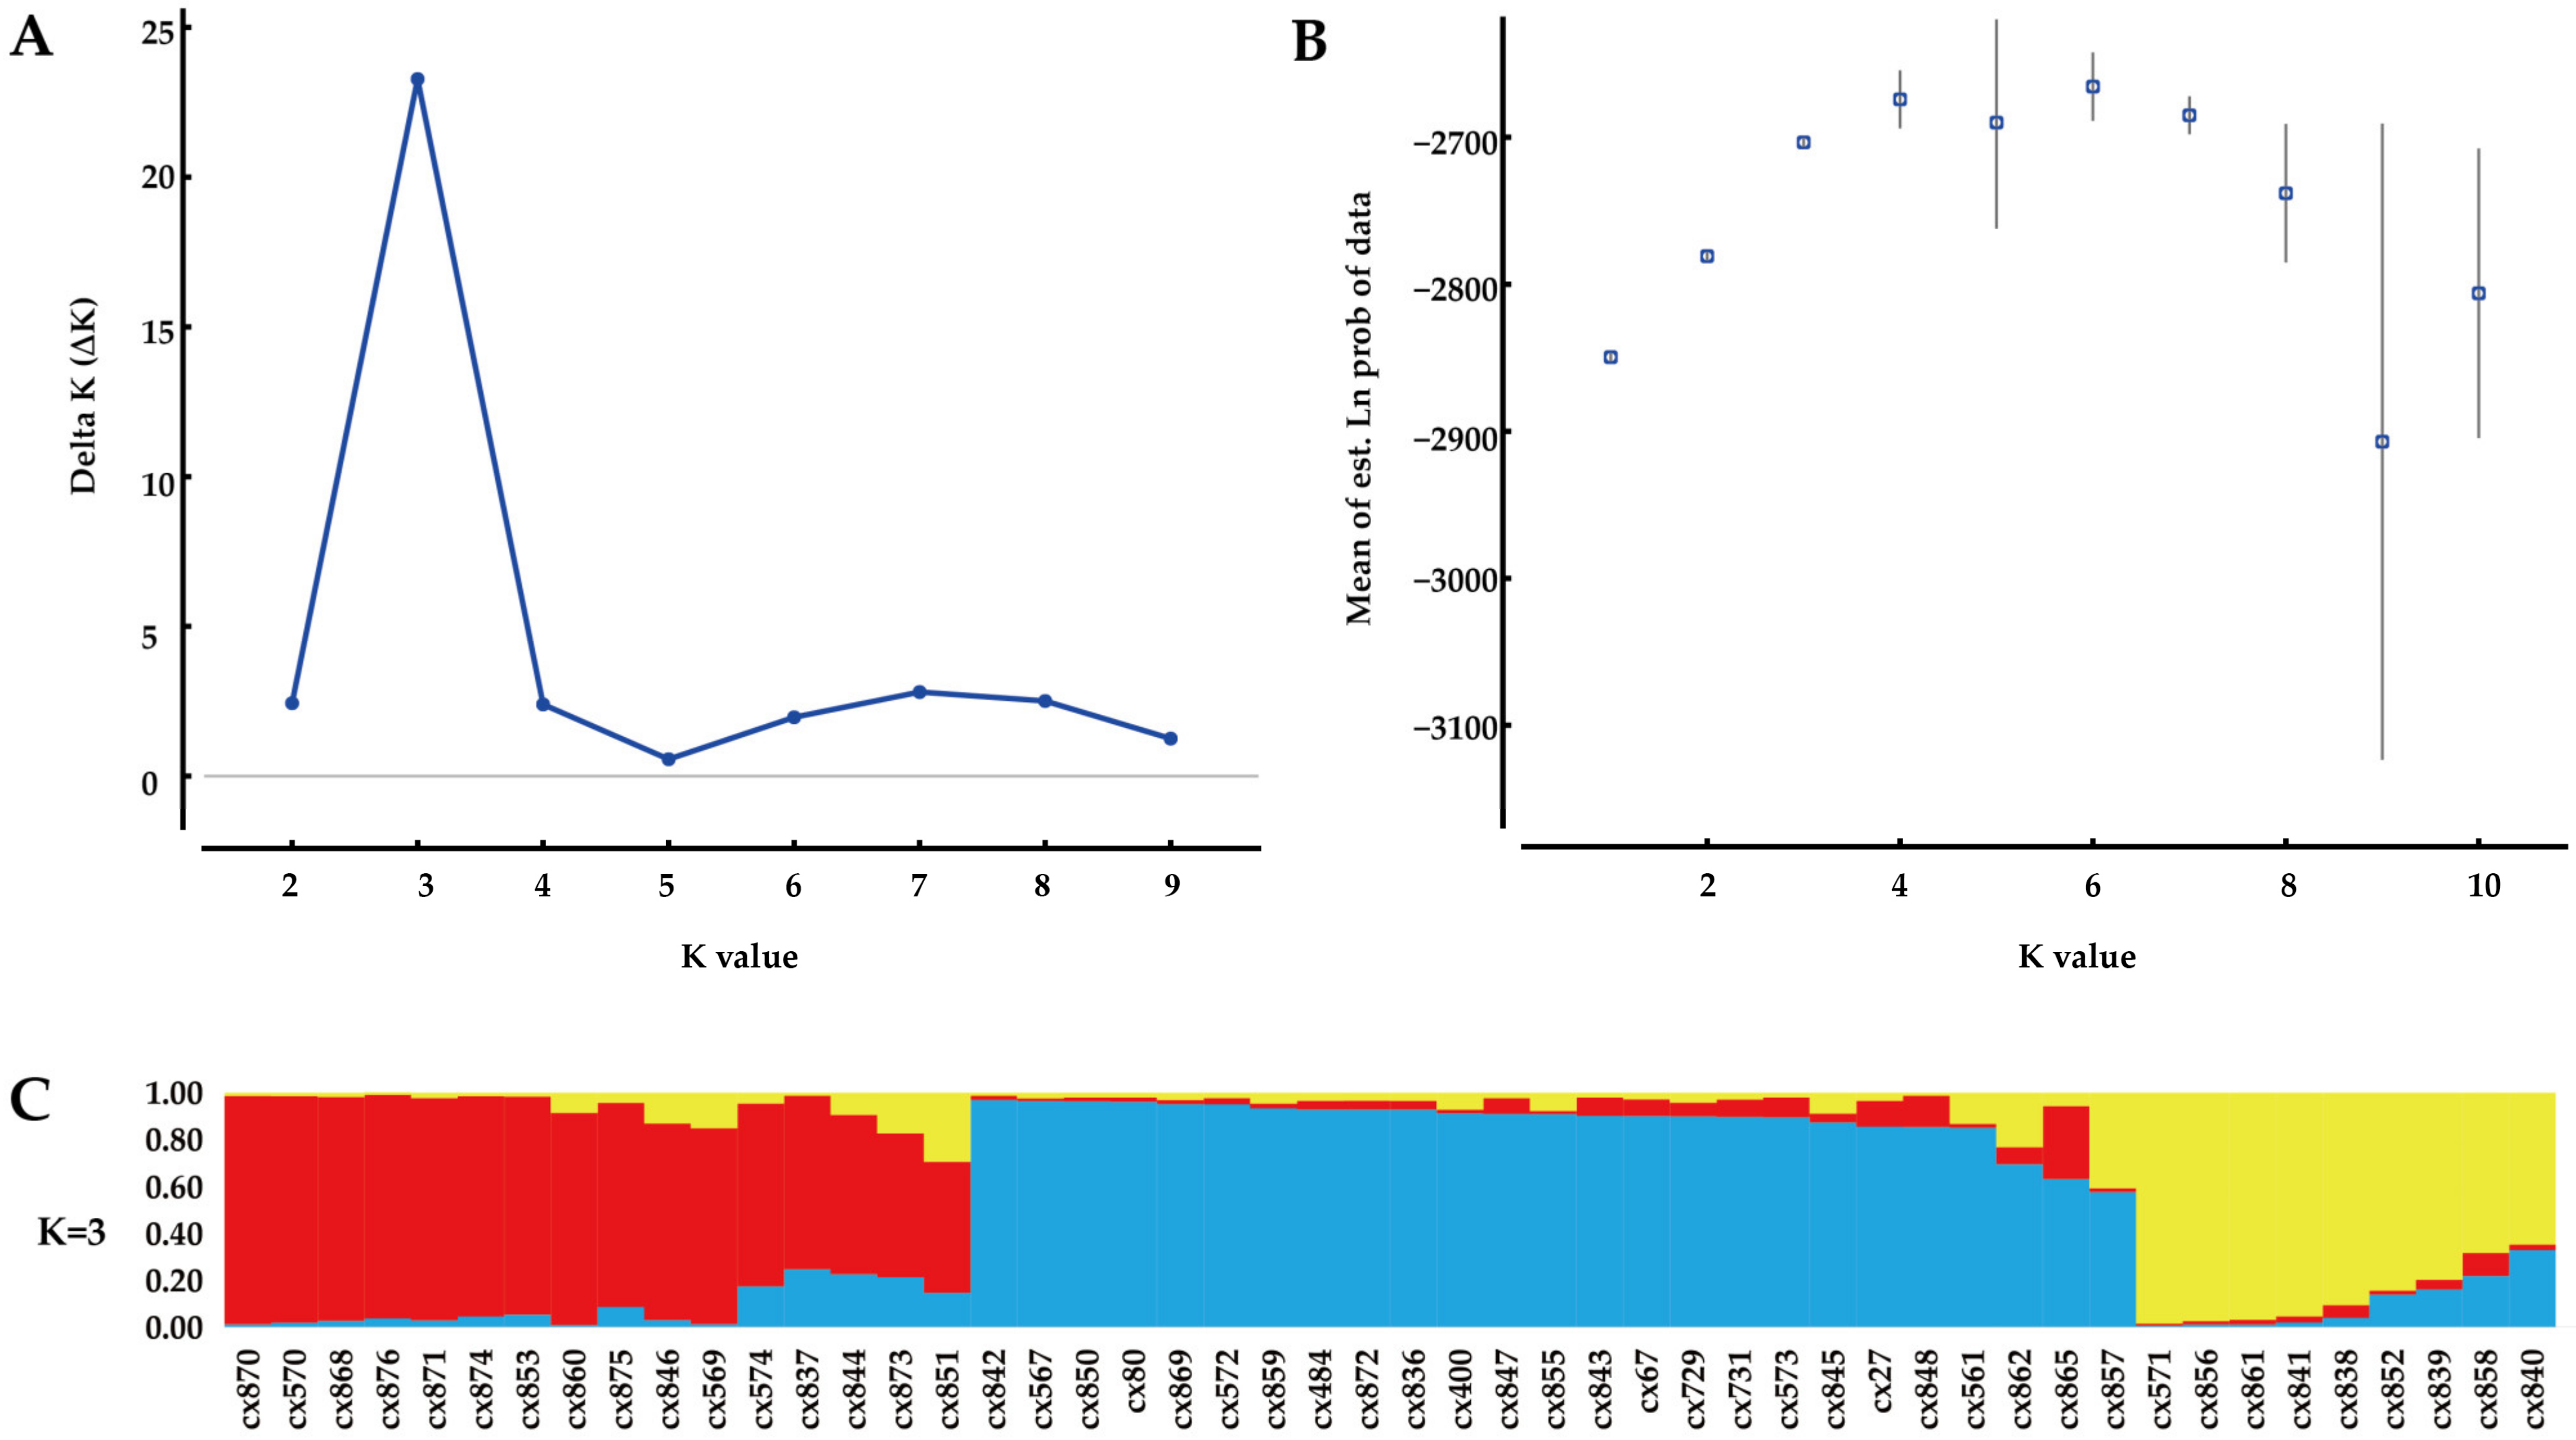
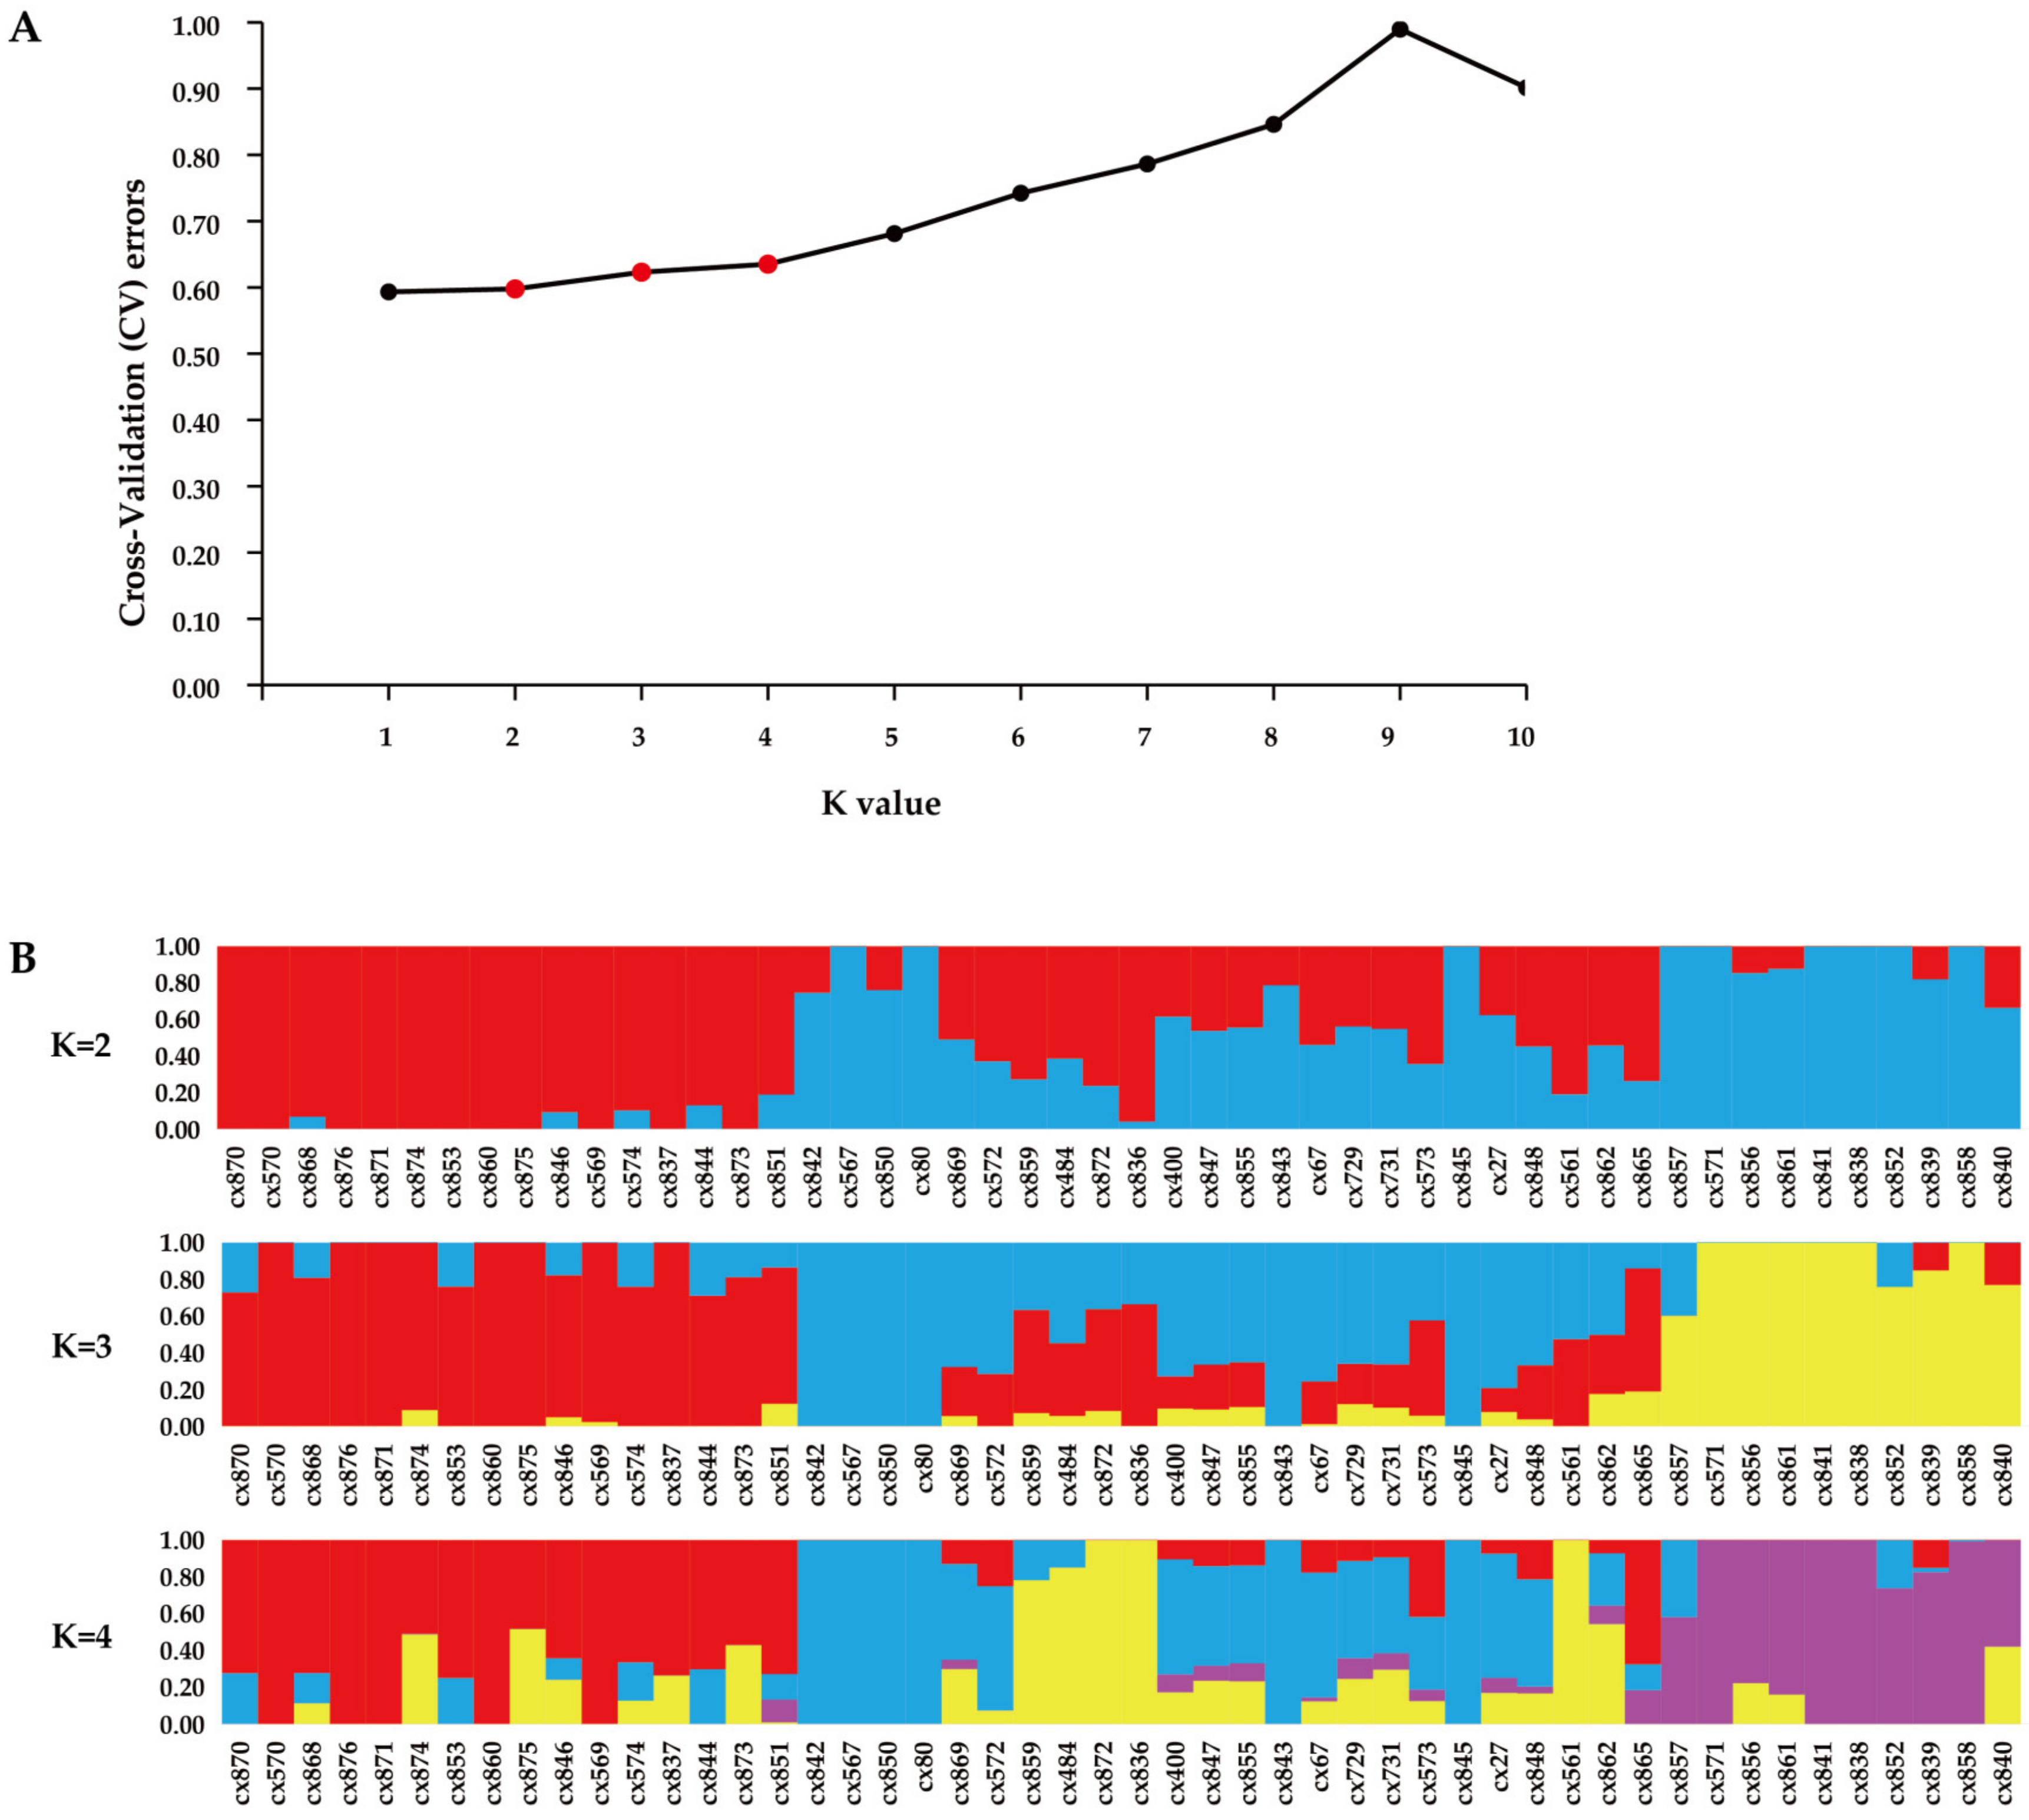
3.3. Genetic Structure Analysis

The genetic structure of the Chinese fir breeding population was analyzed using SSR and SNP data, respectively. For the SSR data, the genetic structure analysis revealed that, when K = 3, delta K reached a maximum value (Figure 4A,B), indicating that all individuals were assigned to three clusters (Figure 4C). The result of the structure analysis was broadly consistent with the dendrogram constructed by the relationship matrix (Figure 3A). For SNPs, the genetic cluster analysis applied in the ADMIXTURE program showed that a relatively low cross-validation (CV) error was observed when K = 2, 3, or 4 (Figure 5A). When K = 2 (Figure 5B), most individuals in the larger pan-relational group were assigned to the same genetic group, while individuals in the other pan-relational group and the scatter set were assigned to another group. When K = 3 (Figure 5B), the fifty individuals were divided into three genetic groups, which largely overlapped with the grouping branch of the dendrogram (Figure 3B). When K = 4 (Figure 5B), a substructure appeared in one of the groups of K = 3, which was divided into two genetic clusters. The genetic structure analysis also showed that there was a high degree of admixture of different gene pools in many individuals (Figure 4C and Figure 5B).

4. Discussion

Although documented pedigree information provides breeders with a simple way to assess genetic relatedness among breeding materials, reliable and detailed pedigree records are unavailable under some circumstances. Molecular markers, as an efficient alternative, are now widely applied in the estimation of genetic relationships in many plants [15,18,61,62,63]. However, some of the markers have encountered difficulties in inferring genetic relationships between relatives due to their low discriminating ability and poor stability [18,61,64]. SSRs and SNPs are always recognized as powerful tools to discriminate intraspecific genetic relationships, even among closely related genotypes [20,21,22,23,24,25]. In the present study, the integration of pedigree and molecular information was implemented for the first time in order to reveal genetic relatedness among breeding materials in Chinese fir. More precisely, it was investigated if similar genetic relationships among the parents could be revealed by two molecular markers (SSR and SNP markers) and whether the observed genetic relationship patterns reflected the recorded pedigree relationships.
Our bivariate analysis revealed that relatedness coefficients estimated based on SSRs and SNPs were significantly correlated (r = 0.690, p-value < 0.01), indicating a piece of analogous information about the genetic relationships among the parents based on the two molecular markers. Furthermore, the heatmaps (Figure 3) generated by the SSR- and SNP-based coefficient matrices showed similar cluster results. In addition, STRUCTURE and ADMIXTURE analyses based on the two markers also revealed a parallel genetic structure pattern. These results indicated that the ability of SSRs to evaluate genetic relationships was similar to that of SNPs, which has also been confirmed in many crops, such as barley [27], maize [28], grape [65], and pea [33]. When compared to the documented pedigree relatedness, most of the pairs of two individuals with close genetic relationships in pedigree records always showed a relatively high relatedness coefficient (Table S3). Moreover, they were grouped into the same genetic clusters in the heatmaps (Figure 3), STRUCTURE (Figure 4), and ADMIXTURE analysis (Figure 5). For instance, the offspring of ‘cx569’ and ‘cx574’ were grouped into the same genetic cluster. Likewise, ‘cx571’ and its offspring were also clustered into the same genetic group. These results demonstrated that genetic relationships calculated based on SSRs and SNPs were broadly correlated with documented pedigree relatedness. Similar to the present study, previous comparisons indicated that genetic relationships generated based on molecular information reflect largely recorded pedigree relatedness [14,66]. DNA markers can directly assess genetic relatedness among breeding materials at the DNA sequence level by estimating the proportion of alleles that are alike in state [14]. Among the markers, SSRs are highly variable and often present high levels of inter- and intraspecific polymorphism [67]. This is because alleles of SSRs with size differences as small as 1 bp can be precisely distinguished, and each allele’s size can be accurately and automatically detected, whereas SNPs are the most abundant markers in the genome [24,68]. Here, we concluded that SSRs and SNPs are suited for genetic relationship estimation when complete pedigree records are not available in Chinese fir.
Estimating genetic relationships is fundamental for breeding [2]. Given the strong discrimination ability of the two markers, they were used to infer genetic relationships among the Chinese fir individuals that lacked detailed pedigree records. For instance, both markers indicated that ‘cx80’, ‘cx567’, ‘cx845’, and ‘cx857’ were very closely related. Similarity in close relatedness was found between ‘cx844’ and ‘cx846’. Except for genetic relationships, understanding the level of genetic diversity is essential for breeding programs because genetic variation is the foundation of population adaptability, biotic and abiotic resistance, and sustainability [69]. Previous studies on genetic diversity based on molecular markers demonstrate that the Chinese fir breeding population has a wide genetic base [24,39,42,45,70]. Here, the genetic diversity parameter calculated by using SSR and SNP datasets was similar to those reported in previous studies. To be more specific, the estimated parameters of mean PIC values (SSRs: PIC = 0.573, SNPs: PIC = 0.231) were comparable to previously published studies (SSR- and SNP-based PIC values ranged from 0.530 to 0.573 and from 0.2100 to 0.2265, respectively) [24,39,42,45,70]. This indicated that the selected 50 elite Chinese fir individuals had a relatively wide genetic base.
These outcomes can help us develop an optimal design for Chinese fir breeding programs. Intra-species heterosis could thereby be attained through the crossing of genetically different parents. Furthermore, the breeders could update the breeding population with fewer redundant contributors (parent trees), largely avoiding inbreeding and/or depression events. Specifically, when combined with the pedigree and phenotype data and the offspring testing result, cx840 should be highlighted over its relatives (cx569, cx837, cx851, cx860, and cx865) in the next breeding program (unpublished data).

5. Conclusions

In the present study, the results derived from SSR and SNP datasets showed a similar pattern of genetic relationships in the elite Chinese fir breeding population. Meanwhile, the genetic relationships revealed by the two molecular markers broadly confirmed the documented pedigree relatedness. These results indicated that SSRs and SNPs could serve as effective tools to assess the genetic relationships and diversity of the Chinese fir breeding population. Then, the genetic relationships of the individuals without detailed pedigree records were distinguished based on the two markers. Furthermore, the two markers revealed the relatively wide genetic variation of the breeding population. SSR and SNP markers provide valuable information on genetic relatedness and diversity in Chinese fir germplasm resources. This investigation will provide important input to breeders for the further progress of Chinese-fir breeding programs.

Supplementary Materials

The following supporting information can be downloaded at: https://www.mdpi.com/article/10.3390/f14020347/s1, Table S1: Genetic parameters generated by 21 SSR markers on Chinese fir parent trees (n = 50); Table S2: Genetic parameters generated by 41,864 SNP markers on Chinese fir parent trees (n = 50); Table S3: Pairwise relationship coefficients for the Chinese fir parent trees (n = 50) based on SSR and SNP markers, respectively.

Author Contributions

Experimental, data analysis, and writing—original draft preparation, W.Z.; data analysis and writing—original draft preparation, Y.S.; experimental and analysis work, R.H., D.H. and S.H.; conceptualization, experimental, and writing—review and editing, H.Z. All authors have read and agreed to the published version of the manuscript.

Funding

This research was funded by the National Natural Science Foundation of China (No. 31972956), the Key-Area Research and Development Program of Guangdong Province (No. 2020B020215001), and the National Key Research and Development Plan Project Sub-Subject (No. 2022YFD2200201-6).

Institutional Review Board Statement

Not applicable.

Informed Consent Statement

Not applicable.

Data Availability Statement

Data are available for research upon request.

Conflicts of Interest

The authors declare no conflict of interest.

References

  1. Sethuraman, A. Estimating genetic relatedness in admixed populations. G3-Genes Genomes Genet. 2018, 8, 3203–3220. [Google Scholar] [CrossRef] [PubMed]
  2. Hall, D.; Zhao, W.; Wennstrom, U.; Gull, B.A.; Wang, X.R. Parentage and relatedness reconstruction in Pinus sylvestris using genotyping-by-sequencing. Heredity 2020, 124, 633–646. [Google Scholar] [CrossRef] [PubMed]
  3. Hayes, B.J.; Visscher, P.M.; Goddard, M.E. Increased accuracy of artificial selection by using the realized relationship matrix. Genet. Res. 2009, 91, 47–60. [Google Scholar] [CrossRef] [PubMed]
  4. Allendorf, F.W.; Hohenlohe, P.A.; Luikart, G. Genomics and the future of conservation genetics. Nat. Rev. Genet. 2010, 11, 697–709. [Google Scholar] [CrossRef]
  5. Wang, J.L. Effects of sampling close relatives on some elementary population genetics analyses. Mol. Ecol. Resour. 2018, 18, 41–54. [Google Scholar] [CrossRef]
  6. Yang, B.N.; Sun, H.H.; Qi, J.D.; Niu, S.H.; El-Kassaby, Y.A.; Li, W. Improved genetic distance-based spatial deployment can effectively minimize inbreeding in seed orchard. For. Ecosyst. 2020, 7, 11. [Google Scholar] [CrossRef]
  7. Howard, N.P.; Peace, C.; Silverstein, K.A.T.; Poets, A.; Luby, J.J.; Vanderzande, S.; Durel, C.E.; Muranty, H.; Denance, C.; van de Weg, E. The use of shared haplotype length information for pedigree reconstruction in asexually propagated outbreeding crops, demonstrated for apple and sweet cherry. Hortic. Res. 2021, 8, 202. [Google Scholar] [CrossRef]
  8. Yang, B.N.; Niu, S.H.; El-Kassaby, Y.A.; Li, W. Monitoring genetic diversity across Pinus tabuliformis seed orchard generations using SSR markers. Can. J. Forest. Res. 2021, 51, 1534–1540. [Google Scholar] [CrossRef]
  9. Liesebach, H.; Liepe, K.; Baucker, C. Towards new seed orchard designs in Germany—A review. Silvae Genet. 2021, 70, 84–98. [Google Scholar] [CrossRef]
  10. Keller, L.F.; Waller, D.M. Inbreeding effects in wild populations. Trends Ecol. Evol. 2002, 17, 230–241. [Google Scholar] [CrossRef]
  11. White, T.L.; Adams, W.T.; Neale, D.B. Forest Genetics; CABI Publishing: Wallingford, UK, 2007. [Google Scholar]
  12. Doerksen, T.K.; Bousquet, J.; Beaulieu, J. Inbreeding depression in intra-provenance crosses driven by founder relatedness in white spruce. Tree Genet. Genomes 2014, 10, 203–212. [Google Scholar] [CrossRef]
  13. Ford, G.A.; McKeand, S.E.; Jett, J.B.; Isik, F. Effects of inbreeding on growth and quality traits in loblolly pine. For. Sci. 2015, 61, 579–585. [Google Scholar] [CrossRef]
  14. Van Becelaere, G.; Lubbers, E.L.; Paterson, A.H.; Chee, P.W. Pedigree- vs. DNA marker-based genetic similarity estimates in cotton. Crop Sci. 2005, 45, 2281–2287. [Google Scholar] [CrossRef]
  15. Yang, J.J.; Zhang, J.; Du, H.S.; Zhao, H.; Mao, A.J.; Zhang, X.F.; Jiang, L.; Zhang, H.Y.; Wen, C.L.; Xu, Y. Genetic relationship and pedigree of Chinese watermelon varieties based on diversity of perfect SNPs. Hortic. Plant J. 2022, 8, 489–498. [Google Scholar] [CrossRef]
  16. Gao, J.M.; Zhang, S.G.; Qi, L.W.; Zhang, Y.; Wang, C.G.; Song, W.Q. ISSR and AFLP identification and genetic relationships of Chinese elite accessions from the genus Populus. Ann. For. Sci. 2006, 63, 499–506. [Google Scholar] [CrossRef]
  17. Li, X.Y.; Xu, H.X.; Chen, J.W. Genetic diversity and relationships among 47 loquat varieties revealed by EST-SSR markers. Sci. Hortic. 2013, 160, 375–382. [Google Scholar] [CrossRef]
  18. Amom, T.; Tikendra, L.; Apana, N.; Goutam, M.; Sonia, P.; Koijam, A.S.; Potshangbam, A.M.; Rahaman, H.; Nongdam, P. Efficiency of RAPD, ISSR, iPBS, SCoT and phytochemical markers in the genetic relationship study of five native and economical important bamboos of North-East India. Phytochemistry 2020, 174, 112330. [Google Scholar] [CrossRef]
  19. Jiang, K.B.; Xie, H.; Liu, T.Y.; Liu, C.X.; Huang, S.W. Genetic diversity and population structure in Castanopsis fissa revealed by analyses of sequence-related amplified polymorphism (SRAP) markers. Tree Genet. Genomes 2020, 16, 52. [Google Scholar] [CrossRef]
  20. Han, Z.Q.; Gao, P.; Geng, X.N.; Du, K.; Kang, X.Y. Identification of the male parent of superior half-sib Populus tomentosa individuals based on SSR markers. Mol. Breed. 2017, 37, 155. [Google Scholar] [CrossRef]
  21. Tsykun, T.; Rellstab, C.; Dutech, C.; Sipos, G.; Prospero, S. Comparative assessment of SSR and SNP markers for inferring the population genetic structure of the common fungus Armillaria cepistipes. Heredity 2017, 119, 371–380. [Google Scholar] [CrossRef]
  22. Ramesh, P.; Mallikarjuna, G.; Sameena, S.; Kumar, A.; Gurulakshmi, K.; Reddy, B.V.; Reddy, P.C.O.; Sekhar, A.C. Advancements in molecular marker technologies and their applications in diversity studies. J. Biosci. 2020, 45, 123. [Google Scholar] [CrossRef] [PubMed]
  23. Agarwal, M.; Shrivastava, N.; Padh, H. Advances in molecular marker techniques and their applications in plant sciences. Plant Cell Rep. 2008, 27, 617–631. [Google Scholar] [CrossRef] [PubMed]
  24. Zheng, H.Q.; Hu, D.H.; Wei, R.P.; Yan, S.; Wang, R.H. Chinese fir breeding in the high-throughput sequencing era: Insights from SNPs. Forests 2019, 10, 681. [Google Scholar] [CrossRef]
  25. Howe, G.T.; Jayawickrama, K.; Kolpak, S.E.; Kling, J.; Trappe, M.; Hipkins, V.; Ye, T.; Guida, S.; Cronn, R.; Cushman, S.A.; et al. An Axiom SNP genotyping array for Douglas-fir. BMC Genom. 2020, 21, 9. [Google Scholar] [CrossRef] [PubMed]
  26. Capo-Chichi, L.J.A.; Elakhdar, A.; Kubo, T.; Nyachiro, J.; Juskiw, P.; Capettini, F.; Slaski, J.J.; Ramirez, G.H.; Beattie, A.D. Genetic diversity and population structure assessment of Western Canadian barley cooperative trials. Front. Plant Sci. 2022, 13, 1006719. [Google Scholar] [CrossRef]
  27. Varshney, R.K.; Chabane, K.; Hendre, P.S.; Aggarwal, R.K.; Graner, A. Comparative assessment of EST-SSR, EST-SNP and AFLP markers for evaluation of genetic diversity and conservation of genetic resources using wild, cultivated and elite barleys. Plant Sci. 2007, 173, 638–649. [Google Scholar] [CrossRef]
  28. Yang, X.H.; Xu, Y.B.; Shah, T.; Li, H.H.; Han, Z.H.; Li, J.S.; Yan, J.B. Comparison of SSRs and SNPs in assessment of genetic relatedness in maize. Genetica 2011, 139, 1045–1054. [Google Scholar] [CrossRef]
  29. Amar, M.H.; Biswas, M.K.; Zhang, Z.W.; Guo, W.W. Exploitation of SSR, SRAP and CAPS-SNP markers for genetic diversity of Citrus germplasm collection. Sci. Hortic. 2011, 128, 220–227. [Google Scholar] [CrossRef]
  30. Singh, N.; Choudhury, D.R.; Singh, A.K.; Kumar, S.; Srinivasan, K.; Tyagi, R.K.; Singh, N.K.; Singh, R. Comparison of SSR and SNP markers in estimation of genetic diversity and population structure of Indian rice varieties. PLoS ONE 2013, 8, e84136. [Google Scholar] [CrossRef]
  31. Garcia, C.; Guichoux, E.; Hampe, A. A comparative analysis between SNPs and SSRs to investigate genetic variation in a juniper species (Juniperus phoenicea ssp. turbinata). Tree Genet. Genomes 2018, 14, 87. [Google Scholar] [CrossRef]
  32. Kimaro, D.; Melis, R.; Sibiya, J.; Shimelis, H.; Shayanowako, A. Analysis of genetic diversity and population structure of pigeonpea [Cajanus cajan (L.) Millsp] accessions using SSR markers. Plants 2020, 9, 1643. [Google Scholar] [CrossRef]
  33. Zavinon, F.; Adoukonou-Sagbadja, H.; Keilwagen, J.; Lehnert, H.; Ordon, F.; Perovic, D. Genetic diversity and population structure in Beninese pigeon pea Cajanus cajan (L.) Huth landraces collection revealed by SSR and genome wide SNP markers. Genet. Resour. Crop Evol. 2020, 67, 191–208. [Google Scholar] [CrossRef]
  34. Duan, H.J.; Hu, D.H.; Li, Y.; Zheng, H.Q. Characterization of a collection of Chinese fir elite genotypes using sequence-related amplified polymorphism markers. J. For. Res. 2016, 27, 1105–1110. [Google Scholar] [CrossRef]
  35. Fung, L.E. Wood properties of New Zealand-grown Cunninghamia lanceolata. N. Z. J. For. Sci. 1993, 23, 324–338. [Google Scholar]
  36. Tran, B.D.; Le, T.N.H. A review of Cunninghamia lanceolata (Lamb.) Hook: A recent update and potential application in Vietnam. Vietnam. J. Agric. Sci. 2020, 3, 892–902. [Google Scholar] [CrossRef]
  37. Farooq, T.H.; Yan, W.; Rashid, M.H.U.; Tigabu, M.; Gilani, M.M.; Zou, X.H.; Wu, P.F. Chinese fir (Cunninghamia Lanceolata) a green gold of China with continues decline in its productivity over the successive rotations: A review. Appl. Ecol. Environ. Res. 2019, 17, 11055–11067. [Google Scholar] [CrossRef]
  38. Li, M.; Chen, X.Z.; Huang, M.S.; Wu, P.F.; Ma, X.Q. Genetic diversity and relationships of ancient Chinese fir (Cunninghamia lanceolata) genotypes revealed by sequence-related amplified polymorphism markers. Genet. Resour. Crop Evol. 2017, 64, 1087–1099. [Google Scholar] [CrossRef]
  39. Lin, E.P.; Zhuang, H.B.; Yu, J.J.; Liu, X.Y.; Huang, H.H.; Zhu, M.Y.; Tong, Z.K. Genome survey of Chinese fir (Cunninghamia lanceolata): Identification of genomic SSRs and demonstration of their utility in genetic diversity analysis. Sci. Rep. 2020, 10, 4698. [Google Scholar] [CrossRef]
  40. Duan, H.J.; Hu, R.Y.; Wu, B.; Chen, D.X.; Huang, K.Y.; Dai, J.; Chen, Q.; Wei, Z.C.; Cao, S.; Sun, Y.H.; et al. Genetic characterization of red-colored heartwood genotypes of Chinese fir using simple sequence repeat (SSR) markers. Genet. Mol. Res. 2015, 14, 18552–18561. [Google Scholar] [CrossRef]
  41. Zheng, H.Q.; Duan, H.J.; Hu, D.H.; Wei, R.P.; Li, Y. Sequence-related amplified polymorphism primer screening on Chinese fir (Cunninghamia lanceolata (Lamb.) Hook). J. For. Res. 2015, 26, 101–106. [Google Scholar] [CrossRef]
  42. Duan, H.J.; Cao, S.; Zheng, H.Q.; Hu, D.H.; Lin, J.; Cui, B.B.; Lin, H.Z.; Hu, R.Y.; Wu, B.; Sun, Y.H.; et al. Genetic characterization of Chinese fir from six provinces in Southern China and construction of a core collection. Sci. Rep. 2017, 7, 13814. [Google Scholar] [CrossRef] [PubMed]
  43. Yang, B.Q.; Hu, D.H.; Zheng, H.Q.; Liu, W.X.; Lü, Y.Z. Preliminary study on anthracnose resistance of Chinese fir third-generation seed orchard parents. Subtrop. Plant Sci. 2020, 49, 196–199. [Google Scholar] [CrossRef]
  44. Wang, R.H.; Hu, D.H.; Wei, R.P.; Yan, S.; Zheng, H.Q. Early evaluation and selection of the Chinese fir breeding parents based on growth and cone production traits. J. Trop. Subtrop. Bot. 2022, 30, 195–201. [Google Scholar] [CrossRef]
  45. Wen, Y.; Ueno, S.; Han, W.; Tsumura, Y. Development and characterization of 28 polymorphic EST-SSR markers for Cunninghamia lanceolata (Taxodiaceae) based on transcriptome sequences. Silvae Genet. 2013, 62, 137–141. [Google Scholar] [CrossRef]
  46. Sun, X.W.; Liu, D.Y.; Zhang, X.F.; Li, W.B.; Liu, H.; Hong, W.G.; Jiang, C.B.; Guan, N.; Ma, C.X.; Zeng, H.P.; et al. SLAF-seq: An efficient method of large-scale de novo SNP discovery and genotyping using high-throughput sequencing. PLoS ONE 2013, 8, e58700. [Google Scholar] [CrossRef]
  47. Li, H.; Durbin, R. Fast and accurate short read alignment with Burrows-Wheeler transform. Bioinformatics 2009, 25, 1754–1760. [Google Scholar] [CrossRef]
  48. McKenna, A.; Hanna, M.; Banks, E.; Sivachenko, A.; Cibulskis, K.; Kernytsky, A.; Garimella, K.; Altshuler, D.; Gabriel, S.; Daly, M.; et al. The genome analysis Toolkit: A MapReduce framework for analyzing next-generation DNA sequencing data. Genome Res. 2010, 20, 1297–1303. [Google Scholar] [CrossRef]
  49. Li, H.; Handsaker, B.; Wysoker, A.; Fennell, T.; Ruan, J.; Homer, N.; Marth, G.; Abecasis, G.; Durbin, R.; Genome Project Data, P. The Sequence Alignment/Map format and SAMtools. Bioinformatics 2009, 25, 2078–2079. [Google Scholar] [CrossRef]
  50. Purcell, S.; Neale, B.; Todd-Brown, K.; Thomas, L.; Ferreira, M.A.R.; Bender, D.; Maller, J.; Sklar, P.; de Bakker, P.I.W.; Daly, M.J.; et al. PLINK: A tool set for whole-genome association and population-based linkage analyses. Am. J. Hum. Genet. 2007, 81, 559–575. [Google Scholar] [CrossRef]
  51. Lynch, M.; Ritland, K. Estimation of pairwise relatedness with molecular markers. Genetics 1999, 152, 1753–1766. [Google Scholar] [CrossRef]
  52. Peakall, R.; Smouse, P.E. GENALEX 6: Genetic analysis in Excel. Population genetic software for teaching and research. Mol. Ecol. Notes 2006, 6, 288–295. [Google Scholar] [CrossRef]
  53. Pritchard, J.K.; Stephens, M.; Rosenberg, N.A.; Donnelly, P. Association mapping in structured populations. Am. J. Hum. Genet. 2000, 67, 170–181. [Google Scholar] [CrossRef]
  54. Earl, D.A.; Vonholdt, B.M. STRUCTURE HARVESTER: A website and program for visualizing STRUCTURE output and implementing the Evanno method. Conserv. Genet. Resour. 2012, 4, 359–361. [Google Scholar] [CrossRef]
  55. Jakobsson, M.; Rosenberg, N.A. CLUMPP: A cluster matching and permutation program for dealing with label switching and multimodality in analysis of population structure. Bioinformatics 2007, 23, 1801–1806. [Google Scholar] [CrossRef]
  56. Liu, K.J.; Muse, S.V. PowerMarker: An integrated analysis environment for genetic marker analysis. Bioinformatics 2005, 21, 2128–2129. [Google Scholar] [CrossRef]
  57. Yang, J.A.; Lee, S.H.; Goddard, M.E.; Visscher, P.M. GCTA: A tool for genome-wide complex trait analysis. Am. J. Hum. Genet. 2011, 88, 76–82. [Google Scholar] [CrossRef]
  58. Alexander, D.H.; Novembre, J.; Lange, K. Fast model-based estimation of ancestry in unrelated individuals. Genome Res. 2009, 19, 1655–1664. [Google Scholar] [CrossRef]
  59. Alexander, D.H.; Lange, K. Enhancements to the ADMIXTURE algorithm for individual ancestry estimation. BMC Bioinform. 2011, 12, 246. [Google Scholar] [CrossRef]
  60. Gruber, B.; Unmack, P.J.; Berry, O.F.; Georges, A. dartr: An r package to facilitate analysis of SNP data generated from reduced representation genome sequencing. Mol. Ecol. Resour. 2018, 18, 691–699. [Google Scholar] [CrossRef]
  61. Bessega, C.; Saidman, B.O.; Darquier, M.R.; Ewens, M.; Felker, P.; Vilardi, J.C. Accuracy of dominant markers for estimation of relatedness and heritability in an experimental stand of Prosopis alba (Leguminosae). Tree Genet. Genomes 2011, 7, 103–115. [Google Scholar] [CrossRef]
  62. Jia, S.Z.; Yan, Z.M.; Wang, Y.H.; Wei, Y.; Xie, Z.Q.; Zhang, F. Genetic diversity and relatedness among ornamental purslane (Portulaca L.) accessions unraveled by SRAP markers. 3 Biotech 2017, 7, 241. [Google Scholar] [CrossRef] [PubMed]
  63. Xue, Y.Q.; Liu, R.; Xue, J.Q.; Wang, S.L.; Zhang, X.X. Genetic diversity and relatedness analysis of nine wild species of tree peony based on simple sequence repeats markers. Hortic. Plant J. 2021, 7, 579–588. [Google Scholar] [CrossRef]
  64. Powell, W.; Morgante, M.; Andre, C.; Hanafey, M.; Vogel, J.; Tingey, S.; Rafalski, A. The comparison of RFLP, RAPD, AFLP and SSR (microsatellite) markers for germplasm analysis. Mol. Breed. 1996, 2, 225–238. [Google Scholar] [CrossRef]
  65. Emanuelli, F.; Lorenzi, S.; Grzeskowiak, L.; Catalano, V.; Stefanini, M.; Troggio, M.; Myles, S.; Martinez-Zapater, J.M.; Zyprian, E.; Moreira, F.M.; et al. Genetic diversity and population structure assessed by SSR and SNP markers in a large germplasm collection of grape. BMC Plant Biol. 2013, 13, 39. [Google Scholar] [CrossRef] [PubMed]
  66. Paczos-Grzeda, E. Pedigree, RAPD and simplified AFLP-based assessment of genetic relationships among Avena sativa L. cultivars. Euphytica 2004, 138, 13–22. [Google Scholar] [CrossRef]
  67. Huang, R.; Zeng, W.S.; Deng, H.Y.; Hu, D.H.; Wang, R.H.; Zheng, H.Q. Inbreeding in Chinese fir: Insight into the rare self-fertilizing event from a genetic view. Genes 2022, 13, 2105. [Google Scholar] [CrossRef]
  68. Govindaraj, M.; Vetriventhan, M.; Srinivasan, M. Importance of genetic diversity assessment in crop plants and its recent advances: An overview of its analytical perspectives. Genet. Res. Int. 2015, 2015, 431487. [Google Scholar] [CrossRef]
  69. Chen, X.B.; Sun, X.M.; Dong, L.M.; Zhang, S.G. Mating patterns and pollen dispersal in a Japanese larch (Larix kaempferi) clonal seed orchard: A case study. Sci. China Life Sci. 2018, 61, 1011–1023. [Google Scholar] [CrossRef]
  70. Huang, R.; Hu, D.H.; Deng, H.Y.; Wang, R.H.; Wei, R.P.; Yan, S.; Zheng, H.Q. SNPs-Based Assessment of Genetic Diversity and Genetic Structure in Elite Chinese Fir. Mol. Plant Breed. 2021. Available online: https://kns.cnki.net/kcms/detail/46.1068.S.20211130.1703.012.html (accessed on 1 December 2021).
Figure 1. Pedigree relationships of the fifty Chinese fir parent trees based on documented pedigree information. Parental and offspring relationships are indicated by arrows. Genetically related individuals without detailed pedigree records are marked with straight lines (e.g., cx852 and cx850). ♂ indicates a male parent, and ♀ indicates a female parent.
Forests 14 00347 g001
Figure 2. Distribution of pairwise relationship coefficients for the fifty Chinese fir parent trees based on SSR and SNP markers, respectively. The relatedness coefficient between paired parent trees is indicated on the x-axis, and the proportion of paired parent trees is shown on the y-axis.
Forests 14 00347 g002
Figure 3. The heatmap of genetic relationships among fifty Chinese fir parent trees based on (A) 21 SSR and (B) 41,864 SNP markers.
Forests 14 00347 g003
Figure 4. Genetic structure analysis of the fifty Chinese fir parent trees with the STRUCTURE program using 21 SSR loci. (A) Estimates of ΔK with respect to K; (B) the median and variance of the estimated probability value for each K value; and (C) genetic group structure when K = 3. Different colors represent different gene pools.
Forests 14 00347 g004
Figure 5. Genetic structure analysis of the fifty Chinese fir parent trees by admixture software using 41,864 SNP markers. (A) The estimated cross-validation errors for different grouping results (K value). The red circles represent a relatively low cross-validation (CV) error when K = 2, 3 or 4; and (B) genetic group structure when K = 2, 3, and 4. Different colors represent different gene pools.
Forests 14 00347 g005
Disclaimer/Publisher’s Note: The statements, opinions and data contained in all publications are solely those of the individual author(s) and contributor(s) and not of MDPI and/or the editor(s). MDPI and/or the editor(s) disclaim responsibility for any injury to people or property resulting from any ideas, methods, instructions or products referred to in the content.

