
Morphological, Histological, and Transcriptome Analysis of Doubled Haploid Plants in Poplars (Populus simonii × Populus nigra)

 ,
,  , and
, and 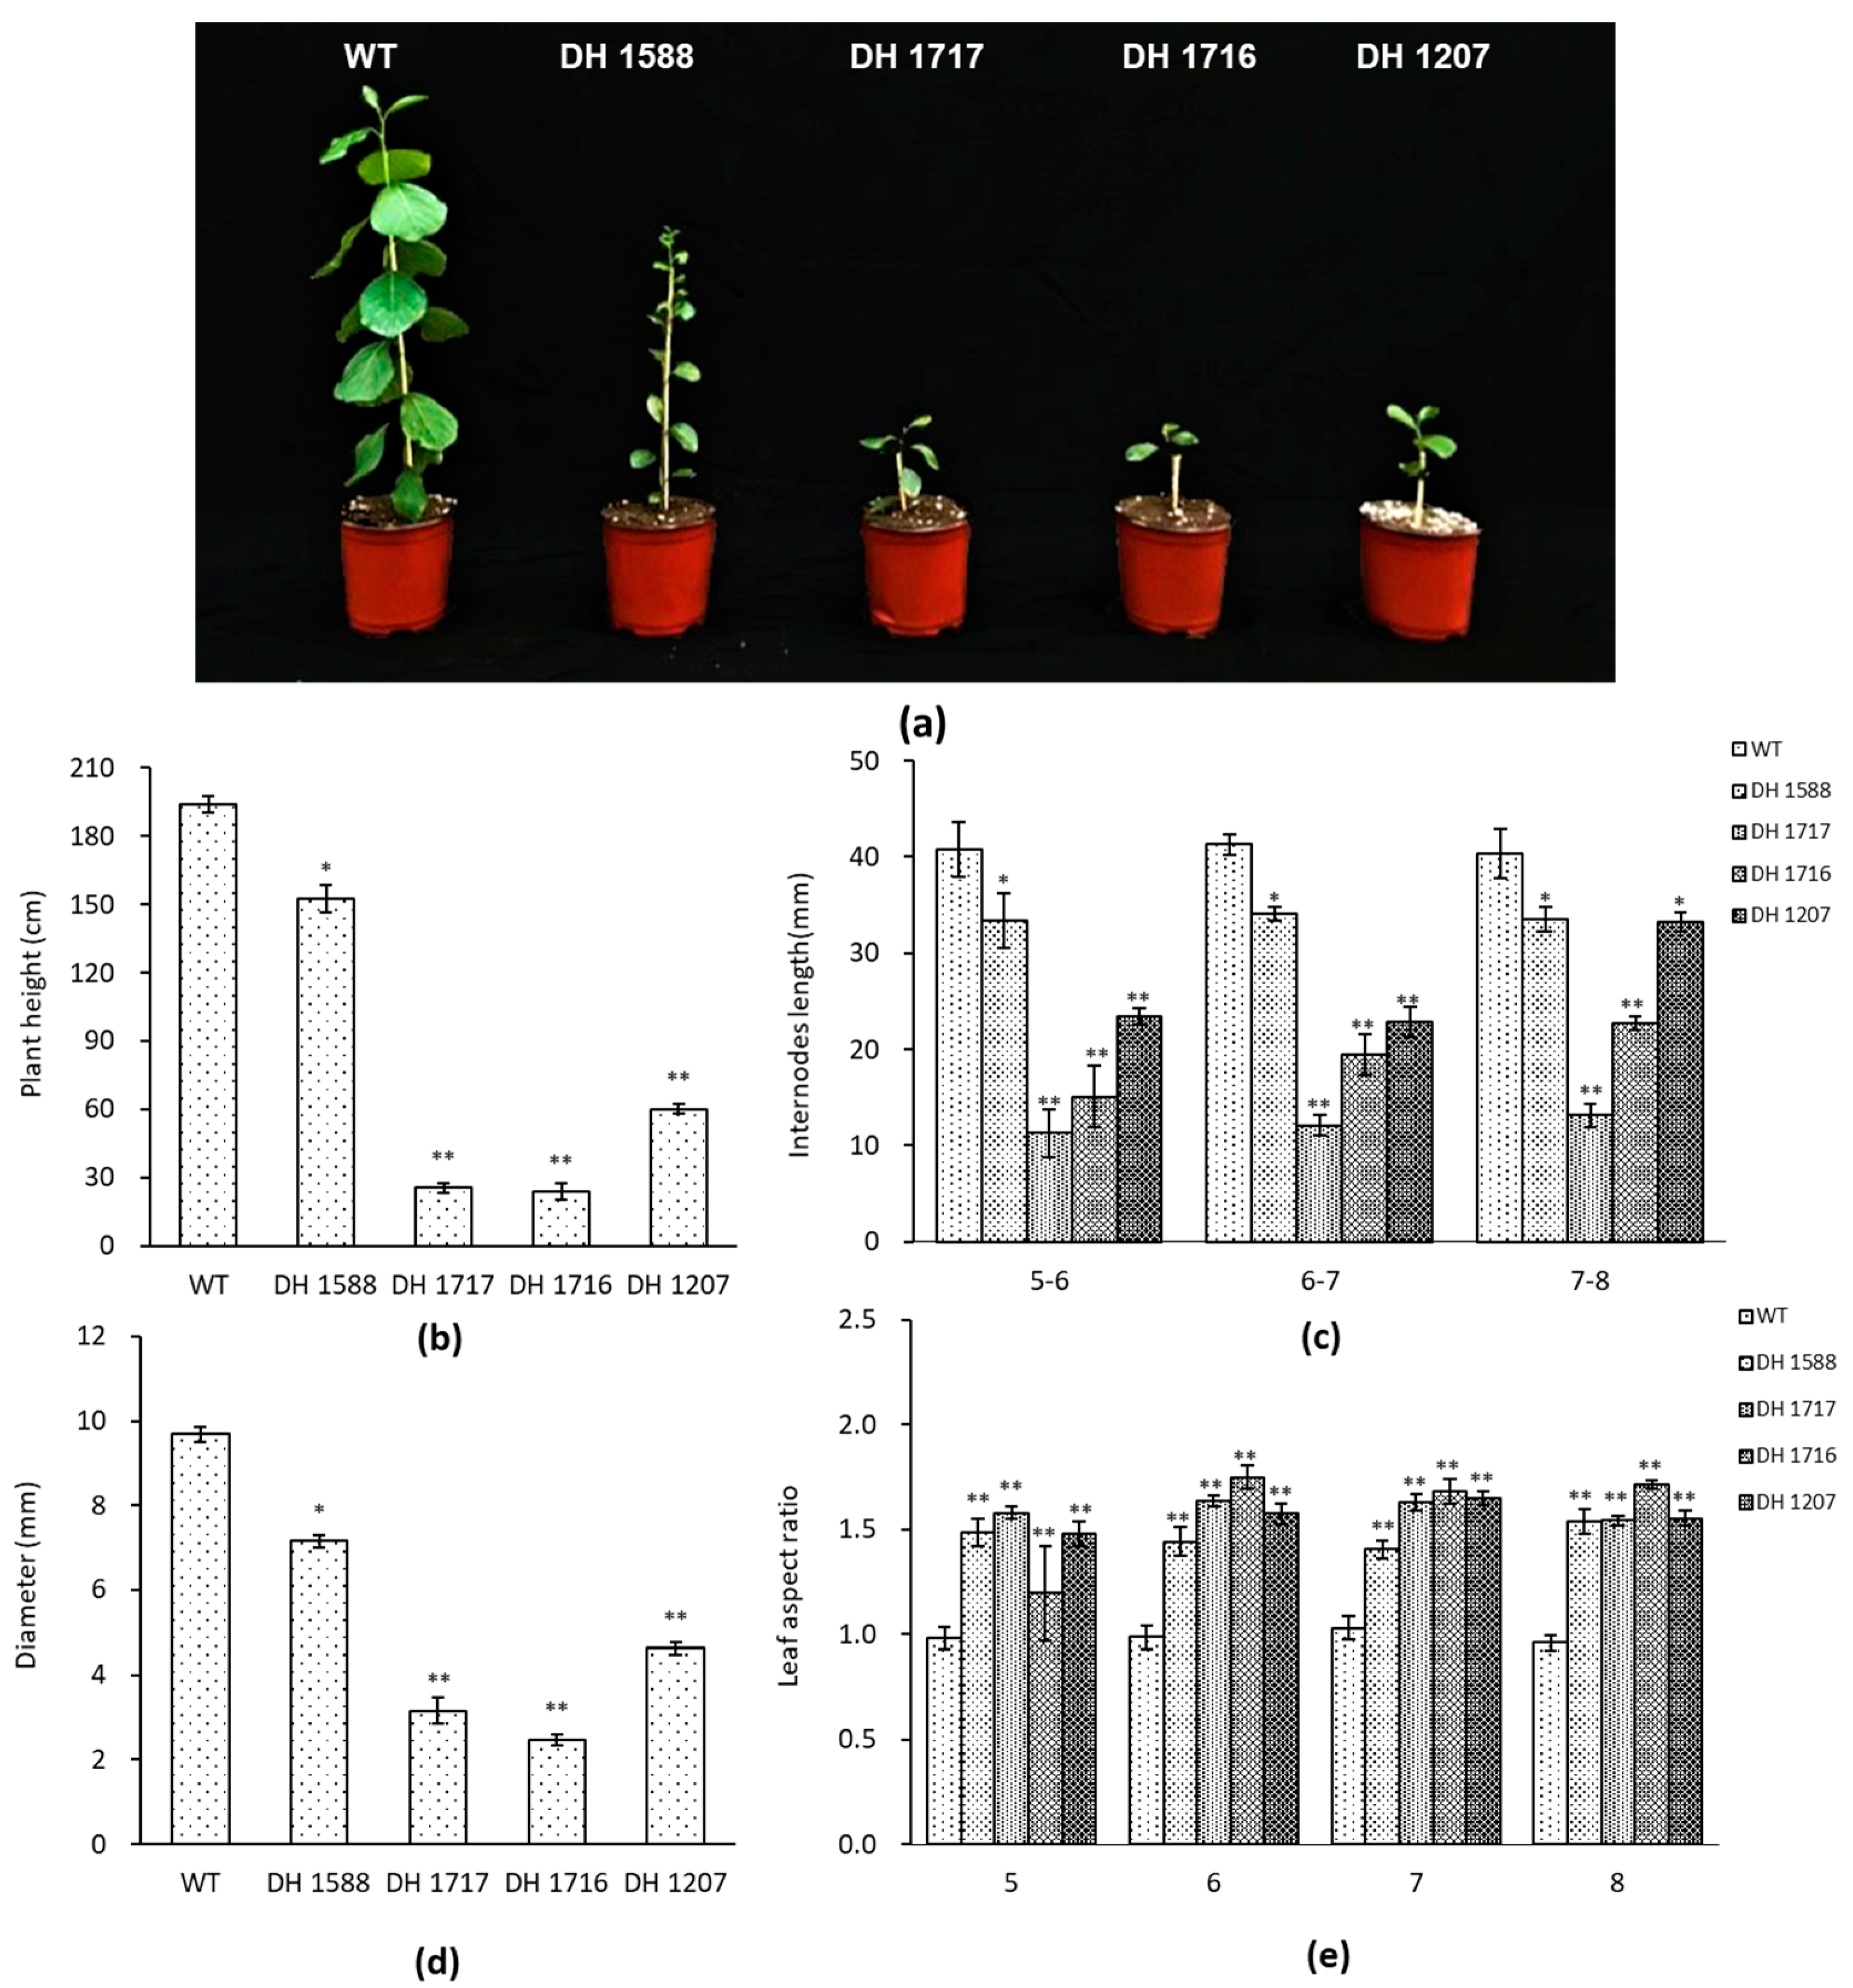
Abstract
1. Introduction
2. Materials and Methods
2.1. Plant Materials
2.2. Morphological and Histological Analysis
2.3. Sample Preparation, cDNA Library Construction and Illumina Sequencing
2.4. Differential Expression Profile
2.5. Hormone Treatment
2.6. qRT-PCR Analysis
3. Results
3.1. Phenotypic Characteristics of the DH Plants
3.2. Identification of Differentially Expressed Genes between the DH Plants and the Diploid Plants
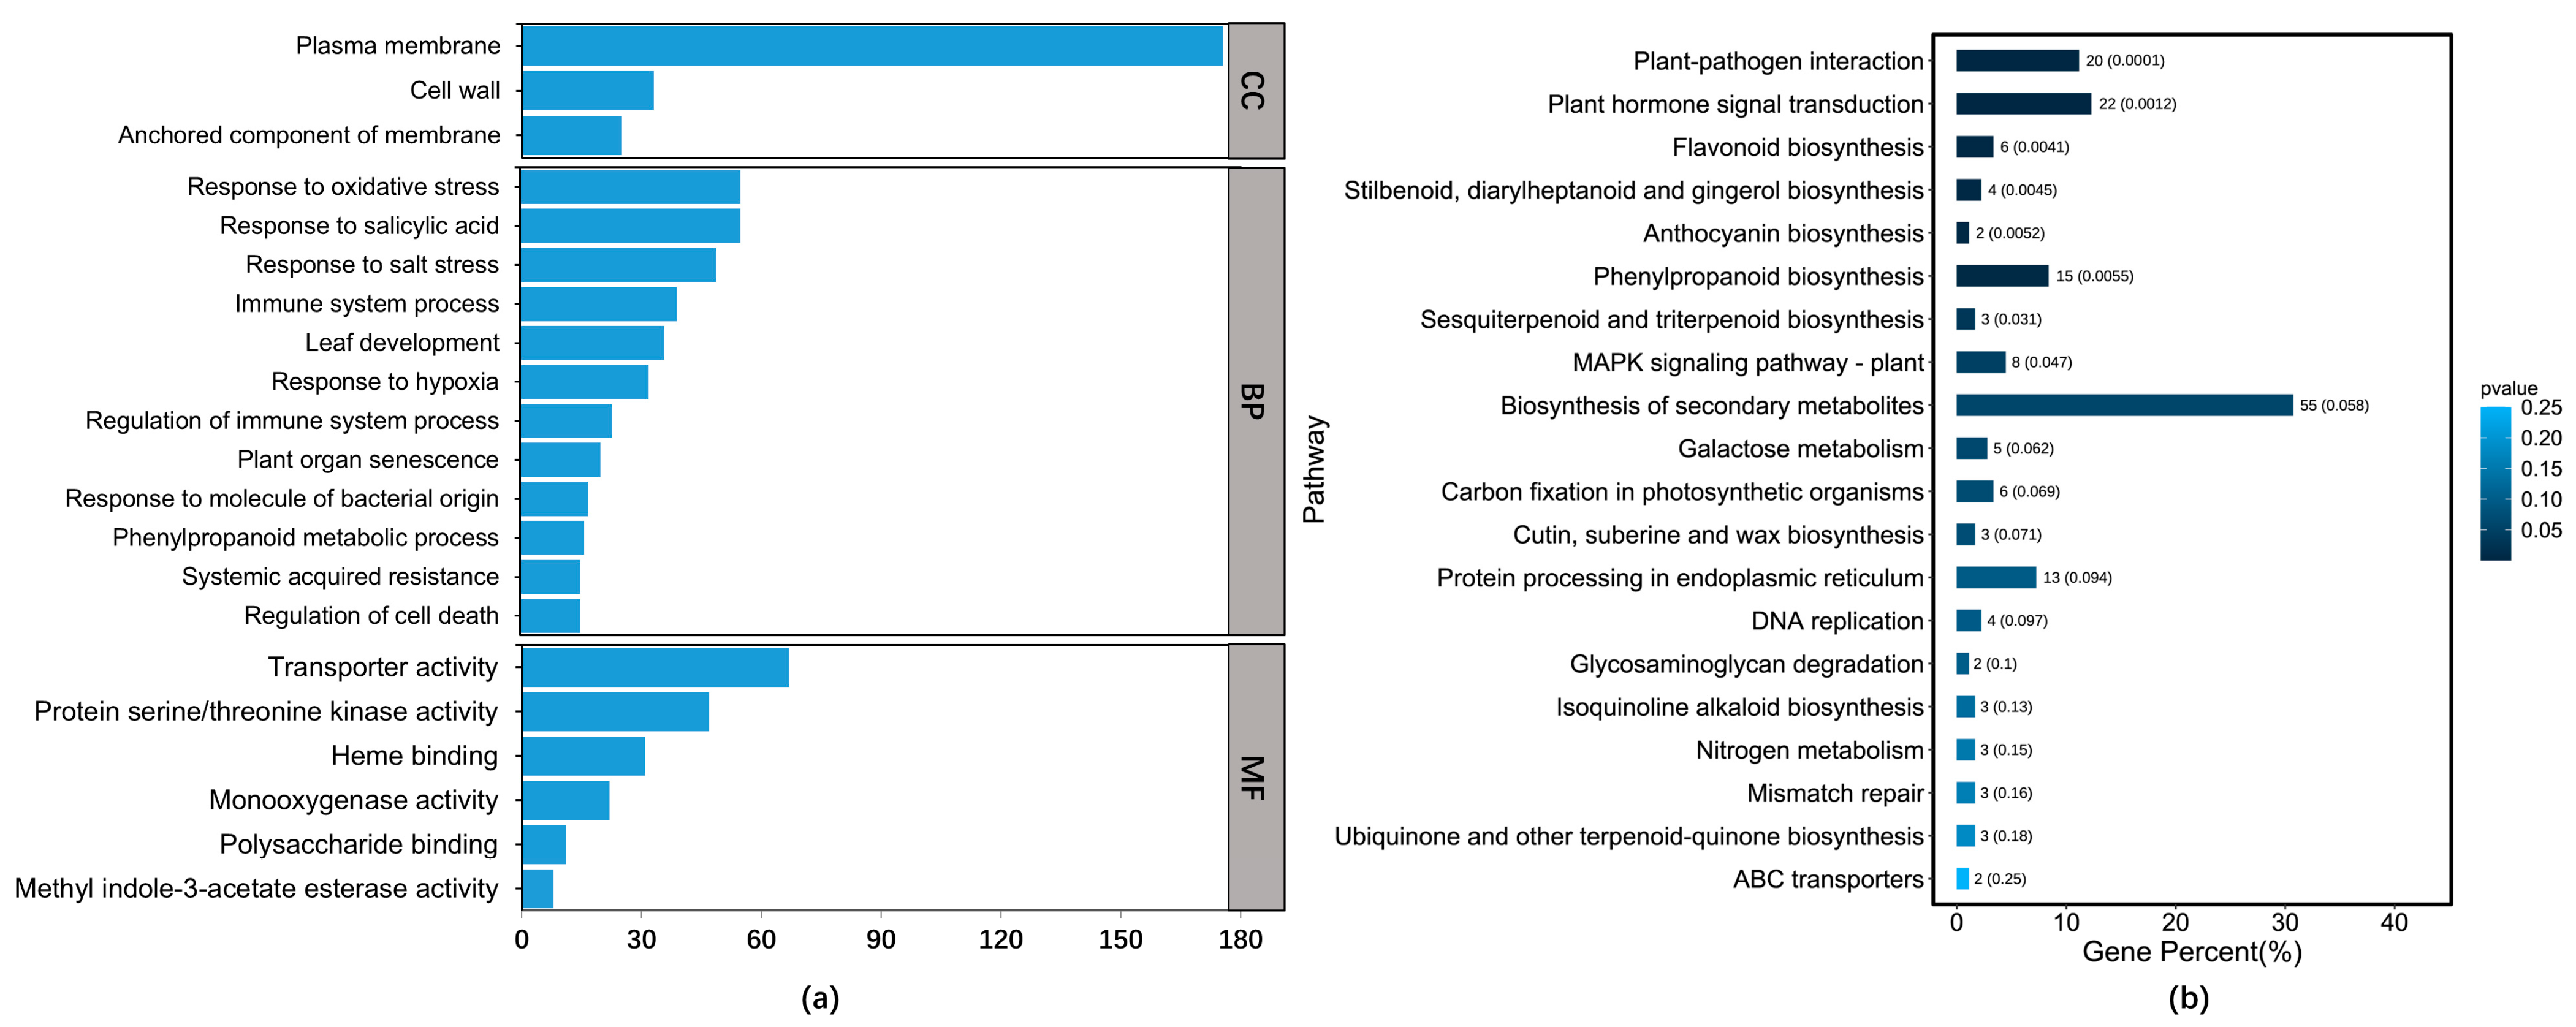
3.3. GO Enrichment and KEGG Pathway Analysis of the DEGs
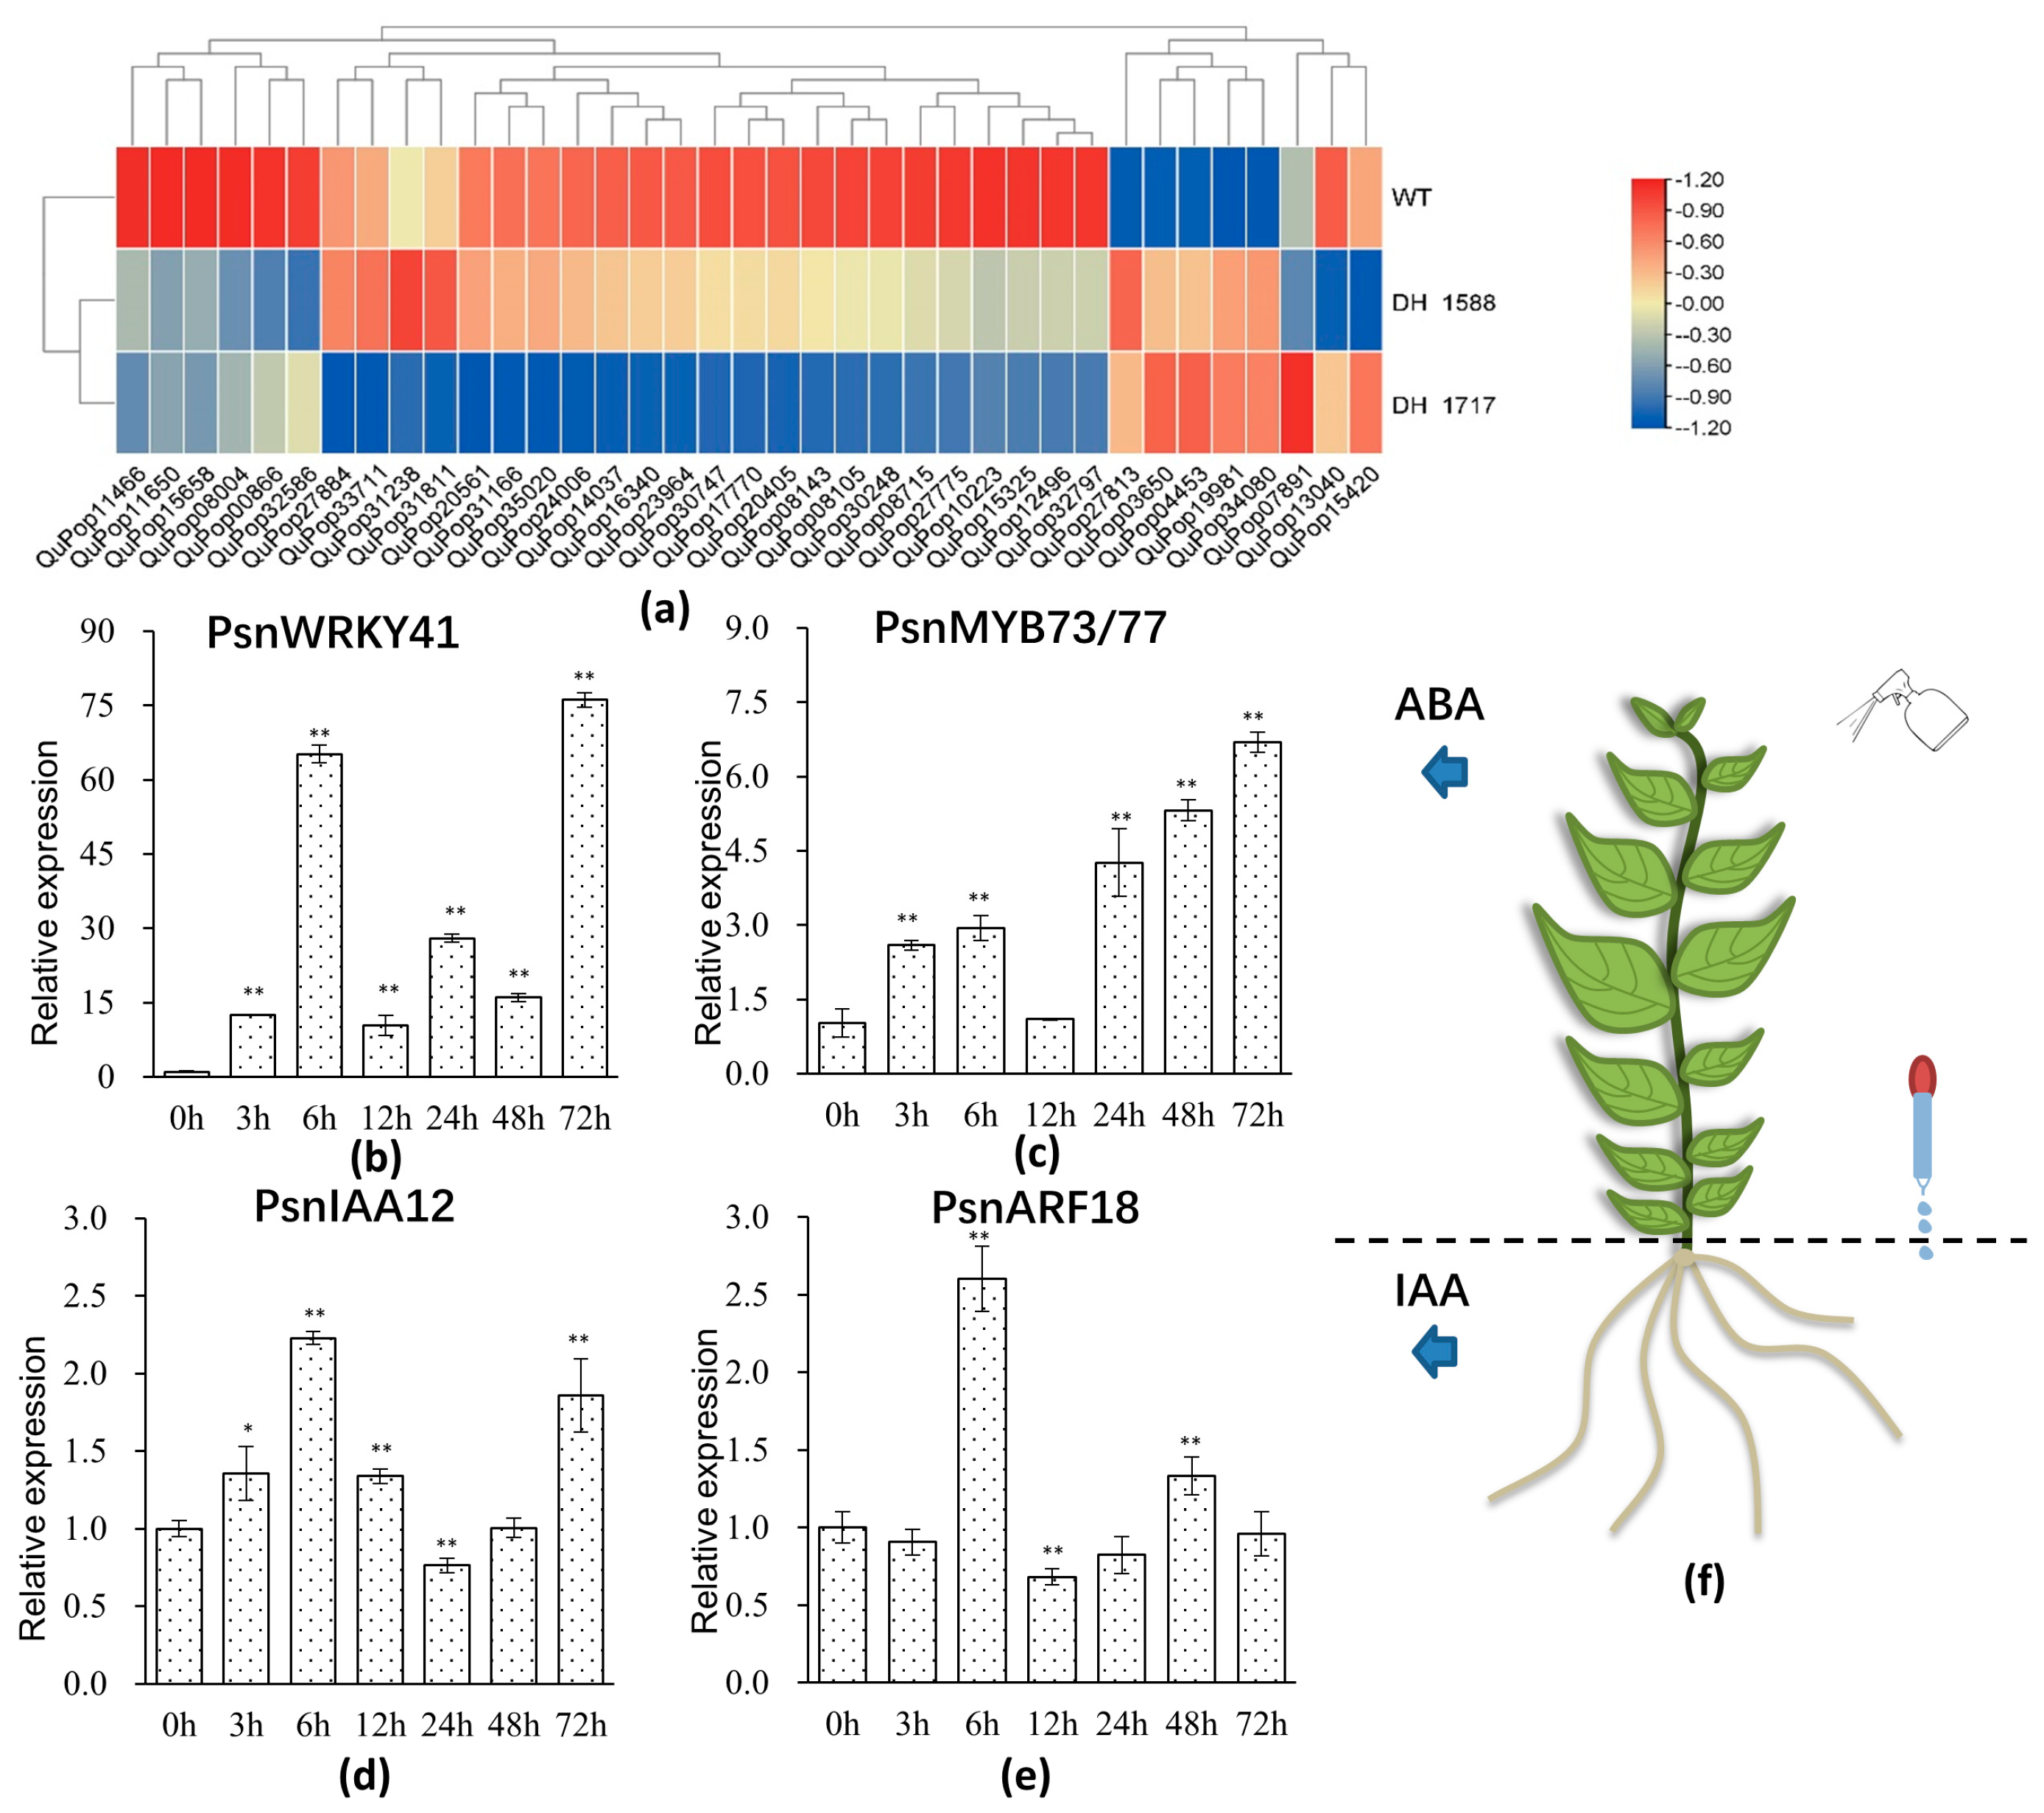
3.4. Expression Analysis of Hormone-Responsive Genes in WT

4. Discussion
5. Conclusions
Supplementary Materials
Author Contributions
Funding
Institutional Review Board Statement
Informed Consent Statement
Data Availability Statement
Conflicts of Interest
References
- Antje, R.; Tom, R.; Vanessa, H.; Lieven, S.; Klara, V.D.; Wout, B. Gene expression during the induction, maintenance, and release of dormancy in apical buds of poplar. J. Exp. Bot. 2007, 58, 4047–4060. [Google Scholar]
- Germana, M.A. Gametic embryogenesis and haploid technology as valuable support to plant breeding. Plant Cell Rep 2011, 30, 839–857. [Google Scholar] [CrossRef] [PubMed]
- Liu, C.; Li, J.; Chen, M.; Li, W.; Zhong, Y.; Dong, X.; Xu, X.; Chen, C.; Tian, X.; Chen, S. Development of high-oil maize haploid inducer with a novel phenotyping strategy. Crop J. 2022, 10, 524–531. [Google Scholar] [CrossRef]
- Shar, T.; Sheng, Z.H.; Ali, U.; Fiaz, S.; Tang, S.Q. Mapping quantitative trait loci associated with starch paste viscosity attributes by using double haploid populations of rice (Oryza sativa L.). J. Integr. Agric. 2020, 19, 1691–1703. [Google Scholar] [CrossRef]
- Bustamante, M.; Matus, J.T.; Riechmann, J.L. Genome-wide analyses for dissecting gene regulatory networks in the shoot apical meristem. J. Exp. Bot. 2016, 67, 1639–1648. [Google Scholar] [CrossRef] [PubMed]
- Eckardt, N.A. Apical Bud Formation and Dormancy Induction in Poplar. Plant Cell 2007, 19, 2322. [Google Scholar] [CrossRef]
- Aichinger, E.; Kornet, N.; Friedrich, T.; Laux, T. Plant Stem Cell Niches. Annu. Rev. Plant Biol. 2012, 63, 615–636. [Google Scholar] [CrossRef]
- Zhou, G.K.; Kubo, M.; Zhong, R.; Demura, T.; Ye, Z.H. Overexpression of miR165 affects apical meristem formation, organ polarity establishment and vascular development in Arabidopsis. Plant Cell Physiol. 2007, 48, 391–404. [Google Scholar] [CrossRef]
- Itoh, J.I.; Kitano, H.; Nagato, M.Y. SHOOT ORGANIZATION Genes Regulate Shoot Apical Meristem Organization and the Pattern of Leaf Primordium Initiation in Rice. Plant Cell 2000, 12, 2161–2174. [Google Scholar] [CrossRef]
- Zhu, H.; Hu, F.; Wang, R.; Zhou, X.; Sze, S.H.; Liou, L.W.; Barefoot, A.; Dickman, M.; Zhang, X. Arabidopsis Argonaute10 specifically sequesters miR166/165 to regulate shoot apical meristem development. Cell 2011, 145, 242–256. [Google Scholar] [CrossRef] [PubMed]
- Li, L. Ascertaining the Co-Expression Networks of Homeobox Genes in Maize Shoot Apical Meristem. In Proceedings of the International Plant & Animal Genome Conference XXII, San Diego, CA, USA, 10–14 January 2014. [Google Scholar]
- Liu, C.; Wang, S.; Liu, Y.; Wang, M.; Fan, E.; Liu, C.; Zhang, S.; Yang, C.; Wang, J.; Sederoff, H.W.; et al. Exceptionally high genetic variance of the doubled haploid (DH) population of poplar. J. For. Res. 2023. [Google Scholar] [CrossRef]
- Liu, J.-X.; Wang, R.-J.; Wang, X.; Li, D.-B. Effect of La(NO3)3 on seedling growth and physiological characteristics of ryegrass under NaCl stress. Chin. J. Eco Agric. 2011, 19, 353–357. [Google Scholar] [CrossRef]
- Li, B.; Dewey, C.N. RSEM: Accurate transcript quantification from RNA-Seq data with or without a reference genome. BMC Bioinform. 2011, 12, 323. [Google Scholar] [CrossRef] [PubMed]
- Goodstein, D.M.; Shu, S.; Howson, R.; Neupane, R.; Hayes, R.D.; Fazo, J.; Mitros, T.; Dirks, W.; Hellsten, U.; Putnam, N.; et al. Phytozome: A comparative platform for green plant genomics. Nucleic Acids Res. 2012, 40, D1178–D1186. [Google Scholar] [CrossRef] [PubMed]
- Chen, S.; Zhou, Y.; Chen, Y.; Gu, J. fastp: An ultra-fast all-in-one FASTQ preprocessor. Bioinformatics 2018, 34, i884–i890. [Google Scholar] [CrossRef]
- Tuskan, G.; Difazio, S.; Jansson, S.; Bohlmann, J.; Grigoriev, I.; Hellsten, U.; Putnam, N.; Ralph, S.; Rombauts, S.; Salamov, A. The Genome of Black Cottonwood, Populus trichocarpa (Torr. & Gray). Science 2006, 313, 1596–1604. [Google Scholar]
- Dobin, A.; Davis, C.A.; Schlesinger, F.; Drenkow, J.; Zaleski, C.; Jha, S.; Batut, P.; Chaisson, M.; Gingeras, T.R. STAR: Ultrafast universal RNA-seq aligner. Bioinformatics 2013, 29, 15–21. [Google Scholar] [CrossRef]
- Smyth, G.K. edgeR: A Bioconductor package for differential expression analysis of digital gene expression data. Bioinformatics 2010, 26, 139. [Google Scholar]
- Liu, H.; Liu, B.; Lou, S.; Bi, H.; Tang, H.; Tong, S.; Song, Y.; Chen, N.; Zhang, H.; Jiang, Y.; et al. CHYR1 ubiquitinates the phosphorylated WRKY70 for degradation to balance immunity in Arabidopsis thaliana. New Phytol. 2021, 230, 1095–1109. [Google Scholar] [CrossRef]
- Huysmans, M.; Buono, R.A.; Skorzinski, N.; Radio, M.C.; De Winter, F.; Parizot, B.; Mertens, J.; Karimi, M.; Fendrych, M.; Nowack, M.K. NAC Transcription Factors ANAC087 and ANAC046 Control Distinct Aspects of Programmed Cell Death in the Arabidopsis Columella and Lateral Root Cap. Plant Cell 2018, 30, 2197–2213. [Google Scholar] [CrossRef]
- Zhen, G.; Anna, D.; Yuliya, S.; Matthias, V.D.; Marlies, H.; Zongcheng, L.; Freya, D.W.; Steffen, V.; Mansour, K.; Jan, V.D.V. KIRA1 and ORESARA1 terminate flower receptivity by promoting cell death in the stigma of Arabidopsis. Nat. Plants 2018, 4, 365–375. [Google Scholar]
- Suyal, G.; Rana, V.S.; Mukherjee, S.K.; Wajid, S.; Choudhury, N.R. Arabidopsis thaliana NAC083 protein interacts with Mungbean yellow mosaic India virus (MYMIV) Rep protein. Virus Genes 2014, 48, 486–493. [Google Scholar] [CrossRef]
- Dong, T.; Yin, X.; Wang, H.; Lu, P.; Liu, X.; Gong, C.; Wu, Y. ABA-INDUCED expression 1 is involved in ABA-inhibited primary root elongation via modulating ROS homeostasis in Arabidopsis. Plant Sci. Int. J. Exp. Plant Biol. 2021, 304, 110821. [Google Scholar] [CrossRef] [PubMed]
- Ding, Z.J.; Yan, J.Y.; Li, G.X.; Wu, Z.C.; Zhang, S.Q.; Zheng, S.J. WRKY41 controls Arabidopsis seed dormancy via direct regulation of ABI3 transcript levels not downstream of ABA. Plant J. 2015, 79, 810–823. [Google Scholar] [CrossRef] [PubMed]
- Zhao, Y.; Xing, L.; Wang, X.; Hou, Y.J.; Gao, J.; Wang, P.; Duan, C.G.; Zhu, X.; Zhu, J.K. The ABA receptor PYL8 promotes lateral root growth by enhancing MYB77-dependent transcription of auxin-responsive genes. Sci. Signal 2014, 7, 328. [Google Scholar] [CrossRef]
- Herud, O.; Weijers, D.; Lau, S.; Jürgens, G. Auxin responsiveness of the MONOPTEROS-BODENLOS module in primary root initiation critically depends on the nuclear import kinetics of the Aux/IAA inhibitor BODENLOS. Plant J. 2016, 85, 269–277. [Google Scholar] [CrossRef] [PubMed]
- Jia, Y.; Kong, X.; Hu, K.; Cao, M.; Liu, J.; Ma, C.; Guo, S.; Yuan, X.; Zhao, S.; Robert, H.S.; et al. PIFs coordinate shade avoidance by inhibiting auxin repressor ARF18 and metabolic regulator QQS. New Phytol. 2020, 228, 609–621. [Google Scholar] [CrossRef] [PubMed]
- Gómez, M.; Sheridan, M.L.; Casati, P. E2Fb and E2Fa transcription factors independently regulate the DNA damage response after ultraviolet B exposure in Arabidopsis. Plant J. 2022, 109, 1098–1115. [Google Scholar] [CrossRef]
- Yoon, E.K.; Dhar, S.; Lee, M.H.; Song, J.H.; Lee, S.A.; Kim, G.; Jang, S.; Choi, J.W.; Choe, J.E.; Kim, J.H.; et al. Conservation and Diversification of the SHR-SCR-SCL23 Regulatory Network in the Development of the Functional Endodermis in Arabidopsis Shoots. Mol. Plant 2016, 9, 1197–1209. [Google Scholar] [CrossRef]
- Kim, H.J.; Park, J.H.; Kim, J.; Kim, J.J.; Hong, S.; Kim, J.; Kim, J.H.; Woo, H.R.; Hyeon, C.; Lim, P.O.; et al. Time-evolving genetic networks reveal a NAC troika that negatively regulates leaf senescence in Arabidopsis. Proc. Natl. Acad. Sci. USA 2018, 115, E4930–E4939. [Google Scholar] [CrossRef]
- Dob, A.; Lakehal, A.; Novak, O.; Bellini, C. Jasmonate inhibits adventitious root initiation through repression of CKX1 and activation of RAP2.6L transcription factor in Arabidopsis. J. Exp. Bot. 2021, 72, 7107–7118. [Google Scholar] [CrossRef]
- Geilen, K.; Bohmer, M. Dynamic subnuclear relocalization of WRKY40, a potential new mechanism of ABA-dependent transcription factor regulation. Plant Signal Behav. 2015, 10, e1106659. [Google Scholar] [CrossRef]
- Chen, X.; Liu, J.; Lin, G.; Wang, A.; Wang, Z.; Lu, G. Overexpression of AtWRKY28 and AtWRKY75 in Arabidopsis enhances resistance to oxalic acid and Sclerotinia sclerotiorum. Plant Cell Rep. 2013, 32, 1589–1599. [Google Scholar] [CrossRef] [PubMed]
- Jiang, Y.; Liang, G.; Yang, S.; Yu, D. Arabidopsis WRKY57 Functions as a Node of Convergence for Jasmonic Acid- and Auxin-Mediated Signaling in Jasmonic Acid-Induced Leaf Senescence. Plant Cell 2014, 26, 230–245. [Google Scholar] [CrossRef]
- Yoon, H.K.; Kim, S.G.; Kim, S.Y.; Park, C.M. Regulation of leaf senescence by NTL9-mediated osmotic stress signaling in Arabidopsis. Mol. Cells 2008, 25, 438–445. [Google Scholar] [PubMed]
- Li, S.; Gao, J.; Yao, L.; Ren, G.; Zhu, X.; Gao, S.; Qiu, K.; Zhou, X.; Kuai, B. The role of ANAC072 in the regulation of chlorophyll degradation during age- and dark-induced leaf senescence. Plant Cell Rep. 2016, 35, 1729–1741. [Google Scholar] [CrossRef] [PubMed]
- Zhang, T.Y.; Li, Z.Q.; Zhao, Y.D.; Shen, W.J.; Chen, M.S.; Gao, H.Q.; Ge, X.M.; Wang, H.Q.; Li, X.; He, J.M. Ethylene-induced stomatal closure is mediated via MKK1/3-MPK3/6 cascade to EIN2 and EIN3. J. Integr. Plant. Biol. 2021, 63, 1324–1340. [Google Scholar] [CrossRef]
- Zeng, J.; Li, X.; Ge, Q.; Dong, Z.; Luo, L.; Tian, Z.; Zhao, Z. Endogenous stress-related signal directs shoot stem cell fate in Arabidopsis thaliana. Nat. Plants 2021, 7, 1276–1287. [Google Scholar] [CrossRef]
- Petrella, R.; Caselli, F.; Roig-Villanova, I.; Vignati, V.; Chiara, M.; Ezquer, I.; Tadini, L.; Kater, M.M.; Gregis, V. BPC transcription factors and a Polycomb Group protein confine the expression of the ovule identity gene SEEDSTICK in Arabidopsis. Plant J. Cell Mol. Biol. 2020, 102, 582–599. [Google Scholar] [CrossRef]
- Zwack, P.J.; Compton, M.A.; Adams, C.I.; Rashotte, A.M. Cytokinin response factor 4 (CRF4) is induced by cold and involved in freezing tolerance. Plant Cell Rep. 2016, 35, 573–584. [Google Scholar] [CrossRef]
- Gao, Q.M.; Venugopal, S.; Kachroo, N.A. Low Oleic Acid-Derived Repression of Jasmonic Acid-Inducible Defense Responses Requires the WRKY50 and WRKY51 Proteins. Plant Physiol. 2011, 155, 464–476. [Google Scholar] [CrossRef] [PubMed]
- Chen, Y.; Zhang, L.; Zhang, H.; Chen, L.; Yu, D. ERF1 delays flowering through direct inhibition of FLOWERING LOCUS T expression in Arabidopsis. J. Integr. Plant Biol. 2021, 63, 1712–1723. [Google Scholar] [CrossRef] [PubMed]
- Wang, Y.; Salasini, B.C.; Khan, M.; Devi, B.; Bush, M.; Subramaniam, R.; Hepworth, S.R. Clade I TGACG-Motif Binding Basic Leucine Zipper Transcription Factors Mediate BLADE-ON-PETIOLE-Dependent Regulation of Development. Plant Physiol. 2019, 180, 937–951. [Google Scholar] [CrossRef] [PubMed]
- Ben-Targem, M.; Ripper, D.; Bayer, M.; Ragni, L. Auxin and gibberellin signaling cross-talk promotes hypocotyl xylem expansion and cambium homeostasis. J. Exp. Bot. 2021, 72, 3647–3660. [Google Scholar] [CrossRef]


Disclaimer/Publisher’s Note: The statements, opinions and data contained in all publications are solely those of the individual author(s) and contributor(s) and not of MDPI and/or the editor(s). MDPI and/or the editor(s) disclaim responsibility for any injury to people or property resulting from any ideas, methods, instructions or products referred to in the content. |
© 2023 by the authors. Licensee MDPI, Basel, Switzerland. This article is an open access article distributed under the terms and conditions of the Creative Commons Attribution (CC BY) license (https://creativecommons.org/licenses/by/4.0/).
Share and Cite
Wang, Y.; Yu, J.; Zhang, X.; He, Y.; Chen, S.; Fan, E.; Qu, G.; Chen, S.; Liu, C. Morphological, Histological, and Transcriptome Analysis of Doubled Haploid Plants in Poplars (Populus simonii × Populus nigra). Forests 2023, 14, 1535. https://doi.org/10.3390/f14081535
Wang Y, Yu J, Zhang X, He Y, Chen S, Fan E, Qu G, Chen S, Liu C. Morphological, Histological, and Transcriptome Analysis of Doubled Haploid Plants in Poplars (Populus simonii × Populus nigra). Forests. 2023; 14(8):1535. https://doi.org/10.3390/f14081535
Chicago/Turabian StyleWang, Yiran, Jiajie Yu, Xiang Zhang, Yaxin He, Song Chen, Erqin Fan, Guanzheng Qu, Su Chen, and Caixia Liu. 2023. "Morphological, Histological, and Transcriptome Analysis of Doubled Haploid Plants in Poplars (Populus simonii × Populus nigra)" Forests 14, no. 8: 1535. https://doi.org/10.3390/f14081535
APA StyleWang, Y., Yu, J., Zhang, X., He, Y., Chen, S., Fan, E., Qu, G., Chen, S., & Liu, C. (2023). Morphological, Histological, and Transcriptome Analysis of Doubled Haploid Plants in Poplars (Populus simonii × Populus nigra). Forests, 14(8), 1535. https://doi.org/10.3390/f14081535