Thermal Comfort Analysis and Optimization Strategies of Green Spaces in Chinese Traditional Settlements
Abstract
1. Introduction
2. Materials and Methods
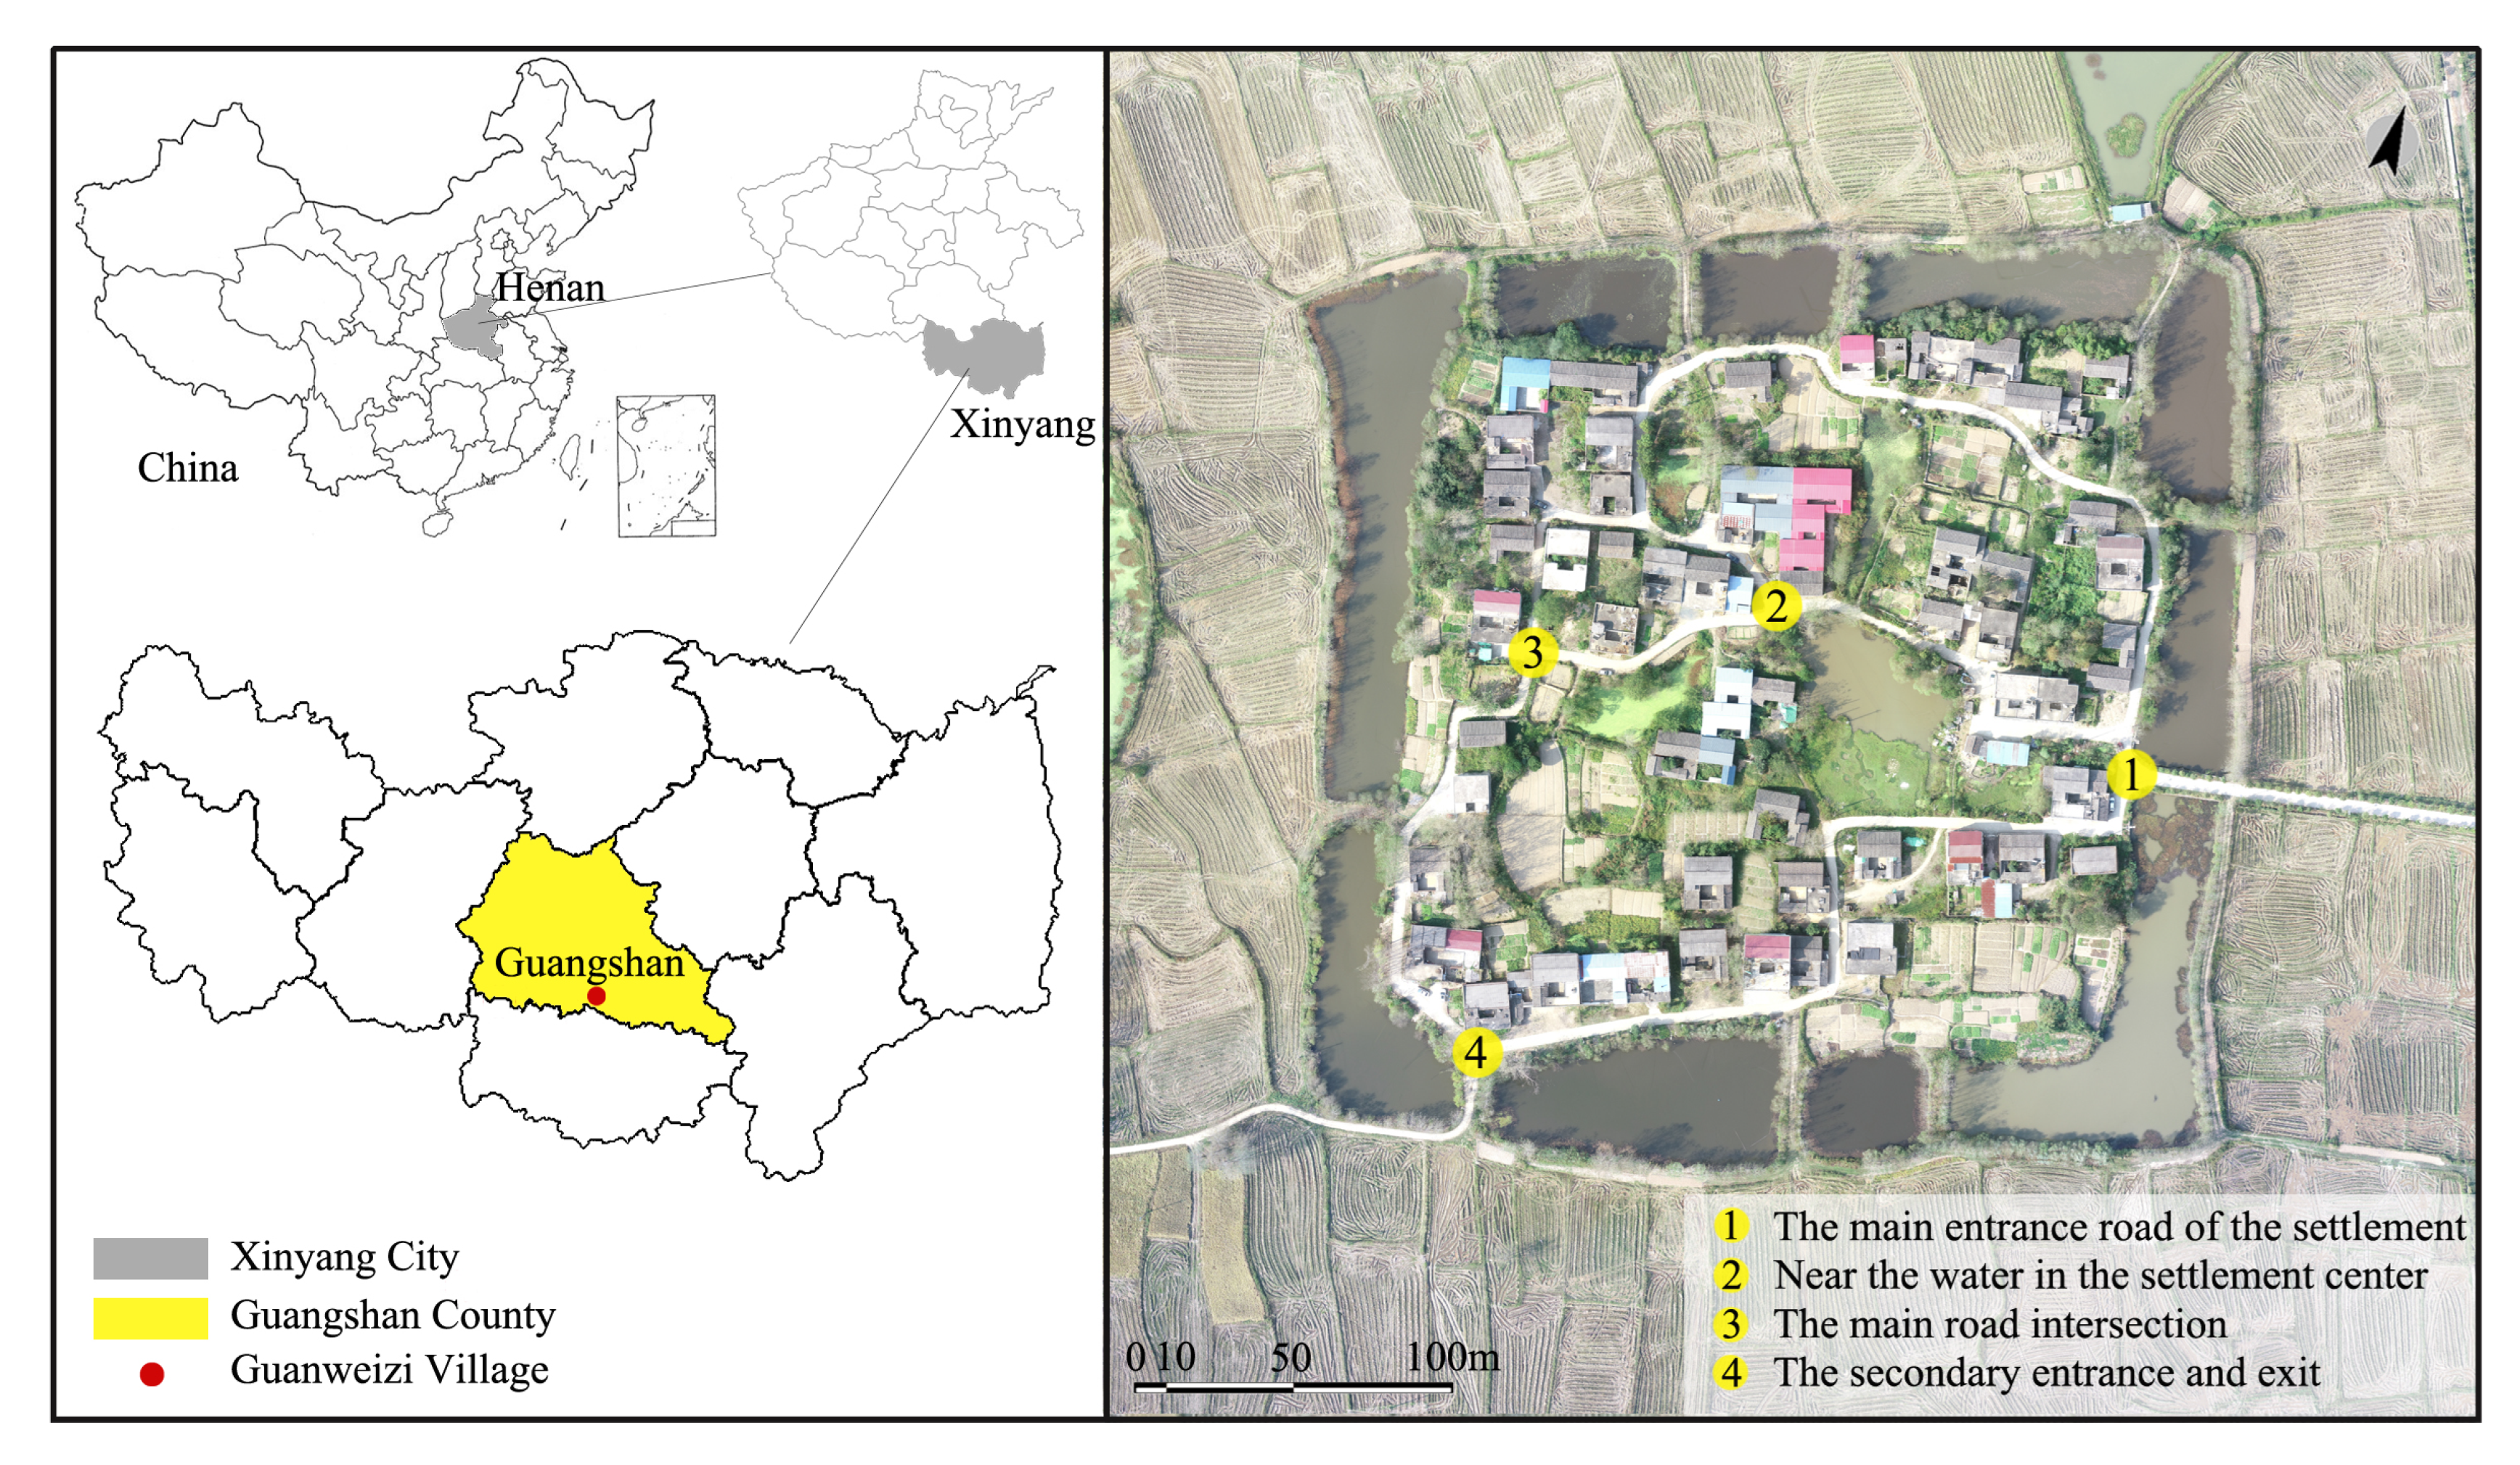
2.1. Case Study Area
2.2. Thermal Comfort Research Methodology
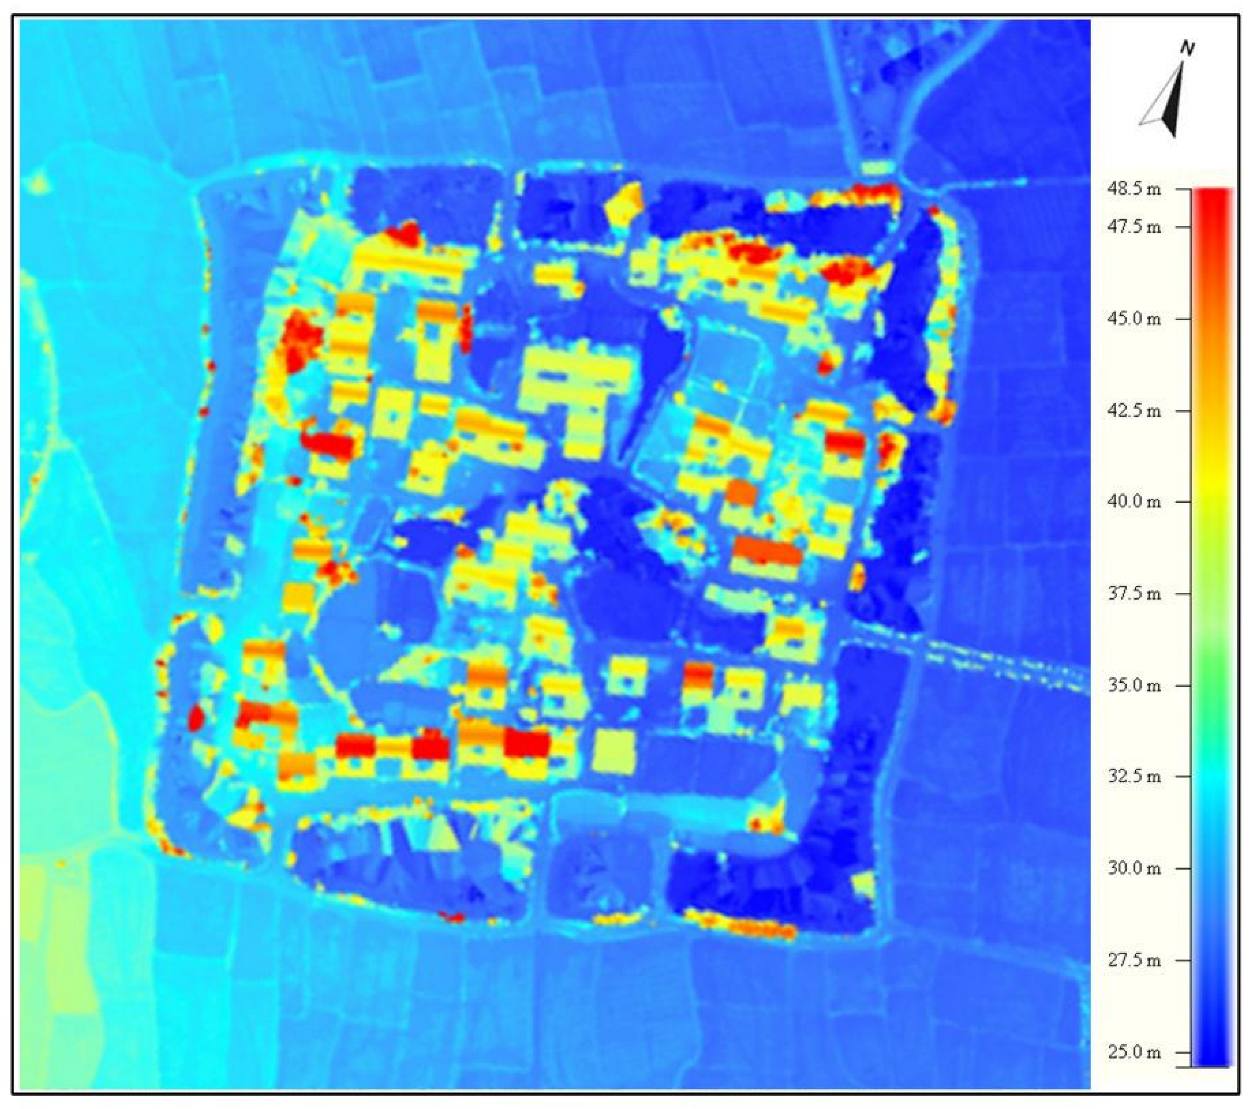
2.2.1. Low-Altitude Photogrammetry
2.2.2. ENVI-Met Software for Data Simulation
2.2.3. PET as the Thermal Comfort Indicator
2.2.4. Grid Analysis
2.3. ENVI-Met-Based Thermal Environment Simulation
2.3.1. Measurement of Thermal Environment-Related Indicators in Guanweizi Village
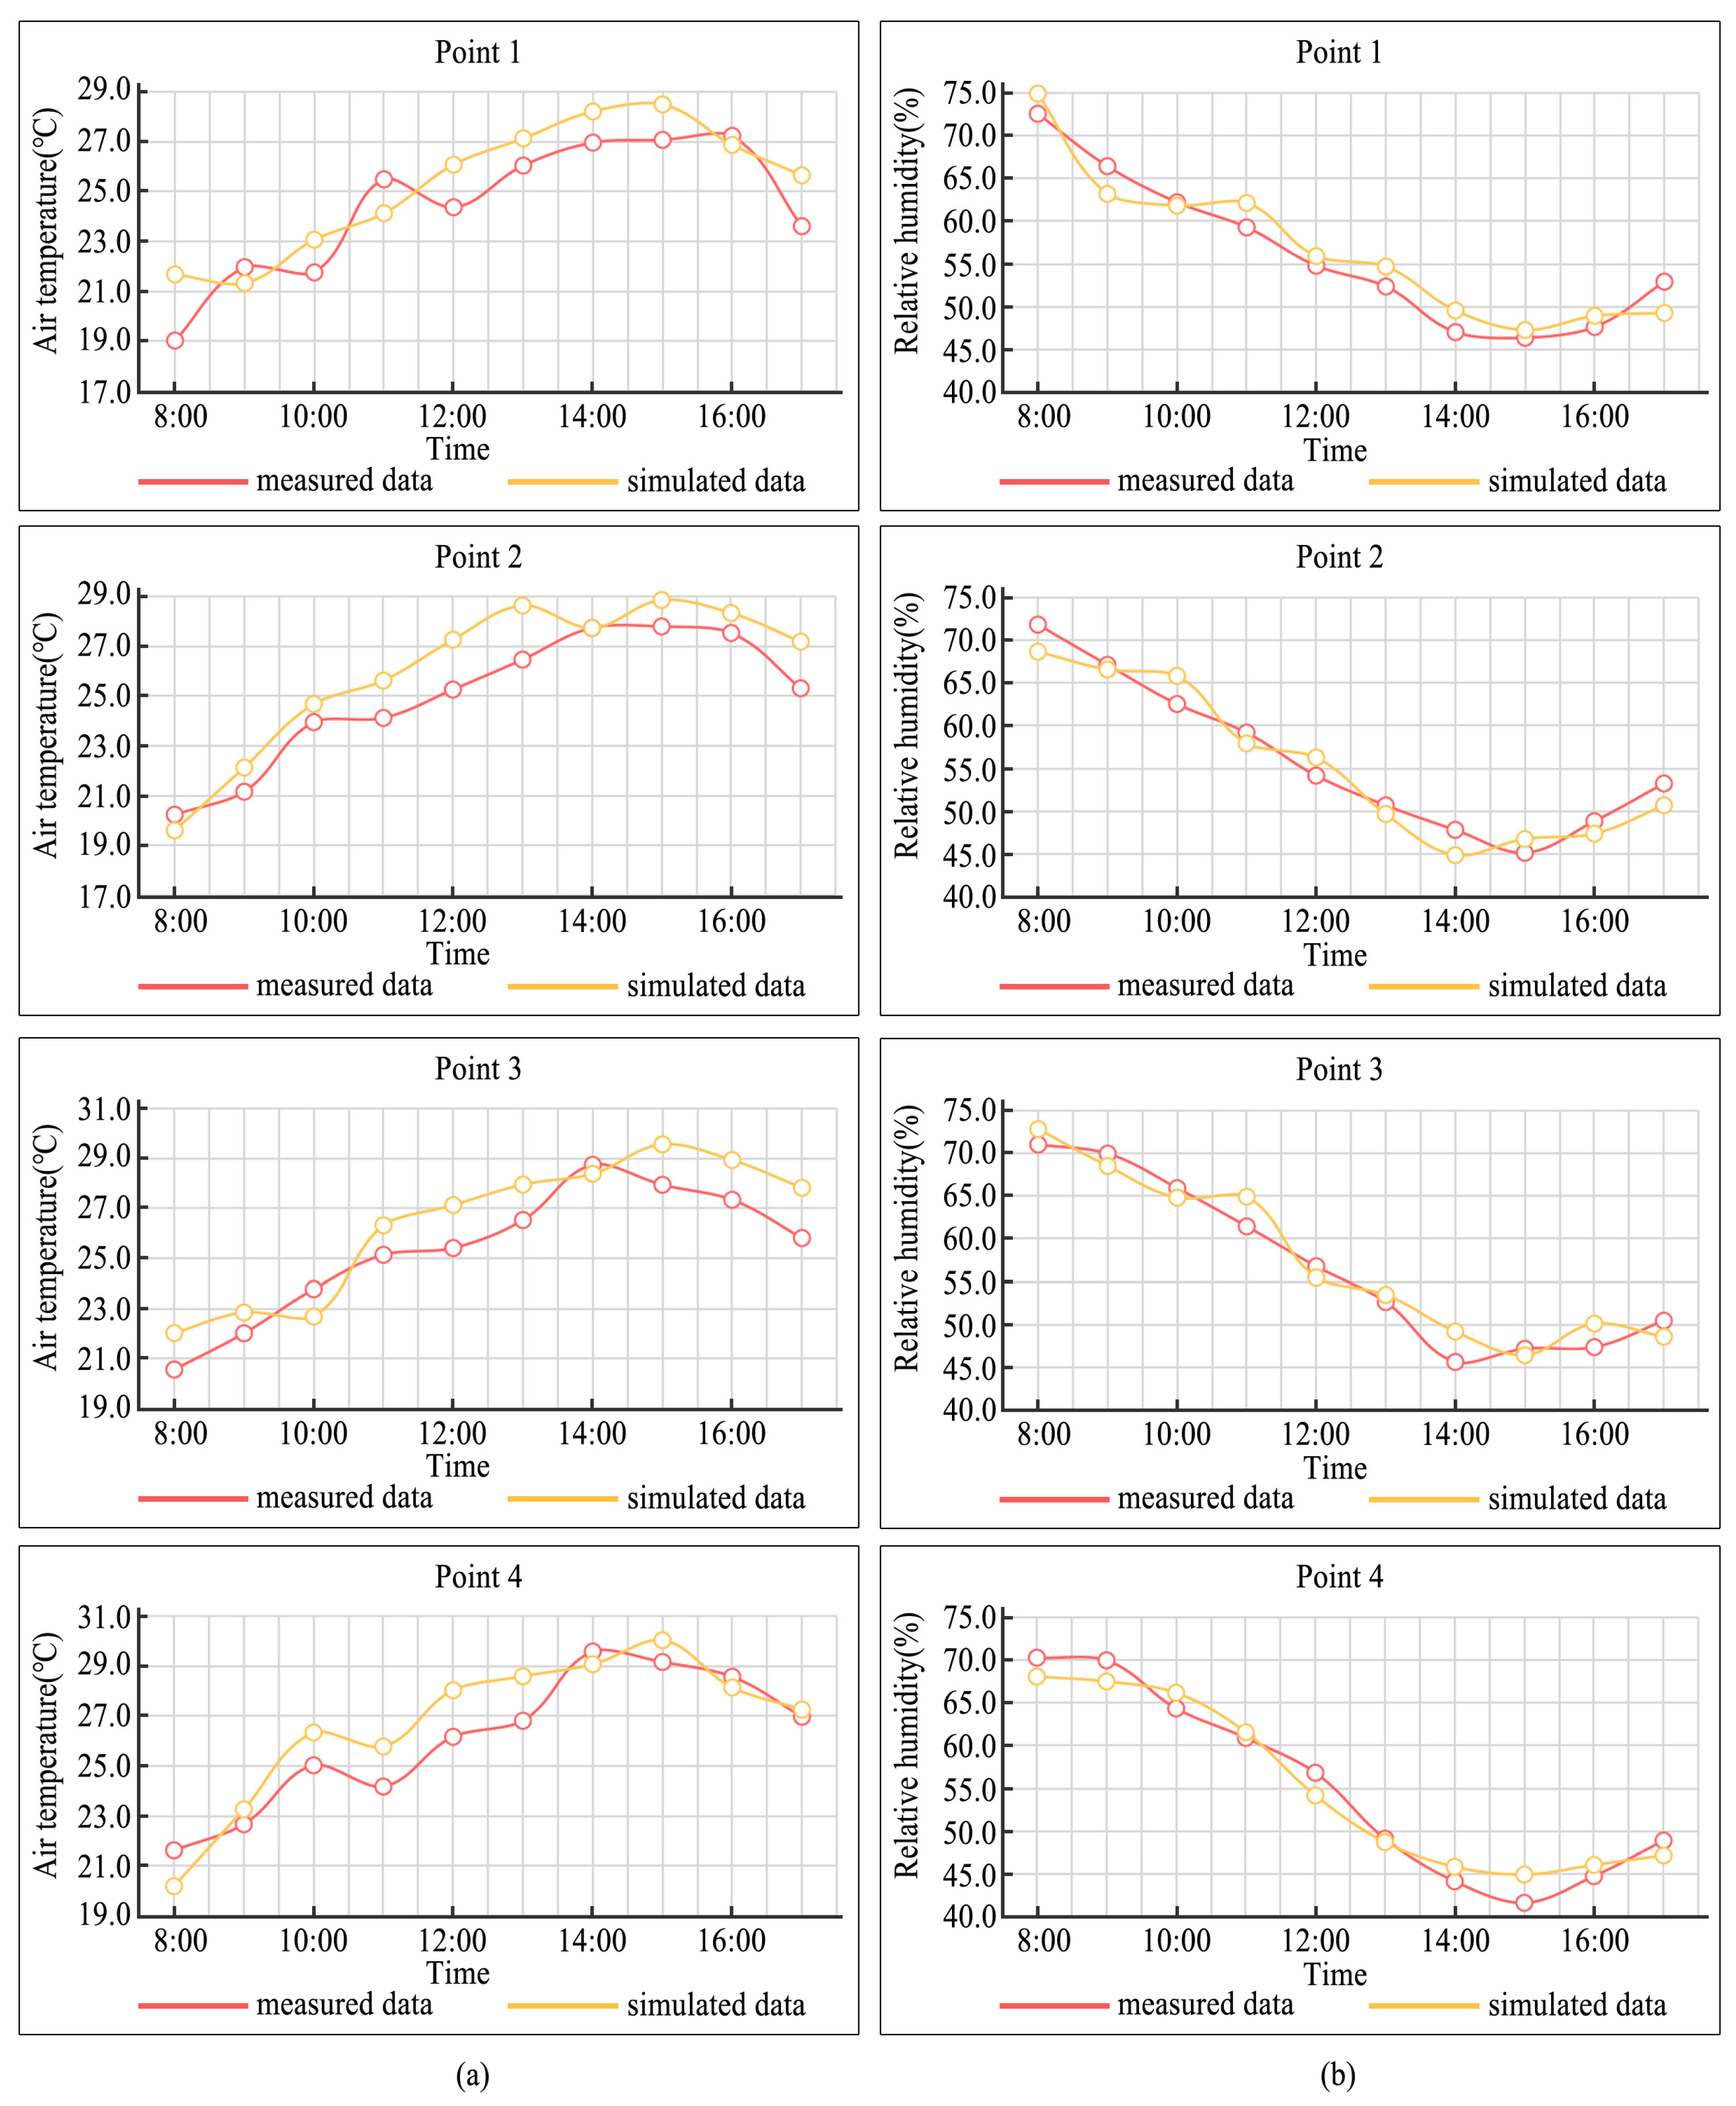
2.3.2. Verification of ENVI-Met Simulation Results
2.3.3. ENVI-Met Modeling Parameter
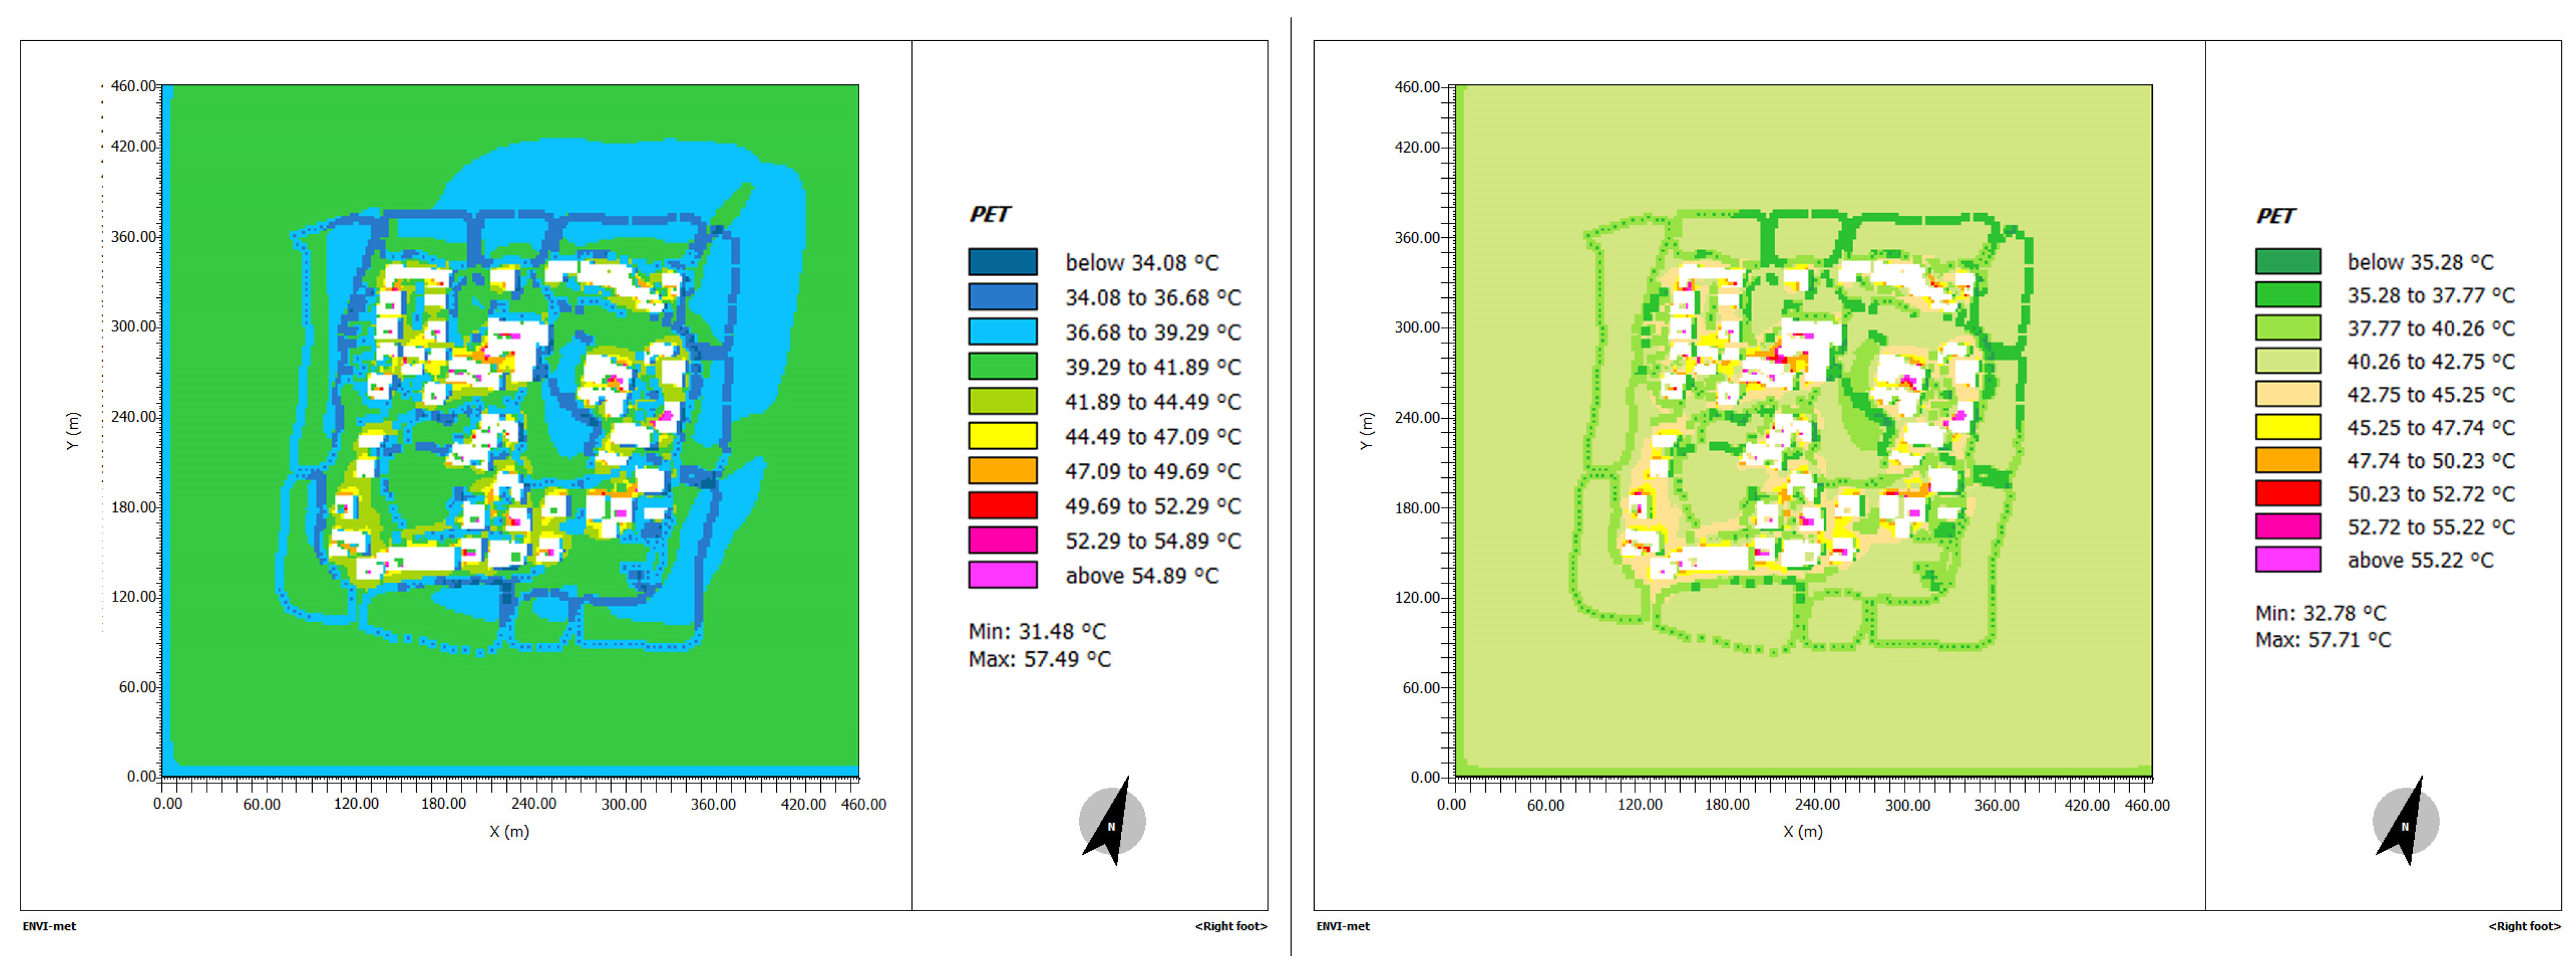
2.3.4. ENVI-Met-Based PET Calculation
3. Results
3.1. PET Simulation
3.2. Correlation between Spatial Components and PET
3.3. Impact of Water Bodies on the Thermal Environment
4. Discussion
5. Conclusions
- Increasing air humidity and reducing air temperature: the area of water bodies and greening should be increased, and the area of bare soil should be reduced within the settlement area, where thermal comfort is poor.
- Reducing thermal radiation: green plants should be grown on both sides of hardened roads in the settlement to increase shading and reduce solar thermal radiation; hard concrete pavement should be minimized and planting or permeable bricks should be used [47]. Green plants should be grown on both sides of roads, and surface phytoplankton should be increased to reduce the reflection of solar radiation [48,49].
- Reducing high temperatures at the boundary of water bodies: multi-level greenery should be added around water bodies inside and outside the settlement, such as tall trees to shade the water bodies and thus reduce high temperatures at their boundary.
Author Contributions
Funding
Data Availability Statement
Conflicts of Interest
References
- Wei, G.; Bi, M.; Liu, X.; Zhang, Z.; He, B.-J. Investigating the impact of multi-dimensional urbanization and FDI on carbon emissions in the belt and road initiative region: Direct and spillover effects. J. Clean. Prod. 2023, 384, 135608. [Google Scholar] [CrossRef]
- Liu, X.; He, J.; Xiong, K.; Liu, S.; He, B.-J. Identification of Factors Affecting Public Willingness to Pay for Heat Mitigation and Adaptation: Evidence from Guangzhou, China. Urban Clim. 2023, 48, 101405. [Google Scholar] [CrossRef]
- He, B.-J. Green Building: A Comprehensive Solution to Urban Heat. Energy Build. 2022, 271, 112306. [Google Scholar] [CrossRef]
- Liu, S.; Wang, Y.; Liu, X.; Yang, L.; Zhang, Y.; He, J. How does future climatic uncertainty affect multi-objective building energy retrofit decisions? Evidence from residential buildings in subtropical Hong Kong. Sustain. Cities Soc. 2023, 92, 104482. [Google Scholar] [CrossRef]
- Wei, D.; Yang, L.; Bao, Z.; Lu, Y.; Yang, H. Variations in Outdoor Thermal Comfort in an Urban Park in the Hot-Summer and Cold-Winter Region of China. Sustain. Cities Soc. 2022, 77, 103535. [Google Scholar] [CrossRef]
- He, B.-J.; Zhu, J.; Zhao, D.-X.; Gou, Z.-H.; Qi, J.-D.; Wang, J. Co-Benefits Approach: Opportunities for Implementing Sponge City and Urban Heat Island Mitigation. Land Use Policy 2019, 86, 147–157. [Google Scholar] [CrossRef]
- Song, C.; Yang, J.; Wu, F.; Xiao, X.; Xia, J.; Li, X. Response characteristics and influencing factors of carbon emissions and land surface temperature in Guangdong Province, China. Urban Clim. 2022, 46, 101330. [Google Scholar] [CrossRef]
- Li, B.; Guo, W.; Liu, X.; Zhang, Y.; Russell, P.J.; Schnabel, M.A. Sustainable Passive Design for Building Performance of Healthy Built Environment in the Lingnan Area. Sustainability 2021, 13, 9115. [Google Scholar] [CrossRef]
- Wang, Y.; Berardi, U.; Akbari, H. Comparing the Effects of Urban Heat Island Mitigation Strategies for Toronto, Canada. Energy Build. 2016, 114, 2–19. [Google Scholar] [CrossRef]
- Zhou, X.; Chen, H.; Wu, Y.; Xu, H. Impacts of Mobile Survey-based Urban Spatial Forms on Summer Afternoon Thermal Environments. Landsc. Archit. 2018, 25, 21–26. (In Chinese) [Google Scholar] [CrossRef]
- Huang, C.H.; Tsai, H.H.; Chen, H.C. Influence of Weather Factors on Thermal Comfort in Subtropical Urban Environments. Sustainability 2020, 12, 2001. [Google Scholar] [CrossRef]
- Sun, Z. Impact of urban morphology factors on thermal environment in high density urban areas: A case of Beijing within 5th ring road. Ecol. Environ. Sci. 2020, 29, 2020–2027. (In Chinese) [Google Scholar] [CrossRef]
- Wu, Y.; Peng, C. Influence analysis of rural morphological factors on microclimate cooling effect of water body. J. Southeast Univ. (Nat. Sci. Ed.) 2022, 52, 179–188. (In Chinese) [Google Scholar] [CrossRef]
- Sukjin, J.; Seonghwan, Y. Changes in Sunlight and Outdoor Thermal Environment Conditions Based on the Layout Plan of Flat Type Apartment Houses. Energies 2015, 8, 9155–9172. [Google Scholar] [CrossRef]
- Liu, Z.; Zhao, X.; Jin, H. Thermal environment of riverside residential areas at Harbin in winter. J. Harbin Inst. Technol. 2017, 49, 164–171. (In Chinese) [Google Scholar]
- Du, X.; Shi, Y.; Zhang, Y. Numerical Study and Design of Thermal Environment of Living Street Canyons in Guangzhou. Build. Sci. 2015, 31, 78–87. (In Chinese) [Google Scholar] [CrossRef]
- Shao, Y.; Liu, B. A Study on Microclimate Parameters of Urban Street Space and Its Influential Factors. Landsc. Archit. 2016, 135, 98–104. (In Chinese) [Google Scholar] [CrossRef]
- Tsoka, S. Investigating the Relationship Between Urban Spaces Morphology and Local Microclimate: A Study for Thessaloniki. Procedia Environ. Sci. 2017, 38, 674–681. [Google Scholar] [CrossRef]
- Kurazumi, Y.; Kondo, E.; Fukagawa, K.; Yamato, Y.; Tobita, K.; Tsuchikawa, T. Effects of Outdoor Thermal Environment upon the Human Responses. Engineering (1947-3931) 2019, 11, 475–503. [Google Scholar] [CrossRef]
- Xin, K.; Zhao, J.; Wang, T.; Gao, W.; Zhang, Q. Architectural Simulations on Spatio-Temporal Changes of Settlement Outdoor Thermal Environment in Guanzhong Area, China. Buildings 2022, 12, 345. [Google Scholar] [CrossRef]
- Wang, H.; Hu, S. Analysis on the Applicability of PMV Thermal Comfort Model. Build. Sci. 2009, 25, 108–114. (In Chinese) [Google Scholar] [CrossRef]
- Fiorillo, E.; Brilli, L.; Carotenuto, F.; Cremonini, L.; Gioli, B.; Giordano, T.; Nardino, M. Diurnal Outdoor Thermal Comfort Mapping through Envi-Met Simulations, Remotely Sensed and In Situ Measurements. Atmosphere 2023, 14, 641. [Google Scholar] [CrossRef]
- Yang, F.; Qian, F.; Liu, S. Evaluation of Measurement and Numerical Simulation of Outdoor Thermal Environmental Effect of Planning and Design Strategies of High-rise Residential Quarters. Build. Sci. 2013, 29, 28–34+92. (In Chinese) [Google Scholar] [CrossRef]
- Kariminia, S.; Ahmad, S.S. Dependence of Visitors’ Thermal Sensations on Built Environments at an Urban Square. Procedia Soc. Behav. Sci. 2013, 85, 523–534. [Google Scholar] [CrossRef]
- Kariminia, S.; Motamedi, S.; Shamshirband, S.; Petković, D.; Roy, C.; Hashim, R. Adaptation of ANFIS Model to Assess Thermal Comfort of an Urban Square in Moderate and Dry Climate. Stoch. Environ. Res. Risk Assess. 2016, 30, 1189–1203. [Google Scholar] [CrossRef]
- Guo, C.; Fu, J.; Guo, Z.; Zhao, J. Rssearch on the Thermal Comfort Evaluation Framework of Vernacular Architecture under the Subjective and Objective Judgment Mechanism. Archit. J. (Acad. Issue) 2020, 21, 22–26. (In Chinese) [Google Scholar]
- Cheng, Y.; Guo, W. An Analysis of the Principles That Create the Microclimate of Courtyards in Vernacular Houses Surrounded by Embankment. Archit. J. 2015, 557, 70–73. (In Chinese) [Google Scholar]
- Guo, W.; Wang, X.; Zhang, G.; Li, W. Research on the Climate Adaptability of Traditional Villages and Houses: A Case Study of Hengtang Village in Dongyang City. J. Hum. Settl. West China 2021, 36, 134–140. (In Chinese) [Google Scholar] [CrossRef]
- Guo, W.; Ding, Y.; Yang, G.; Liu, X. Research on the Indicators of Sustainable Campus Renewal and Reconstruction in Pursuit of Continuous Historical and Regional Context. Buildings 2022, 12, 1508. [Google Scholar] [CrossRef]
- Bruse, M.; Fleer, H. Simulating Surface–Plant–Air Interactions inside Urban Environments with a Three Dimensional Numerical Model. Environ. Model. Softw. 1998, 13, 373–384. [Google Scholar] [CrossRef]
- Nikolova, I.; Janssen, S.; Vos, P.; Vrancken, K.; Mishra, V.; Berghmans, P. Dispersion Modelling of Traffic Induced Ultrafine Particles in a Street Canyon in Antwerp, Belgium and Comparison with Observations. Sci. Total Environ. 2011, 412–413, 336–343. [Google Scholar] [CrossRef]
- Cheng, Y. Weizi Folk House in Western Anhui—On the Construction Strategy of Traditional Architecture Adapting to the Climate. Sichuan Build. Sci. 2009, 35, 244–249. (In Chinese) [Google Scholar]
- Fang, Z.; Lin, Z.; Mak, C.M.; Niu, J.; Tse, K.-T. Investigation into Sensitivities of Factors in Outdoor Thermal Comfort Indices. Build. Environ. 2018, 128, 129–142. [Google Scholar] [CrossRef]
- Shi, D.; Song, J.; Huang, J.; Zhuang, C.; Guo, R.; Gao, Y. Synergistic Cooling Effects (SCEs) of Urban Green-Blue Spaces on Local Thermal Environment: A Case Study in Chongqing, China. Sustain. Cities Soc. 2020, 55, 102065. [Google Scholar] [CrossRef]
- Ouyang, W.; Sinsel, T.; Simon, H.; Morakinyo, T.E.; Liu, H.; Ng, E. Evaluating the thermal-radiative performance of ENVI-met model for green infrastructure typologies: Experience from a subtropical climate. Build. Environ. 2022, 207, 108427. [Google Scholar] [CrossRef]
- Kumar, S.; Kaur, T. Development of ANN Based Model for Solar Potential Assessment Using Various Meteorological Parameters. Energy Procedia 2016, 90, 587–592. [Google Scholar] [CrossRef]
- Rosso, F.; Golasi, I.; Castaldo, V.L.; Piselli, C.; Pisello, A.L.; Salata, F.; Ferrero, M.; Cotana, F.; de Lieto Vollaro, A. On the Impact of Innovative Materials on Outdoor Thermal Comfort of Pedestrians in Historical Urban Canyons. Renew. Energy 2018, 118, 825–839. [Google Scholar] [CrossRef]
- Salata, F.; Golasi, I.; Petitti, D.; de Lieto Vollaro, E.; Coppi, M.; de Lieto Vollaro, A. Relating Microclimate, Human Thermal Comfort and Health during Heat Waves: An Analysis of Heat Island Mitigation Strategies through a Case Study in an Urban Outdoor Environment. Sustain. Cities Soc. 2017, 30, 79–96. [Google Scholar] [CrossRef]
- Xin, Y.; Shuang, H.; Qi, Z. Thermal Comfort Measurement and Landscape Reconstruction Strategy of Street Space Based on Decomposition Grid Method:A Case Study of Yangmeizhu Street. J. Landsc. Res. 2020, 12, 33–38+46. [Google Scholar] [CrossRef]
- Theeuwes, N.E.; Solcerová, A.; Steeneveld, G.J. Modeling the Influence of Open Water Surfaces on the Summertime Temperature and Thermal Comfort in the City. J. Geophys. Res. Atmos. 2013, 118, 8881–8896. [Google Scholar] [CrossRef]
- Sayad, B.; Alkama, D.; Ahmad, H.; Baili, J.; Aljahdaly, N.H.; Menni, Y. Nature-Based Solutions to Improve the Summer Thermal Comfort Outdoors. Case Stud. Therm. Eng. 2021, 28, 101399. [Google Scholar] [CrossRef]
- Manteghi, G. A Field Investigation on the Impact of the Wider Water Body On-Air, Surface Temperature and Physiological Equivalent Temperature at Malacca Town. Int. J. Environ. Sci. Dev. 2020, 11, 286–291. [Google Scholar] [CrossRef]
- Zheng, S.; Guldmann, J.-M.; Wang, Z.; Qiu, Z.; He, C.; Wang, K. Experimental and Theoretical Study of Urban Tree Instantaneous and Hourly Transpiration Rates and Their Cooling Effect in Hot and Humid Area. Sustain. Cities Soc. 2021, 68, 102808. [Google Scholar] [CrossRef]
- Davtalab, J.; Deyhimi, S.P.; Dessi, V.; Hafezi, M.R.; Adib, M. The Impact of Green Space Structure on Physiological Equivalent Temperature Index in Open Space. Urban Clim. 2020, 31, 100574. [Google Scholar] [CrossRef]
- Morakinyo, T.E.; Lam, Y.F. Simulation Study on the Impact of Tree-Configuration, Planting Pattern and Wind Condition on Street-Canyon’s Micro-Climate and Thermal Comfort. Build. Environ. 2016, 103, 262–275. [Google Scholar] [CrossRef]
- Chen, H.; Ooka, R.; Huang, H.; Tsuchiya, T. Study on Mitigation Measures for Outdoor Thermal Environment on Present Urban Blocks in Tokyo Using Coupled Simulation. Build. Environ. 2009, 44, 2290–2299. [Google Scholar] [CrossRef]
- Huang, W.; Liu, X.; Zhang, S.; Zheng, Y.; Ding, Q.; Tong, B. Performance-Guided Design of Permeable Asphalt Concrete with Modified Asphalt Binder Using Crumb Rubber and SBS Modifier for Sponge Cities. Materials 2021, 14, 1266. [Google Scholar] [CrossRef] [PubMed]
- Hong, X.-C.; Cheng, S.; Liu, J.; Dang, E.; Wang, J.-B.; Cheng, Y. The Physiological Restorative Role of Soundscape in Different Forest Structures. Forests 2022, 13, 1920. [Google Scholar] [CrossRef]
- Hong, X.-C.; Liu, J.; Wang, G.-Y. Soundscape in Urban Forests. Forests 2022, 13, 2056. [Google Scholar] [CrossRef]


| Measuring Point | Description |
|---|---|
| 1 | At the main entrance road of the settlement, near peripheral water bodies and surrounded by multi-level greening and many trees |
| 2 | Near water bodies at the settlement center |
| 3 | At the main road intersection at the settlement center, away from the internal water bodies |
| 4 | At the secondary entrance and exit of the settlement, near peripheral water bodies, but with fewer greening clusters and trees |
| PET (°C) | ≤4 | 4–8 | 8–13 | 13–18 | 18–23 | 23–29 | 29–35 | 35–41 | ≥41 |
|---|---|---|---|---|---|---|---|---|---|
| Thermal sensation | Very cold | Cold | Cool | Slightly cool | Neutral | Slightly warm | Warm | Hot | Very hot |
| Physiological stress level | Extreme cold stress | Strong cold stress | Moderate cold stress | Slight cold stress | No | Slight heat stress | Moderate heat stress | Strong heat stress | Extreme heat stress |
| Meteorological Parameters | Evaluation Indicators | Point 1 | Point 2 | Point 3 | Point 4 |
|---|---|---|---|---|---|
| Air temperature | RMSE (°C) | 1.51 | 1.34 | 1.40 | 1.20 |
| MAPE (%) | 5.92 | 4.72 | 5.29 | 4.22 | |
| Relative humidity | RMSE (%) | 2.31 | 2.19 | 2.13 | 2.01 |
| MAPE (%) | 3.70 | 3.60 | 3.47 | 3.44 |
| Parameters | Parameter Values | |
|---|---|---|
| Simulation settings | Total simulation time (h) Output time interval (min) Number of grids (X × Y × Z) | 30 60 233 × 231 × 15 |
| Initial parameter setting | Simulation start date Simulation start time Initial temperature (°C) Wind speed at 10 m (m/s) Wind direction at 10 m (◦) Relative humidity at 2 m (%) Specific humidity at 2500 m (g/kg) | 20 June 2021 18:00 25.2 2.4 202.5 S-W 56 7 |
| Grid No. | Water Body Coverage | Road Coverage | Bare Soil Coverage | Greening Coverage | Building Coverage | PET (°C) Value |
|---|---|---|---|---|---|---|
| 1 | 35.8% | 0.0% | 64.2% | 0.0% | 0.0% | 39.8 |
| 2 | 49.7% | 0.0% | 29.0% | 21.3% | 0.0% | 36.4 |
| 3 | 70.1% | 0.0% | 22.7% | 7.2% | 0.0% | 37.0 |
| 4 | 64.6% | 0.0% | 35.4% | 0.0% | 0.0% | 37.2 |
| 5 | 60.3% | 0.0% | 39.0% | 0.0% | 0.7% | 37.6 |
| 6 | 56.4% | 0.0% | 35.9% | 6.8% | 0.9% | 36.7 |
| 7 | 69.6% | 0.0% | 29.7% | 0.7% | 0.0% | 36.0 |
| 8 | 46.3% | 0.0% | 47.0% | 6.7% | 0.0% | 37.8 |
| 9 | 53.4% | 0.0% | 46.6% | 0.0% | 0.0% | 36.4 |
| 10 | 22.1% | 0.0% | 23.0% | 34.0% | 20.9% | 36.8 |
| 11 | 0.0% | 4.9% | 34.9% | 0.0% | 60.2% | 38.2 |
| 12 | 0.0% | 10.8% | 28.6% | 50.9% | 9.7% | 36.3 |
| 13 | 0.0% | 11.0% | 26.3% | 50.4% | 12.3% | 36.8 |
| 14 | 0.0% | 9.9% | 32.2% | 22.7% | 35.2% | 39.8 |
| 15 | 0.0% | 2.6% | 21.3% | 34.7% | 41.4% | 37.8 |
| 16 | 72.9% | 0.0% | 13.0% | 13.1% | 1.0% | 36.7 |
| 17 | 51.1% | 0.0% | 48.9% | 0.0% | 0.0% | 37.5 |
| 18 | 1.6% | 0.0% | 14.2% | 63.8% | 20.4% | 36.2 |
| 19 | 0.0% | 17.2% | 42.6% | 6.0% | 34.2% | 38.9 |
| 20 | 0.0% | 12.9% | 34.8% | 13.5% | 38.8% | 38.6 |
| 21 | 0.0% | 0.0% | 28.4% | 25.2% | 46.4% | 39.1 |
| 22 | 0.0% | 0.0% | 8.4% | 68.9% | 22.7% | 37.3 |
| 23 | 0.0% | 8.8% | 32.4% | 38.6% | 20.2% | 38.4 |
| 24 | 49.4% | 5.4% | 38.7% | 1.3% | 5.2% | 36.7 |
| 25 | 55.2% | 0.0% | 44.8% | 0.0% | 0.0% | 36.5 |
| 26 | 0.0% | 8.9% | 20.1% | 55.0% | 16.0% | 36.0 |
| 27 | 10.2% | 13.0% | 44.8% | 18.0% | 14.0% | 38.4 |
| 28 | 10.7% | 12.3% | 45.1% | 1.5% | 30.4% | 38.9 |
| 29 | 48.4% | 10.8% | 10.4% | 17.9% | 12.5% | 37.0 |
| 30 | 12.0% | 11.7% | 32.1% | 8.7% | 35.5% | 37.9 |
| 31 | 0.0% | 1.6% | 4.1% | 67.3% | 27.0% | 36.5 |
| 32 | 56.0% | 7.5% | 35.4% | 0.0% | 1.1% | 36.5 |
| 33 | 45.1% | 1.7% | 47.3% | 5.9% | 0.0% | 37.4 |
| 34 | 0.0% | 10.3% | 27.8% | 45.6% | 16.3% | 38.2 |
| 35 | 18.7% | 0.0% | 9.1% | 70.1% | 2.1% | 37.0 |
| 36 | 2.9% | 0.0% | 21.5% | 35.1% | 40.5% | 38.6 |
| 37 | 70.1% | 0.0% | 19.9% | 4.0% | 6.0% | 36.8 |
| 38 | 36.5% | 7.9% | 31.0% | 11.0% | 13.6% | 37.2 |
| 39 | 0.8% | 24.2% | 32.7% | 4.2% | 38.1% | 37.4 |
| 40 | 55.9% | 11.4% | 32.7% | 0.0% | 0.0% | 37.9 |
| 41 | 56.9% | 9.3% | 28.1% | 0.0% | 5.7% | 36.6 |
| 42 | 0.0% | 0.0% | 20.2% | 51.6% | 28.2% | 36.2 |
| 43 | 0.0% | 0.0% | 14.2% | 85.8% | 0.0% | 36.0 |
| 44 | 0.0% | 0.0% | 52.3% | 5.9% | 41.8% | 39.9 |
| 45 | 0.0% | 13.6% | 41.2% | 11.9% | 33.3% | 37.7 |
| 46 | 0.0% | 9.5% | 30.2% | 28.6% | 31.7% | 37.5 |
| 47 | 16.6% | 12.3% | 22.8% | 28.8% | 19.5% | 37.8 |
| 48 | 54.8% | 0.0% | 45.2% | 0.0% | 0.0% | 37.5 |
| 49 | 79.8% | 5.7% | 11.0% | 0.0% | 3.5% | 37.4 |
| 50 | 6.3% | 7.3% | 41.3% | 0.0% | 45.1% | 38.6 |
| 51 | 21.9% | 14.4% | 26.9% | 0.0% | 36.8% | 38.3 |
| 52 | 24.6% | 9.5% | 41.2% | 0.0% | 24.7% | 38.0 |
| 53 | 2.5% | 9.8% | 23.9% | 42.4% | 21.4% | 38.2 |
| 54 | 1.5% | 0.0% | 0.0% | 95.5% | 3.0% | 35.7 |
| 55 | 32.4% | 0.0% | 6.8% | 60.8% | 0.0% | 35.9 |
| 56 | 33.2% | 0.0% | 66.8% | 0.0% | 0.0% | 36.6 |
| 57 | 24.2% | 0.0% | 75.8% | 0.0% | 0.0% | 39.2 |
| 58 | 36.6% | 0.0% | 63.4% | 0.0% | 0.0% | 39.1 |
| 59 | 74.1% | 0.0% | 25.9% | 0.0% | 0.0% | 37.4 |
| 60 | 75.7% | 0.0% | 24.3% | 0.0% | 0.0% | 36.5 |
| 61 | 72.9% | 0.0% | 27.1% | 0.0% | 0.0% | 36.6 |
| 62 | 56.1% | 0.0% | 43.9% | 0.0% | 0.0% | 37.2 |
| 63 | 76.6% | 0.0% | 23.4% | 0.0% | 0.0% | 36.8 |
| 64 | 26.8% | 0.0% | 73.2% | 0.0% | 0.0% | 37.2 |
| Water Body Coverage | Road Coverage | Bare Soil Coverage | Greening Coverage | Building Coverage | ||
|---|---|---|---|---|---|---|
| Pearson correlation between settlement space components and PET | r Sig. | −0.328 ** 0.008 | 0.281 * 0.024 | 0.481 ** 0.000 | −0.331 ** 0.007 | 0.494 ** 0.000 |
Disclaimer/Publisher’s Note: The statements, opinions and data contained in all publications are solely those of the individual author(s) and contributor(s) and not of MDPI and/or the editor(s). MDPI and/or the editor(s) disclaim responsibility for any injury to people or property resulting from any ideas, methods, instructions or products referred to in the content. |
© 2023 by the authors. Licensee MDPI, Basel, Switzerland. This article is an open access article distributed under the terms and conditions of the Creative Commons Attribution (CC BY) license (https://creativecommons.org/licenses/by/4.0/).
Share and Cite
Cheng, Y.; Bao, Y.; Liu, S.; Liu, X.; Li, B.; Zhang, Y.; Pei, Y.; Zeng, Z.; Wang, Z. Thermal Comfort Analysis and Optimization Strategies of Green Spaces in Chinese Traditional Settlements. Forests 2023, 14, 1501. https://doi.org/10.3390/f14071501
Cheng Y, Bao Y, Liu S, Liu X, Li B, Zhang Y, Pei Y, Zeng Z, Wang Z. Thermal Comfort Analysis and Optimization Strategies of Green Spaces in Chinese Traditional Settlements. Forests. 2023; 14(7):1501. https://doi.org/10.3390/f14071501
Chicago/Turabian StyleCheng, Yanyan, Ying Bao, Shengshuai Liu, Xiao Liu, Bin Li, Yuqing Zhang, Yue Pei, Zhi Zeng, and Zhaoyu Wang. 2023. "Thermal Comfort Analysis and Optimization Strategies of Green Spaces in Chinese Traditional Settlements" Forests 14, no. 7: 1501. https://doi.org/10.3390/f14071501
APA StyleCheng, Y., Bao, Y., Liu, S., Liu, X., Li, B., Zhang, Y., Pei, Y., Zeng, Z., & Wang, Z. (2023). Thermal Comfort Analysis and Optimization Strategies of Green Spaces in Chinese Traditional Settlements. Forests, 14(7), 1501. https://doi.org/10.3390/f14071501


