Article

Maxent Modeling for Predicting the Potential Geographical Distribution of Castanopsis carlesii under Various Climate Change Scenarios in China

1
Jiangxi Provincial Key Laboratory of Silviculture, College of Forestry, Jiangxi Agricultural University, Nanchang 330045, China
2
Chongyi County Yangmei Town Public Convenience Service Center, Ganzhou 341301, China
3
Chongyi County Lvzhilan Forestry Co., Ltd., Ganzhou 341301, China
*
Author to whom correspondence should be addressed.
Forests 2023, 14(7), 1397; https://doi.org/10.3390/f14071397
Submission received: 7 June 2023 / Revised: 3 July 2023 / Accepted: 6 July 2023 / Published: 9 July 2023
(This article belongs to the Special Issue Non-timber Forestry Breeding, Cultivation and Processing Technology)

Abstract

:
Castanopsis carlesii (Hemsl.) Hayata. 1917 is an established subtropical evergreen broad-leaved tree species with rapid growth rates and a strong plasticity to environmental changes. It is widely distributed in East Asia; however, it is unclear how climate change influences the distribution of this tree species. Based on 210 valid occurrence records and 10 environmental variables, we used maximum entropy model (Maxent) to predict its potential geographical distribution under present and three future climate scenarios (SSP126, SSP245 and SSP585) in both the 2050s and 2070s, and determined the influence of climate on the distribution of C. carlesii. The area under the curve (AUC) value of the simulated training and the test were 0.949 and 0.920, respectively, indicating an excellent forecast. The main climatic factors affecting the distribution of C. carlesii are mainly precipitation, especially that of the driest month (Bio14, 75.5%), and annual precipitation (Bio12, 14.3%); its total contribution rate is 89.8%. However, the impact of average mean temperature is lesser in comparison (Bio1, 5.7%). According to the present-day predictions, C. carlesii has a suitable habitat of 208.66 × 10⁴ km2 across most of the tropical and subtropical regions south of the Yangtze River. The medium and high suitability areas are mainly in Taiwan, Fujian, Jiangxi, Guangdong, Hainan and Guangxi Provinces. With the climate projected to warm in the future, the distribution area of C. carlesii exhibited a tendency of northward expansion along the Qinling–Huaihe line, mainly manifested as the increase in low and medium suitable areas. The area of high-suitable areas decreased significantly under the three climate scenarios both for the 2050s and 2070s, and only a few areas showed contraction of suitable areas. Therefore, expansion areas can be used for cultivation or introduction trials, while contraction areas require enhanced preservation and collection of genetic resources. Our findings provide a theoretical basis for formulating the adaptation and protection strategies to cope with future climate change as well as theoretical guidance for the introduction, cultivation and sustainable development of C. carlesii.

1. Introduction

The geographic distribution of tree species is related to multiple factors, including the physiological and ecological characteristics, biological and non-biological factors (such as temperature, precipitation, etc.) [1]. Climate is regarded as the most crucial environmental factor affecting vegetation distribution in large-scale regions [2,3]. As an important basis for studying global climate change, the relationship between vegetation and climate has always attracted the attention of ecologists and geographers. Since the industrial revolution, the concentration of greenhouse gases such as carbon dioxide in the atmosphere has increased sharply due to human activities. The average global surface temperature has increased by approximately 1 °C compared with the pre-industrial era, and the degree of global warming will be further amplified in the next 20 years [4]. With the climate warming, global hydrothermal distribution patterns may change, and extreme weather events may occur more frequently [5]. Climate change and its impact on global hydrothermal distribution patterns can pose a serious challenge to forest ecosystems and will have a significant impact on the distribution of species and may even accelerate the extinction of some vegetation [6,7,8]. Therefore, studying the potential geographical distribution and future distribution dynamics of species in the context of climate change is of great significance for both sustainable resource management and biodiversity conservation.
Castanopsis carlesii (Hemsl.) Hayata. 1917 is one of established tree species of subtropical evergreen broad-leaved forests. It belongs to the genus Castanopsis, which is part of the family Fagaceae. This species is highly regarded as a precious tree species due to its good economic value and strong ecological significance. It is not only a prominent timber species, but also an excellent material for cultivating edible fungi [9]. In addition, the specie has great potential for development and utilization because of high starch content in fruits. In China, this tree species has strong adaptability and wide distribution, mainly found in the south of the Yangtze River, especially in the mountainous or hilly areas below the 1300 m altitude [9]. Warm and humid environment is more suitable for the growth of the species. However, in the past 40 years, the habitat of C. carlesii has been seriously damaged and the natural distribution area has been sharply reduced due to serious human interference. At present, research about C. carlesii mainly focuses on forest regeneration, litter return dynamics [10,11,12], and nutrient response (e.g., nitrogen and phosphorus) [13]. Nevertheless, there are few studies on spatial pattern of species and ecological suitability in a large-scale region. Furthermore, studying the relationship between C. carlesii and climate can help identify the potential impact of future climate change on the species which can provide information about its distribution range, habitat preference, and population dynamics. This information can also help develop conservation strategies, such as identifying suitable areas for habitat restoration or facilitating the species adaptation to changing climates through assisted migration or breeding programs.
Various species distribution models (SDMs), such as BIOCLIM, GARP, Climex, and Maxent, have been used to predict the potential geographical distribution of species based on the relationship between species distribution and niche factors [14,15], which are applied in many fields such as ecological geography and conservation ecology [16]. For instance, Cheuk and Fischer [17] explored the effects of different climatic factors on the potential geographical distribution of Castanopsis sclerophylla, which can provide scientific basis for provenance protection, habitat restoration, breeding and domestication of C. sclerophylla. Maxent is a widely used tool in the field of SDM and plays an important role in studying the spatial distribution dynamics of species and biodiversity conservation with the advantages of small sample size requirement, high simulation accuracy and user-friendly interface [18,19,20].
In this study, we used the Maxent model to predict potential geographical distribution under present and three future climate scenarios based on the natural distribution records of species and related environmental factors aiming to solve the following problems: (1) analyzing the key environmental variables that affect the distribution of species, (2) predicting the potential distribution of C. carlesii in present climate and exploring the relationship between environmental variables and potential geographical distribution, (3) forecasting dynamic changes in potential geographical distribution pattern under different future climate scenarios so as to provide a scientific theoretical basis for formulating the adaptation and protection strategies of this species.

2. Materials and Methods

2.1. Occurrence Sources

A total of 1672 geographical distribution pieces of data of C. carlesii were collected from the Global Biodiversity Information Facility (GBIF, https://www.gbif.org, the accessed date is 10 July 2022), the Chinese Virtual Herbarium (CVH, https://www.cvh.ac.cn, the accessed date is 11 July 2022) literature and filed surveys. We used Google Earth to complement occurrence records with detailed location information but no longitude and latitude coordinates. Furthermore, records without inaccurate geographical location information were discarded, and duplicate records were deleted [21]. To decrease the effect of sampling bias, only one occurrence record was retained within the same grid spatial distribution range as geographical distribution data. Finally, a total of 210 valid occurrence records were retained for model construction.

2.2. Environmental Data

Environmental variables based on species niche have important ecological significance for understanding habitat distribution. Temperature and precipitation were positively correlated with plant woodiness and affecting species distribution [22]. In this study, 19 bioclimatic variables (Bio1-Bio19: including 11 temperature variables and 8 precipitation variables) for the present period (1970–2000) and topographical data (altitude) were derived from the WorldClim dataset (the new Version 2.1 updated in January 2020). The data spatial resolution was 2.5 arc-minutes [23]. The Beijing Climate Center Climate System Model (BCC-CSM2-MR model) from the sixth international Coupled Model Intercomparison Project (CMIP6) was selected to predict potential geographical distribution in future climate scenarios [24]. The model has a strong ability to simulate the characteristics of climate precipitation, especially extreme precipitation in China. National development policies are also linked to climate change processes. To further consider the impact of economic development patterns on climate change, this study selected the shared socioeconomic pathways (SSPs) that can depict different trajectories of future socioeconomic system development and reflect the relationship between socioeconomic development patterns and climate change risks [25]. SSP126 is a sustainable green development path which belongs to the climate scenario with low greenhouse gas emissions limiting global warming to below 2 °C by 2100. SSP245 belongs to the medium greenhouse gas emissions scenario, which indicates a future global temperature increase by approximately 3 °C. SSP585 is a climate scenario with large population growth and high fossil fuel consumption, which belongs to the worst climate scenario of future greenhouse gas emissions [26]. Three scenarios (SSP126, SSP245 and SSP585) and two periods in 2050s (2041–2060) and 2070s (2061–2080) were selected as future environmental data sources.
To avoid the problem of over-fitting of the model, 20 environmental factor layer files processed into the ASCII format by ArcGIS 10.7 (Esri, Redlands, California, USA) software were imported into the Maxent model for pre-simulation, and repeated 10 times with default parameters [27]. Then, the jackknife test was used to remove variables whose contribution rate was 0, and the Pearson correlation analysis was carried out by using the multi-value extraction module in ArcGIS. For the environmental factors with a Pearson correlation coefficient of |r| ≥ 0.8 [28], the environmental variables with higher contribution rate and more biological significance in the model operation results were retained to eliminate multicollinearity between variables. Finally, 10 highly correlated environmental factors were retained to construct the model (Table 1).

2.3. Construction and Evaluation of Model

A total of 210 valid records and environmental variable layer files in ASCII format processed within ArcGIS were imported into the Maxent model (Version 3.3.3) for simulation. We used the default regularization multiplier (RM) value of 1 to avoid model over-fitting [29], and intermediate RM was better than low or high values [30]. To evaluate the predictive performance of the model, 75% of the distribution records were selected randomly for the training data set, and the remaining 25% were regarded as the test data set. The Jackknife test was used to calculate the permutation importance and contribution rate of each environment variable, and the training was repeated three times. The remaining parameters were selected by default. The accuracy of the Maxent model simulation was usually evaluated by the receiver operating characteristic curve (ROC curve) [31]. The area enclosed by the ROC curve and the abscissa is the AUC value, which is used to measure the classification model. The larger AUC represents the better performance. Usually, the AUC value of 0.5–0.7 indicates that the prediction accuracy of the model is poor, the value of 0.7–0.9 indicates moderate performance, and a value greater than 0.9 indicates high performance [32].

2.4. Division of Suitable Areas

Visualization of simulation results and grades of suitable habitats was completed within ArcGIS. In this study, the equal interval classification method was used to divide the suitability index into evenly distributed grades ranging from low suitability (0.00) to high suitability (1.00) [33]. According to the suitability classification method of Dalbergia cultrata [31], the suitability of C. carlesii habitat distribution was reclassified into four grades: habitats not suitable (<0.10), habitats of low suitability (0.10–0.30), habitats of medium suitability (0.30–0.60), and habitats of high suitability (>0.60).

3. Results

3.1. Prediction Accuracy Evaluation of the Model

According to the simulating results of the Maxent model based on 210 valid records and ten environmental variables, the AUC values for the training data and the test data were relatively high, indicating that the model has good predictive power and is suitable (Figure 1).

3.2. Major Environmental Factors

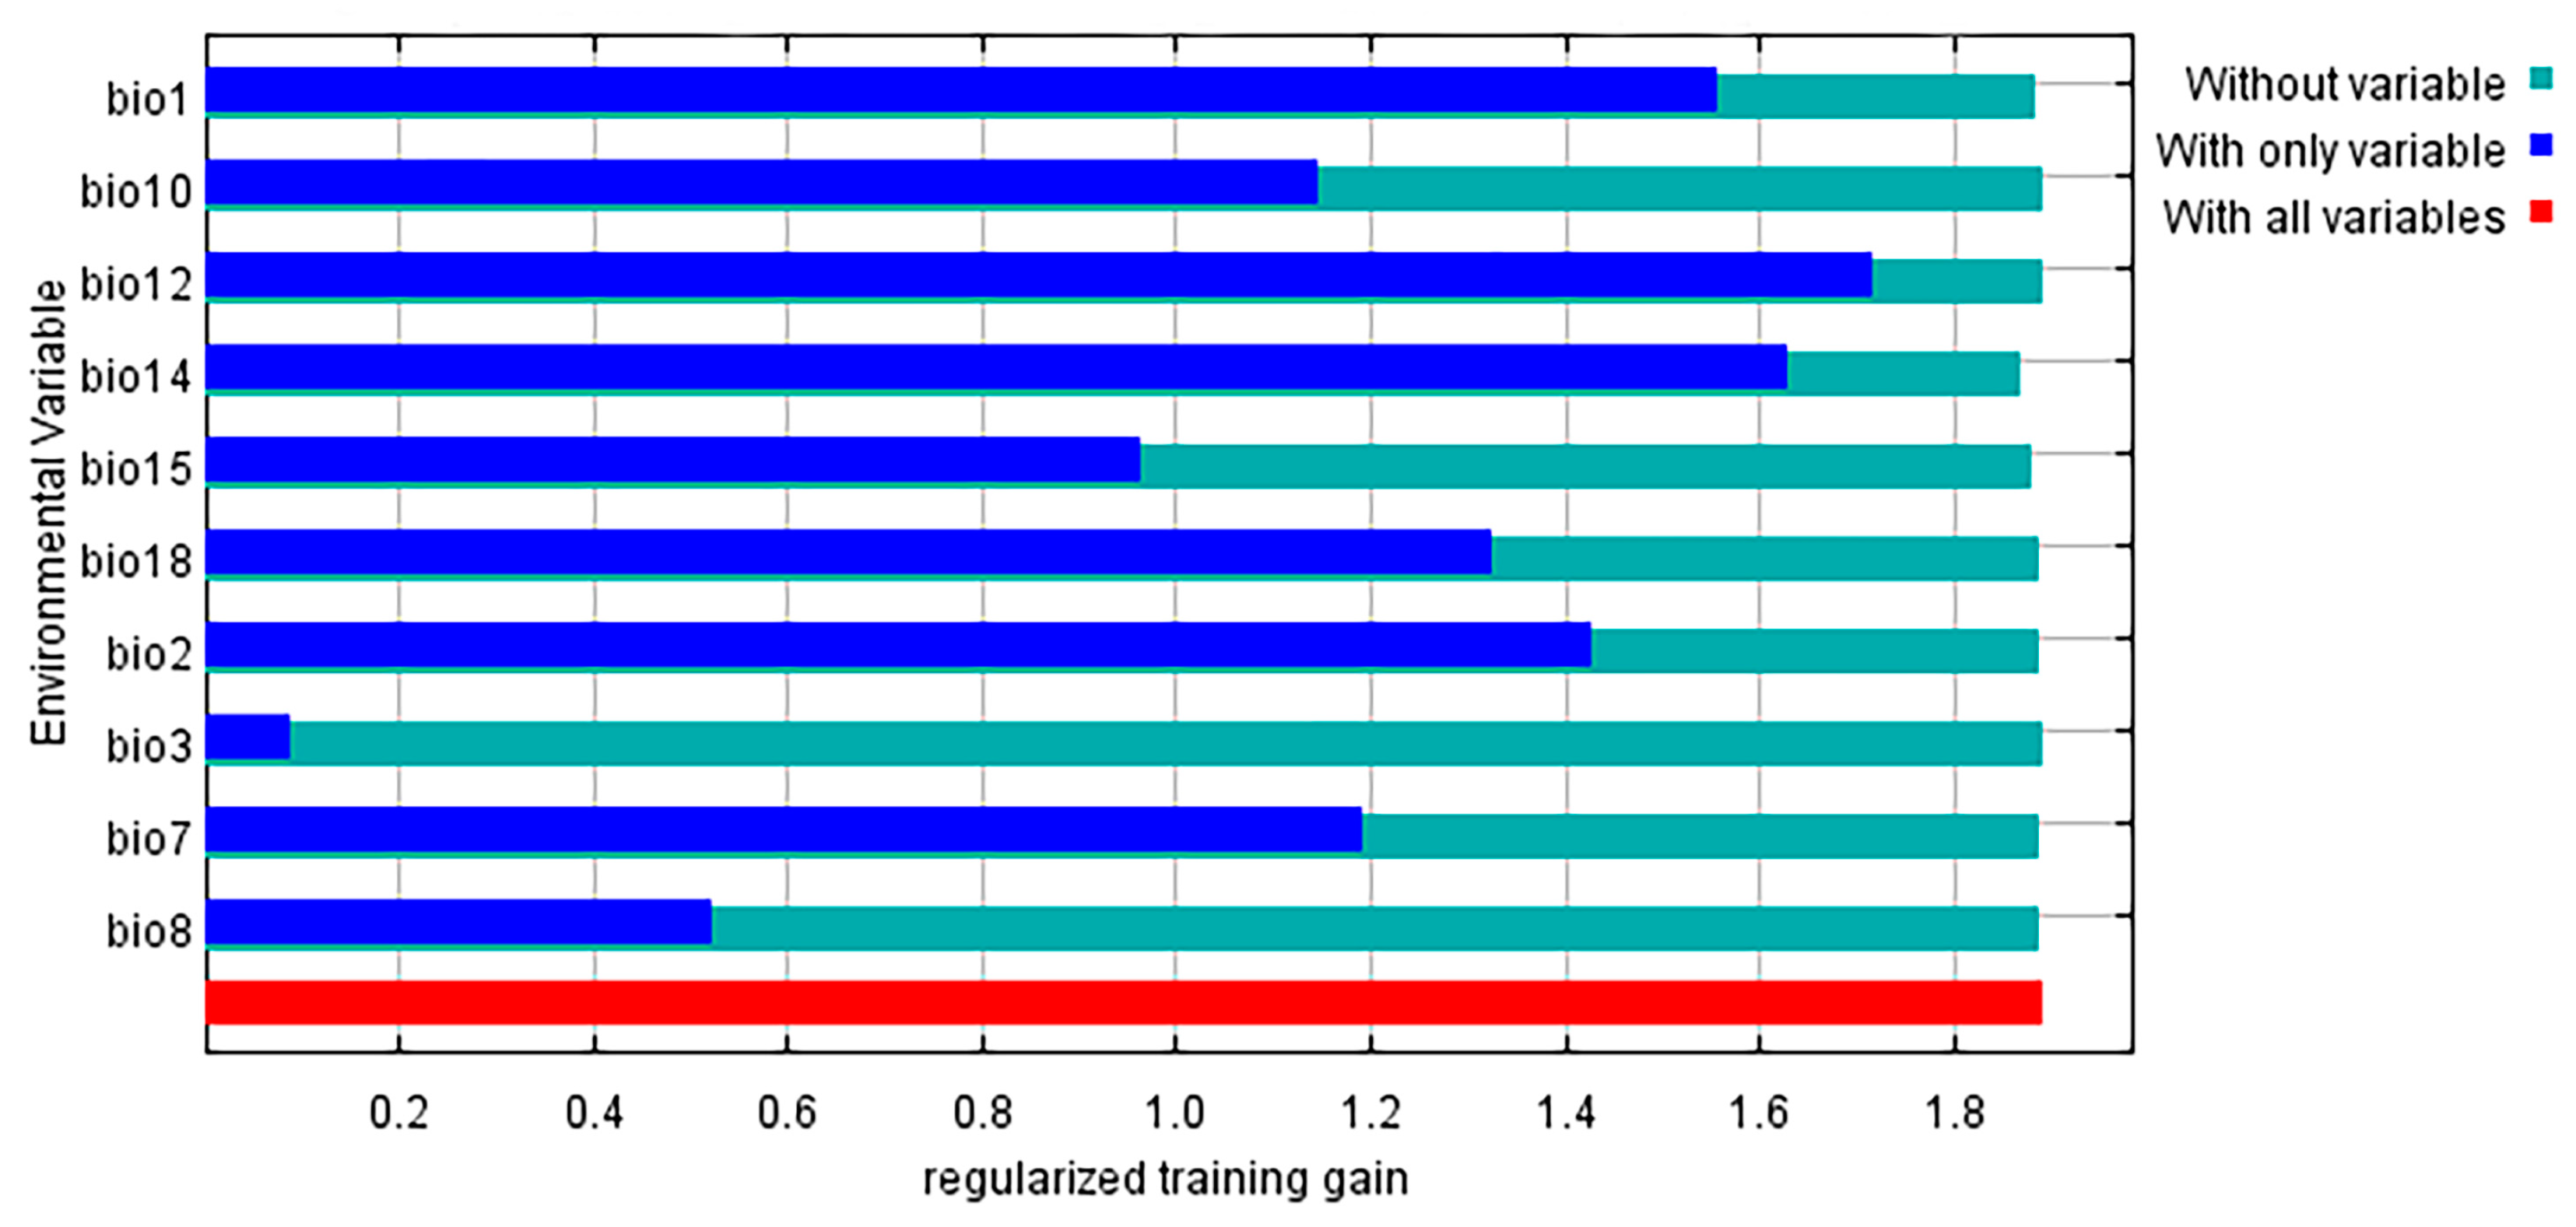
Among the 10 environmental factors variables predicted by the Maxent model, the top five environmental variables were precipitation of driest month (Bio14, 75.5% contribution rate), annual precipitation (Bio12, 14.3% contribution rate), annual average temperature (Bio1, 5.7% contribution rate), precipitation seasonality (Bio15, 1.3% contribution rate) and mean diurnal range (Bio2, 1.2% contribution rate), with a cumulative contribution rate of 98% of the model prediction (Table 1). The jackknife test showed that annual precipitation (Bio12) was the most significant contributor (higher training gains) to the habitat suitability distribution of C. carlesii, followed by precipitation of driest month (Bio14), annual average temperature (Bio1), mean diurnal range (Bio2), and precipitation in the warmest quarter (Bio18). Compared with other variables, these variables contain more effective information (Figure 2).
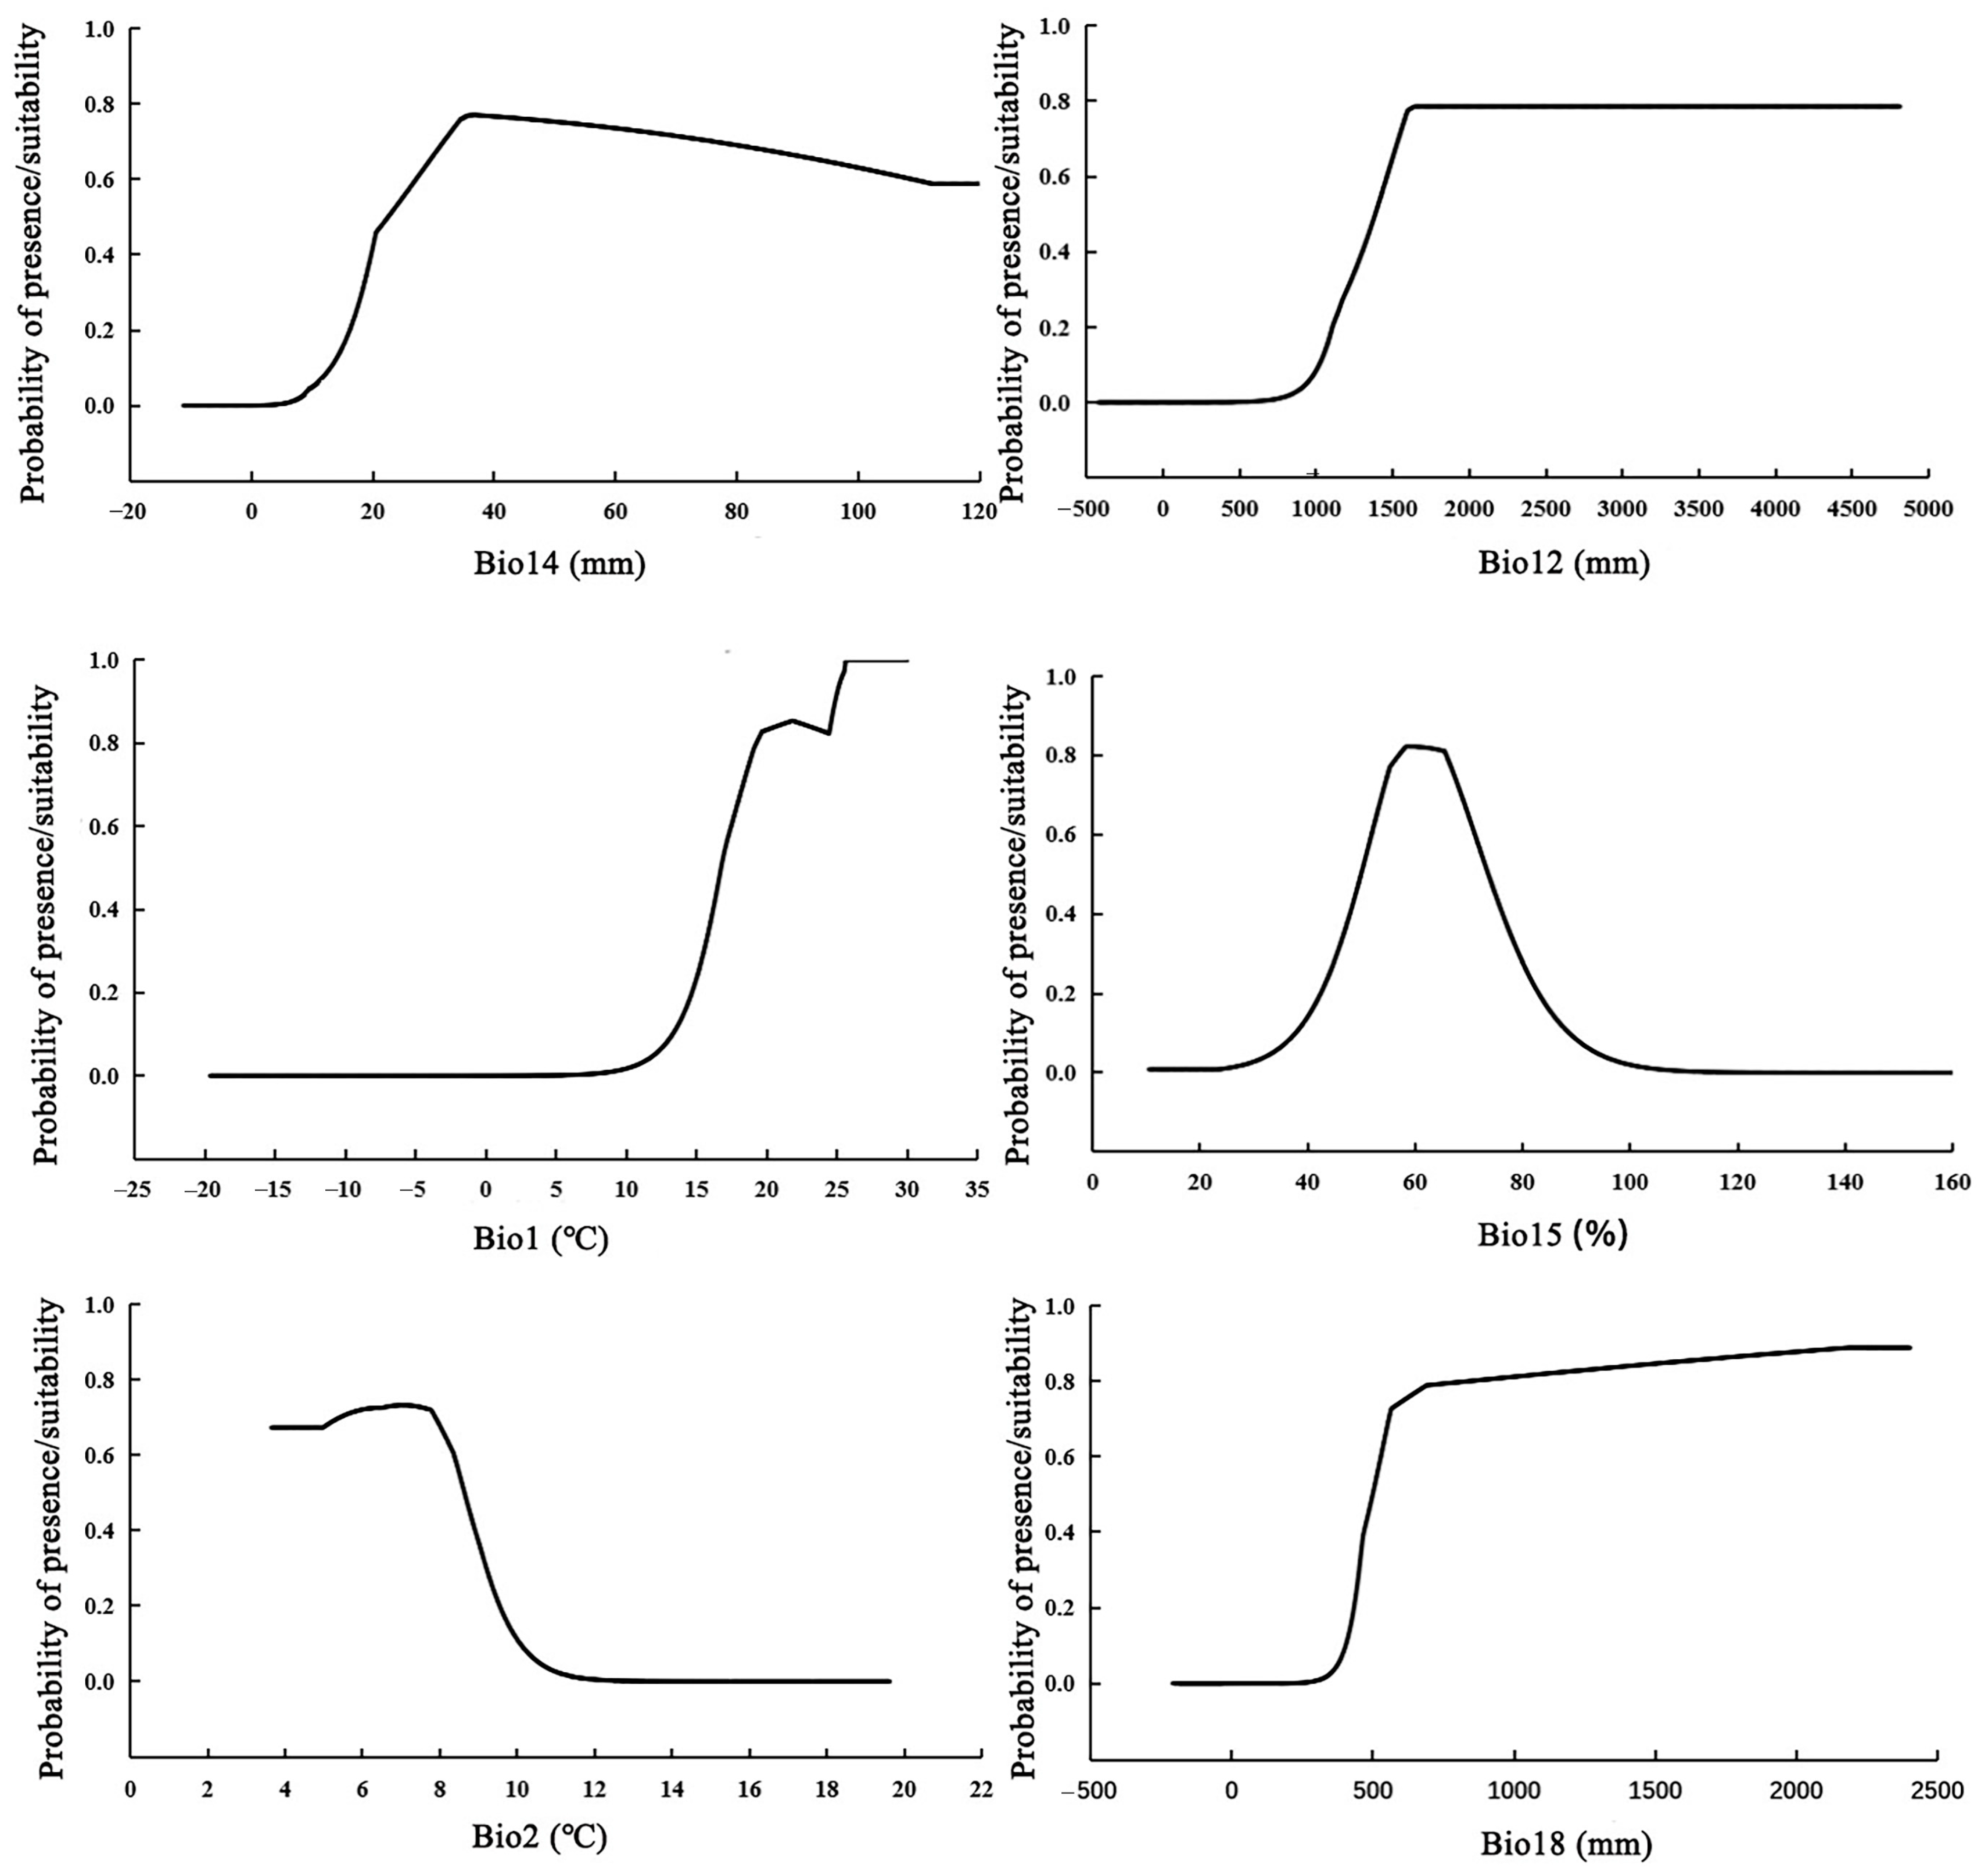
The response curve reflects the relationship between environmental variables and habitat suitability, which can help us understand the niche of species. It is generally believed that when the probability is greater than 0.5, it is more conducive to the growth of species. According to the response curve of major environmental factors with habitat suitability (Figure 3), the most suitable habitat conditions for C. carlesii are as follows: annual precipitation (Bio12) was 1649.37 mm–4812.4 mm; the precipitation of driest month (Bio14) was 22.67 mm–123.20 mm; the annual average temperature (Bio1) was 16.79 °C–29.98 °C; the average diurnal temperature range (Bio2) was 3.65 °C–8.10 °C; the warmest quarter precipitation (Bio18) was 501.65 mm–2402.6 mm; the seasonal precipitation variation (Bio15) was 50.14 mm–73.48 mm.

3.3. Potential Geographic Distribution of C. carlesii in China under Current and Future Climate

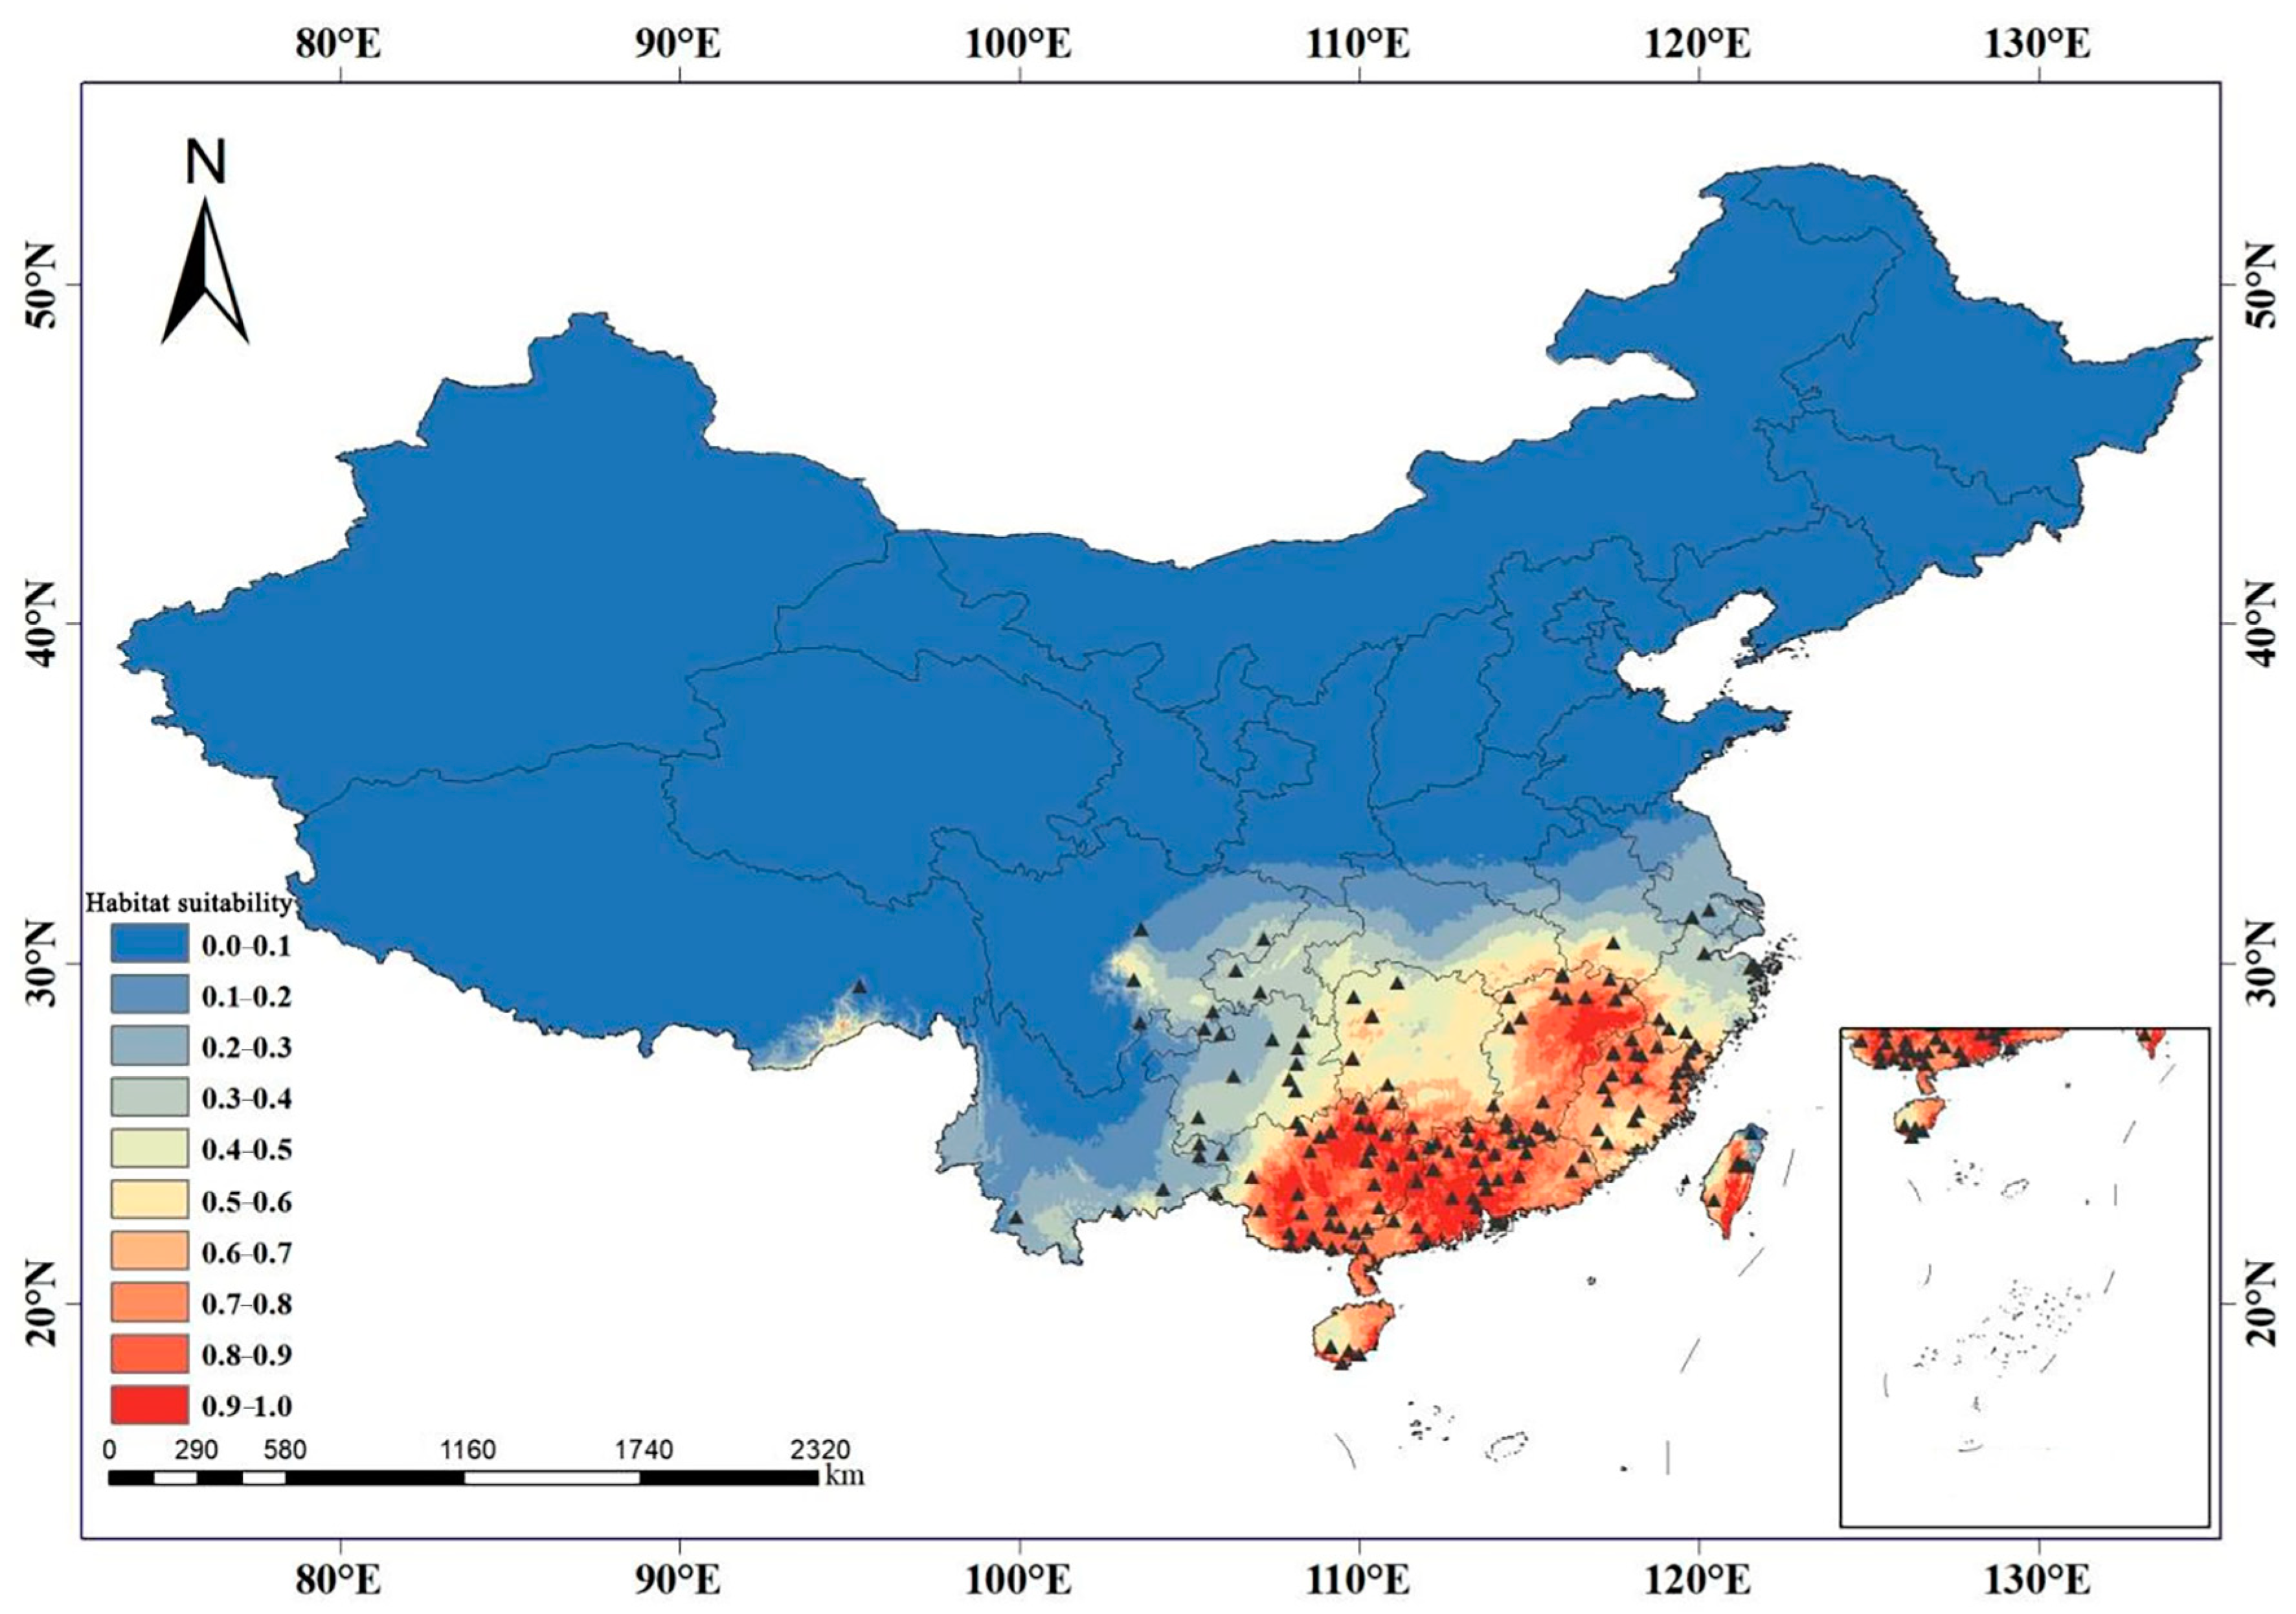
The current potential suitable area of C. carlesii was mainly concentrated in the south of the Qinling–Huaihe line (Figure 4). It was basically consistent with the actual geographical distribution of the tree species; the result further indicated that the accuracy of the model prediction was high. The total suitable area was 208.66 × 10⁴ km2, occupying 21.70% of the whole area of China. The areas of high suitability, medium suitability and low suitability were 64.74 × 10⁴ km2, 70.28 × 10⁴ km2, and 73.64 × 10⁴ km2, respectively (Table 2). High-suitability habitat accounted for 6.73% of the total area of China, mainly distributed in Fujian, Jiangxi, Guangdong, Guangxi, the east of Taiwan and Hainan, the southwest of Zhejiang, southern Anhui, southeastern Hubei and southwestern Hunan. There were also fragmented distributions in the southern part of Tibet (Figure 4).
Medium suitability habitat covered 7.31% of the total area of China, mostly located in the north of the high-suitable habitat. It was concentrated in Zhejiang, Hunan, and Chongqing, which filled some vacancies in the continuous distribution of high-suitable areas. In addition, there were a few moderately suitable distribution areas in central Sichuan, eastern Guizhou, southern Hubei, southern Anhui, western Jiangxi, southern Fujian, western Taiwan, western Hainan, and a few in Tibet and southern Yunnan (Figure 4).
The low-suitable area of C. carlesii was 73.64 × 10⁴ km2, accounting for 7.66% of the total area of China (Table 2), mainly distributed along the boundary of the Qinling-Huaihe River in China. It was mainly distributed in southern Yunnan, eastern Sichuan, western Guizhou, northern Hubei, northern Jiangsu, northern Anhui, and a small amount of it was located in Henan and southern Shaanxi (Figure 4).

3.4. Potential Distribution Area and Dynamic Change of C. carlesii under Future Climate Conditions

Under the three future climate scenarios (SSP126, SSP245, and SSP585) in the 2050s, the suitable area of C. carlesii showed an increasing trend, which increased by 20%, 13% and 10%, respectively, compared with the current potential suitable area. With the increase in greenhouse gas emissions, the suitable area of each grade showed different changes, mainly as follows: the area of unsuitable area showed a decreasing trend; the area of low- and medium-suitable areas increased significantly; however, the high-suitable areas decreased with the increase in carbon emissions, and the rate of reduction gradually increased (Figure 5). The reduced areas were 25.46 × 10⁴ km2, 42.99 × 10⁴ km2 and 52.71 × 10⁴ km2 (Table 2), accounting for 39.33%, 66.41%, and 81.42% of the current high-suitable area.
Under the three climate scenarios (SSP126, SSP245, SSP585) of the 2070s, the suitable area of C. carlesii showed an overall increasing trend. Among them, the total suitable area increased the most under the SSP585 scenario, which increased by 50.04 × 10⁴ km2 compared with the current suitable area. The change trend of the area of different grades in the three climate scenarios in the 2070s was similar to that in the 2050s, which also showed the increase in medium- and low-suitable area and the decrease in high-suitable area. Different from the 2050s, the total suitable area under the three climate scenarios in the 2070s did not show a trend of gradually slowing down with the increase in greenhouse gas, but showed a trend of slowing down first and then accelerating (Figure 5). The total suitable area was the largest under the SSP585 scenario, which was 258.69 × 10⁴ km2 (Table 2).
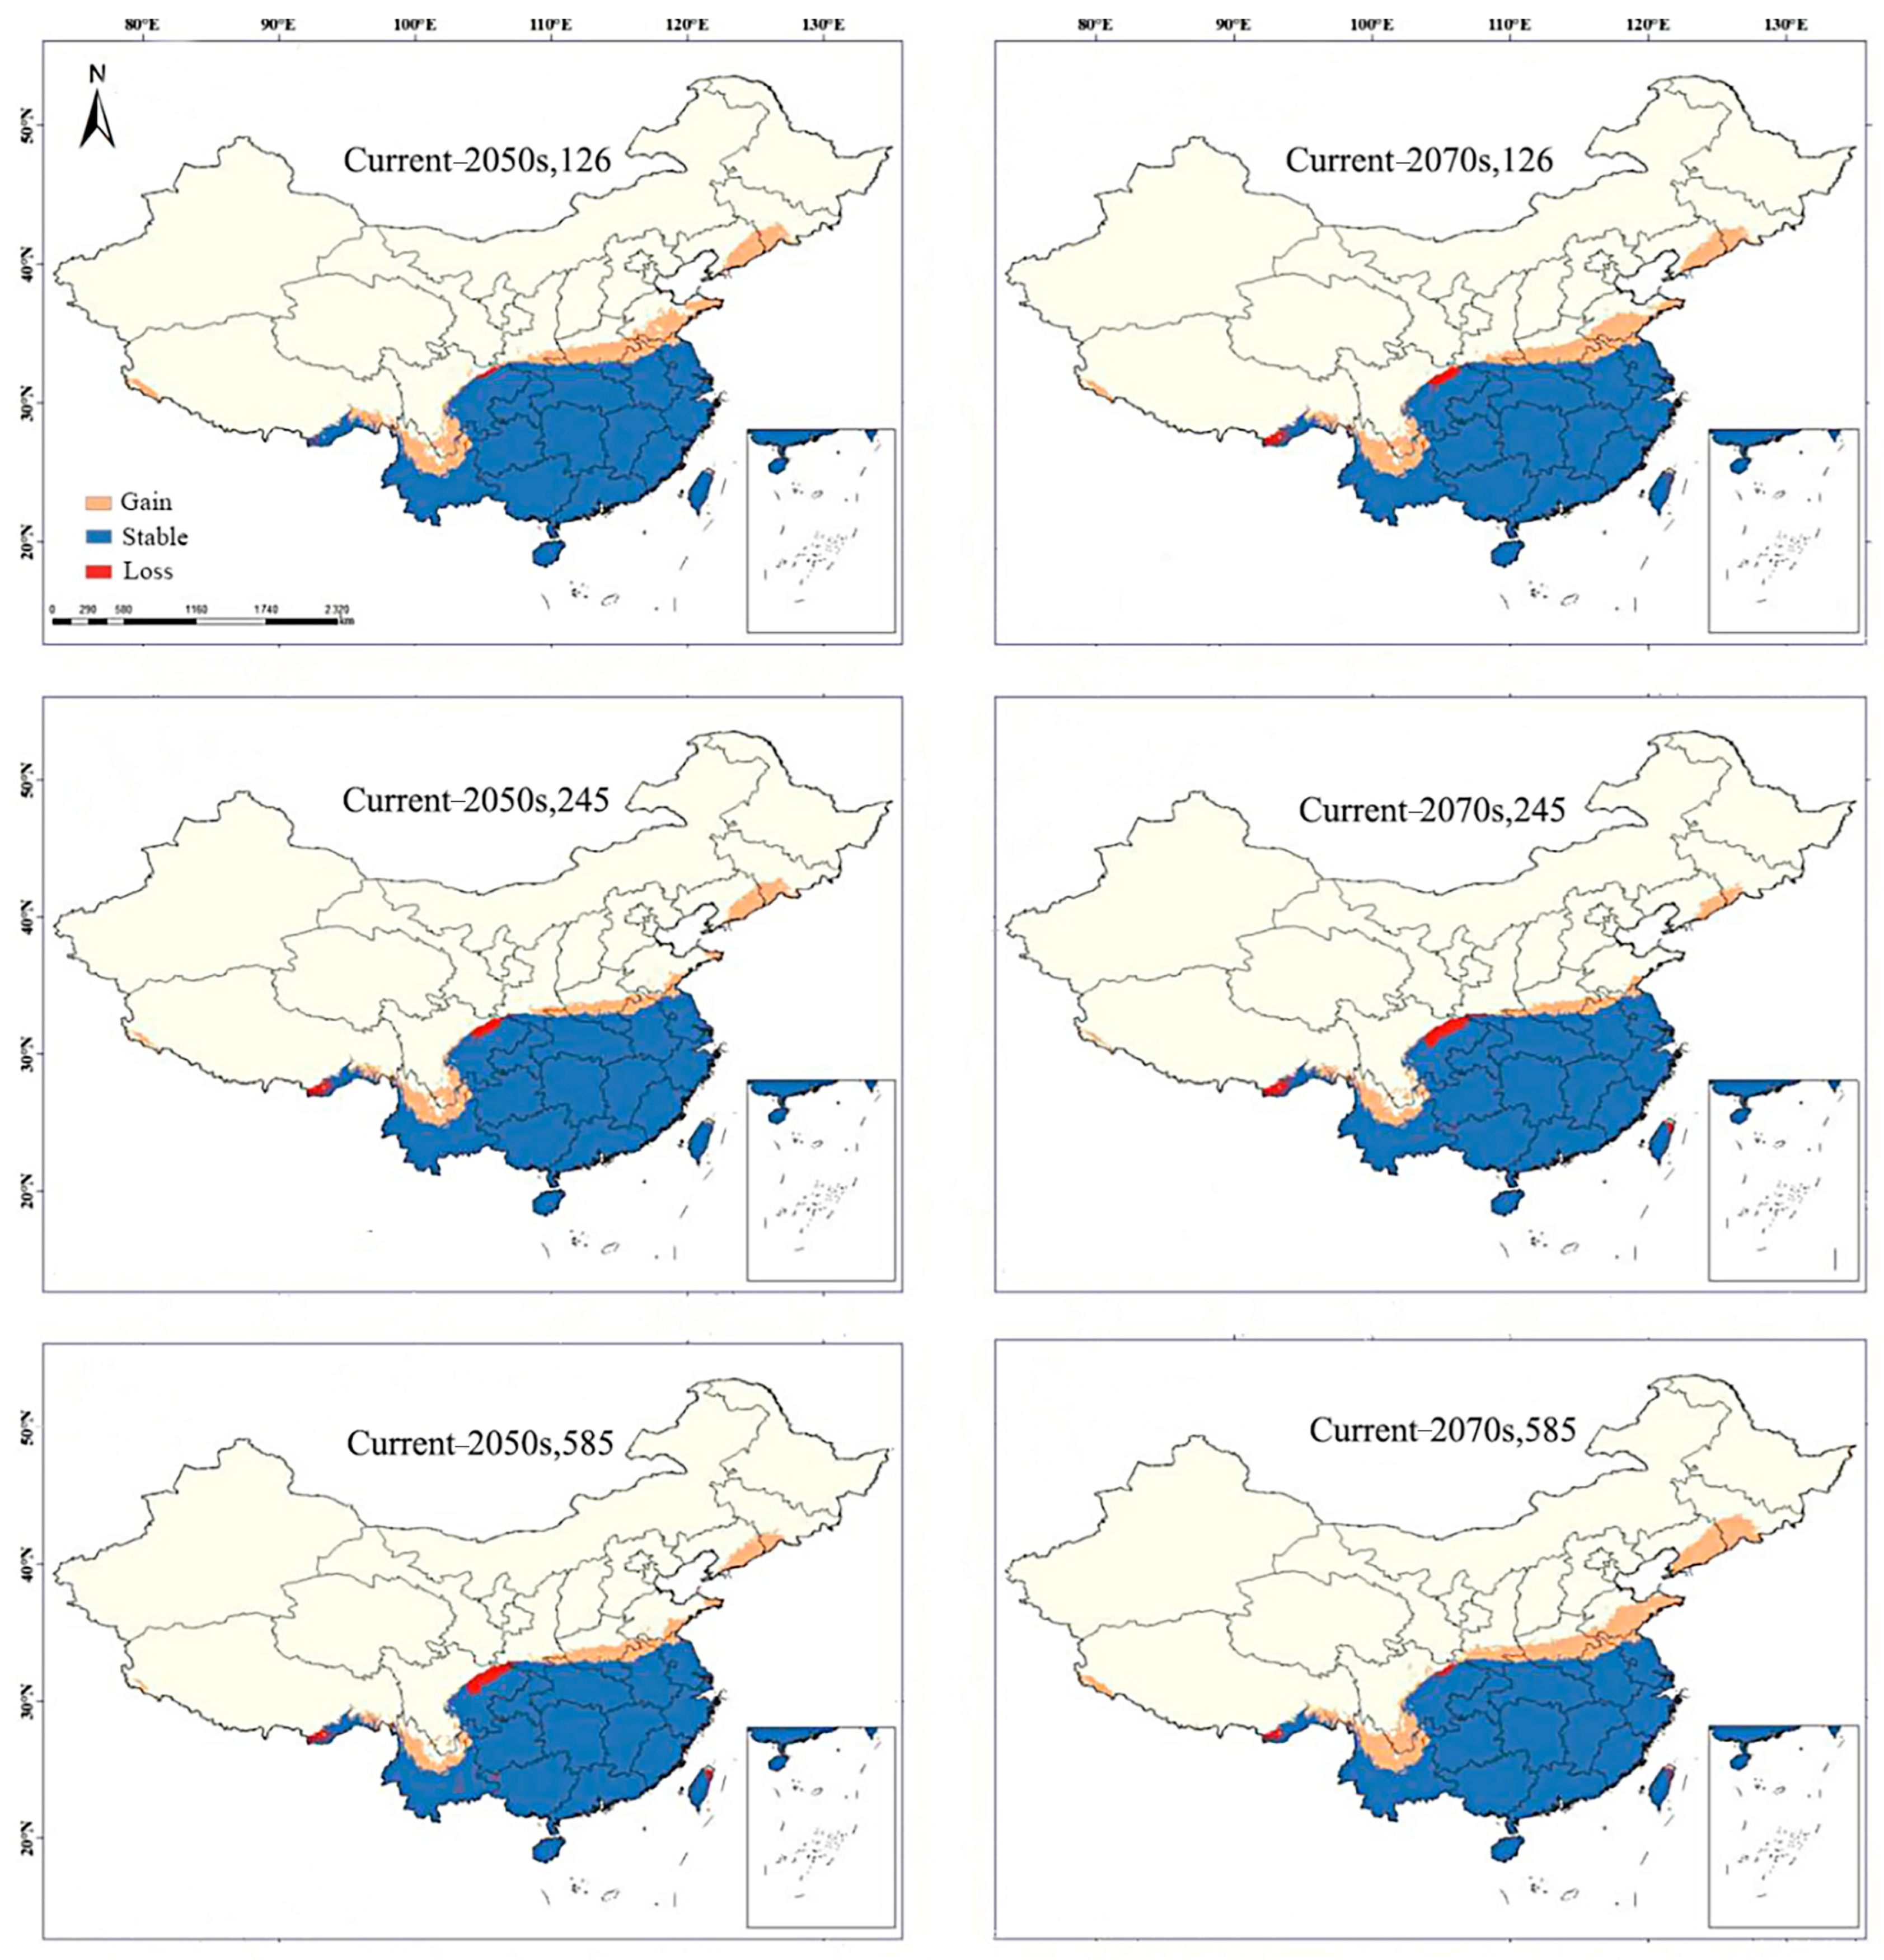
In general, under different carbon emission scenarios in the future, the suitable range of C. carlesii showed a trend of expanding northward along the Qinling–Huaihe line, and only a small number of regions showed a contraction of the suitable area. The expansion area was mainly concentrated in the western part of the Ali region of Tibet, the Yunnan–Guizhou Plateau, the Shandong Peninsula, the Changbai Mountains and the area from the south of the Yellow River to the north of the Qinling–Huaihe line. The shrinking areas were mainly in the northern Sichuan Basin, southeastern Tibet and northern Taiwan. In addition to the SSP585 scenario in the 2041–2060 period and the SSP245 scenario in the 2061–2080 period, the Yunnan–Guizhou Plateau showed a very small area of contraction, and the other scenarios showed a trend of expansion of suitable areas (Figure 6).

4. Discussions

Temperature and precipitation are the two most significant climatic factors affecting forest ecosystem characteristics and species distribution [34,35]. In this study, the main environmental factors affecting the distribution of C. carlesii were precipitation of driest month, annual precipitation, annual mean temperature, seasonal variation of precipitation, diurnal temperature range and precipitation of the warmest quarter. Among them, the contribution rate of the single environmental factor of precipitation in the driest month and annual precipitation reached 89.8%, and there were four factors related to precipitation in the six important environmental factors. The precipitation in the driest month was the most important environmental factor affecting the distribution of C. carlesii, which was consistent with the research results of Castanopsis sclerophylla [36]. As a tree species often mixed with C. carlesii forest, Pinus massoniana is particularly sensitive to dry season precipitation, and the main environmental factors affecting the distribution of P. massoniana are highly coincident with those of C. carlesii [18]. At present, the distribution of C. carlesii is mainly concentrated in the southeast coastal areas of China. The degree of suitability is generally decreasing from the southeast coastal areas to the northwest inland areas, which is similar to the overall distribution characteristics of annual precipitation in China. Affected by the southeast monsoon, the southeast coastal area of China is rich in precipitation, especially on Taiwan Island, which is the most southeast region in China. The precipitation in all parts is generally above 1600 mm, which meets the annual rainfall range of 1649.37 mm–4812.4 mm predicted by the model. Importantly, Liang et al. [37] found that precipitation has dominant influences on the variation of plant hydraulics of Castanopsis fargesii (a closely related species to C. carlesii) in subtropical China, which is similar to our result. Therefore, the areas with high precipitation can be suitable for the growth of C. carlesii.
In addition, temperature is also an important environmental factor affecting plant distribution. Especially for tropical and subtropical species, low temperature is usually the main factor limiting their northward distribution [38]. However, in this study, compared with precipitation factors, C. carlesii is not particularly sensitive to temperature changes, and the contribution rate of environmental factors is only 5.7%. However, temperature also plays an important role in the growth process of C. carlesii, and temperature rise is more conducive to seed germination. For example, low temperature rather than precipitation limits woody species survival and reproduction, as well as the distribution of Quercus fabri [39], Choerospondias axillaris [40], Bretschneidera sinensis [41], and Liquidambar formosana [42] in China. Clearly, the influence of climate on the plant distribution may be species-specific, clarifying that the response of C. castanopsis to precipitation reduction may be the future study direction.
In our study, the receiver operating characteristic curve (AUC) and the regularization multiplier (RM) were used to evaluate model performance. In tests, we set RM to 1, and found that the average area under AUC value was 0.95, which was considered to indicate highly accurate model performance. Although with different occurrence data and the bioclimatic variables, these accurate model parameters were similar to those of other woody species (AUC > 0.9) in China, which suggested that the presence of C. carlesii had the same niches but was limited to different environment.
Global climate change will bring about changes in temperature and precipitation patterns [38]. The original habitat conditions of species will change, the distribution area of species will also change, and they will gradually migrate to other new habitats that are more suitable for their own growth and reproduction [8]. Due to the excessive greenhouse gas emissions caused by human activities, the future climate is characterized by warming and frequent extreme precipitation. Compared with the potential suitable area of C. carlesii in the current climate, the suitable area of it in the future climate scenario generally shows an expanding trend. The expansion areas are mainly concentrated in the western part of the Ali region of Tibet, the southeastern part of the Qinghai–Tibet Plateau, the Shandong Peninsula, the Changbai Mountains, and the area from the south of the Yellow River to the north of the Qinling–Huaihe line.
These areas are relatively rich in precipitation, have a high latitude and less evaporation; the southeastern Tibetan Plateau is affected by the southwest monsoon of the Indian Ocean and topographic uplift, forming abundant topographic rain. Previously, it may have been temperature that limited the distribution of species, causing C. carlesii not to grow in these areas. However, with global warming, the lifting of temperature restrictions and the more abundant precipitation will weaken the environment of the semi-humid areas; some high-altitude areas may form a new suitable environment, resulting in an increase in suitable area. Under different climate scenarios in the future, although the suitable area of C. carlesii increased generally, it was mainly medium- and low-suitable areas that showed an increase, but the high-suitable areas decreased greatly.
In the 2050s, the suitability of tropical areas such as Hainan, southwestern Guangdong, and eastern Taiwan decreased, from the previous high suitability to low suitability or even unsuitability, and the suitability of the central area of the Jiangnan hilly area also decreased significantly. This phenomenon intensified with the increase in carbon emissions. It is possible that the drought season in this part of the region will be prolonged with global warming, and the plants will suffer from serious water loss and growth inhibition in the growing season.
However, in the SSP585 scenario of the 2070s, the high-suitable area was the highest, and the area of total suitable area increased the most. On the one hand, the reason for this phenomenon may be that the increased precipitation under the SSP585 scenario is much higher than that under the low-concentration scenario, which reduces the impact of precipitation factors on species distribution. However, the increased precipitation under the low-concentration scenario cannot lift this limit. Instead, with global warming, the water available for plants to absorb was reduced, which is not conducive to plant growth; on the other hand, with global warming, the limitation of temperature on vegetation distribution in some areas was removed, which led to the further northward expansion of C. carlesii along the Qinling Mountains and the Huaihe River, further indicating that the trade-off between temperature and moisture had an important impact on the growth and distribution of C. carlesii. The northward expansion of suitable areas is in line with climate change. If the southeastern part of the Qinghai–Tibet Plateau, the Shandong Peninsula, has more precipitation, there might be less pressure on the existing water resources in the region when denser forests appear. However, species distribution is also determined by seed dispersal, natural enemies, soil nutrients, plant functional traits, and reproduction in the new environment. We need appropriate provenance tests to assess whether these areas are suitable for C. carlesii.
In this study, more attention is paid to the influence of climatic factors, mainly precipitation and temperature, on the distribution of C. carlesii. Other factors that affect the distribution of species, such as soil and altitude, are not involved. In addition, human factors also have an important impact on the distribution of species. Therefore, a larger simulated distribution area may appear in the future. In a future study, we should consider the impact of various factors to ensure the accuracy and rationality of the forecast results to obtain a more accurate and comprehensive distribution pattern and changes.

5. Conclusions

We used the Maxent model to identify potential habitats for C. carlesii in China. Medium- and high-suitability habitats covered 14% of the total area of China, mainly distributed in southern subtropical forests with modest higher temperate and humid environment. The influence of precipitation was higher than that of temperature, especially for the precipitation in the driest month. Under three climate change scenarios, the suitable habitat of C. carlesii generally shows a trend of expanding northward, with low- and medium-suitable habitat areas increased, and the high-suitable habitat areas decreased. Therefore, genetic diversity study of C. carlesii should be carried out in the high-suitable area in the future work. Expansion areas can be used for cultivation or provenance trials, while contraction areas require enhanced preservation and collection of germplasm resources. This study provides a scientific basis for formulating the adaptation and protection strategies of C. carlesii to cope with future climate change and provides theoretical guidance for the introduction, cultivation and sustainable development of C. carlesii resources.

Author Contributions

X.Z., L.Z. and R.S. conceived and designed the experiments; X.Z., J.Z. and L.H. collected the data; X.Z. and R.S. drafted the manuscript; X.Z., L.Z., J.Z., L.H. and R.S. revised the manuscript. All authors have read and agreed to the published version of the manuscript.

Funding

This work was supported by the Research Project of Jiangxi Provincial Department of Forestry under grant (No. 201801) and Project Jiangxi Youth Science Foundation (20202BABL215018).

Acknowledgments

The authors thank the editor and anonymous reviewers for constructive comments. The authors are grateful for Global Biodiversity Information Facility (GBIF, https://www.gbif.org, the accessed date is 10 July 2022), the Chinese Virtual Herbarium (CVH, https://www.cvh.ac.cn, the accessed date is 11 July 2022), WorldClim dataset and the sixth international Coupled Model Intercomparison Project for providing the geographical distribution and environmental data.

Conflicts of Interest

The authors declare no conflict of interest.

References

  1. Chen, P.Y.; Welsh, C.; Hamann, A. Geographic variation in growth response of Douglas-fir to inter annual climate variability and projected climate change. Glob. Chang. Biol. 2010, 16, 3374–3385. [Google Scholar] [CrossRef]
  2. Hu, X.G.; Jin, Y.Q.; Wang, X.R.; Mao, J.F. Predicting impacts of future climate change on the distribution of the widespread conifer Platycladus orientalis. PLoS ONE 2015, 10, e0132326. [Google Scholar] [CrossRef] [PubMed]
  3. Lucht, W.; Schaphoff, S.; Erbrecht, T.; Heyder, U.; Cramer, W. Terrestrial vegetation redistribution and carbon balance under climate change. Carbon Balance Manag. 2006, 1, 6. [Google Scholar] [CrossRef] [Green Version]
  4. Zhang, G.; Zeng, G.; Yang, X.; Jiang, Z.H. Future changes in extreme high temperature over China at 1.5–5 °C global warming based on CMIP6 simulations. Adv. Atmos. Sci. 2021, 38, 253–267. [Google Scholar] [CrossRef]
  5. Gao, X.J.; Zhao, Z.C.; Giorgi, F. Changes of extreme events in regional climate simulations over East Asia. Adv. Atmos. Sci. 2002, 19, 927–942. [Google Scholar]
  6. Bellard, C.; Bertelsmeier, C.; Leadley, P.; Thuiller, W.; Courchamp, F. Impacts of climate change on the future of biodiversity. Ecol. Lett. 2012, 15, 365–377. [Google Scholar] [CrossRef] [PubMed] [Green Version]
  7. Levin, D.A. Plant speciation in the age of climate change. Ann. Bot. 2019, 5, 769–775. [Google Scholar] [CrossRef] [PubMed] [Green Version]
  8. Bertrand, R.; Lenoir, J.; Piedallu, C.; Gabriela, R.D. Changes in plant community composition lag behind climate warming in lowland forests. Nature 2011, 479, 517–520. [Google Scholar] [CrossRef]
  9. Sun, R.X.; Ye, X.M.; Wang, Z.L.; Lin, X.F. The complete chloroplast genome of Castanopsis carlesii (Hemsl.) Hay. Mitochondrial DNA Part B 2019, 4, 2591–2592. [Google Scholar] [CrossRef] [Green Version]
  10. Liu, X.F.; Lin, T.C.; Yang, Z.J.; Vadeboncoeur, M.A.; Lin, C.F. Increased litter in subtropical forests boosts soil respiration in natural forests but not plantations of Castanopsis carlesii. Plant Soil 2017, 418, 141–151. [Google Scholar] [CrossRef]
  11. Li, X.J.; Liu, X.F.; Xie, J.S.; Zhang, Q.F.; Yang, Z.J. Contribution of above ground litter fall and roots to the soil CO2 efflux of two subtropical Cunninghamia lanceolata and Castanopsis carlesii forests. Agric. For. Meteorol. 2021, 311, 108671. [Google Scholar] [CrossRef]
  12. Ni, X.Y.; Lin, C.F.; Chen, G.S.; Xie, J.S.; Yang, Z.J. Decline in nutrient inputs from litter fall following forest plantation in subtropical China. For. Ecol. Manag. 2021, 496, 119445. [Google Scholar] [CrossRef]
  13. Ma, S.H.; Chen, G.P.; Du, E.Z.; Tian, D. Effects of nitrogen addition on microbial residues and their contribution to soil organic carbon in China’s forests from tropical to boreal zone. Environ. Pollut. 2020, 268, 115941. [Google Scholar] [CrossRef] [PubMed]
  14. Phillips, S.J.; Dudík, M. Modeling of species distributions with maxent: New extensions and a comprehensive evaluation. Ecography 2008, 31, 161–175. [Google Scholar] [CrossRef]
  15. Elith, J.; Leathwick, J.R. Species distribution models: Ecological explanation and prediction across space and time. Annu. Rev. Ecol. Evol. Syst. 2009, 40, 677–697. [Google Scholar] [CrossRef]
  16. Wittmann, M.E.; Barnes, M.A.; Jerde, C.L.; Jones, L.A.; Lodge, D.M. Confronting species distribution model predictions with species functional traits. Ecol. Evol. 2016, 6, 873–879. [Google Scholar] [CrossRef]
  17. Cheuk, M.L.; Fischer, G.A. The impact of climate change on the distribution of Castanopsis (Fagaceae) species in South China and Indo-China region. Glob. Ecol. Conserv. 2021, 26, e01388. [Google Scholar] [CrossRef]
  18. Chen, Y.; Le, X.; Chen, Y.; Cheng, W.; Du, J.; Zhong, Q.; Cheng, D. ldentification of the potential distilution area of Cunninghamia lanceolata in China under climate change based on the MaxEnt model. Chin. J. Appl. Ecol. 2022, 33, 1207–1214. [Google Scholar]
  19. Dyderski, M.K.; PAŹ, S.; Frelich, L.E.; Jagodziński, A.M. How much does climate change threaten European forest tree species distributions? Glob. Chang. Biol. 2017, 24, 1150–1163. [Google Scholar] [CrossRef]
  20. Atwater, D.Z.; Ervine, C.; Barney, J.N. Climatic niche shifts are common in introduced plants. Nat. Ecol. Evol. 2018, 2, 34–43. [Google Scholar] [CrossRef] [Green Version]
  21. Lei, L.; Guan, L.L.; Zhao, H.X.; Huang, Y.; Mou, Q.Y. Modeling habitat suitability of Houttuynia cordata Thunb (Ceercao) using MaxEnt under climate change in China. Ecol. Inform. 2021, 63, 101324. [Google Scholar]
  22. Luo, A.; Xu, X.; Liu, Y.; Li, Y.; Su, X.; Li, Y.; Lyu, T.; Dimitrov, D.; Larjavaara, M.; Peng, S.; et al. Spatio-temporal patterns in the woodiness of flowering plants. Glob. Ecol. Biogeogr. 2023, 32, 384–396. [Google Scholar] [CrossRef]
  23. Hijmans, R.J.; Cameron, S.E.; Parra, J.L.; Jones, P.G.; Jarvis, A. Very high resolution interpolated climate surfaces for global land areas. Int. J. Climatol. 2005, 25, 1965–1978. [Google Scholar] [CrossRef]
  24. Zhu, X.; Ji, Z.; Wen, X. Historical and projected climate change over three major river basins in China from fifth and sixth coupled model intercomparison project models. Int. J. Climatol. 2021, 41, 6455–6473. [Google Scholar] [CrossRef]
  25. Böhmelt, T. Employing the shared socioeconomic pathways to predict CO2 emissions. Environ. Sci. Policy 2017, 75, 56–64. [Google Scholar] [CrossRef]
  26. Sharma, S.; Arunachalam, K.; Bhavsar, D.; Kala, R. Modeling habitat suitability of Perilla frutescens with MaxEnt in Uttarakhand—A conservation approach. J. Appl. Res. Med. Aromat. Plants 2018, 10, 99–105. [Google Scholar] [CrossRef]
  27. Hill, M.P.; Hoffmann, A.A.; McColl, S.A.; Umina, P.A. Distribution of cryptic blue oat mite species in Australia: Current and future climate conditions. Agric. For. Entomol. 2012, 14, 127–137. [Google Scholar] [CrossRef]
  28. Wei, B.; Wang, R.L.; Hou, K.; Wang, X.Y.; Wu, W. Predicting the current and future cultivation regions of Carthamus tinctorius L. using MaxEnt model under climate change in China. Glob. Ecol. Conserv. 2018, 16, e00477. [Google Scholar] [CrossRef]
  29. Yang, Z.; Yang, B.; Alatalo, J.M.; Huang, Z.; Yang, F.; Pu, X.; Wang, R.; Yang, W.; Guo, X. Spatio-temporal variation in potential habitats for rare and endangered plants and habitat conservation based on the maximum entropy model. Sci. Total Environ. 2021, 784, 147080. [Google Scholar] [CrossRef] [PubMed]
  30. Anderson, R.P.; Gonzalez, I. Species-specific tuning increases robustness to sampling bias in models of species distributions: An implementation with Maxent. Ecol. Model 2011, 222, 2796–2811. [Google Scholar] [CrossRef]
  31. Liu, Y.; Huang, P.; Lin, F.; Yang, W.; Gaisberger, H.; Christopher, K.; Zheng, Y. MaxEnt modelling for predicting the potential distribution of a near threatened rosewood species (Dalbergia cultrata Graham ex Benth). Ecol. Eng. 2019, 141, 105612. [Google Scholar] [CrossRef]
  32. Swets, J. Measuring the accuracy of diagnostic systems. Science 1988, 240, 1285–1293. [Google Scholar] [CrossRef] [PubMed] [Green Version]
  33. Li, K.; Zhang, X.W.; Fang, Y.M. Responses of the distribution pattern of Quercus chenii to climate change following the Last Glacial Maximum. Chin. J. Plant Ecol. 2016, 40, 1164–1178. [Google Scholar]
  34. Ding, Y.; Shi, Y.; Yang, S. Molecular regulation of plant responses to environmental temperatures. Mol. Ecular. Plant 2020, 13, 544–564. [Google Scholar] [CrossRef]
  35. Zeppel, M.J.B.; Wilks, J.V.; Lewis, J.D. Impacts of extreme precipitation and seasonal changes in precipitation on plants. Biogeosciences 2014, 11, 3083–3093. [Google Scholar] [CrossRef] [Green Version]
  36. Miao, J.; Wang, Y.; Wang, L.; Xu, X. Prediction of potential geographical distribution pattern change for Castanopsis sclerophylla on MaxEnt. J. Nanjing For. Univ. (Nat. Sci. Ed.) 2021, 45, 193–198. [Google Scholar]
  37. Liang, X.; He, P.; Liu, H.; Zhu, S.; Uyehara, I.K.; Hou, H.; Wu, G.; Zhang, H.; You, Z.; Xiao, Y.; et al. Precipitation has dominant influences on the variation of plant hydraulics of the native Castanopsis fargesii (Fagaceae) in subtropical China. Agric. For. Meteorol. 2019, 271, 83–91. [Google Scholar] [CrossRef]
  38. Mishra, A.K. Plant adaptation to global climate change. Atmosphere 2021, 12, 451. [Google Scholar] [CrossRef]
  39. Li, X.; Li, G.; Fang, Y.M. Prediction of potential suitable distribution areas of Quercus fabri in China based on an optimized maxent model. Sci. Silvae Sin. 2018, 54, 154–164. [Google Scholar]
  40. Ye, X.M.; Chen, F.S.; Sun, R.X.; Wu, N.S.; Liu, B.; Song, Y.L. Prediction of potential suitable distribution areas for Choerospondias axillaris based on MaxEnt model. Acta Agric. Univ. Jiangxiensis 2019, 41, 440–446. [Google Scholar]
  41. Gong, W.; Xia, Q.; Chen, H.F.; Yu, X.H.; Wu, F. Prediction of potential distributions of Bretschneidera sinensis, an rare and endangered plant species in China. J. South China Agric. Univ. 2015, 36, 98–104. [Google Scholar]
  42. Sun, R.; Lin, F.; Huang, P.; Ye, X.; Lai, J.; Zheng, Y. Phylogeographical structure of Liquidambar formosana Hance revealed by chloroplast phylogeography and species distribution models. Forests 2019, 10, 858. [Google Scholar] [CrossRef] [Green Version]
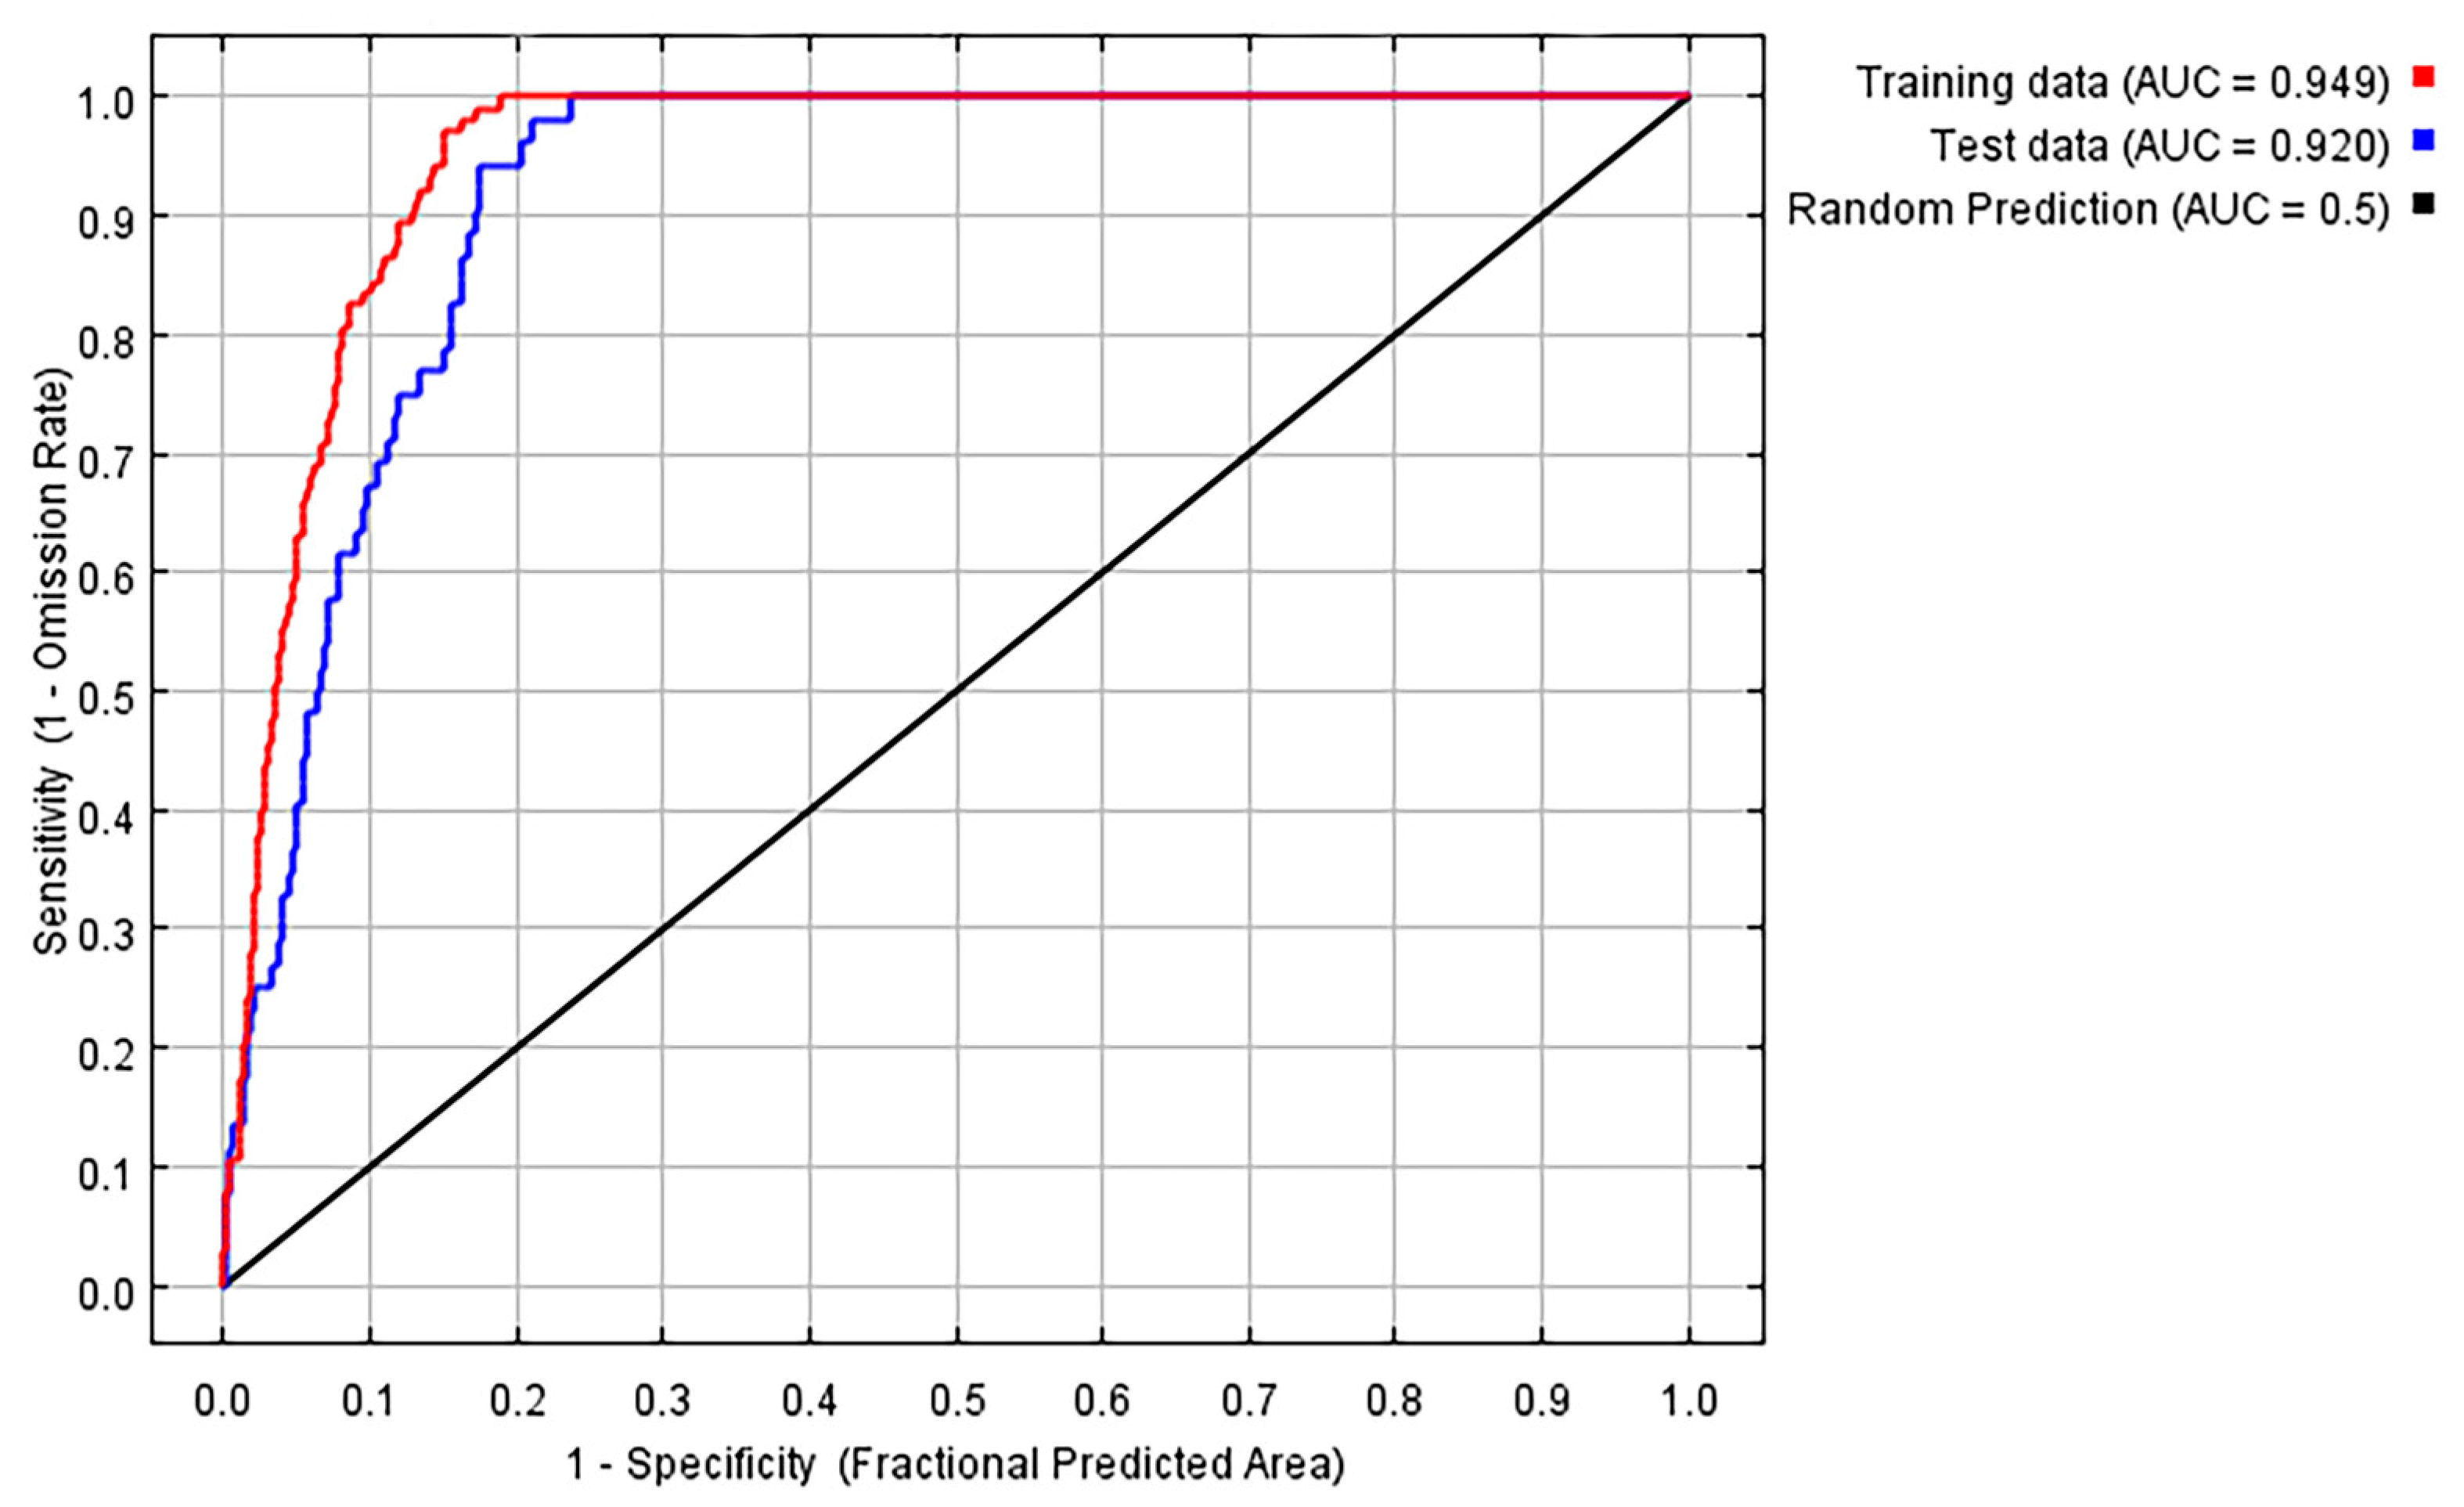
Figure 1. The receiver operating characteristic (ROC) curve of Castanopsis carlesii by Maxent model.
Forests 14 01397 g001
Figure 2. The jackknife test result of environmental factor variables for Castanopsis carlesii. (The regularized training gain describes how much better the Maxent distribution fits the present data compared to a uniform distribution. The dark blue bars indicate the gain from using each variable in isolation, the light blue bars indicate the gain lost by removing a single variable from the full model, and the red bar indicates the gain using all variables.)
Forests 14 01397 g002
Figure 3. Response curves of major environmental factors with habitat suitability for Castanopsis carlesii.
Forests 14 01397 g003
Figure 4. Potential geographical distribution of Castanopsis carlesii under modern climate conditions. The insert map on the bottom right represents China’s borders.
Forests 14 01397 g004
Figure 5. Spatial distribution of different grades of Castanopsis carlesii suitable areas under future climate scenarios.
Forests 14 01397 g005
Figure 6. Changes in distribution pattern of Castanopsis carlesii under different climate scenarios. (The map represents the regional changes in the distribution of C. carlesii under different climate scenarios in the future compared with the current distribution area. Red, orange, and blue represent contraction, expansion, and stable regions, respectively.)
Forests 14 01397 g006
Table 1. Contribution and permutation importance of the environmental factors.
IndexDescriptionPercent Contribution/%Permutation Importance/%
Bio14precipitation of driest month75.518.5
Bio12annual precipitation14.333.1
Bio1annual mean temperature5.715.3
Bio15precipitation seasonality1.314
Bio2mean diurnal range1.212.7
Bio10mean temperature0.71.2
Bio7temperature annual range0.71.3
Bio18precipitation of warmest quarter0.40.7
Bio8mean temperature of wettest quarter0.11.6
Bio3isothermality0.11.6
Table 2. Suitable areas for Castanopsis carlesii under different climate change scenarios (104 km2).
PeriodTotal Suitable AreaUnsuitable AreaLow-Suitable AreaModerate-Suitable AreaHigh-Suitable Area
Current208.66753.1173.6470.2864.74
2050s (SSP126)250.30711.47118.9492.0939.28
2050s (SSP245)235.53726.24114.7999.0021.75
2050s (SSP585)229.66732.12110.35107.2812.03
2070s (SSP126)246.04715.73123.9698.4323.65
2070s (SSP245)224.59737.19110.04103.4511.10
2070s (SSP585)258.69703.08143.4486.1729.08
Disclaimer/Publisher’s Note: The statements, opinions and data contained in all publications are solely those of the individual author(s) and contributor(s) and not of MDPI and/or the editor(s). MDPI and/or the editor(s) disclaim responsibility for any injury to people or property resulting from any ideas, methods, instructions or products referred to in the content.