Article

Soil Bacteria and Soil Fungi Respond Differently to the Changes in Aboveground Plants along Slope Aspect in a Subalpine Coniferous Forest

Key Laboratory for Earth Surface Processes, Ministry of Education, Institute of Ecology, College of Urban and Environmental Sciences, Peking University, Beijing 100871, China
*
Author to whom correspondence should be addressed.
Forests 2023, 14(7), 1389; https://doi.org/10.3390/f14071389
Submission received: 25 May 2023 / Revised: 30 June 2023 / Accepted: 6 July 2023 / Published: 7 July 2023
(This article belongs to the Special Issue Aboveground and Belowground Interaction and Forest Carbon Cycling)

Abstract

:
In a locale-scale mountainous forest, changes in slope aspect can cause microclimate heterogeneity, which can impact both soil environment and plant community, and influence the soil microbial communities as well. However, the relationship between the aboveground plant community and belowground soil microbial communities and the change in slope aspect is not well understood. A case study was carried out in a subalpine coniferous forest in western China to investigate the above- and belowground relationship of three slope aspects, the north-facing slope, the flat site and the south-facing slope. The plant community attributes were evaluated by the community survey, considering species diversity and the plant total basal area of trees and shrubs to represent the plant productivity. Soil bacteria were determined based on 16S rRNA gene and soil fungi on a nuclear ribosomal internal transcribed spacer (ITS) using high-throughput Illumina sequencing. The results showed that slope aspects significantly affect the aboveground plant productivity and diversity, and the community composition and structure of both aboveground plants and soil bacteria and soil fungi. Soil bacteria and soil fungi correlated differently with aboveground plant community changes in the slope aspects in terms of diversity and community composition and structure. A structural equation model (SEM) revealed that slope aspects caused by aboveground plant productivity changes correlated significantly with the soil fungal community composition and structure, while the soil bacterial community was rather weakly correlated with the plant community, and its changes in community composition and structure were mainly affected by the soil properties and soil fungal community. Further studies considering plant functional traits, soil microbial functional groups, and seasonal changes may reveal a deeper correlation between the aboveground plants and belowground soil microbials at the local scale in subalpine coniferous forests.

1. Introduction

Whether predictable correlations exist between aboveground plant communities and belowground soil microbial communities in terms of composition, and structure is one of the key ecological issues underlying global environmental changes [1,2,3]. It is generally accepted that plants can have both direct and indirect impacts on soil microbes [4,5,6,7,8,9,10]. Through the input of litters and root exudates to the soil, plants can directly regulate the community composition of soil bacteria and fungi [11,12]. The plant-initiated changes in soil properties can indirectly affect the local distribution patterns of soil microbial communities [13]. However, owing to the limited studies fully elucidating the composition and structural dynamics of both above- and the belowground biological communities, the relationships between the plant community and the soil microbial communities and their linkages remain controversial and their correlations are uncertain [6,14]. Details pertaining to the mechanism by which the plant community correlates with microbial communities and the differences between belowground bacteria and fungi correlating with plants in terms of species richness, diversity, composition and structure are especially uncertain.
Both species diversity and the productivity of aboveground plants have been proposed as the driving mechanism of the dynamics of soil microbial communities [15,16]. An increase in plant species richness was shown to lead to the diversification of belowground resources and, hence, a general positive correlation between plant species richness and soil microbial richness was concluded in some previous studies [17,18,19,20,21]. It was also found that an increase in aboveground plant diversity affects soil microbial community structure [13]. Other studies found increased plant productivity; this increase was driven by the increasing plant diversity, which contributed to the correlated changes in soil community in terms of composition and structure [22]. It was thus also proposed that the aboveground plant biomass has an equally important effect on the soil microbial community [23]. A case study focusing on a semiarid grassland showed that the aboveground plant biomass was a decisive factor in the soil microbial functional communities [24].
Soil bacteria and fungi are the two most diversified kingdoms in an ecosystem, and proven to have different relationships with the aboveground plant community owing to their structural and metabolic differences [25]. Additionally, their relationships with aboveground plants are considered to have reciprocal effects on the plant community. It is proposed that, compared to the soil bacterial community, the soil fungal community has a closer relationship with the plant community due to the ability of certain fungi, such as mycorrhizal fungi, to closely bond with plants [3]. Previous studies revealed that the pathogenic fungi can maintain high aboveground plant species richness through a mechanism of negative density-dependence that checks the abundance of dominant plant species [26], while beneficial symbiotic ectomycorrhizal fungi were shown to decrease plant species richness by promoting the growth of certain dominant species [27]. As a result, the soil fungal community may modify the aboveground plant community’s species richness and productivity. On the other hand, the soil bacterial community showed more indirect effects on aboveground plants [13,14,28]. Its responses to the changes in plant community were mostly through the plant-driven changes in soil properties. A meta-analysis of previous reports revealed that soil pH impacts the correlation between the diversity of plant species and soil bacterial diversity, and this impact is generally detectable across most environments [21]. The contribution of other soil properties varied and may be more significant in soils with low nutrient levels or in unstable ecosystems [21]. It is also noted that both soil fungi and bacteria may similarly respond, together with the aboveground plant community, to certain soil properties [29]. Therefore, a further comprehensive evaluation of the relationships of the community composition and structure, focusing on aboveground plants and belowground soil bacteria and fungi separately, is still necessary to clarify the dynamic linkages of above- and belowground communities in different ecosystems [28,30].
Slope aspect is one of the important topographic factors in montane ecosystems [31,32,33]. Differences in slope aspect will lead to diversified local microenvironments through the spatial redistribution of solar radiation and water contents [31,33]. In the Northern Hemisphere, the south-facing slope receives more solar radiation, leading to relatively warmer and drier conditions compared to the north-facing slope. It is reported that more diverse species of the plants and taxa of microbes were observed on the south-facing slope [34,35]. In contrast, it is generally noted that the diversities of plants and soil microbes are relatively lower on the north-facing slope [36]. It was assumed that the lower temperature and insufficient soil aeration contributed to the less diversified plants and soil microbes found on the north-facing slope [36]. However, in the arid regions, the aboveground plant community appears to thrive, with higher coverage and individual density being found on the north-facing slope [37], which may result in higher plant productivity on the north-facing slope. Since the slope aspect can change both diversity and productivity at a locale scale, the relationship between above- and belowground communities may change with slope accordingly [38]. A previous study revealed that different combinations of soil bacteria and fungi are associated with the changed community composition in the aboveground plant community on the south- and north-facing slopes in a temperate mountainous forest [39]. However, owing to the fact that most other studies involving slope aspect as an environmental factor focused either on plant communities [40,41,42] or soil microbial communities [34,36,43]. More case studies incorporating both plant community and soil microbial communities will reveal clearer correlations between the changes in above- and belowground communities with slope aspect in locale-scale mountainous ecosystems.
Herein, we performed a case study of the correlations between the aboveground plant community and the communities of belowground soil bacteria and fungi by incorporating the slope aspect as a topographic factor in a subalpine coniferous forest in Wanglang Nature Reserve, located in North Sichuan, Southwest China. This area is considered to be part of a biodiversity conservation hotspot in China [44]. Subalpine coniferous forests are important forest communities distributed along the south and southeast borderline of the Qinghai–Tibet plateau. These forests are vulnerable ecosystems owing to their shallow soil layers in locally heterogenous topography with variable microclimate conditions [45]. High mountains and deep gorges are the obvious topographic characteristics in the subalpine coniferous areas in West China [45], where slope aspect, as a topographic factor, significantly impacts the community composition and structure of the aboveground vegetation in series, providing ideal samples for studies of ecosystem processes [30,46]. In this study, we investigated the plant community characters, soil physical and chemical properties, and underground soil bacterial and fungal communities separated into three sites by slope aspect (south-facing slope, flat site, and north-facing slope), and analyzed the correlations between communities of plants and soil bacteria and fungi in terms of community composition and structure. We hypothesized that: (1) slope aspect changes over a short distance can lead to a differentiation in the species richness, diversity and biomass of aboveground plants and species richness, community composition and structure of belowground soil bacteria and soil fungi; and (2) biodiversity indices and the structure of soil bacteria and soil fungi will correlate differently with the diversity, structure and biomass of plants across the slope aspects. In addition, we also intend to further explore whether the biomass of aboveground plants contributes to the change in soil microbes separated by communities of bacteria and fungi.

2. Materials and Methods

2.1. Study Area and Site Description

The study area is located in the Wanglang National Nature Reserve in North Sichuan Province (104.02° E, 33.00° N), Southwest China (Figure 1A), where typical subalpine coniferous forests at an elevational range of 2700–3200 m are well conserved. The climate is affected by monsoons, with an obvious rainy season from April to October [47]. The annual average temperature is 2.9 °C, with a minimum of −6.1 °C in January and maximum of 12.7 °C in July, and the recently recorded annual precipitation is 859.9 mm. The soil types are mainly mountain dark brown loam and subalpine meadow soil. The coniferous tree species are dominated by Faxon fir (Abies fargesii var. faxoniana) and purple spruce (Picea purpurea), and the accompanying broad-leaved tree species are mostly Betula albosinensis. Another conifer, Juniperus saltuaria, is occasionally mixed in the tree layer, and it rarely dominates at rocky habitats on both north- and south-facing slopes. The most common shrubs are Cotoneaster acutifolius, Euonymus frigida, Lonicera nervosa, L. tangutica, Philadelphus kansuensis, Ribes tenue, Sorbus koehneana, and species of Rosa and Rubus. The herb layer is mostly composed of sporadic species, except some constantly occurring ones such as Cardamine tangutorum, Cystopteris pellucida, and Eutrema yunnanense. Understory bamboo (Fargesia denudate) is relatively rare in our investigated sites.
The sampling sites are distributed in the Wanglang Plot of 25.2 ha, a Forest Global Earth Observatory plot for long-term forest dynamic monitoring [48]. This plot was equally divided into 18 rows of longitudinal and 35 rows of transversal subplots that comprise 630 quadrats (Figure 1B), and the projection area of each quadrat is 20 m × 20 m [49]. The elevational range of this plot is 2850–2930 m. There is an eastward stream located at the center of the plot, which divides it into three topological types (flat site and south- and north-facing slopes). For the soil microbial community survey, we randomly selected 170 quadrats and separated them into three site types: south-facing slope, flat site, and north-facing site. In detail, 81 quadrats on the valley bottom were defined as flat site (slope < 5°), and the rest of the quadrats on side slopes (slope ≥ 5°) were separately distributed on the north-facing slope of 42 quadrats (0° ≤ slope exposure < 90° or 270° < slope exposure ≤ 360°) and south-facing slope (90° ≤ slope exposure ≤ 270°) of 47 quadrats (Figure 1B).

2.2. Vegetation and Soil Sampling

The vegetation was surveyed from May to September 2019, when the basic information of trees, shrubs and herbs within the 630 quadrats was investigated. The diameter of the breast height (DBH, ca. 1.3 m elevation) of each tree with a DBH ≥ 3 cm was measured, and the tree height was assessed as well. Two 5 m × 5 m grids along any of the diagonals and nine 1 m × 1 m grids along the two diagonals of each quadrat were set to create an inventory of shrubs and herb layer, respectively, where the abundance and coverage of each species were recorded. The latest versions of Flora of China were followed for the nomenclature of plants.
The soil was sampled from July to August 2020, the vigorous growing season in the study area. The soil samples were collected by a soil auger (inner diameter: 3.8 cm; depth: 0–10 cm). After clearing litter and gravel, a five-point sampling method was used, with one auger at each of the four corners and the center of the sampling quadrat to take samples, and the five samples were combined and mixed as a composite sample. After the removal of plant residues, rocks, and other impurities, the soil sample was passed through a 2 mm sieve and then divided into two parts. One part was stored at 4 °C for the analysis of the soil’s physical and chemical properties; the other part was stored in the freezer at −80 °C to detect the soil microbial community’s composition.

2.3. Determination of Soil Properties

The preparation protocols introduced in a Chinse manual were generally followed to determine the soil properties [50], and the methods presented in previous studies were also consulted [51,52,53]. Soil moisture was measured as the weight lost after oven-drying the samples to a constant weight (105 ± 2 °C). The pH value was measured in a 1:2.5 (w:v) soil:water suspension with a digital pH meter (PHS-3C, Lei-Ci, Shanghai, China). The subsamples were finely ground, oven-dried (80 °C) and subjected to an elemental analyzer (2400IICHNS/O element analyzer, Perkin–Elmer, Boston, MA, USA) for total soil N. Additionally, available N was equal to the sum of ammonium nitrogen (NH4+–N) and nitrate nitrogen (NO3−–N), which were extracted with K2SO4 solution and determined colorimetrically by automated segmented flow analysis using the cadmium column/sulfanilamide reduction method (AAIII; Bran and Luebbe, Norderstedt, Germany). Total phosphorus (TP) was analyzed using the NaOH–molybdate–antimony anti-color-development–UV spectrophotometry method. Available phosphorus (AP) was determined by the Olsen method using 0.05 mol/L NaHCO3 solution as an extraction agent. The content of soil organic matter (SOM) was obtained by the potassium dichromate volumetric method.

2.4. DNA Extraction, Amplification, High-Throughput Sequencing, and Bioinformatics Analysis

The methods of high-throughput sequencing technology were applied for soil sample preparation and DNA extraction. Total genomic DNA samples were extracted using the OMEGA Soil DNA Kit (M5635-02) (OmegaBio-Tek, Norcross, GA, USA), following the manufacturer’s instructions, and stored at −20 °C before further analysis. The quantity and quality of extracted DNAs were measured using a NanoDrop NC2000 spectrophotometer (Thermo Fisher Scientific, Waltham, MA, USA) and agarose gel electrophoresis, respectively.
For the soil bacterial community analysis, the 16S rRNA gene was extracted, the V3–V4 region of 16S rRNA gene was PCR-amplified using the primer pair 338F (5′-ACT CCT ACG GGA GGC AGC A-3′) and 806R (5′-GGA CTA CHV GGG TWT CTA AT-3′). Nuclear ribosomal internal transcribed spacer (ITS) was produced for soil fungi community analysis, and the internal transcribed spacer 1 (ITS1) region was PCR-amplificated using the primer pair ITS5 (5′-GGA AGT AAA AGT CGT AAC AAG G-3′) and ITS2 (5′-GCT GCGTTC TTC ATC GAT GC-3′) [54]. PCR amplicons were purified with Vazyme VAHTSTM DNA Clean Beads (Vazyme, Nanjing, China) and quantified using the Quant-iT PicoGreen dsDNA Assay Kit (Invitrogen, Carlsbad, CA, USA). After the individual quantification step, amplicons were pooled in equal amounts, and paired-end 2 × 250 bp sequencing was performed using the Illumina NovaSeq platform with NovaSeq 6000 SP Reagent Kit (500 cycles) at Shanghai Personal Biotechnology Co., Ltd. (Shanghai, China).
Microbiome bioinformatic analysis was performed with QIIME2 2019.4 [55] with slight modifications according to the official tutorials (https://docs.qiime2.org/2019.4/tutorials/, accessed on 22 November 2020). Briefly, raw sequence data were demultiplexed using the demux plugin, followed by primer cutting with the cutadapt plugin [56]. Sequences were then quality-filtered, denoised, and merged, and chimeras were removed using the DADA2 plugin at the level of similar sequences using a 97% threshold [57]. Nonsingleton amplicon sequence variants (ASVs) were aligned with MAFFT [58] and used to construct a phylogeny with fasttree2 [59]. Taxonomy was assigned to ASVs using the classify–sklearn naive Bayes taxonomy classifier in the feature classifier plugin [60] against the SILVA Release 132 for bacteria, and UNITE Release 8.0 for fungi [61]. To minimize the difference in sequencing depth across samples, an averaged, rounded rarefied ASV table was generated by averaging 100 evenly resampled ASV subsets under the 90% of the minimum sequencing depth for further analysis. The high-quality sequences of bacteria and fungi were 256,285 and 39,774 in soils with an average length of 343 bp and 259 bp, respectively.

2.5. Data Analysis

The statistical analyses were conducted in R Version 4.0.3. [62] unless stated otherwise. The plant richness, Shannon index, Simpson index, and principal component analysis (PCA) of plant communities were based on the data from the vegetation survey inventories. The aboveground plant biomass was represented by the total basal area (TBA) of trees and shrubs. ASV-level alpha diversity indices (Chao1 richness estimator, Shannon index, and Simpson index) were calculated using the ASV table in QIIME2.
ANOVAs and LSD tests were used to study the differences in soil properties and plant community characteristics regarding different slope aspects. PCA was conducted to characterize the community structure of aboveground plants using the abundance of species of trees and shrubs in each quadrat, and principal co-ordinates analysis (PCoA) w used to generalize the community structure of soil bacteria and fungi using the abundance of ASVs of the respective quadrat. The similarities in community structure within each sampled site were tested by analysis of similarities (ANOSIM), and the pairwise differences were tested by pairwise PERMANOVA/adonis. General linear regression was used to analyze the relationship between plant community characteristics and the soil bacterial and fungal communities (the PC1 axis score stands for the plant community composition, while the PCoA1 axis score represented soil bacterial and fungal community composition). Redundancy analysis (RDA) was performed to scrutinize the main factors affecting the community composition of aboveground plants, soil bacteria and soil fungi, and the correlation of each factor with community composition was tested by the Mantel test. To examine the relationship between aboveground plant community and belowground soil microbial communities, a linear regression was performed to evaluate the correlations of plant richness, aboveground total basal area, and plant community structure with the species richness, diversity index and community structure of soil bacteria and fungi, respectively. Structural equation modelling (v. 4.0.3 R package LAVAAN/SEM) was conducted to test the direct and indirect effects of slope aspect on the relationship between the aboveground plant community and the belowground bacterial and fungal communities.

3. Results

3.1. Soil Properties across the Sampled Sites

The ANOVA tests showed that there were certain differences in the physical and chemical properties of the soil across the three aspect sites (Table 1; p < 0.05). Specifically, compared with those in the north- and south-facing slopes, most soil nutrient contents were significantly lower on the flat site; these are soil total phosphorus (TP) (0.69 ± 0.18 g kg−1), soil-available phosphorus (AP) (18.17 ± 1.17 mg g−1), soil total nitrogen (TN) (5.62 ± 0.28 g kg−1), soil-available N (AN) (0.79 ± 0.06 g kg−1), and soil organic matter (SOM) (155.16 ± 5.80 g kg−1). The soil pH was lowest (6.67 ± 0.67) on the north-facing slope and highest (7.36 ± 0.5) on the flat site and the differences were significant across the three aspects. The soil water content was the highest on the north-facing slope and significant differences were found among the three sites. For nitrogen and phosphorus, only soil-available nitrogen was significantly different across the three slope sites.

3.2. Community Characteristics of Vegetation and Soil Bacteria and Fungi across the Sample Sites

The aboveground plant community showed significant differences in species richness, productivity, and community composition and structure across the three sampled sites (Figure 2, Table S1). The highest species richness was found on the south-facing slope (71.28 ± 2.31), while the lowest was found on the north-facing slope (47.14 ± 1.20, Figure 2A). The highest value of total basal area on the flat site (174.30 ± 6.42) was significantly different from the lowest value on the north-facing slope; however, the medium value on the south-facing slope was not significantly different on either of the other two sites (p > 0.05; Figure 2B). No significant differences were revealed for both the Shannon index and Simpson index across the north-facing slope, flat site, and south-facing slope (Figure 2C,D). Principal component analysis (PCA) of plant species showed that the community structure on the three sampled sites was significantly different (R = 0.23, p = 0.001, Figure 2E).
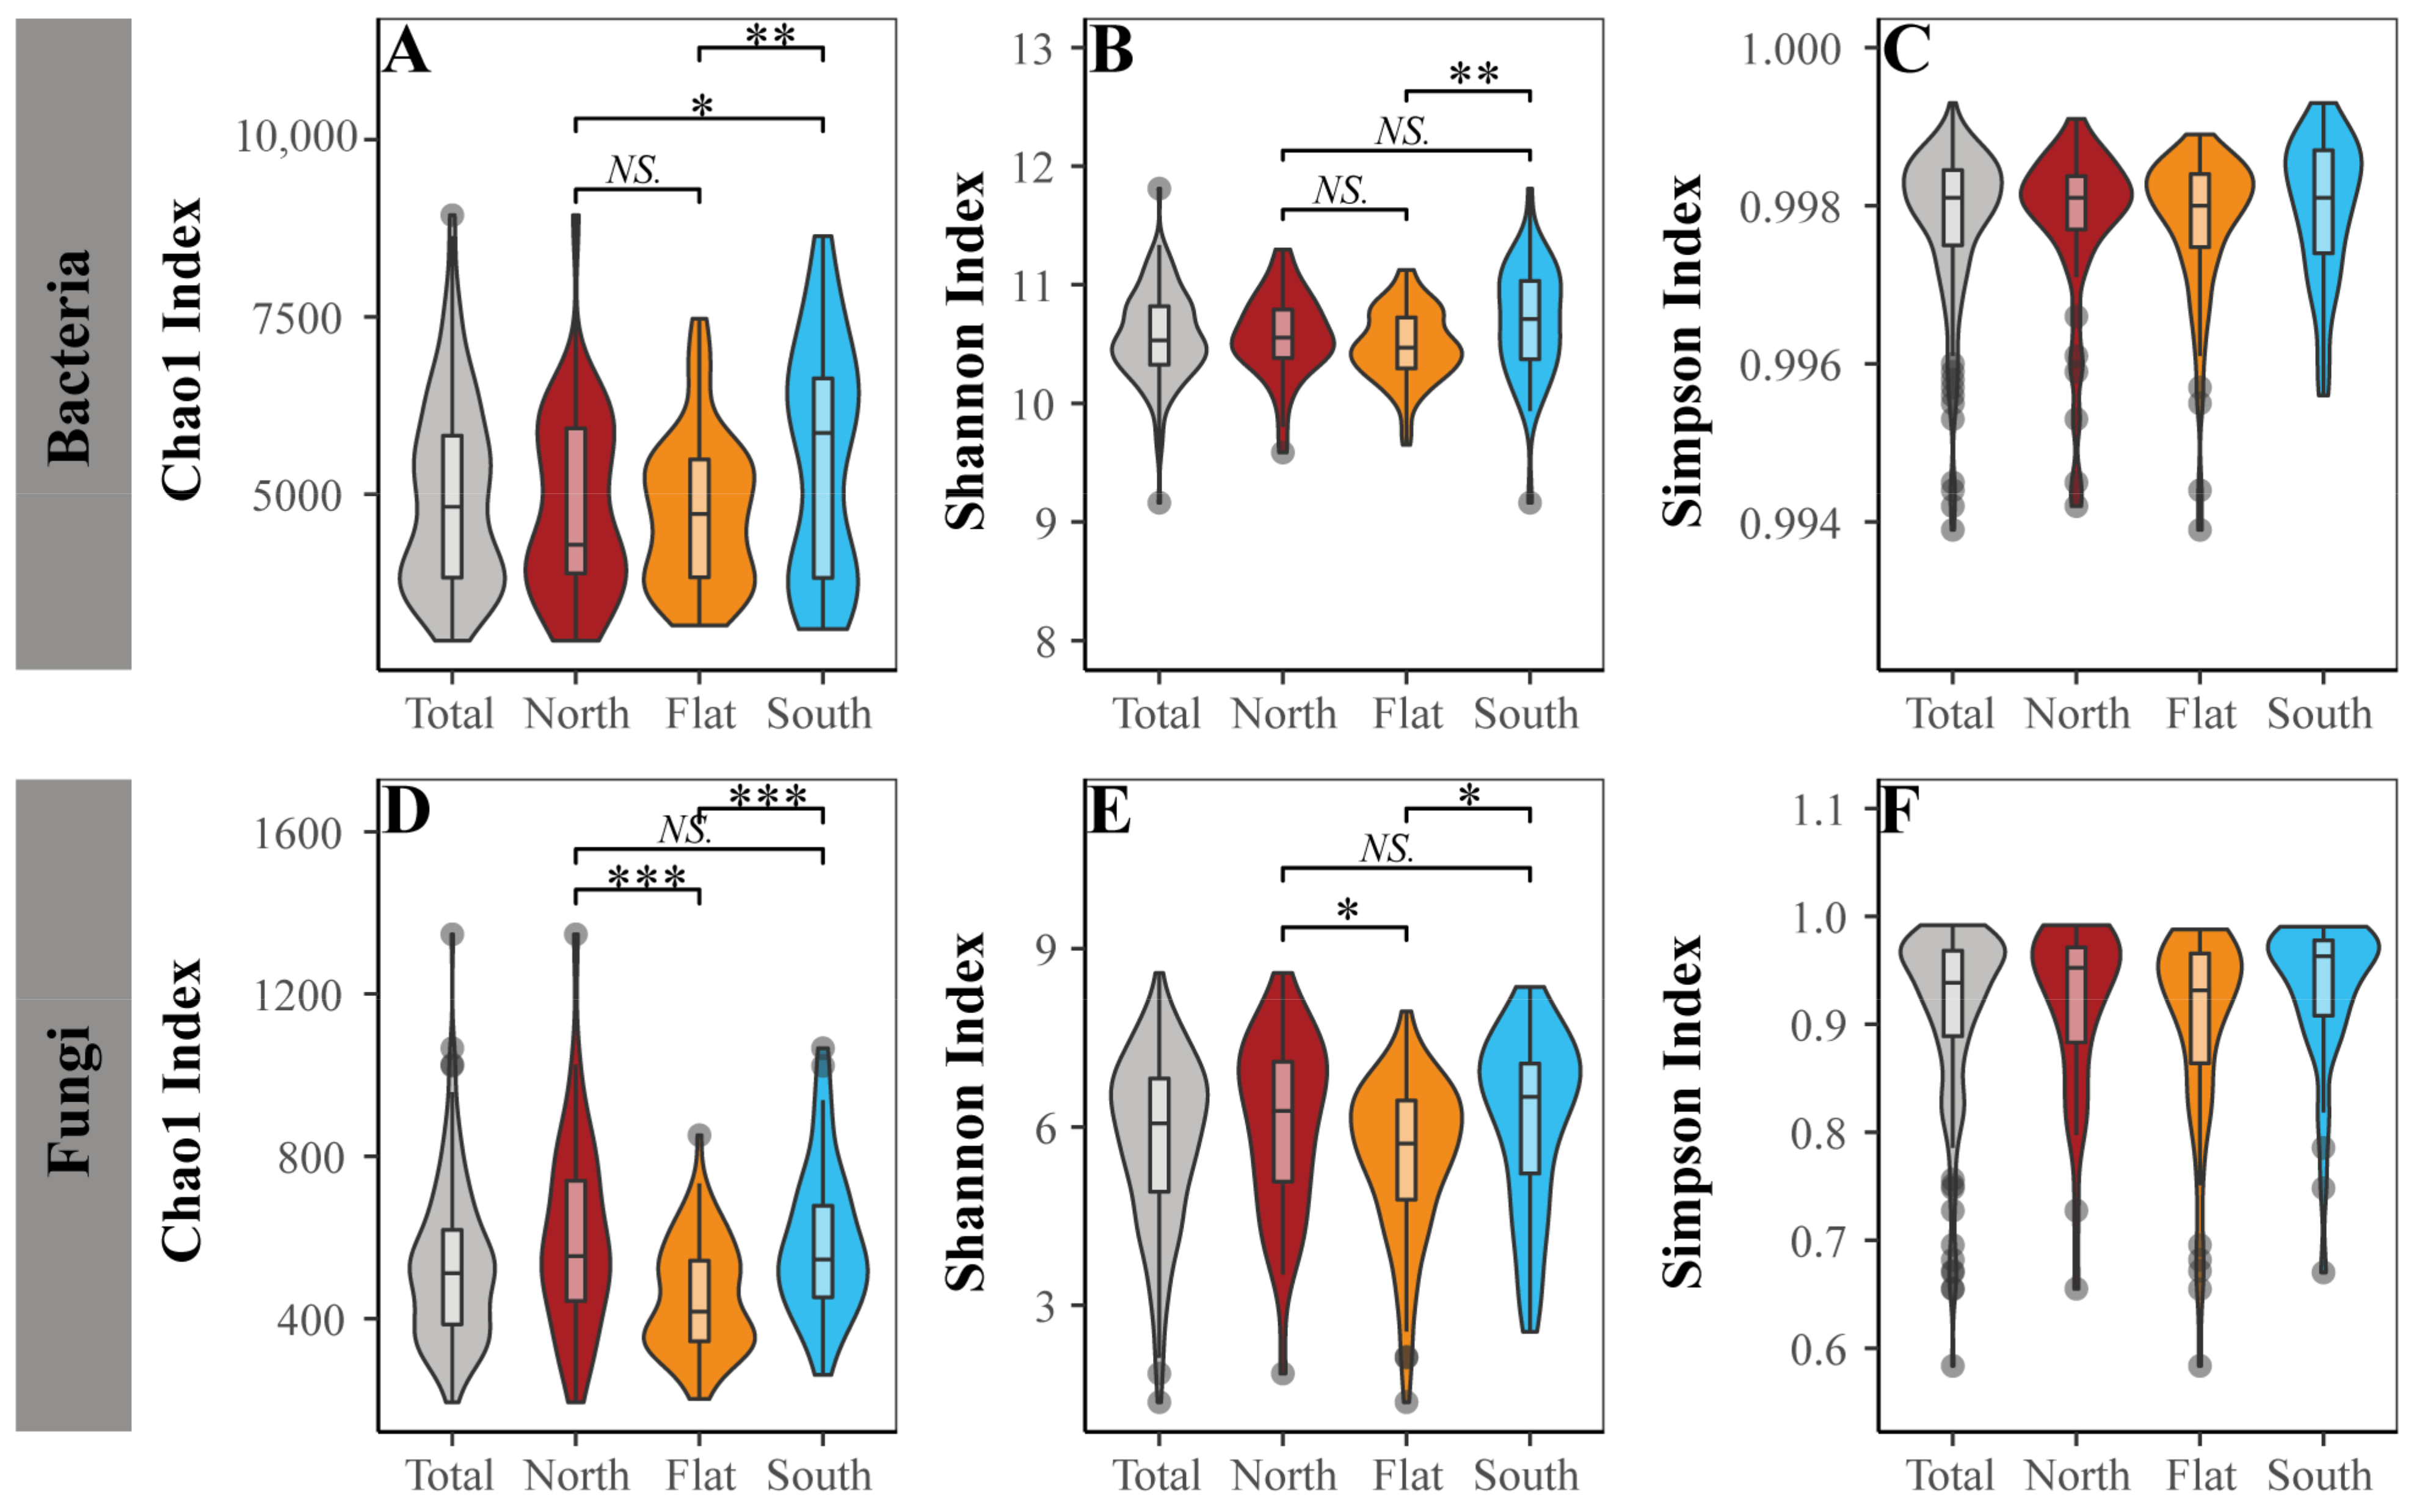
The alpha-diversity of both the soil bacterial community and soil fungal community was detected to be different in the Chao1 index and Shannon index across the three sample sites (Figure 3). For the soil bacteria community, the Chao 1 index and Shannon index were both highest on the south-facing slope (Chao1: 5530.74 ± 239.38, Shannon: 10.69 ± 0.03) and the lowest on the flat site (Chao1: 4735.68 ± 114.35, Shannon: 10.48 ± 0.03), and a significant difference was revealed between the south-facing slope and the north-facing slope or the flat site in Chao 1 index, while significant differences were only found between the highest (south-facing slope) and lowest (flat site) values in Shannon index (p < 0.05; Figure 3A,B). The lowest value of the Chao 1 index (452.84 ± 15.13) of soil fungi was found to be significantly lower than those on both the north-facing slope (596.55 ± 34.94) and the south-facing slope (586.76 ± 26.64). This trend was also revealed in the Shannon index of soil fungi, with the values on the flat site (5.32 ± 0.01) being significantly lower than those on both the north-facing slope (6.78 ± 0.03) and the south-facing slope (7.01 ± 0.03) (p < 0.05; Figure 3D,E).
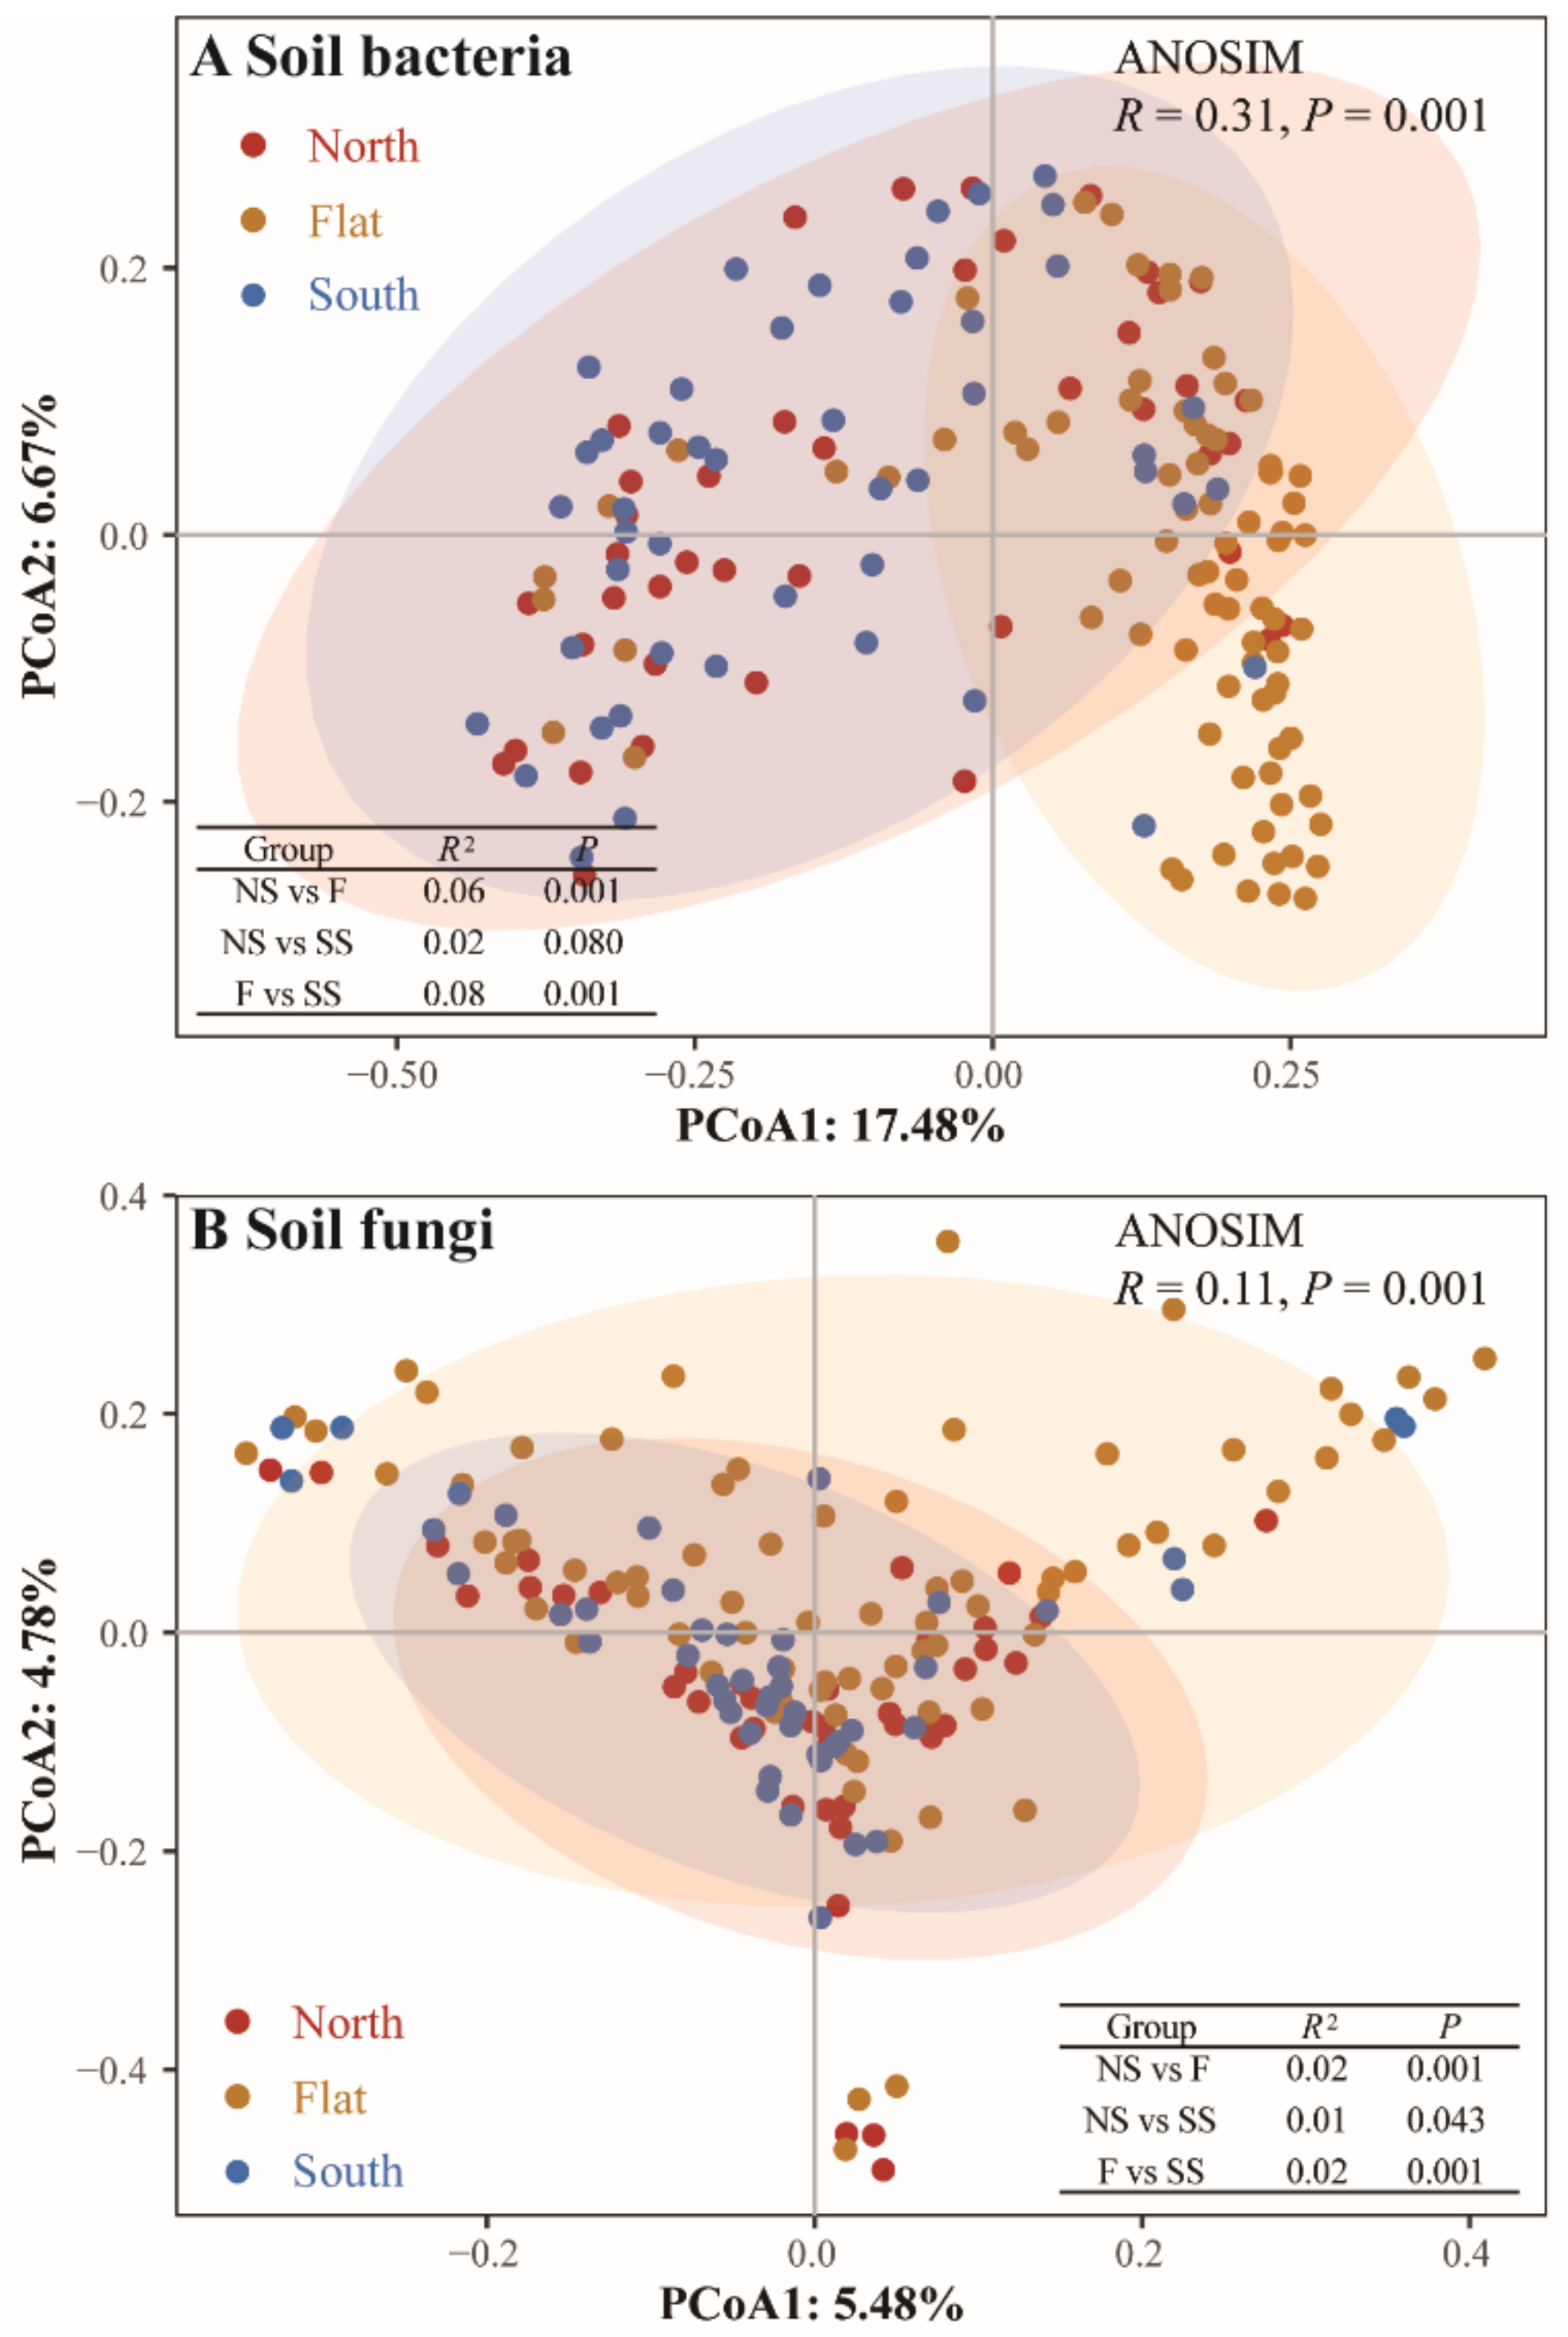
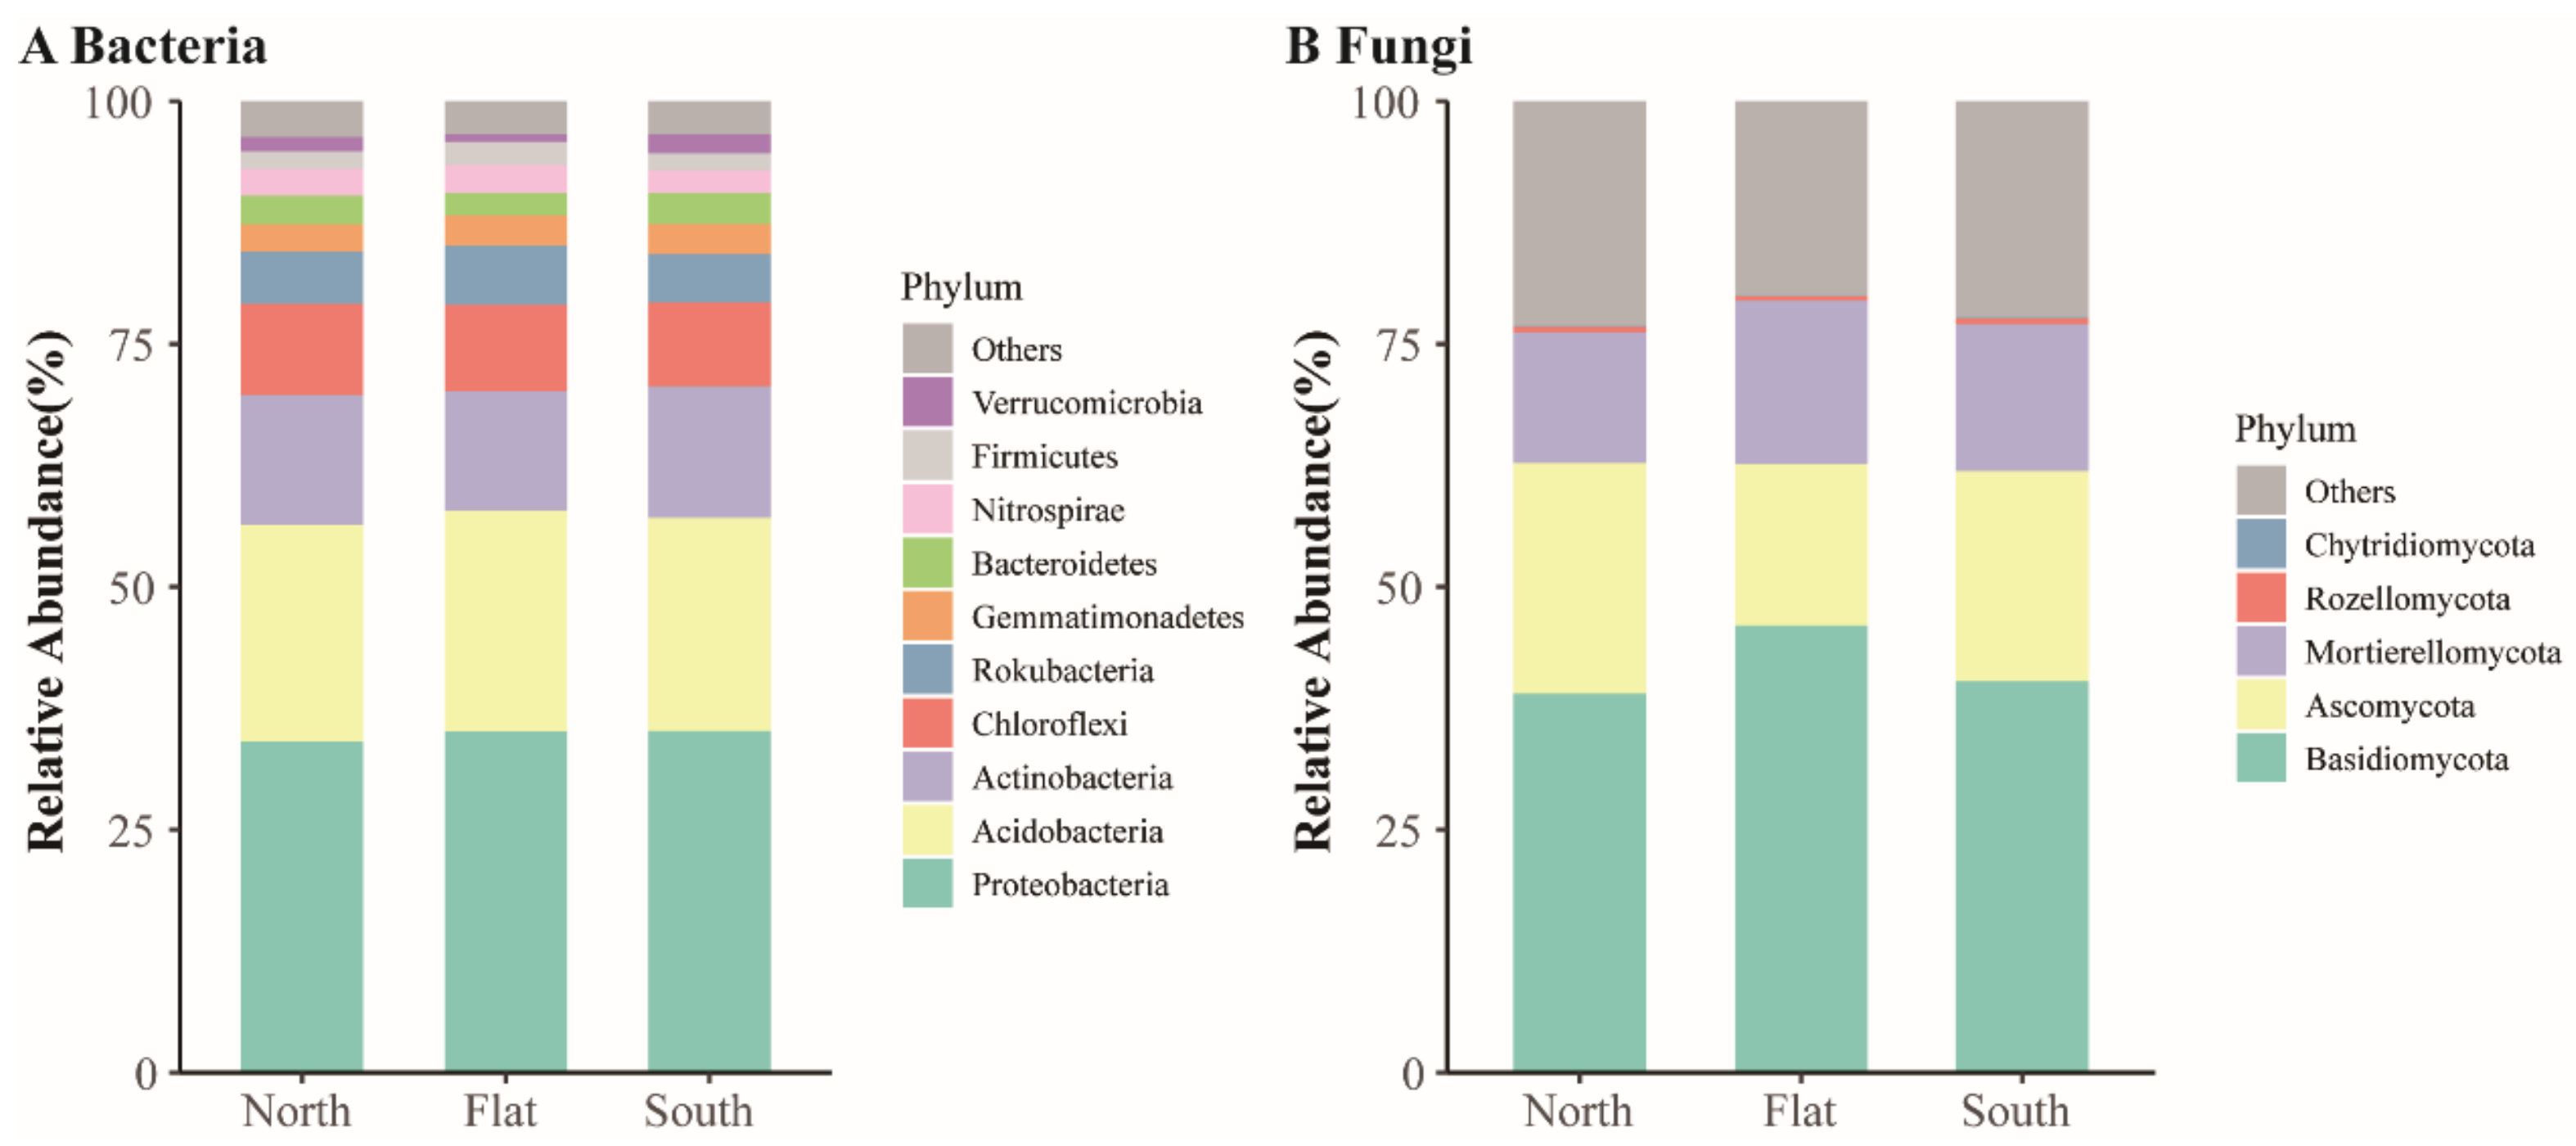
The community structure and composition of both soil bacteria (R = 0.31, p = 0.001) and fungi (R = 0.11, p = 0.001) revealed differences across the three slope sites (Figure 4 and Figure 5). The soil bacterial community structure of the flat site was significantly different from that of either site on the two slopes (Figure 4A). For the soil fungal community structure, the differences were significant among the three sample sites (Figure 4B). Four phyla of bacteria (Proteobacteria, Acidobacteria, Actinobacteria and Chloroflexi) and three phyla of fungi (Basidiomycota, Ascomycota and Mortierellomycota) accounted for more than three quarters of the relative abundance in the community of soil bacteria soil fungi, respectively (Figure 5). For the community composition of the soil bacterial community, three phyla, Actinobacteria, Bacteroidetes and Verrucomicrobia, had significantly lower relative abundance in the flat site, and two phyla, Rokubacteria and Nitrospirae, had significantly higher relative abundance again in the flat site (p < 0.05, Figure 5A and Figure S1A). For the soil fungal community composition, only Ascomycota had a significantly lower relative abundance on the flat site (p < 0.05, Figure 5B and Figure S1B).

3.3. Factors Influencing the Community Composition of Plants and Soil Bacteria and Fungi

Factors influencing the community composition of the aboveground plants and the belowground soil bacteria and fungi were visualized in a redundancy analysis (RDA) supplemented with the Mantel-tested correlation of each factor with the respective community (Figure 6). The first two axes in RDA explained 66.45% of the variance in correlations between plant community at the species level and soil physical and chemical properties and diversity indices of soil bacteria and fungi (Figure 6A). All seven of the determined soil properties significantly affected the plant community composition, and only the Shannon index of soil fungi tested as significant (Figure 6B). The first two axes in RDA explained 74.36% of the variance in correlations between soil bacterial community composition at the phylum level (Figure 6C) and their corresponding environmental factors, where soil fungal diversity indices (Chao 1 index and Shannon index), together with soil nutrients including soil organic matter, soil total and available nitrogen and soil-available phosphorus, were significantly affected by the soil bacterial community composition (Figure 6D). The first two axes in RDA explained 68.79% of the variance in correlations between soil fungal community composition at the phylum level (Figure 6E) and their corresponding environmental factors, while only the plant basal area and soil-available phosphorus were detected to significantly influence the soil fungal community composition (Figure 6F).

3.4. Correlations between Plant Community and Soil Bacteria and Fungi across the Sample Sites

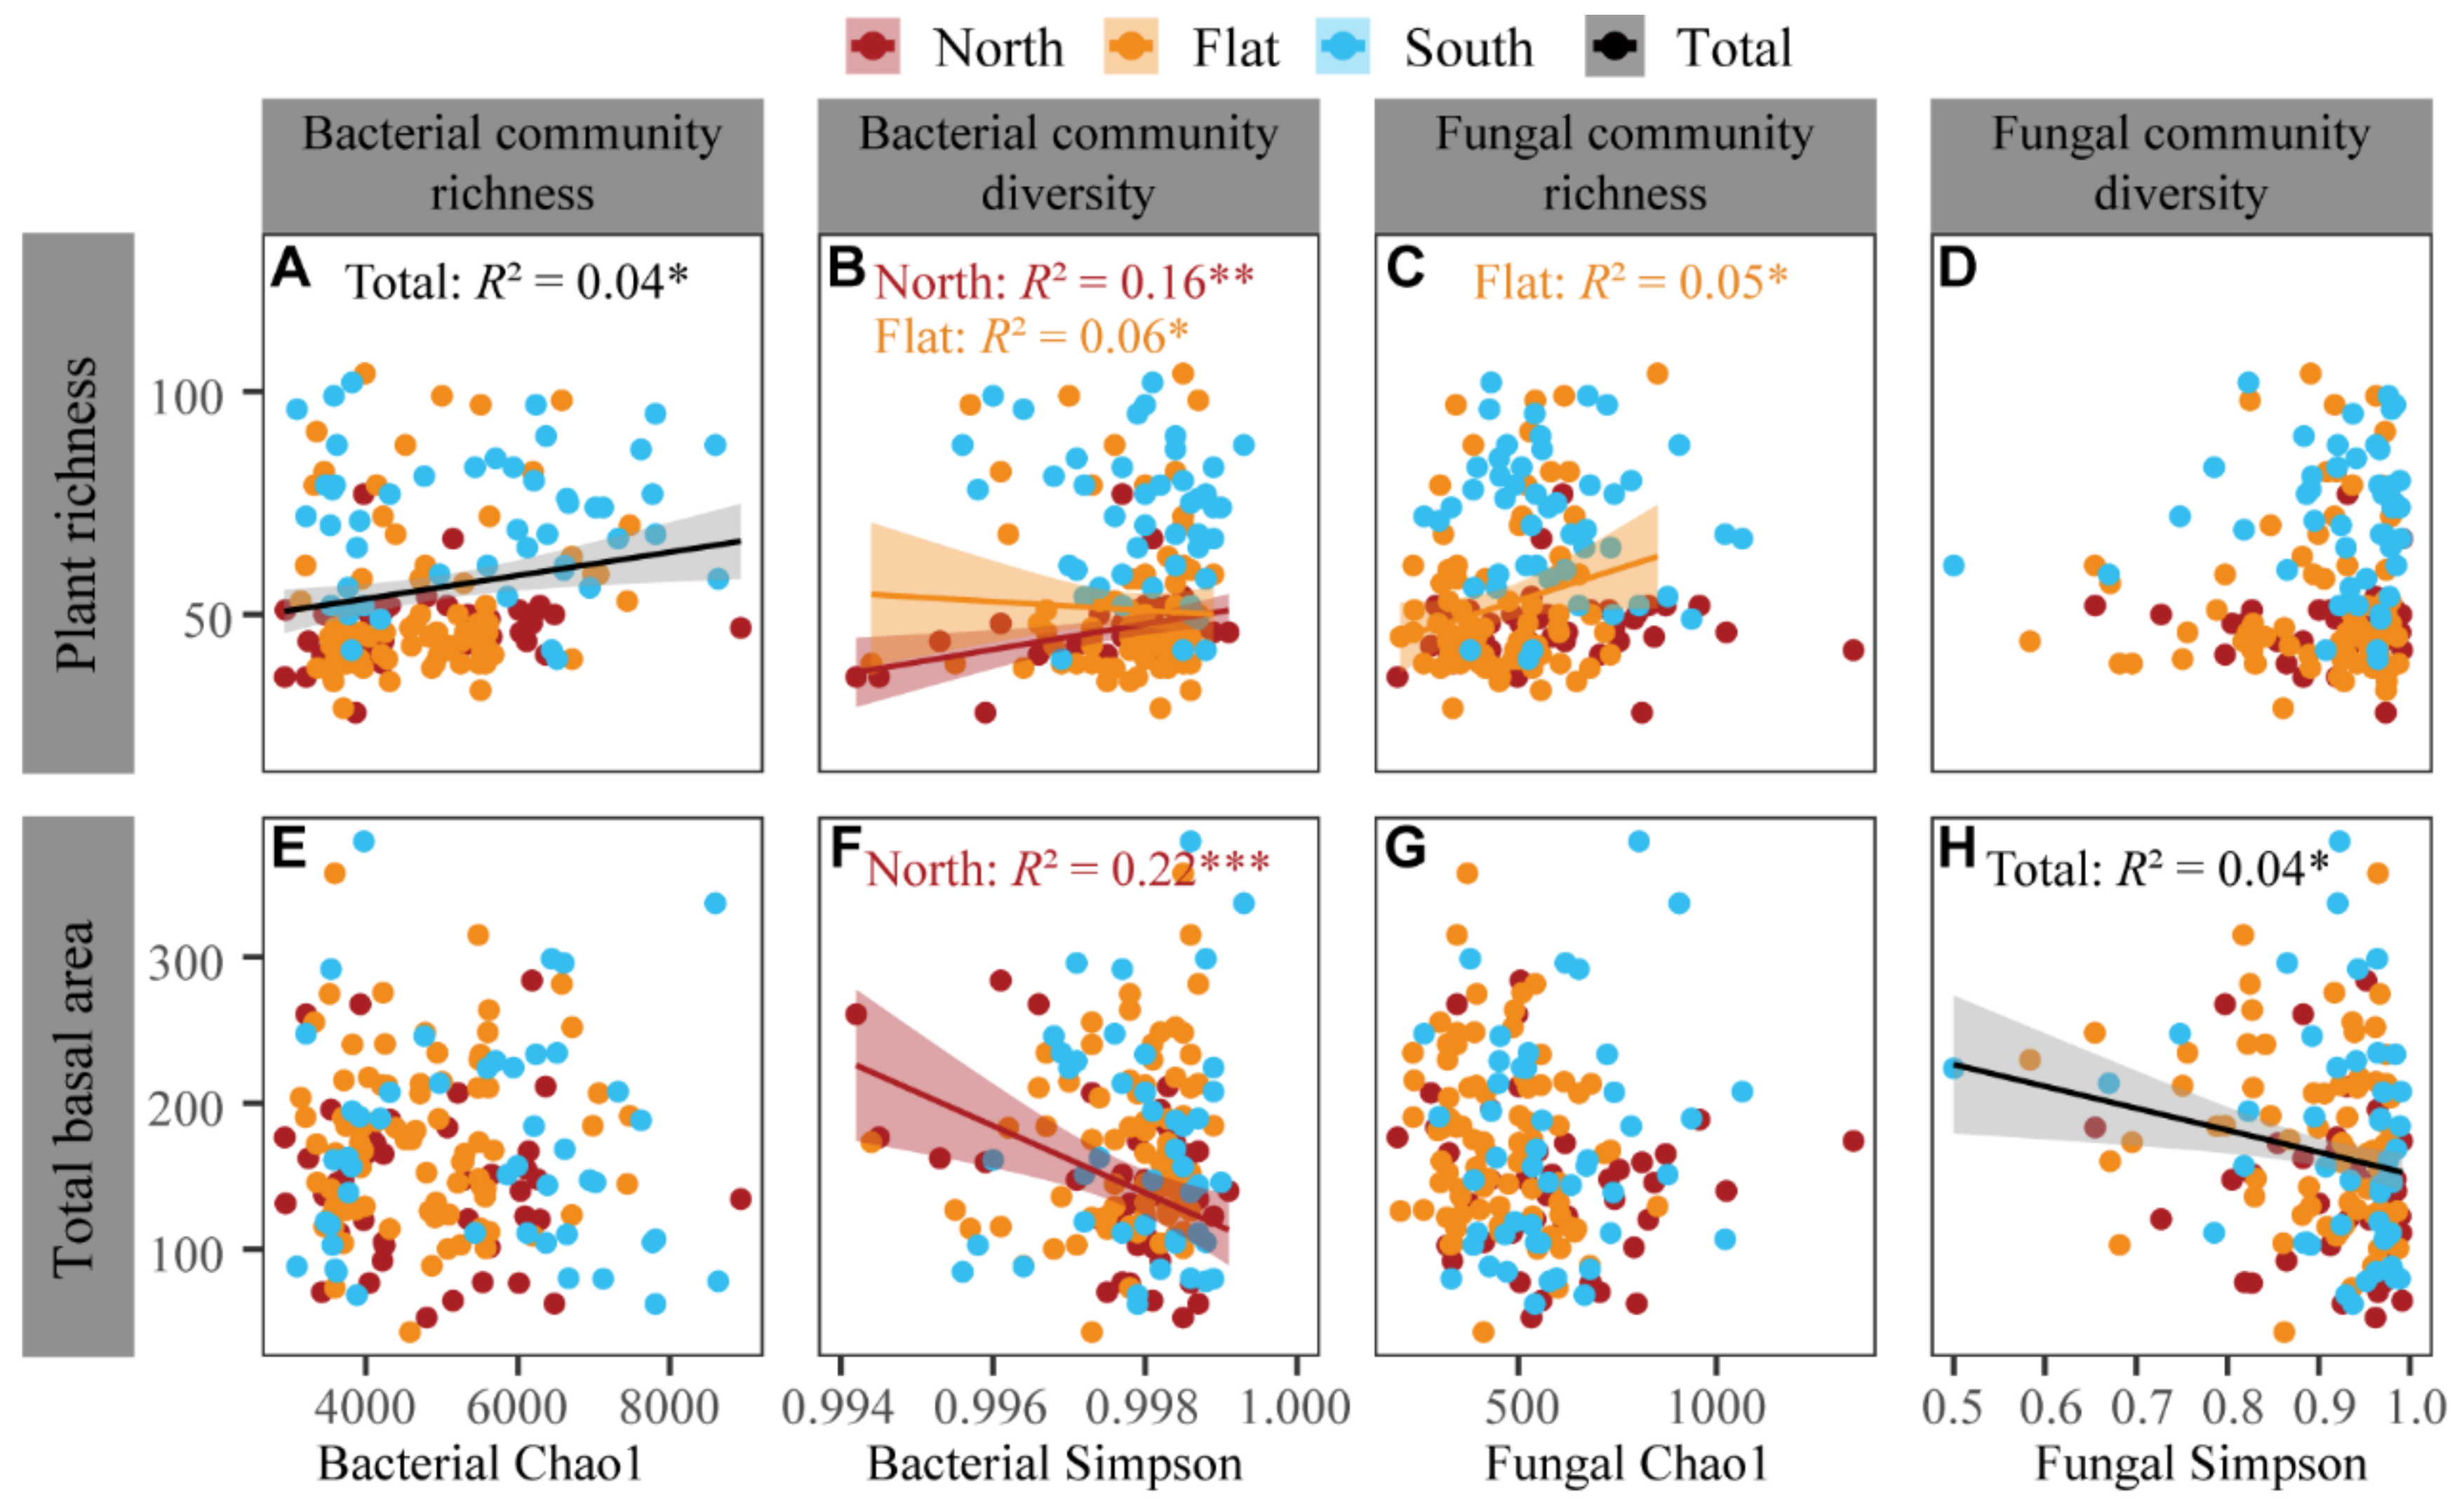
Different correlations between the aboveground plant community and belowground soil bacterial community and soil fungal community in terms of alpha diversity were detected (Figure 7). A general positive correlation was revealed between the plant species richness and soil bacterial richness (represented by Chao 1 index, Figure 7A). The correlations between plant species richness and soil bacterial alpha diversity (represented by Simpson index) were both positive on the north-facing slope and negative on the flat site (Figure 7B). The plant species richness was only weakly correlated with the soil fungal richness and alpha diversity index on the flat site (Figure 7C). The plant productivity (represented by total basal area) was only negatively correlated with the soil bacterial alpha diversity (Simpson index) on the north-facing slope (Figure 6F), while it showed a negative correlation with the soil fungal alpha diversity (Simpson index) across all three sample sites (Figure 7H).
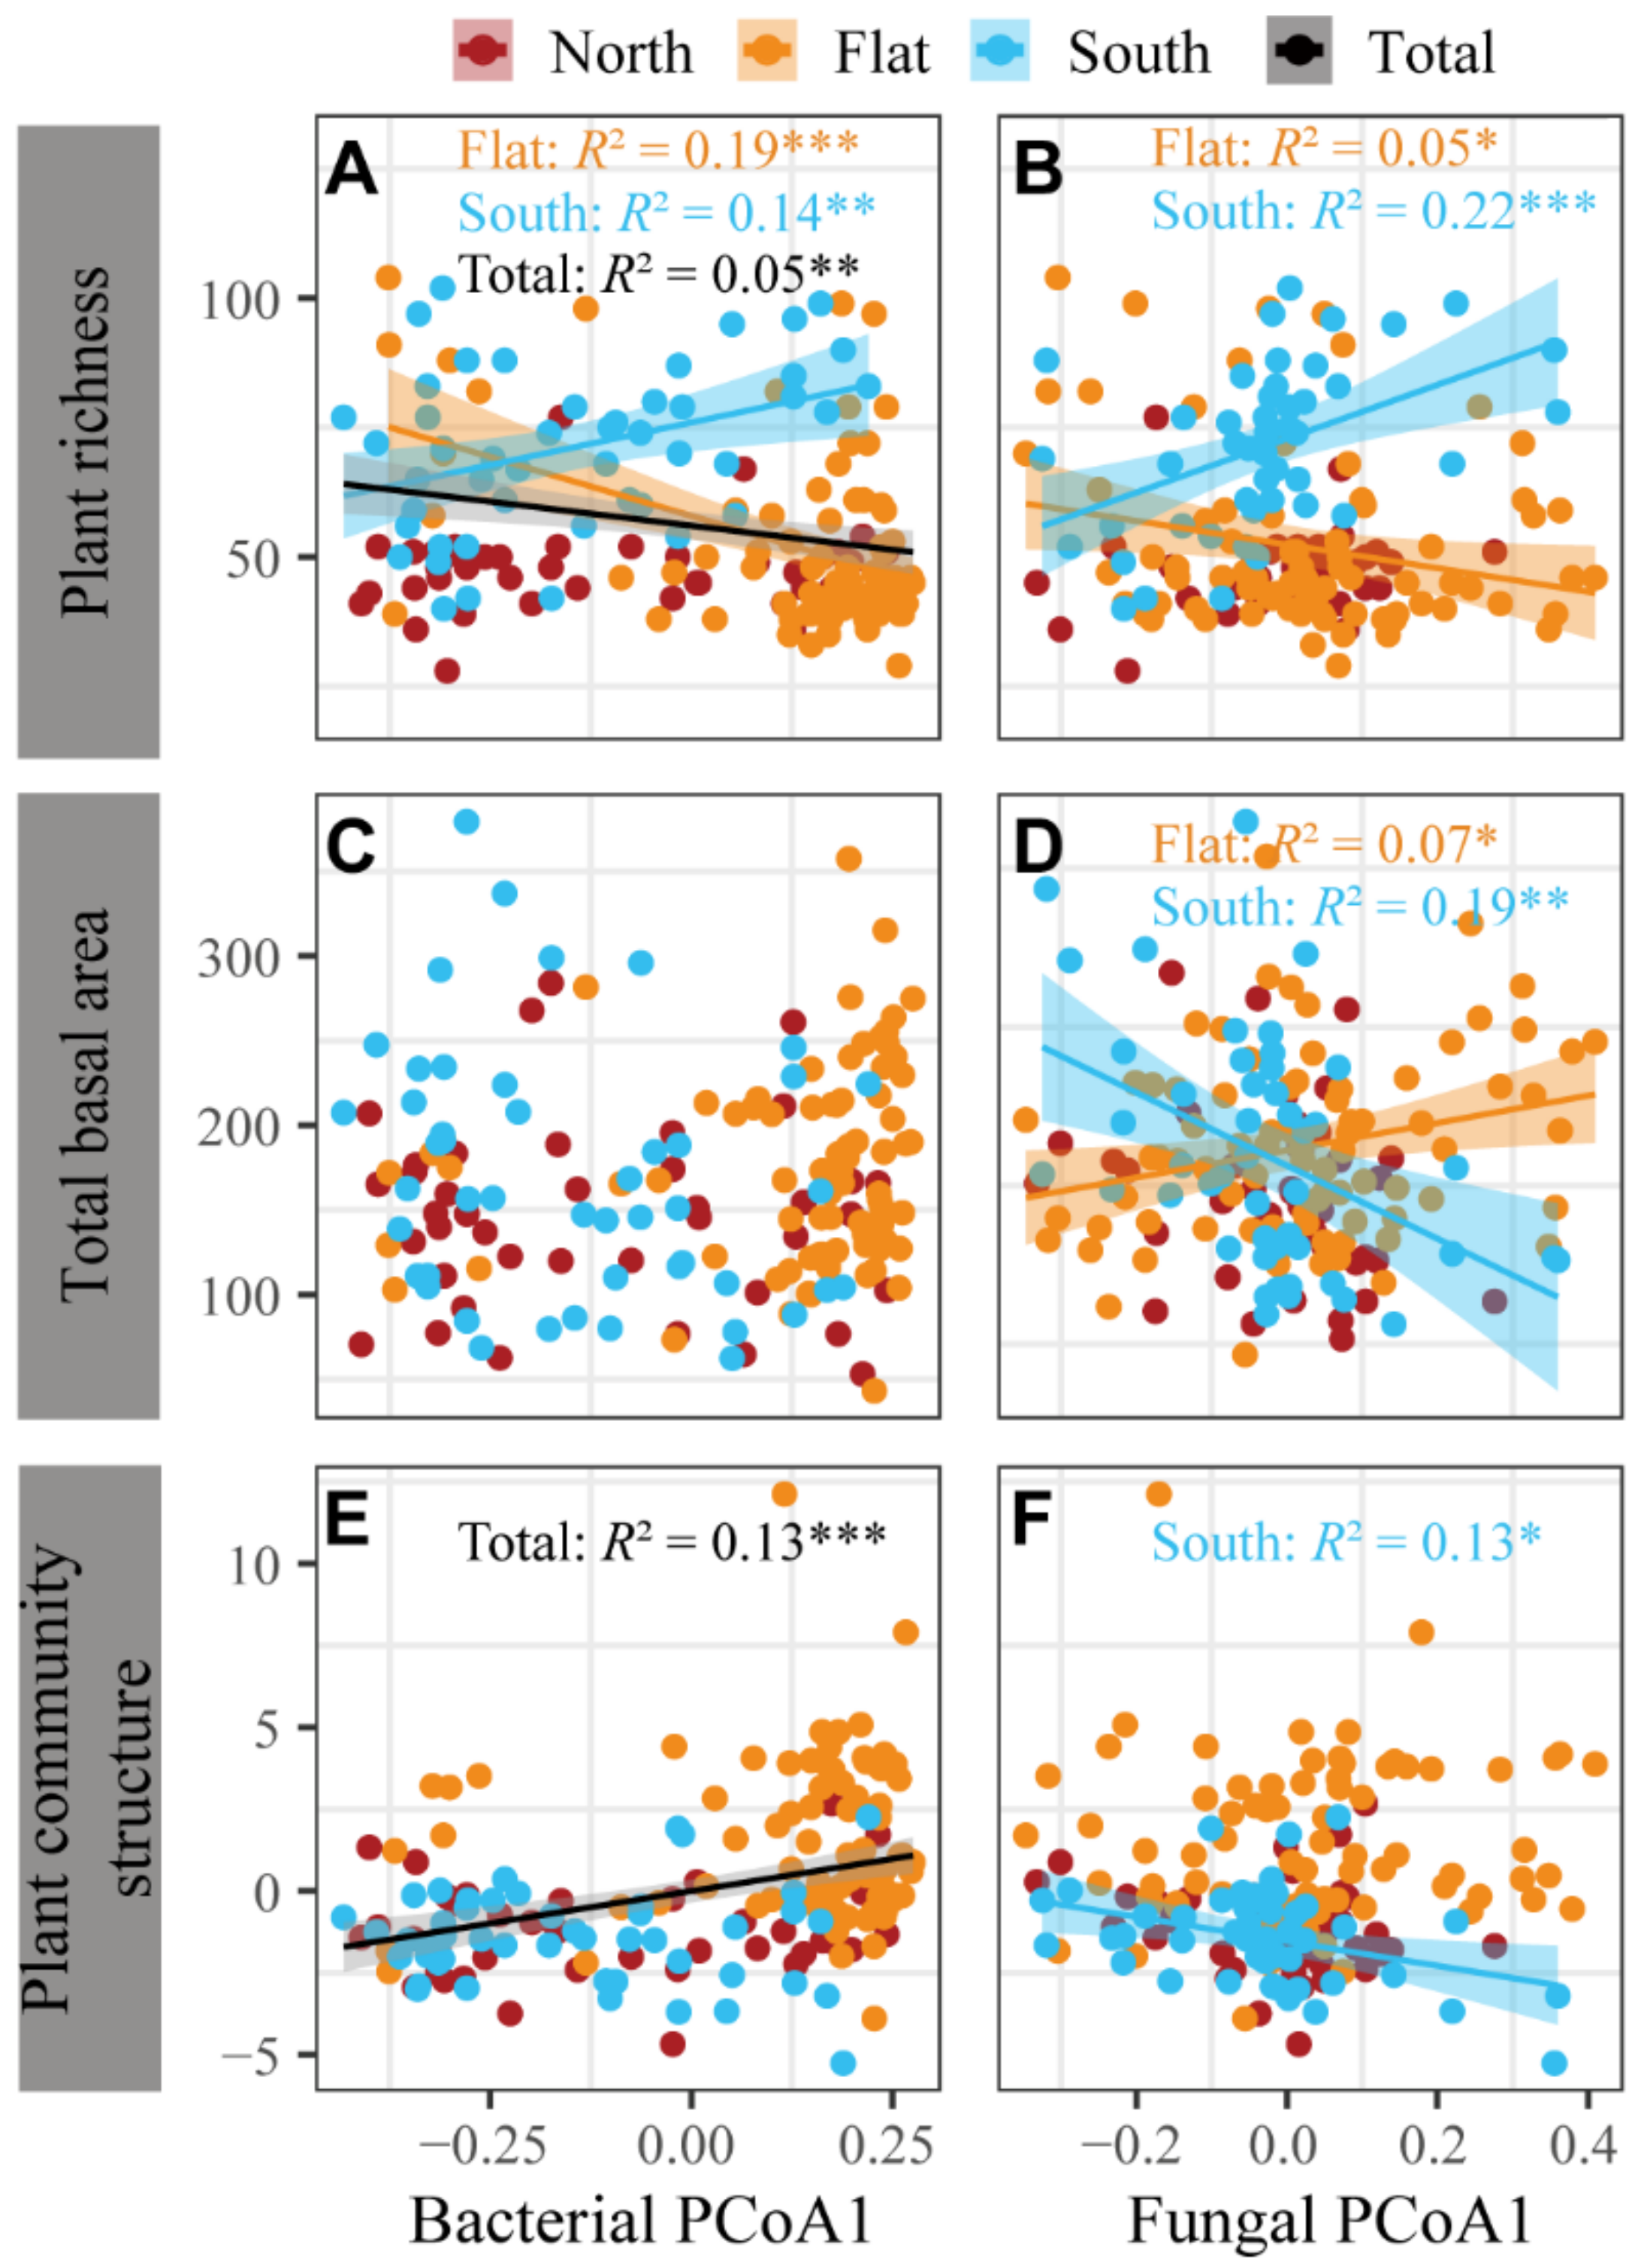
The community structure of soil bacteria and soil fungi also responded differently to the species richness, productivity and community structure of the aboveground plants (Figure 8). The community structure of soil bacteria (represented by the scores of bacterial PCoA1) significantly correlated with plant species richness and community structure (represented by the scores of plants PC1) of the aboveground plants (Figure 8A,E). However, when separated by slope aspects, the correlation of soil bacterial community structure with aboveground plant species richness also tested as significant on either the flat site or on the south-facing slope (Figure 8A). The community structure of soil fungi (represented by the sores of fungal PCoA1) showed significant correlations with the plant species richness and productivity on both the flat site and south-facing slope (Figure 8B,D), while its correlation with the community structure of aboveground plants was significant only on the south-facing slope (Figure 8F).
Structural equation model (SEM) analysis (Figure 9) revealed that changes in aboveground plants and belowground soil bacteria and fungi across the three sampled sites in terms of species richness, diversity indices and community structure were rather weakly correlated. However, a significant causal relationship was detected between plant productivity and the community of soil fungi, which was significantly influenced by the slope aspect of the three sample sites.

4. Discussion

4.1. Differentiation of Aboveground Plants and Belowground Soil Bacteria and Soil Fungi Caused by Slope Aspects

The three sites in our study were restricted to a very short distance within a 700 m × 360 m plot. Our results revealed that the seven determined soil properties were significantly different across the three sample sites. On the north-facing slope, the lower soil pH and higher soil water contents were in agreement with previous studies [36,40,63]. The reason why the five soil nutrients (TN, AN, TP, AP and SOM) were significantly lower in soil on the flat site needs further investigation. We noted from reference [64] that the effect of the leaching of soil nutrients was more severe along river banks than on the side slopes. However, from our field investigations during the rainy season (in June–August), the stream withing our plot rarely overflowed the flat site, and we avoided sampling quadrats at the margin of the stream banks.
Differences in the aboveground plant communities separated by the three sites were mainly embodied by species richness, plant productivity and community structure. Similar results were also documented in previous studies on forests [36] or other types of vegetation [34,35,40,41,42]. Both the species richness and abundance of total plant species were significantly higher on the south-facing slope, and this result corresponds to the mountainous vegetation in the Northern Hemisphere [34,35,36]. The much higher contribution of understory herbaceous plants to the abundance of total plant species on the south-facing slope can be explained by the relatively greater solar radiation, and this phenomenon was also reported in a previous study [65]. From our field observation during vegetation surveys, trees on the flat site were comparably bigger in DBH, which explains the higher aboveground plant productivity represented by the total basal area on the flat site. However, no significant differences were observed among the diversity indicators assessed by both the Shannon index and Simpson index. This means that the species evenness did not change with the plant species richness within our plot.
Similarly, the differentiation of belowground soil bacteria and fungi in terms of the diversity, structure and composition of community across the three slope aspects was also revealed in this study. Bacteria species richness (Chao1 index) and diversity (Shannon index) were higher on the south-facing slope; this also agrees with a previous study on boreal forests in Northeast China [36]. For the structure and composition of soil bacteria, the most remarkable differences were shown in soil on the flat site. A report mentioned that the higher abundance of the Rokubacteria and Nitrospirae in soil may indicate the faster decomposition of organic matter, and the significantly lower plant litters on the flat site evidenced this to be the case. It is supposed that soils on different aspects of side slopes may have more similar soil bacterial groups (compared to the adjacent flat site) owing to the contribution of identical soil-forming rock [66], but it is not certain whether this supposition also applies to this study on an old-growth forest with mature forest soils. Fungi species richness and diversity exhibited different patterns compared to bacterial alpha diversity. The community structure of soil fungi is significantly different across the three site groups. Concerning the community composition, only the abundance of Ascomycota in soil on the flat site showed a significant value. Additionally, it is worth noting that the undefined fungi in this study accounted for more than 20% of the total.
The results support our first hypothesis that slope aspect changes in a localized range can lead to significant differences in species richness, diversity and structure and the composition of communities of both aboveground plants and belowground soil bacteria and fungi. Soil properties were detected to mostly affect the community composition of both plants and soil bacteria. This may also support the assumption that subalpine forests in West China are vulnerable ecosystems, characterized by low-nutrient soil [21,40].

4.2. Effect of Slope Aspect on the Relationships between Aboveground Plants and Belowground Soil Bacteria and Soil Fungi

The differences in both aboveground plant community and belowground soil bacteria and fungi across the three slope aspects enabled us to test our second hypothesis. The results of correlation analyses with indicators representing species richness, diversity and community structure showed different patterns of soil bacteria versus fungi compared to aboveground plants. Soil bacterial richness was co-varied with the plant species’ richness, soil community structure was linked with both plant species’ richness and plant community structure was linked with the change in slope aspect. Soil fungi only showed a linkage between changes in diversity and the biomass of aboveground plants. The north-facing slope was shown to have a remarkable influence on the correlations of bacterial diversity with plant species richness and plant biomass. The south-facing slope significantly affected the correlations between fungal community structure with plant richness, plant biomass, and plant community structure. These results support our second hypothesis that soil bacteria and soil fungi respond differently to the aboveground plant community in terms of diversity and community structure. Since our study did not detect functional groups such as arbuscular mycorrhizal fungi [34,43], we are unable to further explore whether soil fungi, compared to soil bacteria, have closer relationships with aboveground plants [3,26,27] in this subalpine coniferous forest.
The causal relationships of the SEM result revealed that the biomass of aboveground plants significantly contributed to the change in soil fungal community (in terms of diversity, relative abundance and community structure). Therefore, the assumption that plant biomass also has important affects on the soil microbial community [23] may also apply in the subalpine coniferous forest in the relationship between soil fungi and aboveground plants. The idea that soil’s chemical properties have a direct causal relationship with plant community corresponds to the RDA in this study. However, the reason for their direct causal relationships with the soil fungal community needs further investigation. The soil bacterial community has very weak causal relationships with aboveground plants in terms of both community structure and biomass. This may correspond to the assumption that the soil bacterial community responds indirectly to the changes in aboveground plants [13,14,28]. In this case, whether the responses of soil bacterial to aboveground plants are through functioning soil fungi needs further investigation.
However, since the soil microbes also include organisms other than bacteria and fungi, the relationships among different functional groups are even more complicated [67]. In future studies, we intend to incorporate other soil microorganisms, to separate these by functional groups and to take seasonal changes in plant functional traits [46] in the same area into consideration as well. In this way, we may further disentangle the correlations between the aboveground plant community and belowground microbial communities along the slope aspects.

5. Conclusions

In summary, our study revealed that there are significant differences in the aboveground plant community and belowground community of soil bacteria and soil fungi in terms of diversity, community composition and structure across different slope aspects in a subalpine coniferous forest. With the change in slope aspect, the correlation between above-/belowground communities diversified accordingly at the local scale. Soil bacteria and soil fungi respond differently to the change in plant community, influenced by the slope aspect. The community composition and structure of soil fungi is inferred to correspondingly change with the aboveground plant productivity, while the community of soil bacteria is rather weakly correlated with the aboveground plant community. Soil abiotic factors affect some of the connections between these communities, and the fact that some of these indicators showed significant correlations between soil bacteria and plants may be caused by the soil’s physical and chemical properties. Further studies that take the role of plant functional traits and soil microbial functional groups, as well as seasonal changes, into consideration may better reflect the relationship among plant and soil microbes and disclose more in-depth interrelationships, which could help to understand the nature of the mechanisms maintaining ecological function in subalpine coniferous forests.

Supplementary Materials

The following supporting information can be downloaded at: https://www.mdpi.com/article/10.3390/f14071389/s1, Figure S1: Relative abundances (average values and standard error) of soil bacteria (A) and soil fungi (B) at phylum level in the three sample sites (north-facing slope, flat site and south-facing slope). Different letters indicate significant differences (ANOVA, p < 0.05, Tukey’s HSD post-hoc analysis) among the three site groups; Table S1: Attributes of plant community in the three sample sites; Table S2: Pearson’s rank correlation coefficients (R) between soil microbial (bacterial and fungal) composition and the environmental variables; Table S3: Pearson’s rank correlation coefficients (R) between plant community attributes and the environmental variables.

Author Contributions

Methodology, C.J.; software, L.H.; investigation, L.H.; data curation, C.J.; writing—original draft, L.H.; writing—review and editing, L.H., S.M., B.Z. and C.J.; funding acquisition, C.J. All authors have read and agreed to the published version of the manuscript.

Funding

This research was supported by the National Natural Science Foundation of China (No. 32271622) and the National Key R&D Program of China (2022YF0802304).

Data Availability Statement

Data will be made available on request.

Acknowledgments

We thank Haojie Su, Chenqi He, Yanwei Qin, Bingjie Qu, Qingshui Yu for assistance with field and laboratory work, and Lijuan Sun and Zhiyao Tang for their helpful suggestions. We are especially appreciated Jiangling Zhu for the project funding support, and indebted to Peipei Zhang (Chengdu Institute of Biology, Chinese Academy of Sciences) for her constructive suggestions regarding the data analyses. We also thank the editors and anonymous reviewers for their valuable comments on the manuscript.

Conflicts of Interest

The authors declare no conflict of interest.

References

  1. Bakker, M.G.; Bradeen, J.M.; Kinkel, L.L. Effects of Plant Host Species and Plant Community Richness on Streptomycete Community Structure. FEMS Microbiol. Ecol. 2013, 83, 596–606. [Google Scholar] [CrossRef] [PubMed] [Green Version]
  2. Vos, M.; Wolf, A.B.; Jennings, S.J.; Kowalchuk, G.A. Micro-Scale Determinants of Bacterial Diversity in Soil. FEMS Microbiol. Rev. 2013, 37, 936–954. [Google Scholar] [CrossRef] [Green Version]
  3. van der Putten, W.H.; Bradford, M.A.; Pernilla Brinkman, E.; van de Voorde, T.F.J.; Veen, G.F. Where, When and How Plant-Soil Feedback Matters in a Changing World. Funct. Ecol. 2016, 30, 1109–1121. [Google Scholar] [CrossRef]
  4. Krashevska, V.; Klarner, B.; Widyastuti, R.; Maraun, M.; Scheu, S. Impact of Tropical Lowland Rainforest Conversion into Rubber and Oil Palm Plantations on Soil Microbial Communities. Biol. Fertil. Soils 2015, 51, 697–705. [Google Scholar] [CrossRef]
  5. Deng, Q.; Cheng, X.; Hui, D.; Zhang, Q.; Li, M.; Zhang, Q. Soil Microbial Community and Its Interaction with Soil Carbon and Nitrogen Dynamics Following Afforestation in Central China. Sci. Total Environ. 2016, 541, 230–237. [Google Scholar] [CrossRef]
  6. Hagedorn, F.; Gavazov, K.; Alexander, J.M. Above- and Belowground Linkages Shape Responses of Mountain Vegetation to Climate Change. Science 2019, 365, 1119–1123. [Google Scholar] [CrossRef]
  7. Tedersoo, L.; Bahram, M.; Zobel, M. How Mycorrhizal Associations Drive Plant Population and Community Biology. Science 2020, 367, eaba1223. [Google Scholar] [CrossRef]
  8. Van der Putten, W.H.; Vet, L.E.M.; Harvey, J.A.; Wäckers, F.L. Linking Above- and Belowground Multitrophic Interactions of Plants, Herbivores, Pathogens, and Their Antagonists. Trends Ecol. Evol. 2001, 16, 547–554. [Google Scholar] [CrossRef]
  9. Bezemer, T.M.; De Deyn, G.B.; Bossinga, T.M.; Van Dam, N.M.; Harvey, J.A.; Van der Putten, W.H. Soil Community Composition Drives Aboveground Plant-Herbivore-Parasitoid Interactions. Ecol. Lett. 2005, 8, 652–661. [Google Scholar] [CrossRef]
  10. Latz, E.; Eisenhauer, N.; Rall, B.C.; Allan, E.; Roscher, C.; Scheu, S.; Jousset, A. Plant Diversity Improves Protection against Soil-Borne Pathogens by Fostering Antagonistic Bacterial Communities. J. Ecol. 2012, 100, 597–604. [Google Scholar] [CrossRef]
  11. Ushio, M.; Wagai, R.; Balser, T.C.; Kitayama, K. Variations in the Soil Microbial Community Composition of a Tropical Montane Forest Ecosystem: Does Tree Species Matter? Soil Biol. Biochem. 2008, 40, 2699–2702. [Google Scholar] [CrossRef]
  12. Bainard, L.D.; Hamel, C.; Gan, Y. Edaphic Properties Override the Influence of Crops on the Composition of the Soil Bacterial Community in a Semiarid Agroecosystem. Appl. Soil Ecol. 2016, 105, 160–168. [Google Scholar] [CrossRef]
  13. Schlatter, D.C.; Bakker, M.G.; Bradeen, J.M.; Kinkel, L.L. Plant Community Richness and Microbial Interactions Structure Bacterial Communities in Soil. Ecology 2015, 96, 134–142. [Google Scholar] [CrossRef] [Green Version]
  14. Lyons, C.L.; Lindo, Z. Above- and Belowground Community Linkages in Boreal Peatlands. Plant Ecol. 2020, 221, 615–632. [Google Scholar] [CrossRef]
  15. Broughton, L.C.; Gross, K.L. Patterns of Diversity in Plant and Soil Microbial Communities along a Productivity Gradient in a Michigan Old-Field. Oecologia 2000, 125, 420–427. [Google Scholar] [CrossRef] [PubMed]
  16. Van der Heijden, M.G.A.; Bardgett, R.D.; Van Straalen, N.M. The Unseen Majority: Soil Microbes as Drivers of Plant Diversity and Productivity in Terrestrial Ecosystems. Ecol. Lett. 2008, 11, 296–310. [Google Scholar] [CrossRef] [PubMed]
  17. Eisenhauer, N.; Beßler, H.; Engels, C.; Gleixner, G.; Habekost, M.; Milcu, A.; Partsch, S.; Sabais, A.C.W.; Scherber, C.; Steinbeiss, S.; et al. Plant Diversity Effects on Soil Microorganisms Support the Singular Hypothesis. Ecology 2010, 91, 485–496. [Google Scholar] [CrossRef] [PubMed]
  18. Sauheitl, L.; Glaser, B.; Dippold, M.; Leiber, K.; Weigelt, A. Amino Acid Fingerprint of a Grassland Soil Reflects Changes in Plant Species Richness. Plant Soil 2010, 334, 353–363. [Google Scholar] [CrossRef]
  19. Santonja, M.; Rancon, A.; Fromin, N.; Baldy, V.; Hättenschwiler, S.; Fernandez, C.; Montès, N.; Mirleau, P. Plant Litter Diversity Increases Microbial Abundance, Fungal Diversity, and Carbon and Nitrogen Cycling in a Mediterranean Shrubland. Soil Biol. Biochem. 2017, 111, 124–134. [Google Scholar] [CrossRef]
  20. Otsing, E.; Barantal, S.; Anslan, S.; Koricheva, J.; Tedersoo, L. Litter Species Richness and Composition Effects on Fungal Richness and Community Structure in Decomposing Foliar and Root Litter. Soil Biol. Biochem. 2018, 125, 328–339. [Google Scholar] [CrossRef]
  21. Liu, L.; Zhu, K.; Wurzburger, N.; Zhang, J. Relationships between Plant Diversity and Soil Microbial Diversity Vary across Taxonomic Groups and Spatial Scales. Ecosphere 2020, 11, e02999. [Google Scholar] [CrossRef] [Green Version]
  22. Zak, D.R.; Holmes, W.E.; White, D.C.; Peacock, A.D.; Tilman, D. Plant Diversity, Soil Microbial Communities, and Ecosystem Function: Are There Any Links? Ecology 2003, 84, 2042–2050. [Google Scholar] [CrossRef] [Green Version]
  23. Li, H.; Wang, X.; Liang, C.; Hao, Z.; Zhou, L.; Ma, S.; Li, X.; Yang, S.; Yao, F.; Jiang, Y. Aboveground-Belowground Biodiversity Linkages Differ in Early and Late Successional Temperate Forests. Sci. Rep. 2015, 5, 12234. [Google Scholar] [CrossRef] [Green Version]
  24. Li, H.; Xu, Z.; Yan, Q.; Yang, S.; Van Nostrand, J.D.; Wang, Z.; He, Z.; Zhou, J.; Jiang, Y.; Deng, Y. Soil Microbial Beta-Diversity Is Linked with Compositional Variation in Aboveground Plant Biomass in a Semi-Arid Grassland. Plant Soil 2018, 423, 465–480. [Google Scholar] [CrossRef] [Green Version]
  25. Uroz, S.; Buée, M.; Deveau, A.; Mieszkin, S.; Martin, F. Ecology of the Forest Microbiome: Highlights of Temperate and Boreal Ecosystems. Soil Biol. Biochem. 2016, 103, 471–488. [Google Scholar] [CrossRef]
  26. Chen, L.; Swenson, N.G.; Ji, N.; Mi, X.; Ren, H.; Guo, L.; Ma, K. Differential Soil Fungus Accumulation and Density Dependence of Trees in a Subtropical Forest. Science 2019, 366, 124–128. [Google Scholar] [CrossRef] [PubMed]
  27. van der Heijden, M.G.A.; Klironomos, J.N.; Ursic, M.; Moutoglis, P.; Streitwolf-Engel, R.; Boller, T.; Wiemken, A.; Sanders, I.R. Mycorrhizal Fungal Diversity Determines Plant Biodiversity, Ecosystem Variability and Productivity. Nature 1998, 396, 69–72. [Google Scholar] [CrossRef]
  28. Chen, L.; Xiang, W.; Wu, H.; Ouyang, S.; Zhou, B.; Zeng, Y.; Chen, Y.; Kuzyakov, Y. Tree Species Identity Surpasses Richness in Affecting Soil Microbial Richness and Community Composition in Subtropical Forests. Soil Biol. Biochem. 2019, 130, 113–121. [Google Scholar] [CrossRef]
  29. Qiu, H.; Ge, T.; Liu, J.; Chen, X.; Hu, Y.; Wu, J.; Su, Y.; Kuzyakov, Y. Effects of Biotic and Abiotic Factors on Soil Organic Matter Mineralization: Experiments and Structural Modeling Analysis. Eur. J. Soil Biol. 2018, 84, 27–34. [Google Scholar] [CrossRef]
  30. Qiang, W.; He, L.; Zhang, Y.; Liu, B.; Liu, Y.; Liu, Q.; Pang, X. Aboveground Vegetation and Soil Physicochemical Properties Jointly Drive the Shift of Soil Microbial Community during Subalpine Secondary Succession in Southwest China. Catena 2021, 202, 105251. [Google Scholar] [CrossRef]
  31. Cantón, Y.; Del Barrio, G.; Solé-Benet, A.; Lázaro, R. Topographic Controls on the Spatial Distribution of Ground Cover in the Tabernas Badlands of SE Spain. Catena 2004, 55, 341–365. [Google Scholar] [CrossRef]
  32. Lexer, M.J.; Bugmann, H. Mountain Forest Management in a Changing World. Eur. J. For. Res. 2017, 136, 981–982. [Google Scholar] [CrossRef] [Green Version]
  33. Wu, J.; Anderson, B.J.; Buckley, H.L.; Lewis, G.; Lear, G. Aspect Has a Greater Impact on Alpine Soil Bacterial Community Structure than Elevation. FEMS Microbiol. Ecol. 2017, 93, fiw253. [Google Scholar] [CrossRef] [PubMed] [Green Version]
  34. Chai, Y.; Jiang, S.; Guo, W.; Qin, M.; Pan, J.; Bahadur, A.; Shi, G.; Luo, J.; Jin, Z.; Liu, Y.; et al. The Effect of Slope Aspect on the Phylogenetic Structure of Arbuscular Mycorrhizal Fungal Communities in an Alpine Ecosystem. Soil Biol. Biochem. 2018, 126, 103–113. [Google Scholar] [CrossRef]
  35. Liu, Y.; Zhang, L.; Lu, J.; Chen, W.; Wei, G.; Lin, Y. Topography Affects the Soil Conditions and Bacterial Communities along a Restoration Gradient on Loess-Plateau. Appl. Soil Ecol. 2020, 150, 103471. [Google Scholar] [CrossRef]
  36. Chu, H.; Xiang, X.; Yang, J.; Adams, J.M.; Zhang, K.; Li, Y.; Shi, Y. Effects of Slope Aspects on Soil Bacterial and Arbuscular Fungal Communities in a Boreal Forest in China. Pedosphere 2016, 26, 226–234. [Google Scholar] [CrossRef]
  37. Måren, I.E.; Karki, S.; Prajapati, C.; Yadav, R.K.; Shrestha, B.B. Facing North or South: Does Slope Aspect Impact Forest Stand Characteristics and Soil Properties in a Semiarid Trans-Himalayan Valley? J. Arid Environ. 2015, 121, 112–123. [Google Scholar] [CrossRef] [Green Version]
  38. Mitchell, R.J.; Hester, A.J.; Campbell, C.D.; Chapman, S.J.; Cameron, C.M.; Hewison, R.L.; Potts, J.M. Explaining the Variation in the Soil Microbial Community: Do Vegetation Composition and Soil Chemistry Explain the Same or Different Parts of the Microbial Variation? Plant Soil 2012, 351, 355–362. [Google Scholar] [CrossRef]
  39. Gilliam, F.S.; Hédl, R.; Chudomelová, M.; McCulley, R.L.; Nelson, J.A. Variation in Vegetation and Microbial Linkages with Slope Aspect in a Montane Temperate Hardwood Forest. Ecosphere 2014, 5, 1–17. [Google Scholar] [CrossRef]
  40. Bennie, J.; Hill, M.O.; Baxter, R.; Huntley, B. Influence of Slope and Aspect on Long-Term Vegetation Change in British Chalk Grasslands. J. Ecol. 2006, 94, 355–368. [Google Scholar] [CrossRef]
  41. Åström, M.; Dynesius, M.; Hylander, K.; Nilsson, C. Slope Aspect Modifies Community Responses to Clear-Cutting in Boreal Forests. Ecology 2007, 88, 749–758. [Google Scholar] [CrossRef] [PubMed] [Green Version]
  42. Nadal-Romero, E.; Petrlic, K.; Verachtert, E.; Bochet, E.; Poesen, J. Effects of Slope Angle and Aspect on Plant Cover and Species Richness in a Humid Mediterranean Badland. Earth Surf. Process. Landf. 2014, 39, 1705–1716. [Google Scholar] [CrossRef]
  43. Liu, M.; Zheng, R.; Bai, S.; Bai, Y.; Wang, J. Slope Aspect Influences Arbuscular Mycorrhizal Fungus Communities in Arid Ecosystems of the Daqingshan Mountains, Inner Mongolia, North China. Mycorrhiza 2017, 27, 189–200. [Google Scholar] [CrossRef]
  44. Myers, N.; Mittermeier, R.A.; Mittermeier, C.G.; da Fonseca, G.A.B.; Kent, J. Biodiversity Hotspots for Conservation Priorities. Nature 2000, 403, 853–858. [Google Scholar] [CrossRef]
  45. Liu, Q. Ecological Research on Subalpine Coniferous Forests in China; Sichuan University Press: Chengdu, China, 2002. [Google Scholar]
  46. Xie, L.; Yin, C. Seasonal Variations of Soil Fungal Diversity and Communities in Subalpine Coniferous and Broadleaved Forests. Sci. Total Environ. 2022, 846, 157409. [Google Scholar] [CrossRef]
  47. Taylor, A.H.; Zisheng, Q.; Jie, L. Structure and Dynamics of Subalpine Forests in the Wang Lang Natural Reserve, Sichuan, China. Vegetatio 1996, 124, 25–38. [Google Scholar] [CrossRef]
  48. Xiong, X.; Zhu, J.; Li, S.; Fan, F.; Cai, Q.; Ma, S.; Su, H.; Ji, C.; Tang, Z.; Fang, J. Aboveground Biomass and Its Biotic and Abiotic Modulators of a Main Food Bamboo of the Giant Panda in a Subalpine Spruce-Fir Forest in Southwestern China. J. Plant Ecol. 2022, 15, 1–12. [Google Scholar] [CrossRef]
  49. Condit, R. Tropical Forest Census Plots: Methods and Results from Barro Colorado Island, Panama and a Comparison with Other Plots; Springer: Berlin, Germany, 1998. [Google Scholar]
  50. Lu, R.K. Soil and Agricultural Chemistry Analysis Method; China Agriculture Science and Technology Press: Beijing, China, 2002. [Google Scholar]
  51. Peng, X.; Wang, W. Stoichiometry of Soil Extracellular Enzyme Activity along a Climatic Transect in Temperate Grasslands of Northern China. Soil Biol. Biochem. 2016, 98, 74–84. [Google Scholar] [CrossRef]
  52. Hu, L.; Xiang, Z.; Wang, G.; Rafique, R.; Liu, W.; Wang, C. Changes in Soil Physicochemical and Microbial Properties along Elevation Gradients in Two Forest Soils. Scand. J. For. Res. 2016, 31, 242–253. [Google Scholar] [CrossRef]
  53. Li, Y.C.; Li, Z.; Li, Z.W.; Jiang, Y.H.; Weng, B.Q.; Lin, W.X. Variations of Rhizosphere Bacterial Communities in Tea (Camellia sinensis L.) Continuous Cropping Soil by High-Throughput Pyrosequencing Approach. J. Appl. Microbiol. 2016, 121, 787–799. [Google Scholar] [CrossRef]
  54. Landlinger, C.; Bašková, L.; Preuner, S.; Willinger, B.; Buchta, V.; Lion, T. Identification of Fungal Species by Fragment Length Analysis of the Internally Transcribed Spacer 2 Region. Eur. J. Clin. Microbiol. Infect. Dis. 2009, 28, 613–622. [Google Scholar] [CrossRef] [PubMed]
  55. Bolyen, E.; Rideout, J.R.; Dillon, M.R.; Bokulich, N.A.; Abnet, C.C.; Al-Ghalith, G.A.; Alexander, H.; Alm, E.J.; Arumugam, M.; Asnicar, F.; et al. Reproducible, Interactive, Scalable and Extensible Microbiome Data Science Using QIIME 2. Nat. Biotechnol. 2019, 37, 852–857. [Google Scholar] [CrossRef] [PubMed]
  56. Martin, M. Cutadapt Removes Adapter Sequences from High-Throughput Sequencing Reads. EMBnet. J. 2011, 17, 10. [Google Scholar] [CrossRef]
  57. Callahan, B.J.; McMurdie, P.J.; Rosen, M.J.; Han, A.W.; Johnson, A.J.A.; Holmes, S.P. DADA2: High-Resolution Sample Inference from Illumina Amplicon Data. Nat. Methods 2016, 13, 581–583. [Google Scholar] [CrossRef] [Green Version]
  58. Katoh, K.; Misawa, K.; Kuma, K.I.; Miyata, T. MAFFT: A Novel Method for Rapid Multiple Sequence Alignment Based on Fast Fourier Transform. Nucleic Acids Res. 2002, 30, 3059–3066. [Google Scholar] [CrossRef] [Green Version]
  59. Price, M.N.; Dehal, P.S.; Arkin, A.P. Fasttree: Computing Large Minimum Evolution Trees with Profiles Instead of a Distance Matrix. Mol. Biol. Evol. 2009, 26, 1641–1650. [Google Scholar] [CrossRef]
  60. Bokulich, N.A.; Kaehler, B.D.; Rideout, J.R.; Dillon, M.; Bolyen, E.; Knight, R.; Huttley, G.A.; Gregory Caporaso, J. Optimizing Taxonomic Classification of Marker-Gene Amplicon Sequences with QIIME 2’s Q2-Feature-Classifier Plugin. Microbiome 2018, 6, 90. [Google Scholar] [CrossRef]
  61. Kõljalg, U.; Nilsson, R.H.; Abarenkov, K.; Tedersoo, L.; Taylor, A.F.S.; Bahram, M.; Bates, S.T.; Bruns, T.D.; Bengtsson-Palme, J.; Callaghan, T.M.; et al. Towards a Unified Paradigm for Sequence-Based Identification of Fungi. Mol. Ecol. 2013, 22, 5271–5277. [Google Scholar] [CrossRef] [PubMed] [Green Version]
  62. R Core Team. R: A Language and Environment for Statistical Computing; R Foundation for Statistical Computing: Vienna, Austria, 2020. [Google Scholar]
  63. Xue, R.; Yang, Q.; Miao, F.; Wang, X.; Shen, Y. Slope Aspect Influences Plant Biomass, Soil Properties and Microbial Composition in Alpine Meadow on the Qinghai-Tibetan Plateau. J. Soil Sci. Plant Nutr. 2018, 18, 1–12. [Google Scholar] [CrossRef] [Green Version]
  64. He, X.; Zhou, J.; Wu, Y.; Bing, H.; Sun, H.; Wang, J. Leaching Disturbed the Altitudinal Distribution of Soil Organic Phosphorus in Subalpine Coniferous Forests on Mt. Gongga, SW China. Geoderma 2018, 326, 144–155. [Google Scholar] [CrossRef]
  65. Liu, B.; Biswas, S.R.; Yang, J.; Liu, Z.; He, H.S.; Liang, Y.; Lau, M.K.; Fang, Y.; Han, S. Strong Influences of Stand Age and Topography on Post-Fire Understory Recovery in a Chinese Boreal Forest. For. Ecol. Manag. 2020, 473, 118307. [Google Scholar] [CrossRef]
  66. Carletti, P.; Vandramin, E.; Pizzeghello, D.; Concheri, G.; Zenella, A.; Nardi, S.; Squartini, A. Soil Humic Compounds and Microbial Communities in Six Spruce Forests as Function of Parent Material, Slope Aspect and Stand Age. Plant Soil 2009, 315, 47–65. [Google Scholar] [CrossRef]
  67. Geisen, S. The Bacterial-Fungal Energy Channel Concept Challenged by Enormous Functional Versatility of Soil Protists. Soil Biol. Biochem. 2016, 102, 22–25. [Google Scholar] [CrossRef]
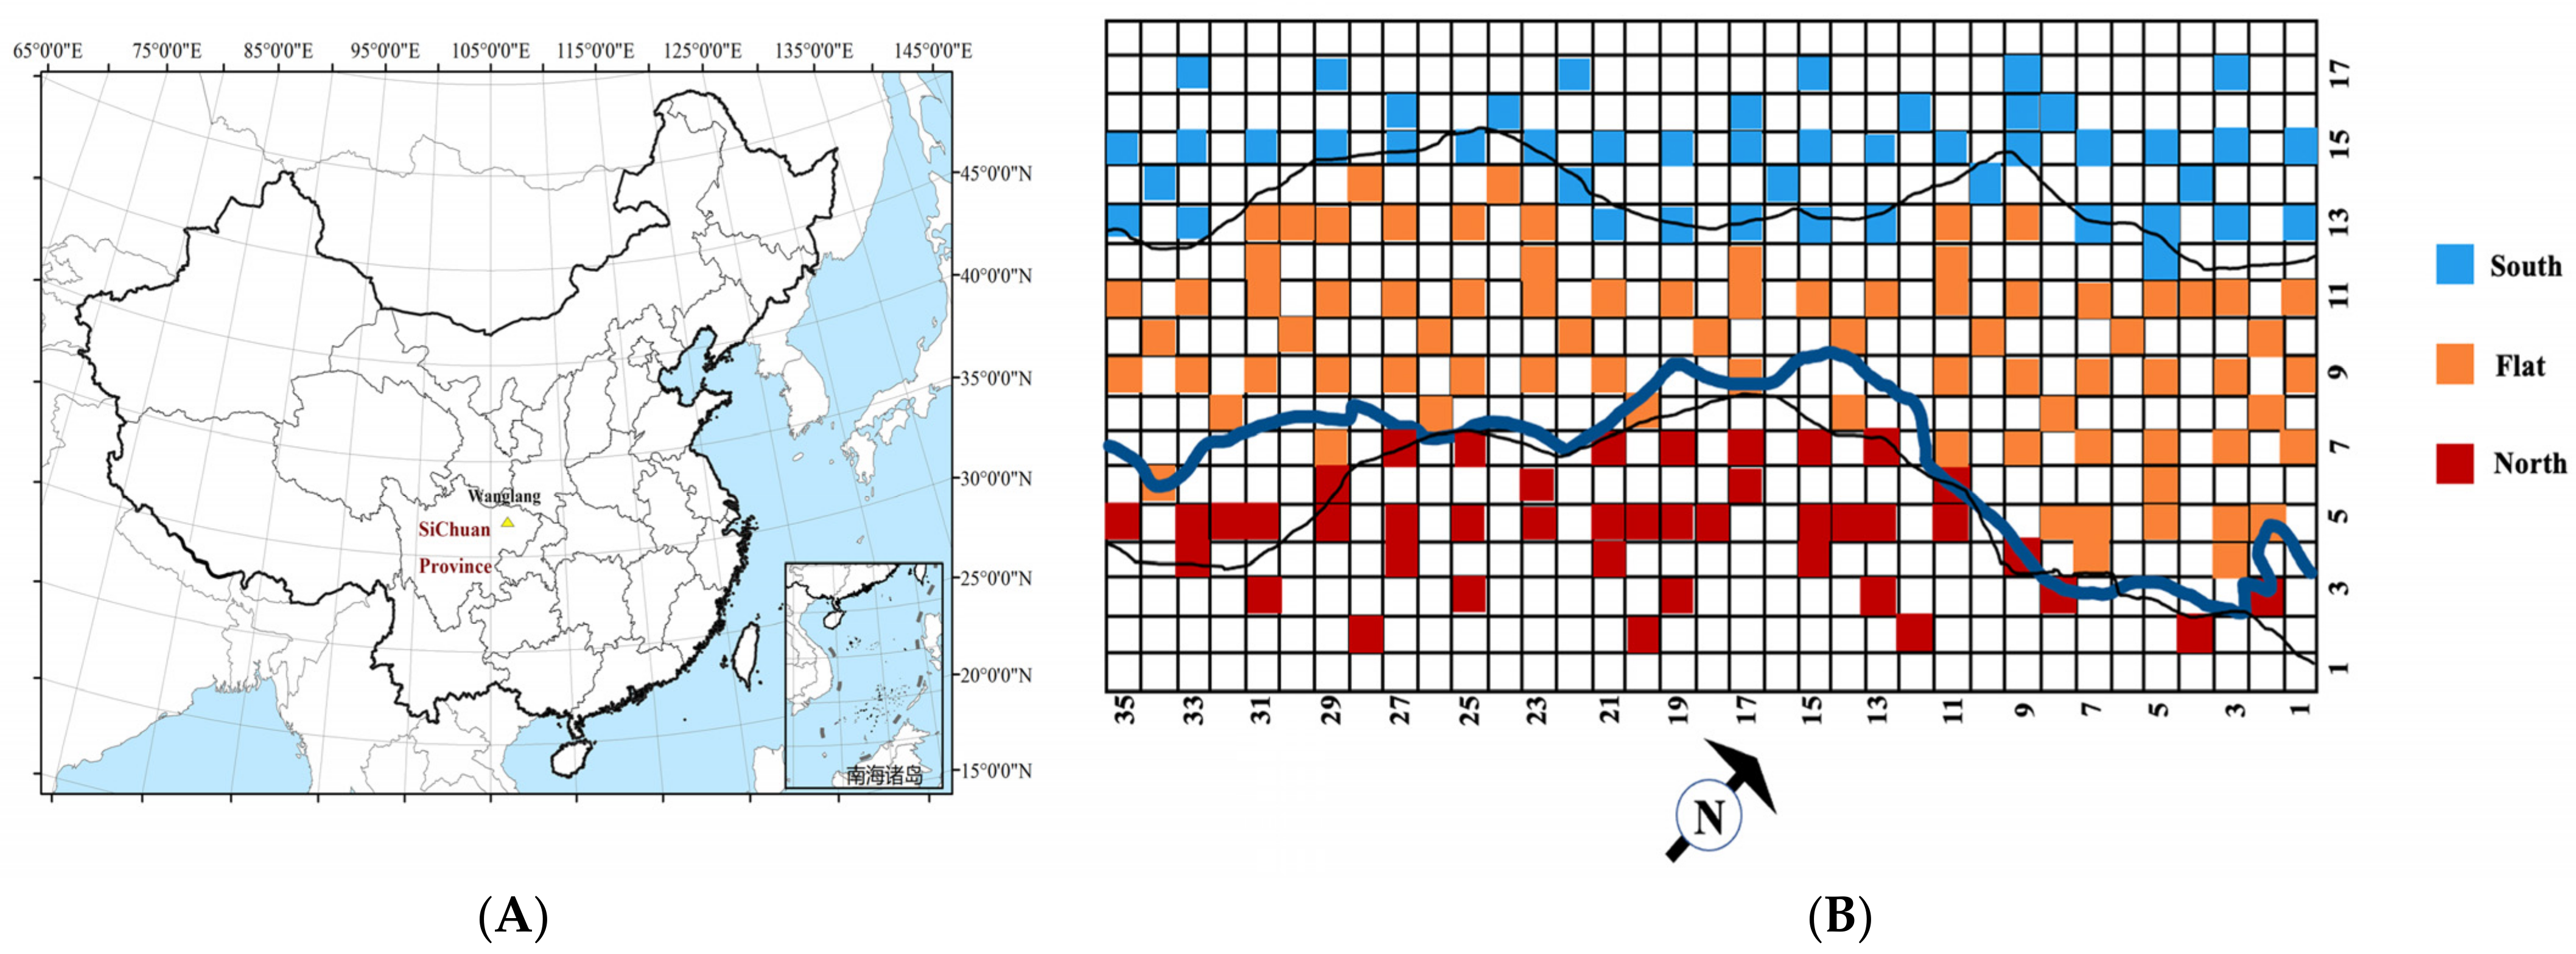
Figure 1. Geographical location of study area (A) and the distribution of sampling quadrats (B). The Wanglang Plot is shown by a red dot (A). This is rectangular with total area of 25.2 ha (B), which is equally and longitudinally divided into 18 rows (here shown as lines) and transversely divided into 35 rows (here shown as rows) to form 630 quadrats of 20 m2 × 20 m2. The distribution of sampling quadrats in the three sites is marked in different colors, where south-facing slope, flat site and north-facing slope is blue, orange and red, respectively (B), where n = 42, 81, and 47 represent north-facing slope, flat site, and south-facing slope, respectively.
Forests 14 01389 g001
Figure 2. Characteristics of aboveground plant community on different slope aspects. (A) plant species richness, (B) total basal area, (C) Shannon index, (D) Simpson index, and (E) PCA analysis of plant species. The asterisks denote significant differences among three slope aspects. The similarities in community structure among three slope groups were tested by analysis of similarities (ANOSIM), and the pairwise differences were tested by pairwise PERMANOVA/adonis, n (NS) = 42, n (Flat) = 81, n (SS) = 47.
Forests 14 01389 g002
Figure 3. Diversity of soil microbial community on different slope aspects. Chao1 index, Shannon index and Simpson index of bacteria (AC) and fungi (DF). The asterisks denote significant differences among three slope aspects, n (NS) = 42, n (Flat) = 81, n (SS) = 47.
Forests 14 01389 g003
Figure 4. PCoA analysis of bacterial (A) and fungal (B) community structure. The similarities in community structure among three slope groups were tested by analysis of similarities (ANOSIM), and the pairwise differences were tested by pairwise PERMANOVA/adonis, n (NS) = 42, n (Flat) = 81, n (SS) = 47.
Forests 14 01389 g004
Figure 5. Relative abundance of soil bacterial ((A), Top10) and fungal ((B), Top5) at the phylum level on different slope aspects. ‘Others’ in bacteria (A) include phyla with <0.05% average relative abundance, while in fungi (B) is assigned to undetermined taxa (also referring to Figure S1).
Forests 14 01389 g005
Figure 6. Redundancy analysis of plant (A), soil bacterial (C) and soil fungal (E) community composition at the species and phylum level with aboveground plant community diversity, belowground microbial community diversity and soil properties across slope aspects. The correlation of each factor with community composition of plant (B), soil bacterial (D) and soil fungi (F) were tested by the Mantel test (*, p < 0.05).
Forests 14 01389 g006
Figure 7. Correlation of plant richness (AD), aboveground total basal area (m2 ha−1) (EH) with microbial community richness and diversity. Colors within each panel represent the slope aspects: north slope (red), flat slope (orange), south slope (blue), and all groups combined (black). Shaded areas represent 95% confidence intervals for predictions from a linear model. Only significant regressions are shown (*, p < 0.05; **, p < 0.01; ***, p < 0.001).
Forests 14 01389 g007
Figure 8. Correlation of plant richness (A,B), aboveground total basal area (m2 ha−1) (C,D), and plant community structure (E,F) with microbial community structure. The plant community structure was indicated by the PC1 axes of plant species, and the microbial community structure was indicated by the PCoA1 axes of bacteria and fungi. Colors within each panel represent the slope aspects: north slope (red), flat slope (orange), south slope (blue), and all groups combined (black). Shaded areas represent 95% confidence intervals for predictions from a linear model. Only significant regressions are shown (*, p < 0.05; **, p < 0.01; ***, p < 0.001).
Forests 14 01389 g008
Figure 9. Structural equation model (SEM) of the relationship among slope, soil properties, plant community, plant productivity and soil microbial community. The black line indicated a positive correlation between two variables, and a red line indicated a negative correlation between the two variables. The solid line is a significant correlation, and the dashed line is an insignificant relationship. The coefficient of determination (R2) is shown for each variable and path coefficient is showed on arrow(s) between two variables. Significance levels are noted by asterisks (*, p < 0.05; **, p < 0.01; ***, p < 0.001).
Forests 14 01389 g009
Table 1. Basic information of soil properties in the three sampled sites. Data were mean ± SE (n = 42, 81, and 47 for north-facing slope, flat site and south-facing slope, respectively), statistical analysis and LSD multiple comparisons were performed by ANOVA, and different letters indicated significant differences (p < 0.05).
VariableNorth-Facing SlopeFlat SiteSouth-Facing SlopeTotal
Soil pH6.67 ± 0.67 a7.36 ± 0.5 c7.00 ± 0.49 b6.99 ± 0.05
Soil water content (%)62.51 ± 0.07 c54.63 ± 0.11 a57.45 ± 0.04 b56.81 ± 0.01
Soil total P (g kg−1)1.07 ± 0.24 b0.69 ± 0.18 a1.00 ± 0.19 b0.87 ± 0.02
Soil-available P (mg g−1)28.57 ± 10.12 b18.17 ± 10.5 a28.24 ± 9.19 b23.52 ± 0.86
Soil total N (g kg−1)8.54 ± 2.37 b5.62 ± 2.48 a8.71 ± 2.04 b7.20 ± 0.21
Soil-available N (g kg−1)1.04 ± 0.26 b0.79 ± 0.35 a1.34 ± 0.39 c1.00 ± 0.03
Soil organic matter (g kg−1)222.14 ± 63.73 b155.16 ± 52.16 a238.09 ± 62.66 b194.64 ± 5.31
Disclaimer/Publisher’s Note: The statements, opinions and data contained in all publications are solely those of the individual author(s) and contributor(s) and not of MDPI and/or the editor(s). MDPI and/or the editor(s) disclaim responsibility for any injury to people or property resulting from any ideas, methods, instructions or products referred to in the content.