Article

Elevational Patterns of Tree Species Richness and Forest Biomass on Two Subtropical Mountains in China

1
Key Laboratory for Earth Surface Processes of the Ministry of Education, Institute of Ecology, College of Urban and Environmental Sciences, Peking University, Beijing 100871, China
2
School of Ecology and Environmental Science, Yunnan University, Kunming 650500, China
3
State Key Laboratory of Grassland Agro-Ecosystems, College of Pastoral Agricultural Science and Technology, Lanzhou University, Lanzhou 730030, China
4
State Key Laboratory of Vegetation and Environmental Change, Institute of Botany, Chinese Academy of Sciences, Beijing 100093, China
*
Author to whom correspondence should be addressed.
Forests 2023, 14(7), 1337; https://doi.org/10.3390/f14071337
Submission received: 5 June 2023 / Revised: 25 June 2023 / Accepted: 27 June 2023 / Published: 29 June 2023
(This article belongs to the Special Issue Aboveground and Belowground Interaction and Forest Carbon Cycling)

Abstract

:
Increasing evidence shows that both abiotic and biotic factors affect species richness and stand biomass in forests, yet the relative and interactive impacts of these factors remain debated in different forest ecosystems. We sampled 55 forest plots (600 m2 per plot) on two subtropical mountains with distinct diversity levels in China to explore the elevational patterns of tree species richness and stand biomass and examined how they were affected by climate, stand structure, and dominance of mycorrhizal types. The tree species richness of both mountains decreased with elevation, while the stand biomass exhibited unimodal or no apparent trends. On both mountains, the tree species richness was strongly shaped by climatic factors, especially the mean annual temperature, whereas the stand biomass was mainly affected by the stand structure. Specifically, on the mountain with higher species richness, both the tree height variation and maximum tree size were strongly correlated with the stand biomass. Meanwhile, on the species-poor mountain with higher elevations, only the maximum tree size correlated with the stand biomass. The dominance of ectomycorrhizal trees also had positive effects on the stand biomass of both mountains. These results suggest that climate, stand structure, and mycorrhizal dominance may jointly drive the decoupling between tree species richness and stand biomass, which should be given more attention in further research and forest management to achieve the climate change mitigation goals.

1. Introduction

Forests play vital roles in biodiversity maintenance, carbon fixation, and climate change mitigation [1,2]. Species diversity has been found to facilitate ecosystem biomass (productivity) in natural forests, plantations, and manipulated biodiversity experiments [3,4,5,6]. However, discrepancies have been commonly observed in different forest types or at different spatial scales, given the complex interactive impacts of numerous biotic and abiotic factors on species diversity and stand biomass, respectively [6,7,8,9,10]. Thus, exploring the underlying drivers of forest biodiversity and biomass still remains a key issue in ecological research.
Climatic factors, especially temperature and precipitation, have been well recognized as key drivers of species richness across wide spatial gradients [11,12,13,14], while their impacts on forest biomass may vary depending on the climatic region or forest type [15,16,17,18]. In addition to the direct effects due to increased energy input or water availability, the climate could also indirectly modulate species richness and biomass through other factors, such as soil properties, stand structures, and mycorrhizal associations [8,10,19]. In recent decades, attention has been paid to the roles of aboveground stand structures [7,20,21,22] and belowground mycorrhizal associations [6,10,23,24] in shaping species diversity and stand biomass, as well as their relationship. However, few studies have considered the aboveground and belowground biotic interactions as well as climate simultaneously, which can help us better understand the mechanisms underpinning species diversity and biomass patterns.
It is well recognized that the intra- and interspecific interactions of trees affect species richness and biomass [7,25,26]. Stand structures, reflecting the horizontal and vertical arrangements of a plant community, are often used as indicators of intra- and interspecific interactions. Stand structural attributes, especially tree size heterogeneity, could lead to the optimal use of light, nutrients, and space in the community through niche complementarity and facilitation, thus enabling the coexistence of more species and higher biomass/productivity [25,26]. Although positive stem density–species richness and maximum individual size–biomass relationships have been observed in different studies [17,27,28], the dominant structural attributes may depend on the forest type or spatial scale [20].
There are four main types of mycorrhizae, namely arbuscular mycorrhizae (AM), ectomycorrhizae (EcM), ericoid mycorrhizae (ErM), and orchid mycorrhizae (OM), of which AM and EcM are the most widespread and ErM are restricted to Ericacea plants, especially in regions of high elevation or latitude [29,30]. Increasing evidence has shown that plant root–soil fungi symbioses, namely mycorrhizae, play crucial roles in plant community composition and ecosystem functioning [29,31]. Mycorrhizae link the aboveground plant community and belowground microbial communities by nutrient exchange and signal transfer [29,31]. Different mycorrhizal types vary in their nutrient acquisition strategies, maintenance costs, and capacity to protect plants against soil-borne pathogens [6,24,29,32], and therefore, their ability to modulate the species richness and biomass of a certain community.
Elevational transects have been often used as useful models to study large-scale patterns of ecosystem processes and the underpinning drivers because they compress remarkable environmental gradients, especially climate conditions, into relatively short distances [9,33,34]. In this study, we investigated 55 forest plots (600 m2 per plot) along the elevational transects on two typical mountains in subtropical China and explored the elevational patterns of tree species richness and biomass, as well as the possible drivers. To observe more universal patterns, the two elevational transects were selected as they differed in the locations, ranges of elevation, and temperature, as well as in species richness levels. We aimed to elucidate (1) how tree species richness and stand biomass vary along the elevational gradients, and (2) how climate, stand structure, and mycorrhizal dominance affect tree species richness and biomass.

2. Materials and Methods

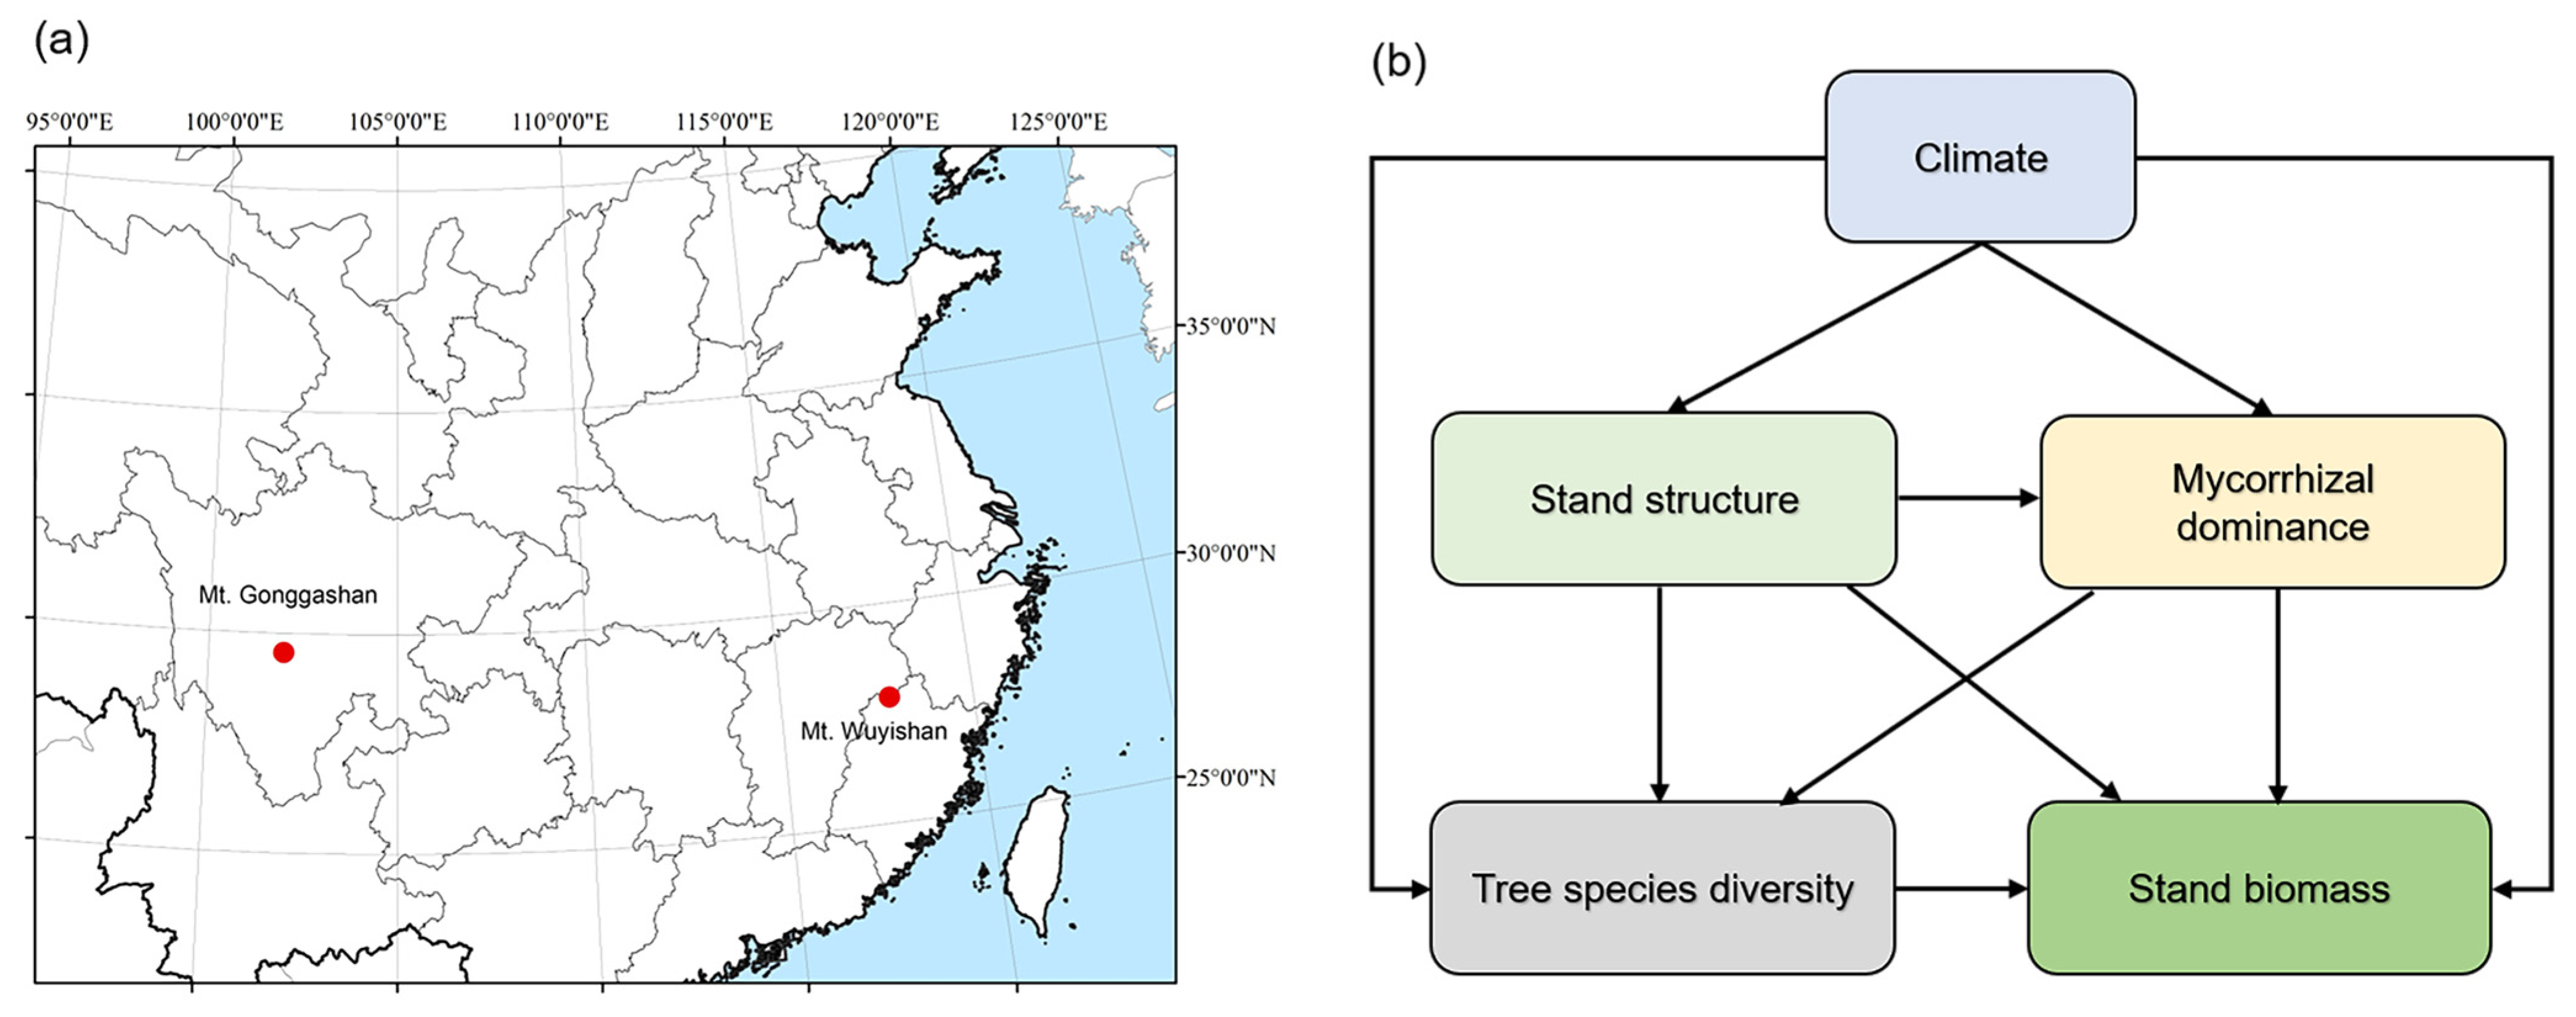
2.1. Study Sites and Field Sampling

We investigated the species composition, forest structure, and biomass along the elevational transects on Mount (hereafter Mt.) Wuyishan (117°27′–117°51′ E, 27°33′–27°54′ N, the highest peak reaching 2158 m, Fujian Province) and Mt. Gonggashan (101°30’–102°15′ E, 29°20′–30°20′ N, the highest peak reaching 7556 m, and the tree line at around 3600 m, Sichuan Province) in south China (Figure 1) in the growing seasons of 2018 and 2019. On Mt. Wuyishan, we set up 28 forest plots with a size of 600 m2 at around 50 m intervals along the elevational gradient from 573 m to 2070 m, covering the typical vegetation types, namely evergreen broadleaf forests at low elevations to coniferous and broadleaf mixed forests, and coniferous forests at high elevations. Accordingly, the dominant trees included Castanopsis eyrie, Phyllostachys edulis, Alniphyllum fortune, Pinus massonian, Castanopsis faberi, hododendron latoucheae, Schima superba, Pinus taiwanensis, etc. On Mt. Gonggashan, we set up 27 forest plots (600 m2 per plot) at an elevational interval of approximately 50 m from 2445 m to 3736 m. The vegetation types were mainly coniferous and broadleaf mixed forests, and coniferous forests. The dominant species included Picea brachytyla, Abies fabri, Sorbus prattii, Rhododendron przewalskii, etc.
In each plot, we recorded the site information, including the latitude, longitude, elevation, slope, and aspect, and the species name, diameter at breast height (DBH), and tree height for all living trees with a DBH ≥ 3 cm.

2.2. Species Richness, Biomass, and Stand Structural Variables

We defined tree species richness as the count of tree species per plot. We used allometric equations for different tree species in nearby regions to estimate the above- and belowground biomass of the recorded trees [35]. Only the tree layer was considered in the present study as it contributed the majority of the stand biomass in these mountains. We calculated the coefficient of variation of the DBH (cv_DBH) and height (cv_H) of the trees to stand for the structural diversity. We also defined the stem density as the number of trees (DBH ≥ 3 cm) per unit area and used the maximum DBH of each plot to represent the stand age [17,27] (Table 1).

2.3. Mycorrhizal Information

We assigned the mycorrhizal type (AM, EcM, ErM, or AM-EcM) of each tree species based on the FungalRoot database [36] and the public literature (Supplementary Table S1). For species with no records of mycorrhizal status, the mycorrhizal type was inferred from congeneric species. If a species was assigned to a mycorrhizal type of AM-EcM, then its biomass was allocated to the AM and EcM types equally [36]. In total, 270 species were recorded on the two mountains, including 178 AM, 52 EcM, 34 ErM, and 6 AM-EcM species (Supplementary Table S1).
We defined the dominance of trees of different mycorrhizal types as the proportion of the basal area. However, we only used EcM dominance in further analyses because AM dominance was highly negatively correlated with EcM dominance, whereas ErM dominance was relatively minor (averaging 8% on both mountains).

2.4. Climate Data

We calculated the mean annual temperature (MAT) and mean annual precipitation (MAP) based on the records of meteorological stations on the two mountains [37]. The meteorological stations were set at elevations of 1200 m on Mt. Wuyishan and 3000 m on Mt. Gonggashan. It is noteworthy that the precipitation followed different patterns on the two mountains. On Mt. Wuyishan, the MAP increased with the elevation and was highly negatively correlated with the MAT, while on Mt. Gonggashan, the MAP showed a unimodal elevational pattern and was not related to the MAT [37].

2.5. Statistical Analyses

We conducted general linear regressions and polynomial regressions to explore the elevational patterns of richness and biomass of all trees and of different mycorrhizal types on the two mountains. We then applied multiple linear regressions to compare the effect size of the different variables on the tree species richness and biomass based on the standardized coefficients. Thereafter, we selected variables based on the variance inflation factors (VIF < 5) and Pearson’s correlation coefficients (r < 0.65). As a result, the final model included climate (MAT, MAP), stand structure (cv_H, maximum DBH), and mycorrhizal dominance (EcM dominance). In further analyses, we did not retain the elevation on either mountain or the MAP on Mt. Wuyishan because of their close correlations with the MAT (r ≦ −0.97, p < 0.001). We also excluded the stem density considering its relatively minor impact. Finally, we applied hierarchical and variation partitioning analyses to compare the relative contributions of the different groups of variables using the R package ‘rdacca.hp’ [38]. Prior to the analyses, we used the Shapiro–Wilk normality test to check the normality of the response variables, and those that were non-normal were natural-logarithm-transformed. All variables were standardized before analyses, and the above analyses were conducted with R 3.6.2 [39].
We performed structural equation models (SEMs) with AMOS 21.0 (Amos Development Corporation, Chicago, IL, USA) to explore the relationships among the biomass, tree species richness, climate, stand structure, and ectomycorrhizal dominance. We used the chi-square (χ2) test, root mean square error of approximation (RMSEA), and goodness-of-fit index (GFI) to evaluate the goodness of fit of the SEMs. Generally, a model was acceptable when p > 0.05, RMSEA < 0.05, and GFI > 0.90 simultaneously.

3. Results

The tree species richness ranged from 5 to 33 and from 4 to 19 across the plots on Mt. Wuyishan and Mt. Gonggashan, respectively. AM and EcM trees accounted for 33.3 to 74.1% vs. 13.0 to 42.9% of the recorded tree species on Mt. Wuyishan, and from 20.0 to 84.6% vs. 10.0 to 33.3% of those on Mt. Gonggashan, respectively (Figure 2a,b). The biomass ranged from 110.0 to 436.7 Mg ha−1 and from 171.8 to 612.5 Mg ha−1 across the plots on Mt. Wuyishan and Mt. Gonggashan, with AM and EcM trees contributing from 4.4 to 70.9% vs. 29.0 to 95.6% and from 0.06 to 52.5% vs. 47.5 to 99.9%, respectively (Figure 2c,d).

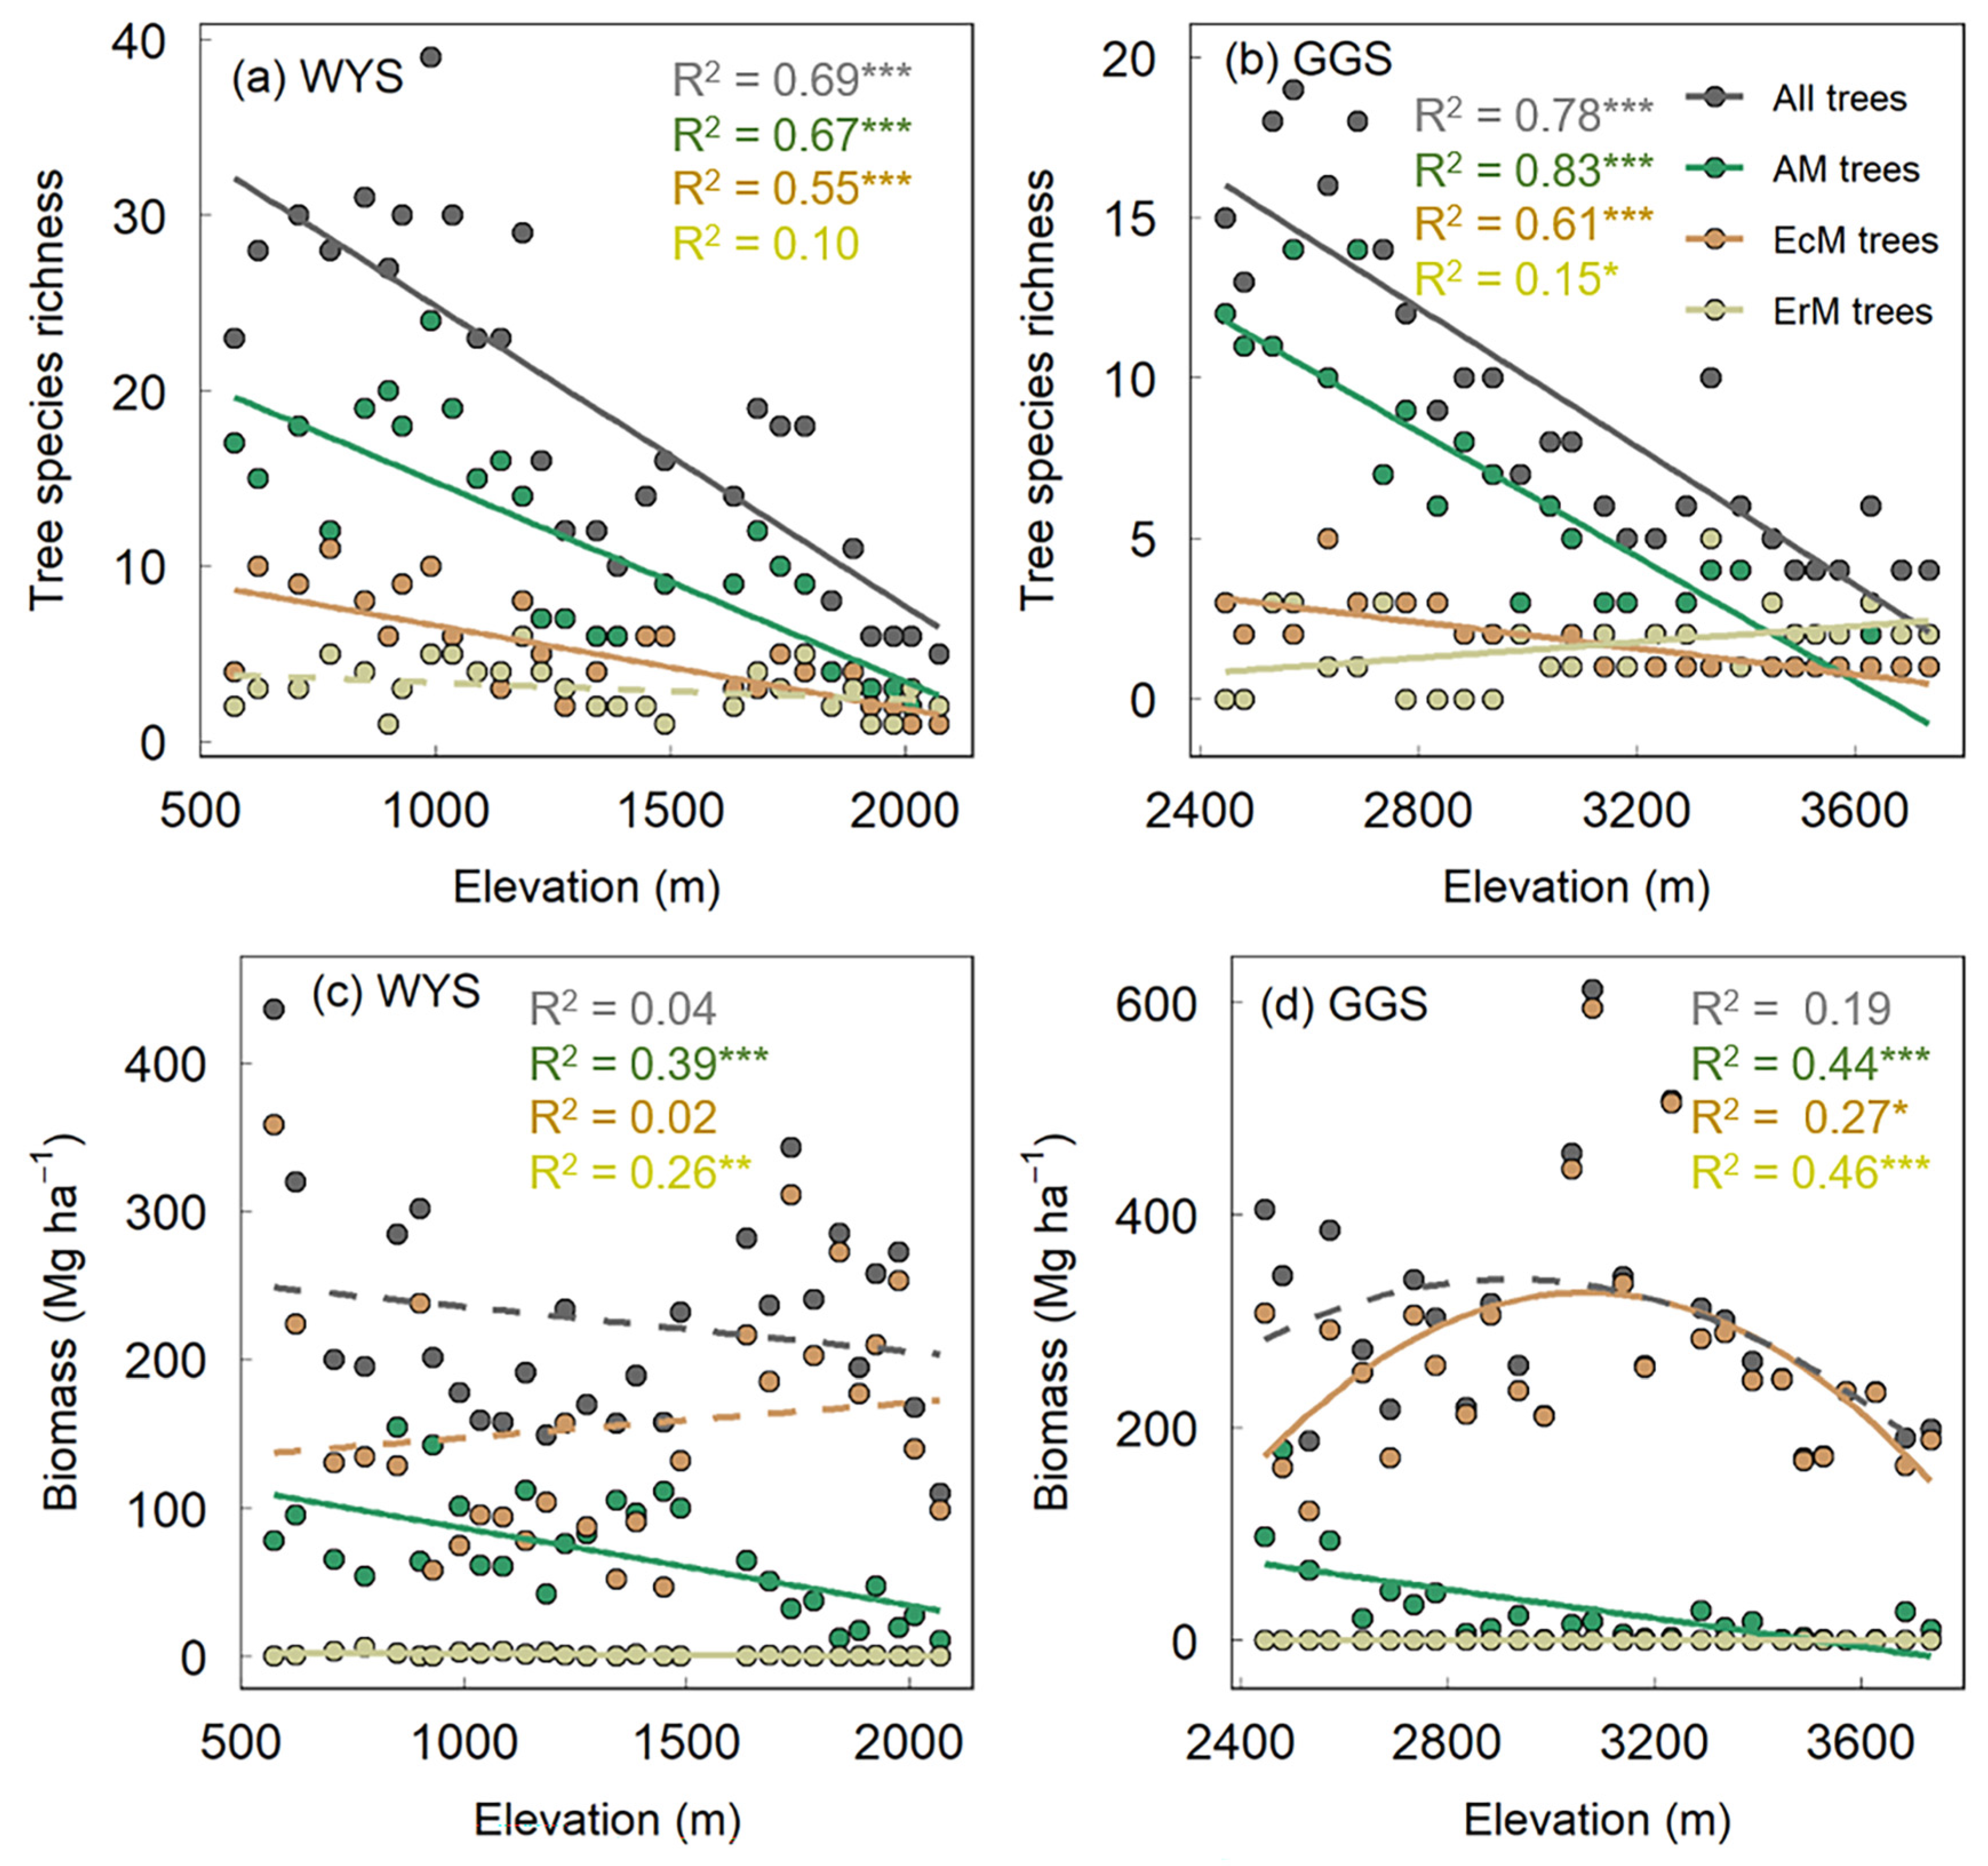
3.1. Elevational Patterns of Tree Species Richness and Biomass

The tree species richness and biomass showed different elevational patterns. On both mountains, the richness of all trees, AM trees, and EcM trees decreased consistently with increasing elevation (Figure 2a,b). The richness of the ErM trees increased with the elevation on Mt. Gonggashan, while they showed no significant pattern on Mt. Wuyishan (Figure 2a,b). The biomass of the EcM trees was highly correlated with that of all trees (R2 = 0.78–0.86, p < 0.001) on both mountains, and exhibited unimodal patterns on Mt. Gonggashan (p = 0.08 for biomass of all trees) but no significant pattern on Mt. Wuyishan. The biomass of the AM trees decreased, while that of the ErM trees increased with the elevation on both mountains (Figure 2c,d).

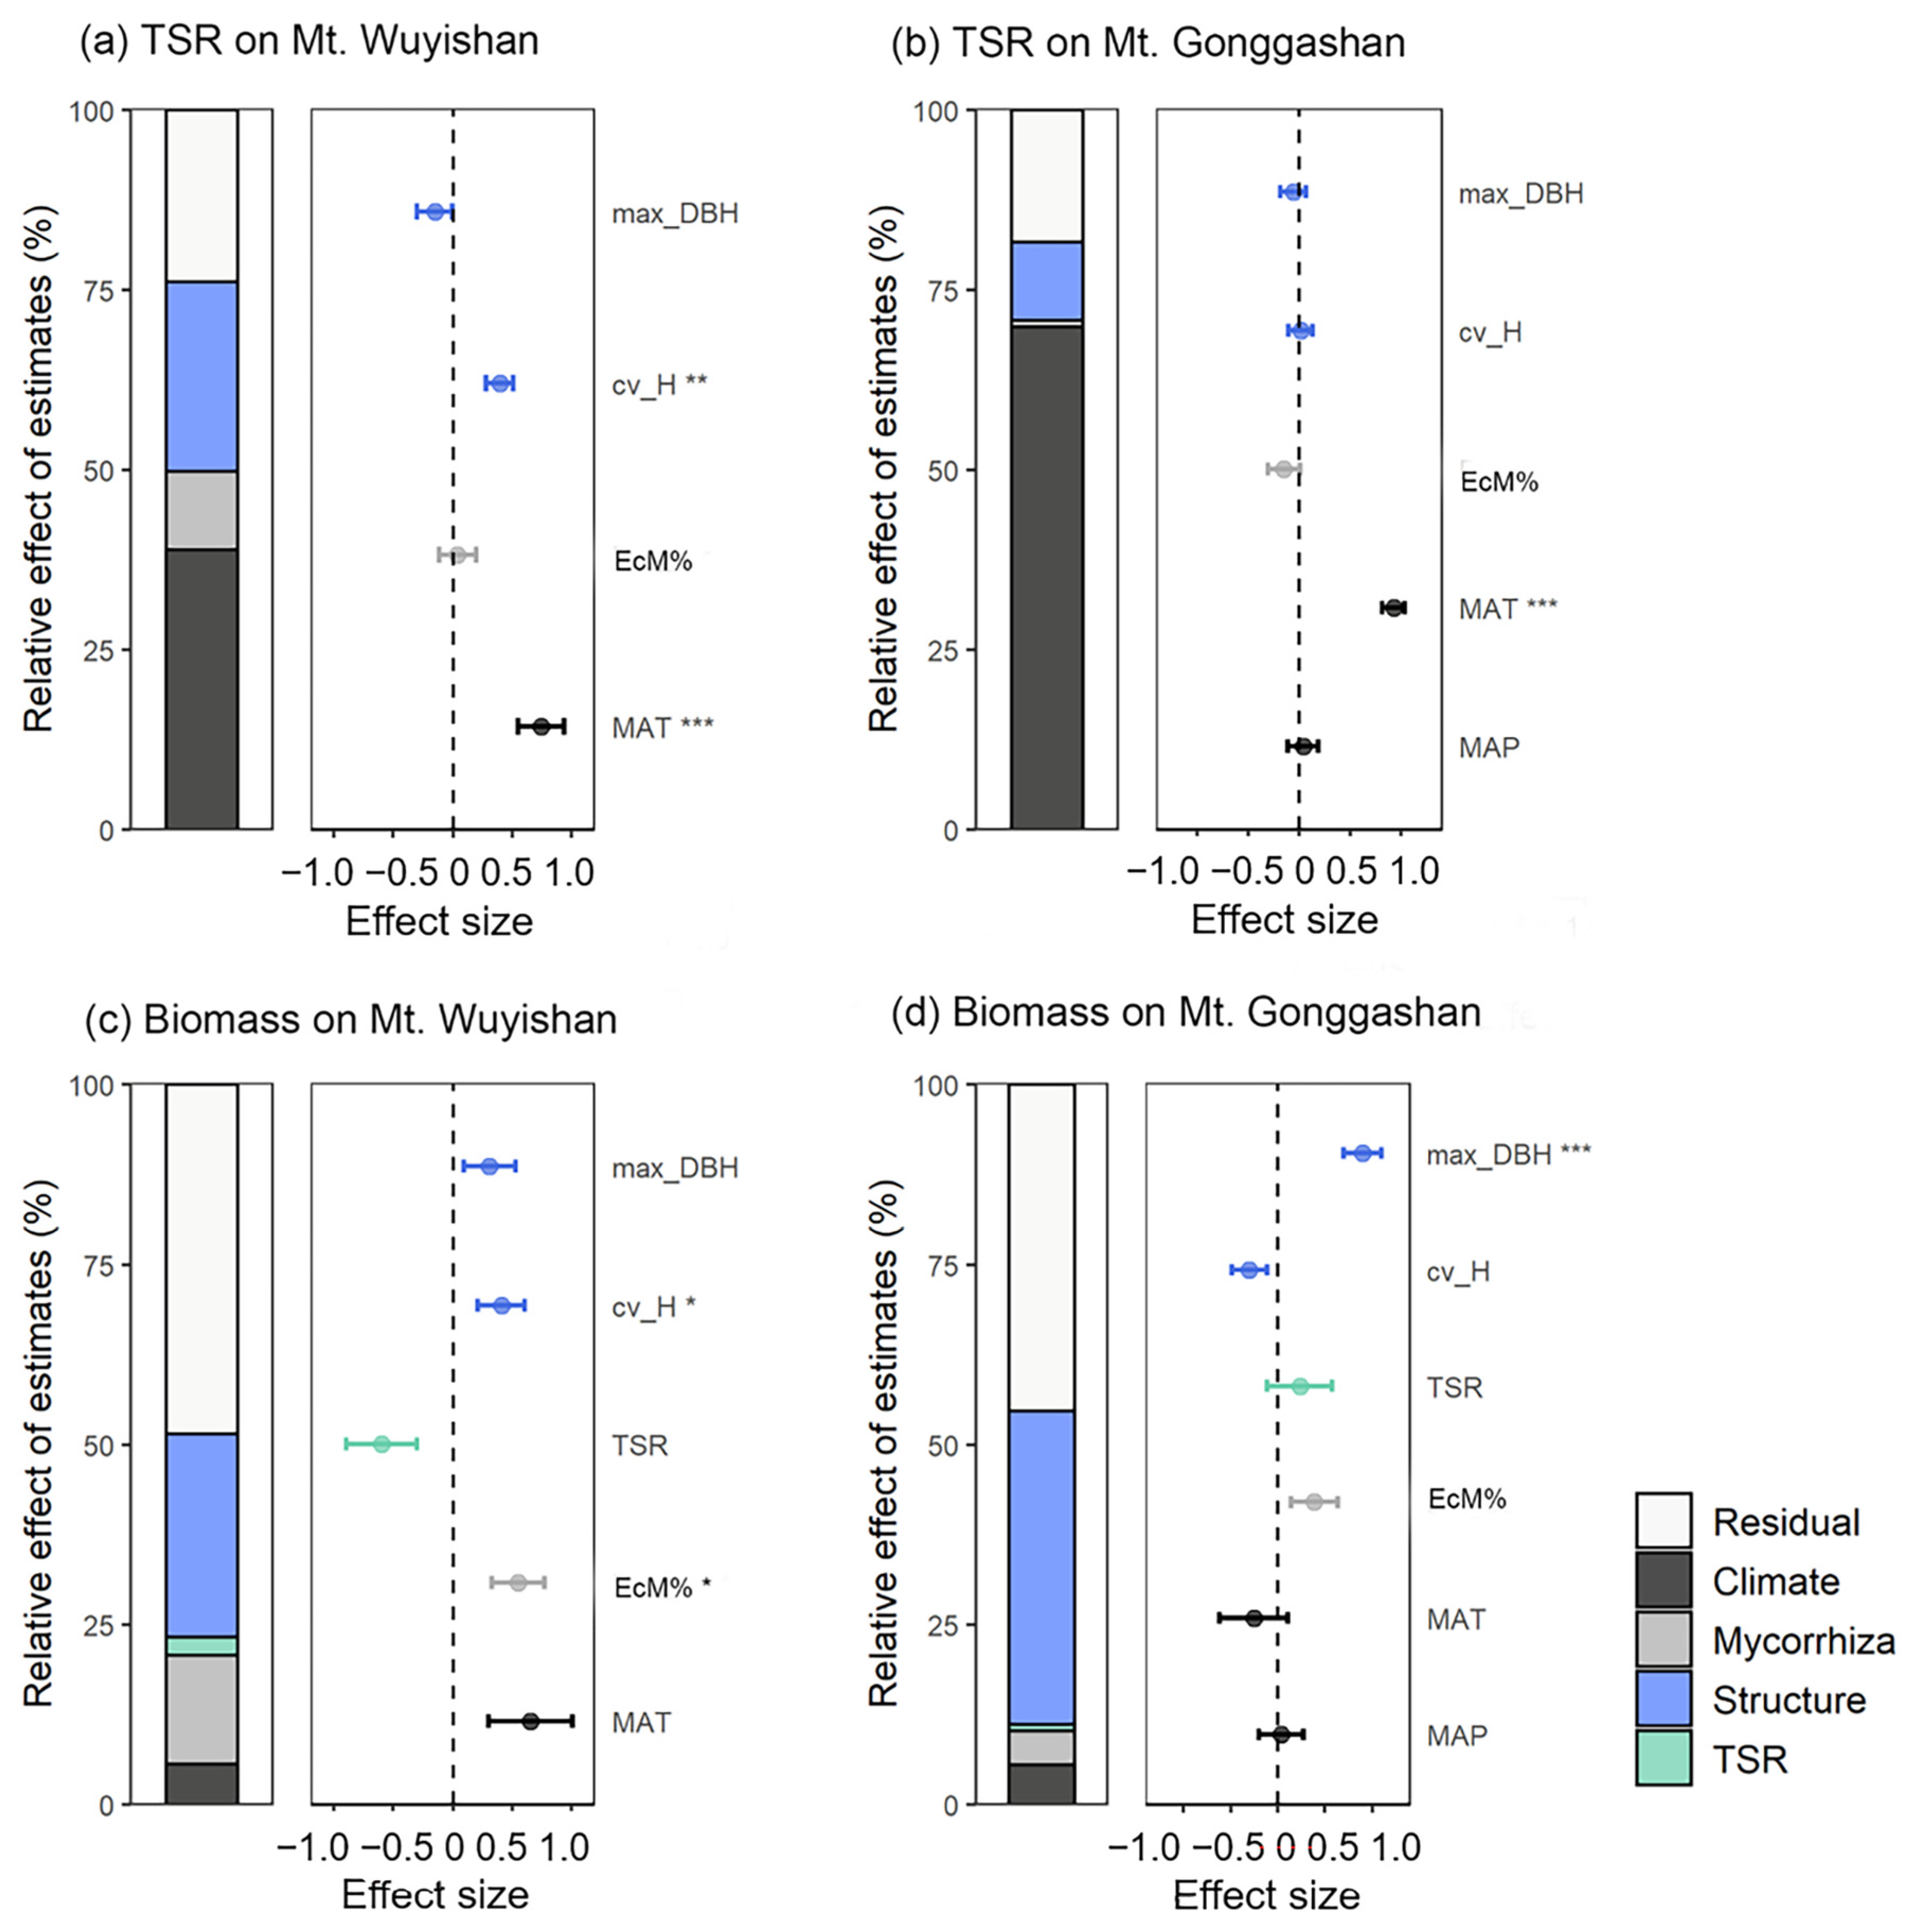
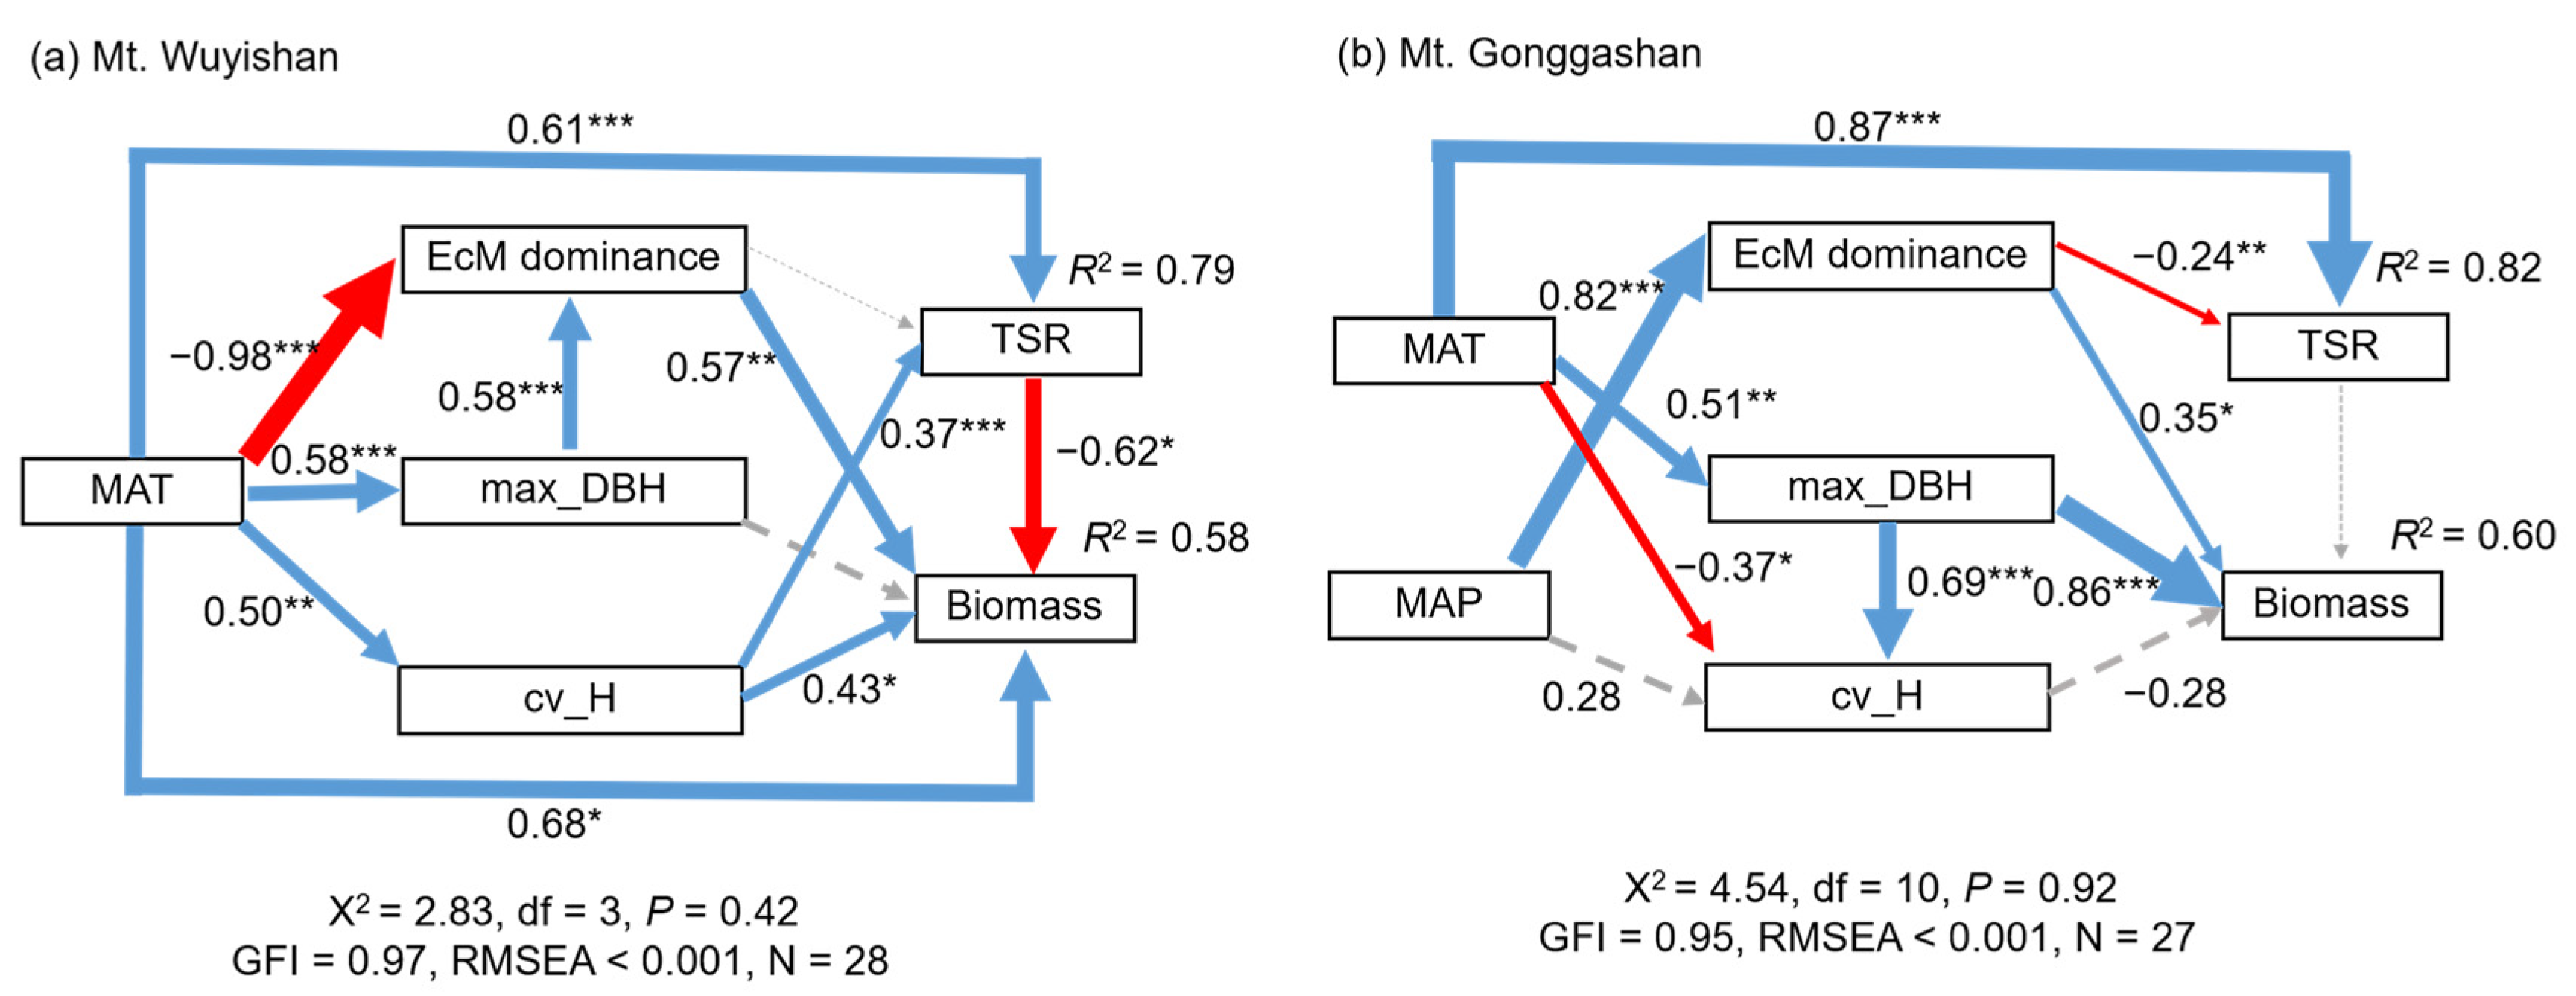
3.2. Possible Drivers of Tree Species Richness and Biomass

The selected variables, namely the climate, stand structure, and ectomycorrhizal dominance, explained 76.1% and 81.7% of the variance in the tree species richness on Mt. Wuyishan and Mt. Gonggashan, respectively. The climatic factors, especially the MAT, explained the majority of the variance, followed by the stand structure and mycorrhiza dominance (Figure 3a,b).
The four groups of variables explained 51.4% and 54.7% of the variance in the biomass on Mt. Wuyishan and Mt. Gonggashan, respectively. The stand structure explained most of the variance, followed by mycorrhizal dominance, climatic factors, and tree species richness (Figure 3c,d). Specifically, the dominance of EcM trees and the variation of the tree height affected the biomass positively on Mt. Wuyishan (Figure 3c), and the maximum DBH affected the biomass positively on Mt. Gonggashan (Figure 3d).
The SEM analyses showed that the MAT increased the tree species richness both directly and indirectly by promoting tree height variation on Mt. Wuyishan. The MAT directly promoted the biomass, and also indirectly through the tree species richness, EcM tree dominance, tree height variation, and maximum DBH (Table 2). In detail, the MAT weakened the positive effects of EcM tree dominance but strengthened the positive effects of the tree height variation and maximum DBH and the negative effects of the tree species richness on biomass (Figure 4a).
Similarly, the MAT increased the tree species richness directly and strengthened the positive effects of the maximum DBH on the biomass on Mt. Gonggashan. In addition, EcM tree dominance directly decreased the tree species richness while increasing the biomass, and such effects were strengthened by the increased MAP (Figure 4b).

4. Discussion

We observed different elevational patterns of tree species richness and stand biomass on both Mt. Wuyishan and Mt. Gonggashan. The decoupling between the tree species richness and the stand biomass might have resulted from the multivariate interactions among the climate, stand structure, and mycorrhiza dominance. On both mountains, the tree species richness was strongly influenced by the climate (mainly the MAT), while the stand biomass was more affected by the stand structure and EcM tree dominance.

4.1. Temperature Controls Tree Species Richness

On both mountains, the climatic factors, mainly the MAT, were consistently the main driver of the tree species richness (Figure 3 and Figure 4). As temperature generally decreases sharply with increasing elevation, the plots on both mountains covered a wide range of temperature gradients (6.4 and 8.6 °C, respectively). According to the ecological metabolism theory, higher temperatures provide more energy and increase metabolism rates, primary production, ecological interactions, and evolutionary processes (speciation rates), which favor the coexistence of more species [11,14,40,41]. A warmer climate also results in longer growing seasons for plants, which can benefit tree growth [9,23]. Therefore, temperature is a well-recognized key driver for the patterns of tree diversity on broad latitudinal and elevational scales [11,14,40]. Compared to the MAT, the impacts of the MAP on the tree species richness were relatively small and mainly indirect through mycorrhizal dominance (Figure 4b). This is possibly because both mountains have abundant precipitation (1894–2642 mm) across the elevational gradients. Thus, precipitation is not a limiting factor for the occurrence or growth of trees.
The stand structure or mycorrhizal dominance mediated the impacts of climate on the tree species richness, but their influence was relatively weak and site-specific (Figure 4). On Mt. Wuyishan, the tree height variation was significantly correlated with the tree species richness (Figure 3 and Figure 4), which has been extensively observed in previous studies [9,20,26]. According to the niche complementarity theory, higher structural diversity can create more niche space and promote the use efficiency of resources in a community, allowing more species to coexist [20].
On Mt. Gonggashan, the tree height variation had no significant impact on the tree species richness. Instead, EcM tree dominance had a negative effect on the tree species richness (Figure 4). However, AM tree dominance had a positive effect on the species richness. AM trees have been widely observed to contribute more to species diversity compared to EcM trees in different temperate and subtropical forests [6,42]. AM trees usually exhibit negative plant–soil feedback because they easily accumulate soil-borne pathogens at the seedling recruitment stages, and thus, generally experience conspecific negative density dependence, which benefits the coexistence of different species [43]. On the contrary, EcM trees usually show positive plant–soil feedback because EcM fungi form a sheath around the plant roots, which provides better protection for plants from soil-borne pathogens, and thus, favors the growth of conspecific plants [6,24,44,45]. Secondly, AM trees can directly uptake inorganic nutrients and are more effective in nutrient (mainly nitrogen and phosphorus) acquisition, which makes them more competitive than EcM trees at lower elevations undergoing inorganic nutrient cycles, as EcM trees use organic nutrients and have a relatively conservative nutrient acquisition strategy [24].

4.2. Forest Biomass Was Greatly Driven by Stand Structure

Different from the tree species richness, the forest biomass was strongly affected by the stand structure, although the key structural attributes were site-specific (Figure 3 and Figure 4). On Mt. Wuyishan, the forest biomass benefited from higher tree height variation and a larger maximum tree size, while only the latter had an impact on Mt. Gonggashan. This is possibly because the plots on Mt. Wuyishan occurred at lower elevations, so the conditions were warmer and the species were more abundant. As a result, the forests on Mt. Wuyishan had more complex stand structures compared to those on Mt. Gonggashan. Higher stand structural diversity enables better use of the space and resources, favoring biomass accumulation [25,26]. The plots on Mt. Gonggashan were relatively species-poor, with an almost constant dominant species (mainly Abies fabri or Picea brachytyla), engendering less of an impact of tree size variation. Instead, the size of the maximum trees, which were usually the dominant tree species, promoted the forest biomass greatly. This has been observed in studies conducted in temperate and tropical forests across continents [17,46], as well as in subtropical forests on a local scale [27]. Large trees, or the maximum individual tree, store a great amount of biomass because of high wood volumes. Therefore, they contribute greatly to the stand biomass [17,46]. In addition, the maximum DBH usually highly correlates with the stand age, and the biomass tends to accumulate along the chronosequence [47].
EcM tree dominance promoted the biomass on both mountains (Figure 3 and Figure 4). EcM tree species have positive plant–soil feedback and better resistance to soil-borne pathogens. Thus, they often achieve local dominance with a large size, ultimately contributing more to the stand biomass compared to AM trees [42,48].

5. Conclusions

By exploring the elevational patterns of tree species richness and biomass along two distinct elevational transects in subtropical China, we found that the tree species richness was strongly shaped by climatic factors, especially the mean annual temperature, while the tree biomass was more influenced by the stand structure and ectomycorrhizal dominance. It is also noteworthy that the stand structure and mycorrhizal dominance could adjust the impacts of the climatic factors on the tree species richness and biomass. To achieve the climate change mitigation goals, large trees should be given priority protection. Afforestation will adjust the stand structure and mycorrhizal types to increase the carbon stock and species diversity.

Supplementary Materials

The following supporting information can be downloaded at: https://www.mdpi.com/article/10.3390/f14071337/s1, Table S1: Mycorrhizal types of the tree species on Mt. Wuyishan and Mt. Gonggashan. Abbreviations: AM, arbuscular mycorrhizae; EcM, ectomycorrhizae; ErM, ericoid mycorrhizae. References [49,50] are cited in Supplementary Materials.

Author Contributions

Conceptualization, Q.C., C.J. and J.F.; Methodology, Q.C., S.M. and J.F.; Formal analysis, Q.C., S.M. and J.X.; Investigation, Q.C., G.C., J.X. and W.F.; Writing—original draft, Q.C.; Writing—review & editing, Q.C., L.S., G.C., Z.T. and J.F. All authors have read and agreed to the published version of the manuscript.

Funding

This work was supported by the National Key R&D Program of China (2022YFF0802304) and the National Natural Science Foundation of China (42101059).

Data Availability Statement

Data are available upon reasonable request from the corresponding author.

Conflicts of Interest

The authors declare no conflict of interest.

References

  1. Pan, Y.; Birdsey, R.A.; Fang, J.; Houghton, R.; Kauppi, P.E.; Kurz, W.A.; Phillips, O.L.; Shvidenko, A.; Lewis, S.L.; Canadell, J.G.; et al. A Large and Persistent Carbon Sink in the World’s Forests. Science 2011, 333, 988–993. [Google Scholar] [CrossRef]
  2. Davies, S.J.; Abiem, I.; Abu Salim, K.; Aguilar, S.; Allen, D.; Alonso, A.; Anderson-Teixeira, K.; Andrade, A.; Arellano, G.; Ashton, P.S.; et al. Forestgeo: Understanding Forest Diversity and Dynamics through a Global Observatory Network. Biol. Conserv. 2021, 253, 108907. [Google Scholar] [CrossRef]
  3. Liang, J.; Crowther, T.W.; Picard, N.; Wiser, S.; Zhou, M.; Alberti, G.; Schulze, E.-D.; McGuire, A.D.; Bozzato, F.; Pretzsch, H.; et al. Positive Biodiversity-Productivity Relationship Predominant in Global Forests. Science 2016, 354, aaf8957. [Google Scholar] [CrossRef] [PubMed]
  4. Huang, Y.; Chen, Y.; Castro-Izaguirre, N.; Baruffol, M.; Brezzi, M.; Lang, A.; Li, Y.; Härdtle, W.; von Oheimb, G.; Yang, X.; et al. Impacts of Species Richness on Productivity in a Large-Scale Subtropical Forest Experiment. Science 2018, 362, 80–83. [Google Scholar] [CrossRef] [PubMed]
  5. Feng, Y.; Schmid, B.; Loreau, M.; Forrester, D.I.; Fei, S.; Zhu, J.; Tang, Z.; Zhu, J.; Hong, P.; Ji, C.; et al. Multispecies Forest Plantations Outyield Monocultures across a Broad Range of Conditions. Science 2022, 376, 865–868. [Google Scholar] [CrossRef]
  6. Mao, Z.; van der Plas, F.; Corrales, A.; Anderson-Teixeira, K.J.; Bourg, N.A.; Chu, C.; Hao, Z.; Jin, G.; Lian, J.; Lin, F.; et al. Scale-Dependent Diversity–Biomass Relationships Can Be Driven by Tree Mycorrhizal Association and Soil Fertility. Ecol. Monogr. 2023, 93, e1568. [Google Scholar] [CrossRef]
  7. Zhang, Y.; Chen, H.Y.; Coomes, D. Individual Size Inequality Links Forest Diversity and Above-ground Biomass. J. Ecol. 2015, 103, 1245–1252. [Google Scholar] [CrossRef]
  8. Ammer, C. Diversity and Forest Productivity in a Changing Climate. New Phytol. 2019, 221, 50–66. [Google Scholar] [CrossRef]
  9. Ullah, F.; Gilani, H.; Sanaei, A.; Hussain, K.; Ali, A. Stand Structure Determines Aboveground Biomass across Temperate Forest Types and Species Mixture Along a Local-Scale Elevational Gradient. Forest Ecol. Manag. 2021, 486, 118984. [Google Scholar] [CrossRef]
  10. Yan, G.; Bongers, F.J.; Trogisch, S.; Li, Y.; Chen, G.; Yan, H.; Deng, X.; Ma, K.; Liu, X. Climate and Mycorrhizae Mediate the Relationship of Tree Species Diversity and Carbon Stocks in Subtropical Forests. J. Ecol. 2022, 110, 2462–2474. [Google Scholar] [CrossRef]
  11. Wang, Z.; Brown, J.H.; Tang, Z.; Fang, J. Temperature Dependence, Spatial Scale, and Tree Species Diversity in Eastern Asia and North America. Proc. Natl. Acad. Sci. USA 2009, 106, 13388–13392. [Google Scholar] [CrossRef]
  12. Paquette, A.; Messier, C. The Effect of Biodiversity on Tree Productivity: From Temperate to Boreal Forests. Glob. Ecol. Biogeogr. 2011, 20, 170–180. [Google Scholar] [CrossRef]
  13. Fang, J.; Shen, Z.; Tang, Z.; Wang, X.; Wang, Z.; Feng, J.; Liu, Y.; Qiao, X.; Wu, X.; Zheng, C. Forest Community Survey and the Structural Characteristics of Forests in China. Ecography 2012, 35, 1059–1071. [Google Scholar] [CrossRef]
  14. Chu, C.; Lutz, J.A.; Král, K.; Vrška, T.; Yin, X.; Myers, J.A.; Abiem, I.; Alonso, A.; Bourg, N.; Burslem, D.F.R.P.; et al. Direct and Indirect Effects of Climate on Richness Drive the Latitudinal Diversity Gradient in Forest Trees. Ecol. Lett. 2018, 22, 245–255. [Google Scholar] [CrossRef] [PubMed]
  15. Raich, J.W.; Russell, A.E.; Kitayama, K.; Parton, W.J.; Vitousek, P.M. Temperature Influences Carbon Accumulation in Moist Tropical Forests. Ecology 2006, 87, 76–87. [Google Scholar] [CrossRef]
  16. Keith, H.; Mackey, B.G.; Lindenmayer, D.B. Re-evaluation of Forest Biomass Carbon Stocks and Lessons from the World’s Most Carbon-dense Forests. Proc. Natl. Acad. Sci. USA 2009, 106, 11635–11640. [Google Scholar] [CrossRef] [PubMed]
  17. Stegen, J.C.; Swenson, N.G.; Enquist, B.J.; White, E.P.; Phillips, O.L.; Jørgensen, P.M.; Weiser, M.D.; Monteagudo Mendoza, A.; Núñez Vargas, P. Variation in Above-ground Forest Biomass across Broad Climatic Gradients. Global Ecol. Biogeogr. 2011, 20, 744–754. [Google Scholar] [CrossRef]
  18. Chen, G.; Cai, Q.; Ma, S.; Feng, Y.; Fang, W.; Ji, C.; Zhu, J.; Wang, Z.; Wang, S.; Tang, Z.; et al. Climate and Forest Attributes Influence Above-ground Biomass of Deciduous Broadleaf Forests in China. J. Ecol. 2022, 111, 495–508. [Google Scholar] [CrossRef]
  19. Abbasi, U.A.; Mattsson, E.; Nissanka, S.P.; Ali, A. Species α-diversity Promotes but β-diversity Restricts Aboveground Biomass in Tropical Forests, Depending on Stand Structure and Environmental Factors. J. For. Res. 2022, 1–13. [Google Scholar] [CrossRef]
  20. Ali, A. Forest Stand Structure and Functioning: Current Knowledge and Future Challenges. Ecol. Indic. 2019, 98, 665–677. [Google Scholar] [CrossRef]
  21. Aponte, C.; Kasel, S.; Nitschke, C.R.; Tanase, M.A.; Vickers, H.; Parker, L.; Fedrigo, M.; Kohout, M.; Ruiz-Benito, P.; Zavala, M.A.; et al. Structural Diversity Underpins Carbon Storage in Australian Temperate Forests. Global Ecol. Biogeogr. 2020, 29, 789–802. [Google Scholar] [CrossRef]
  22. Wen, Z.; Jiang, Z.; Zheng, H.; Ouyang, Z. Tropical Forest Strata Shifts in Plant Structural Diversity-Aboveground Carbon Relationships along Altitudinal Gradients. Sci. Total Environ. 2022, 838, 155907. [Google Scholar] [CrossRef] [PubMed]
  23. Yan, G.; Wang, Q.; Han, S.; Guo, Z.; Yu, J.; Wang, W.; Fan, C.; Cao, W.; Wang, L.; Xing, Y.; et al. Beneficial Effects of Warming on Temperate Tree Carbon Storage Depend on Precipitation and Mycorrhizal Types. Sci. Total Environ. 2022, 819, 153086. [Google Scholar] [CrossRef]
  24. Deng, M.; Hu, S.; Guo, L.; Jiang, L.; Huang, Y.; Schmid, B.; Liu, C.; Chang, P.; Li, S.; Liu, X.; et al. Tree Mycorrhizal Association Types Control Biodiversity-Productivity Relationship in a Subtropical Forest. Sci. Adv. 2023, 9, eadd4468. [Google Scholar] [CrossRef]
  25. Ali, A.; Yan, E.R.; Chen, H.Y.; Chang, S.X.; Zhao, Y.T.; Yang, X.D.; Xu, M.S. Stand Structural Diversity rather than Species Diversity Enhances Aboveground Carbon Storage in Secondary Subtropical Forests in Eastern China. Biogeosciences 2016, 13, 4627–4635. [Google Scholar] [CrossRef]
  26. Wang, S.; Jiménez-Alfaro, B.; Pan, S.; Yu, J.; Sanaei, A.; Sayer, E.J.; Ye, J.; Hao, Z.; Fang, S.; Lin, F.; et al. Differential Responses of Forest Strata Species Richness to Paleoclimate and Forest Structure. Forest Ecol. Manag. 2021, 499, 119605. [Google Scholar] [CrossRef]
  27. Cai, Q.; Ji, C.; Zhou, X.; Bruelheide, H.; Fang, W.; Zheng, T.; Zhu, J.; Shi, L.; Li, H.; Zhu, J.; et al. Changes in Carbon Storages of Fagus Forest Ecosystems along an Elevational Gradient on Mt. Fanjingshan in Southwest China. J. Plant Ecol. 2020, 13, 139–149. [Google Scholar] [CrossRef]
  28. Mensah, S.; Salako, V.K.; Seifert, T.; Ostertag, R. Structural Complexity and Large-Sized Trees Explain Shifting Species Richness and Carbon Relationship across Vegetation Types. Funct. Ecol. 2020, 34, 1731–1745. [Google Scholar] [CrossRef]
  29. Tedersoo, L.; Bahram, M.; Zobel, M. How Mycorrhizal Associations Drive Plant Population and Community Biology. Science 2020, 367, eaba1223. [Google Scholar] [CrossRef]
  30. Carteron, A.; Vellend, M.; Laliberté, E. Mycorrhizal Dominance Reduces Local Tree Species Diversity across US Forests. Nat. Ecol. Evol. 2022, 6, 370–374. [Google Scholar] [CrossRef]
  31. Genre, A.; Lanfranco, L.; Perotto, S.; Bonfante, P. Unique and Common Traits in Mycorrhizal Symbioses. Nat. Rev. Microbiol. 2020, 18, 649–660. [Google Scholar] [CrossRef] [PubMed]
  32. Phillips, R.P.; Brzostek, E.; Midgley, M.G. The Mycorrhizal-Associated Nutrient Economy: A New Framework for Predicting Carbon–Nutrient Couplings in Temperate Forests. New Phytol. 2013, 199, 41–51. [Google Scholar] [CrossRef]
  33. Körner, C. Mountain Biodiversity, Its Causes and Function. AMBIO J. Hum. Environ. 2004, 33, 11–17. [Google Scholar] [CrossRef]
  34. Tang, Z.; Fang, J.; Chi, X.; Feng, J.; Liu, Y.; Shen, Z.; Wang, X.; Wang, Z.; Wu, X.; Zheng, C.; et al. Patterns of Plant Beta-Diversity Along Elevational and Latitudinal Gradients in Mountain Forests of China. Ecography 2012, 35, 1083–1091. [Google Scholar] [CrossRef]
  35. Zhou, G.; Yin, G.; Tang, X. Carbon Stocks of Forest Ecosystems in China: Biomass Equation; Science Press: Beijing, China, 2018. (In Chinese) [Google Scholar]
  36. Soudzilovskaia, N.A.; van Bodegom, P.M.; Terrer, C.; Zelfde, M.V.T.; McCallum, I.; Luke McCormack, M.; Fisher, J.B.; Brundrett, M.C.; de Sá, N.C.; Tedersoo, L. Global Mycorrhizal Plant Distribution Linked to Terrestrial Carbon Stocks. Nat. Commun. 2019, 10, 5077. [Google Scholar] [CrossRef] [PubMed]
  37. Xiao, J. Classification and Elevational Gradient Analysis of Diversity and Carbon Density of Three Mountains’ Plant Communities in Southern China. Master Thesis, Peking University, Beijing, China, 2020. (In Chinese). [Google Scholar]
  38. Lai, J.; Zou, Y.; Zhang, J.; Peres-Neto, P.R. Generalizing Hierarchical and Variation Partitioning in Multiple Regression and Canonical Analyses Using the Rdacca.Hp R package. Methods Ecol. Evol. 2022, 13, 782–788. [Google Scholar] [CrossRef]
  39. R Core Team. R: A Language and Environment for Statistical Computing; R Foundation for Statistical Computing: Vienna, Austria; Available online: http://www.R-project.org/ (accessed on 15 April 2023).
  40. Allen, A.P.; Brown, J.H.; Gillooly, J.F. Global Biodiversity, Biochemical Kinetics, and the Energetic-Equivalence Rule. Science 2002, 297, 1545–1548. [Google Scholar] [CrossRef]
  41. Brown, J.H.; Gillooly, J.F.; Allen, A.P.; Savage, V.M.; West, G.B. Toward a Metabolic Theory of Ecology. Ecology 2004, 85, 1771–1789. [Google Scholar] [CrossRef]
  42. Mao, Z.; Corrales, A.; Zhu, K.; Yuan, Z.; Lin, F.; Ye, J.; Hao, Z.; Wang, X. Tree Mycorrhizal Associations Mediate Soil Fertility Effects on Forest Community Structure in a Temperate Forest. New Phytol. 2019, 223, 475–486. [Google Scholar] [CrossRef]
  43. Chen, L.; Swenson, N.G.; Ji, N.; Mi, X.; Ren, H.; Guo, L.; Ma, K. Differential Soil Fungus Accumulation and Density Dependence of Trees in a Subtropical Forest. Science 2019, 366, 124–128. [Google Scholar] [CrossRef]
  44. Bennett, J.A.; Maherali, H.; Reinhart, K.O.; Lekberg, Y.; Hart, M.M.; Klironomos, J. Plant-Soil Feedbacks and Mycorrhizal Type Influence Temperate Forest Population Dynamics. Science 2017, 355, 181–184. [Google Scholar] [CrossRef]
  45. Teste, F.P.; Kardol, P.; Turner, B.L.; Wardle, D.A.; Zemunik, G.; Renton, M.; Laliberté, E. Plant-Soil Feedback and the Maintenance of Diversity in Mediterranean-Climate Shrublands. Science 2017, 355, 173–176. [Google Scholar] [CrossRef]
  46. Slik, J.W.F.; Paoli, G.; McGuire, K.; Amaral, I.; Barroso, J.; Bastian, M.; Blanc, L.; Bongers, F.; Boundja, P.; Clark, C.; et al. Large Trees Drive Forest Aboveground Biomass Variation in Moist Lowland Forests across the Tropics. Global Ecol. Biogeogr. 2013, 22, 1261–1271. [Google Scholar] [CrossRef]
  47. Pregitzer, K.S.; Euskirchen, E.S. Carbon Cycling and Storage in World Forests: Biome Patterns Related to Forest Age. Global Chang. Biol. 2004, 10, 2052–2077. [Google Scholar] [CrossRef]
  48. Corrales, A.; Mangan, S.A.; Turner, B.L.; Dalling, J.W.; Chave, J. An Ectomycorrhizal Nitrogen Economy Facilitates Monodominance in a Neotropical Forest. Ecol. Lett. 2016, 19, 383–392. [Google Scholar] [CrossRef]
  49. Harley, J.L.; Harley, E.L. A Check-list of Mycorrhiza in the British Flora. New Phytol. 1987, 105, 1–102. [Google Scholar] [CrossRef]
  50. Haug, I.; Weber, R.; Oberwinkler, F.; Tschen, J. The Mycorrhizal Status of Taiwanese Trees and the Description of Some Ectomycorrhizal Types. Trees 1994, 8, 237–253. [Google Scholar] [CrossRef]
Figure 1. Location of the study sites (a) and a conceptual model linking species diversity, stand biomass, and the biotic and abiotic factors (b).
Forests 14 01337 g001
Figure 2. Elevational patterns of tree species richness and biomass on Mt. Wuyishan (a,c) and Mt. Gonggashan (b,d) in subtropical China. WYS, Mt. Wuyishan; GGS, Mt. Gonggashan; AM, arbuscular mycorrhizae; EcM, ectomycorrhizae; ErM, ericoid mycorrhizae. Solid and dotted lines indicate significant (p < 0.05) and insignificant relationships (p > 0.05), respectively. * p < 0.05; ** p < 0.01; *** p < 0.001.
Forests 14 01337 g002
Figure 3. Relative influences of biotic and abiotic variables on tree species richness and biomass on Mt. Wuyishan (a,c) and Mt. Gonggashan (b,d). In each panel, the left part is the relative contribution of different groups of variables, and the right part is the standardized coefficients from multiple linear regressions estimated separately for each variable. MAP, mean annual precipitation; MAT, mean annual temperature; EcM%, ectomycorrhizal dominance; cv_H, tree height variation; max_DBH, maximum diameter at breast height; TSR, tree species richness. The bars indicate a 95% confidence interval. * p < 0.05; ** p < 0.01; *** p < 0.001.
Forests 14 01337 g003
Figure 4. Structure equation models (SEMs) examining the multivariate relationships of stand biomass, tree species richness, stand structural attributes, mycorrhizal dominance, and climate on Mt. Wuyishan (a) and Mt. Gonggashan (b). Blue and red arrows indicate positive and negative effects, respectively. Dashed arrows in grey indicate insignificant effects. Arrow width is proportional to the standardized path coefficient. MAT, mean annual temperature; MAP, mean annual precipitation; EcM, ectomycorrhizae; cv_H, variation of tree height; max_DBH, maximum diameter at breast height; TSR, tree species richness. * p < 0.05; ** p < 0.01; *** p < 0.001.
Forests 14 01337 g004
Table 1. Descriptive statistics of response and possible predictive variables on Mt. Wuyishan (N = 28) and Mt. Gonggashan (N = 27).
VariableAbbreviationUnitMt. WuyishanMt. Gonggashan
MeanSDMinMaxMeanSDMinMax
Response variables
Tree species richnessTSRspecies/600 m2199.5 5399.1 4.9 419
Stand biomassBiomassMg ha−1225.3 71.6 110.0 436.7 295.0 106.4 171.8 612.5
Possible predictive variables
ElevationElevationm1340 458 57320703085 397 24453736
Climate
Mean annual temperatureMAT°C13.2 2.0 10.1 16.5 3.4 2.7 −0.9 7.7
Mean annual precipitationMAPmm2170 241 1894 2642 2111 83 1946 2202
Stand structure
Stem densityDensityindividuals ha−13120 1027 1633 6300 1556 953 350 4200
Maximum DBHmax_DBHcm43.5 10.2 29.6 75.4 82.8 23.4 42.8 126.1
DBH variancecv_DBHunitless0.69 0.13 0.43 0.95 1.08 0.25 0.64 1.62
Tree height variancecv_Hunitless0.43 0.09 0.19 0.58 0.83 0.18 0.54 1.32
Mycorrhizal dominance
Ectomycorrhizal dominanceEcM%%58.9 22.1 25.6 95.1 80.4 15.7 39.7 98.3
Arbuscular mycorrhizal dominanceAM%%32.8 19.9 3.8 68.5 11.5 15.2 0.1 60.3
Ericoid mycorrhizal dominanceErM%%8.3 7.4 0.2 24.5 8.1 11.3 0.0 39.3
Table 2. Direct, indirect, and total standardized effects of different variables on tree species richness and biomass based on the structural equation models in Figure 4.
VariablesStandardized Total EffectsStandardized Direct EffectsStandardized Indirect Effects
TSRBiomassTSRBiomassTSRBiomass
Mt. Wuyishan
MAT0.830.200.610.680.22−0.48
max_DBH−0.030.6700.32−0.030.35
cv_H0.370.200.370.430−0.23
EcM%−0.060.60−0.060.5700.04
TSR0−0.62/−0.6200
Mt. Gonggashan
MAT0.870.370.87000.37
MAP−0.200.2300−0.200.23
max_DBH00.6700.860−0.19
cv_H0−0.280−0.2800
EcM%−0.240.37−0.240.3500.02
TSR0−0.090−0.0900
Abbreviations: MAT, mean annual temperature; MAP, mean annual precipitation; max_DBH, maximum diameter at breast height; cv_H, variation of tree height; TSR, tree species richness; EcM%, ectomycorrhizal dominance.
Disclaimer/Publisher’s Note: The statements, opinions and data contained in all publications are solely those of the individual author(s) and contributor(s) and not of MDPI and/or the editor(s). MDPI and/or the editor(s) disclaim responsibility for any injury to people or property resulting from any ideas, methods, instructions or products referred to in the content.

