

Modeling Dynamics in Land Use and Land Cover and Its Future Projection for the Amazon Biome


 ,
,  , , , ,
Abstract

1. Introduction
2. Materials and Methods
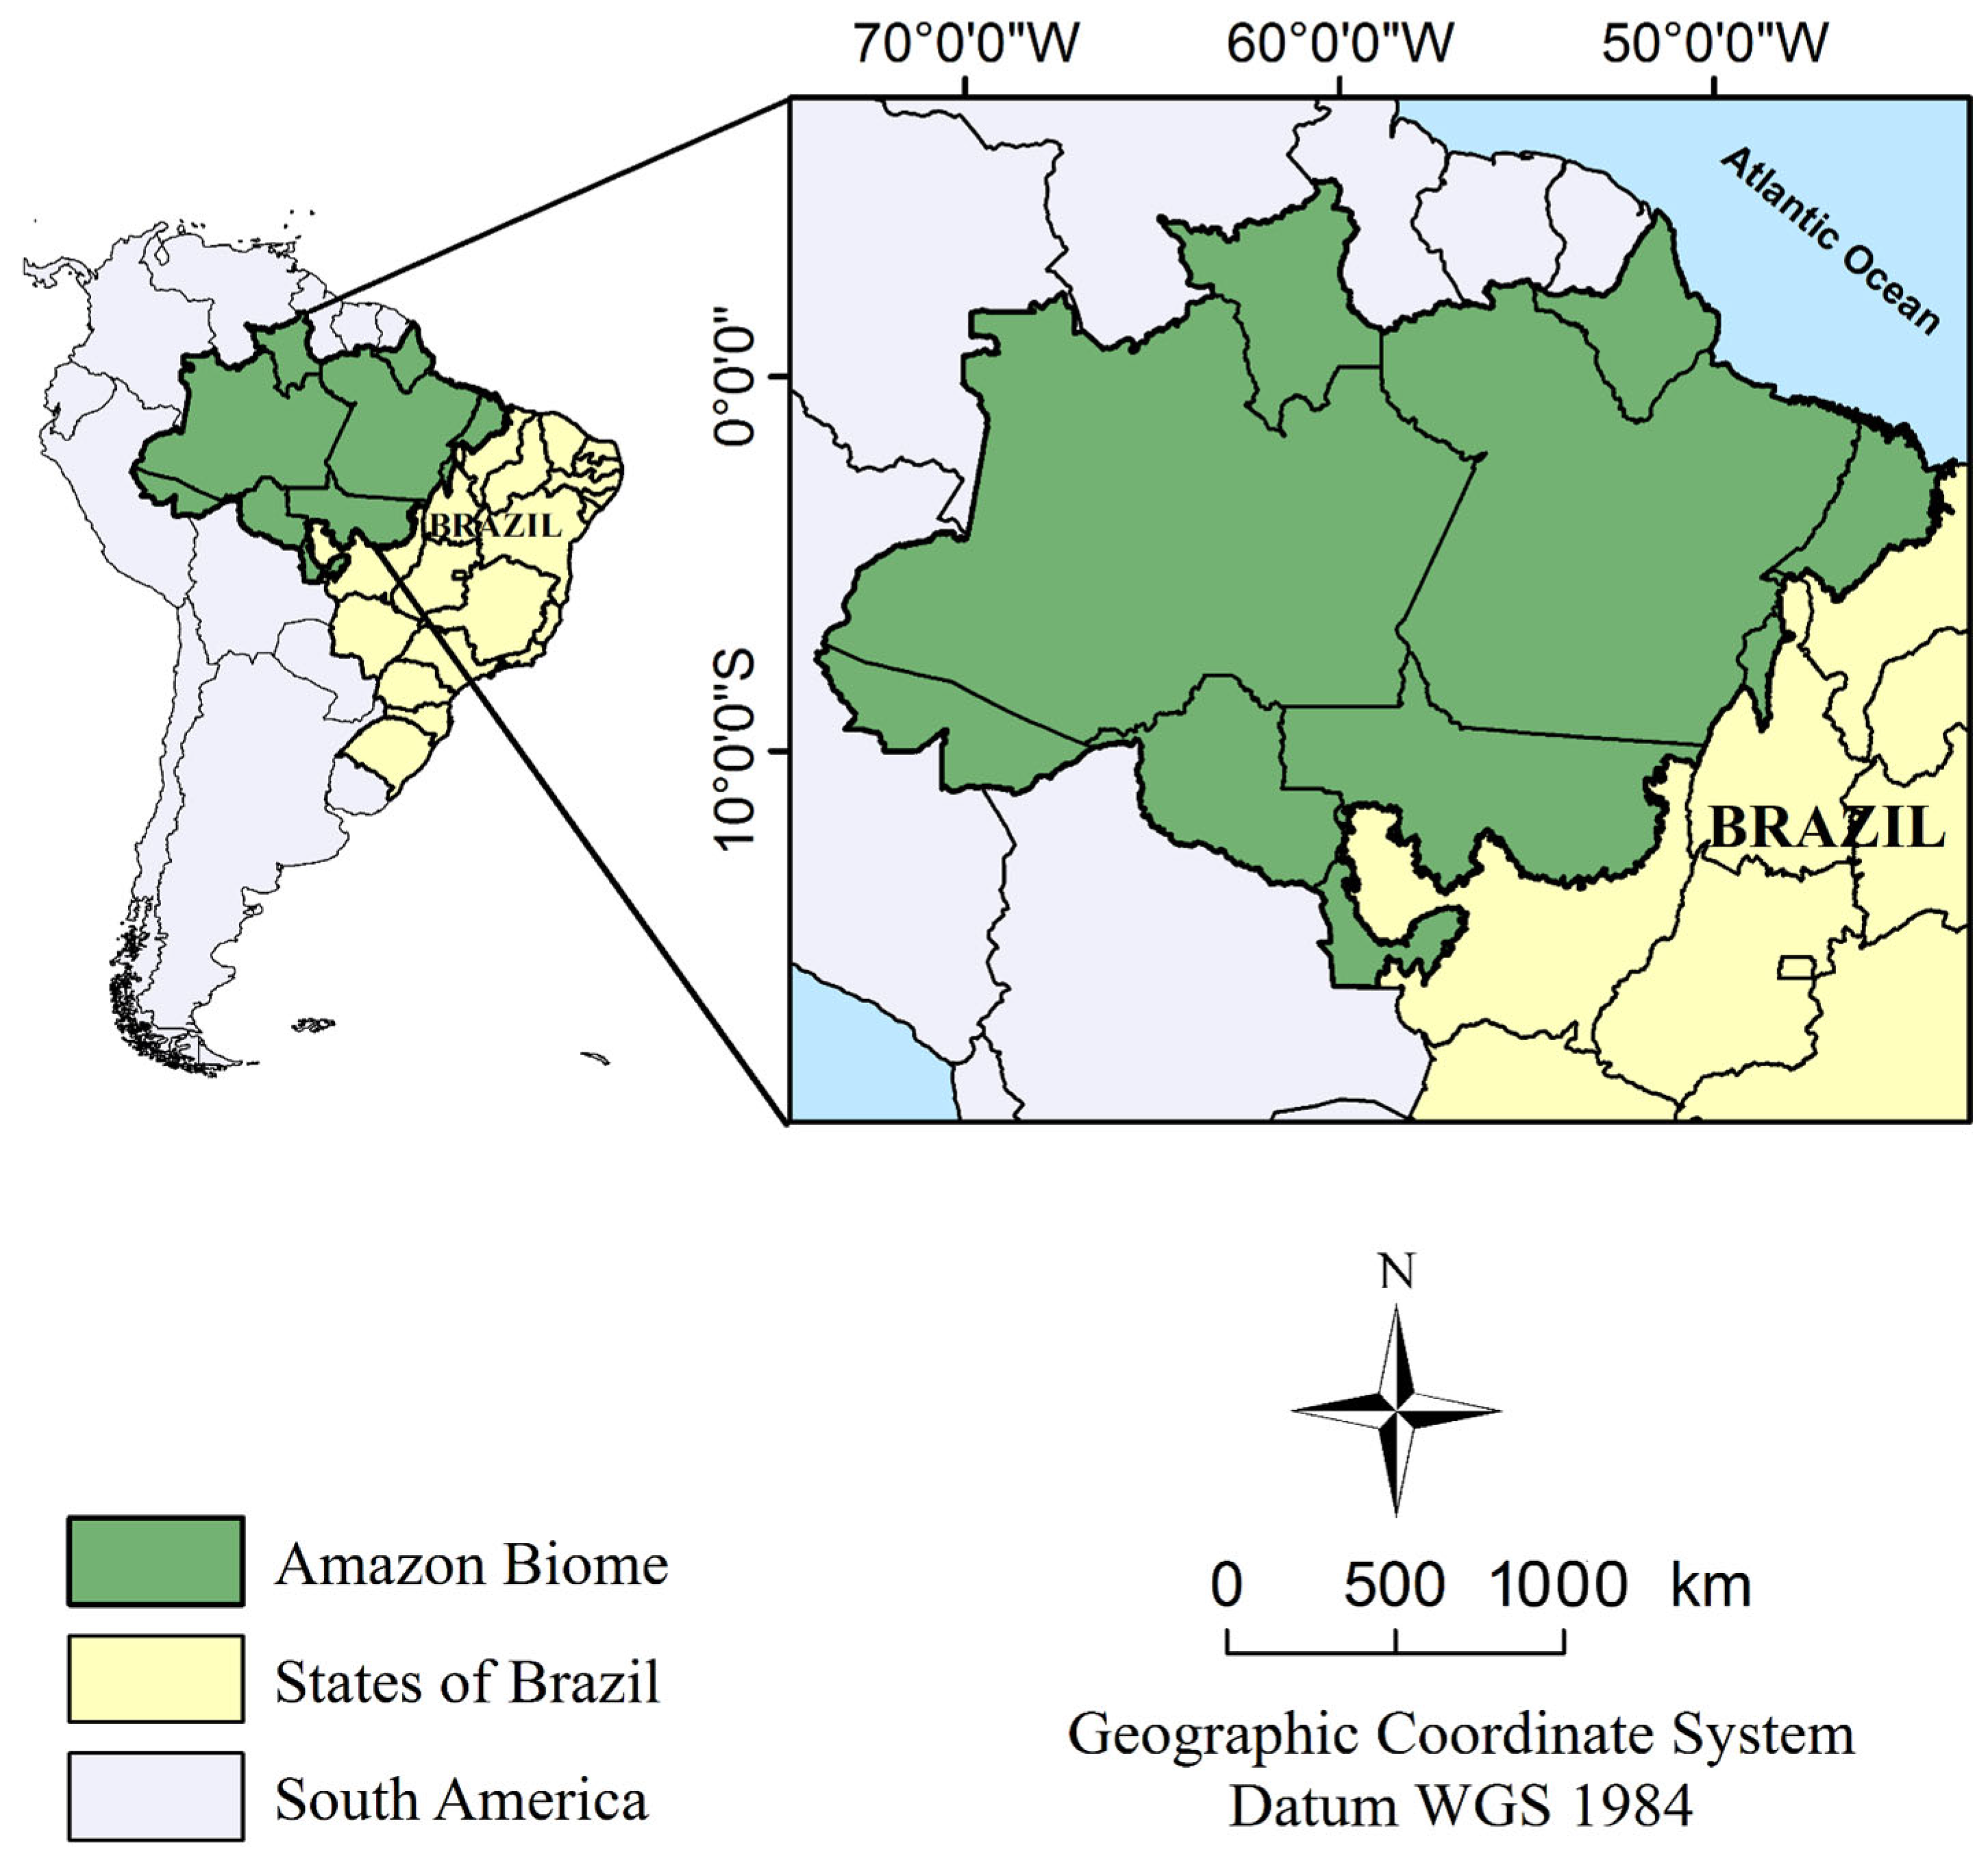
2.1. Study Area
2.2. Database
2.2.1. Land Use and Land Cover
2.2.2. Highways
2.2.3. Protected Areas
2.2.4. Water Courses
2.2.5. Elevation and Slope Data
2.2.6. Rainfall Images
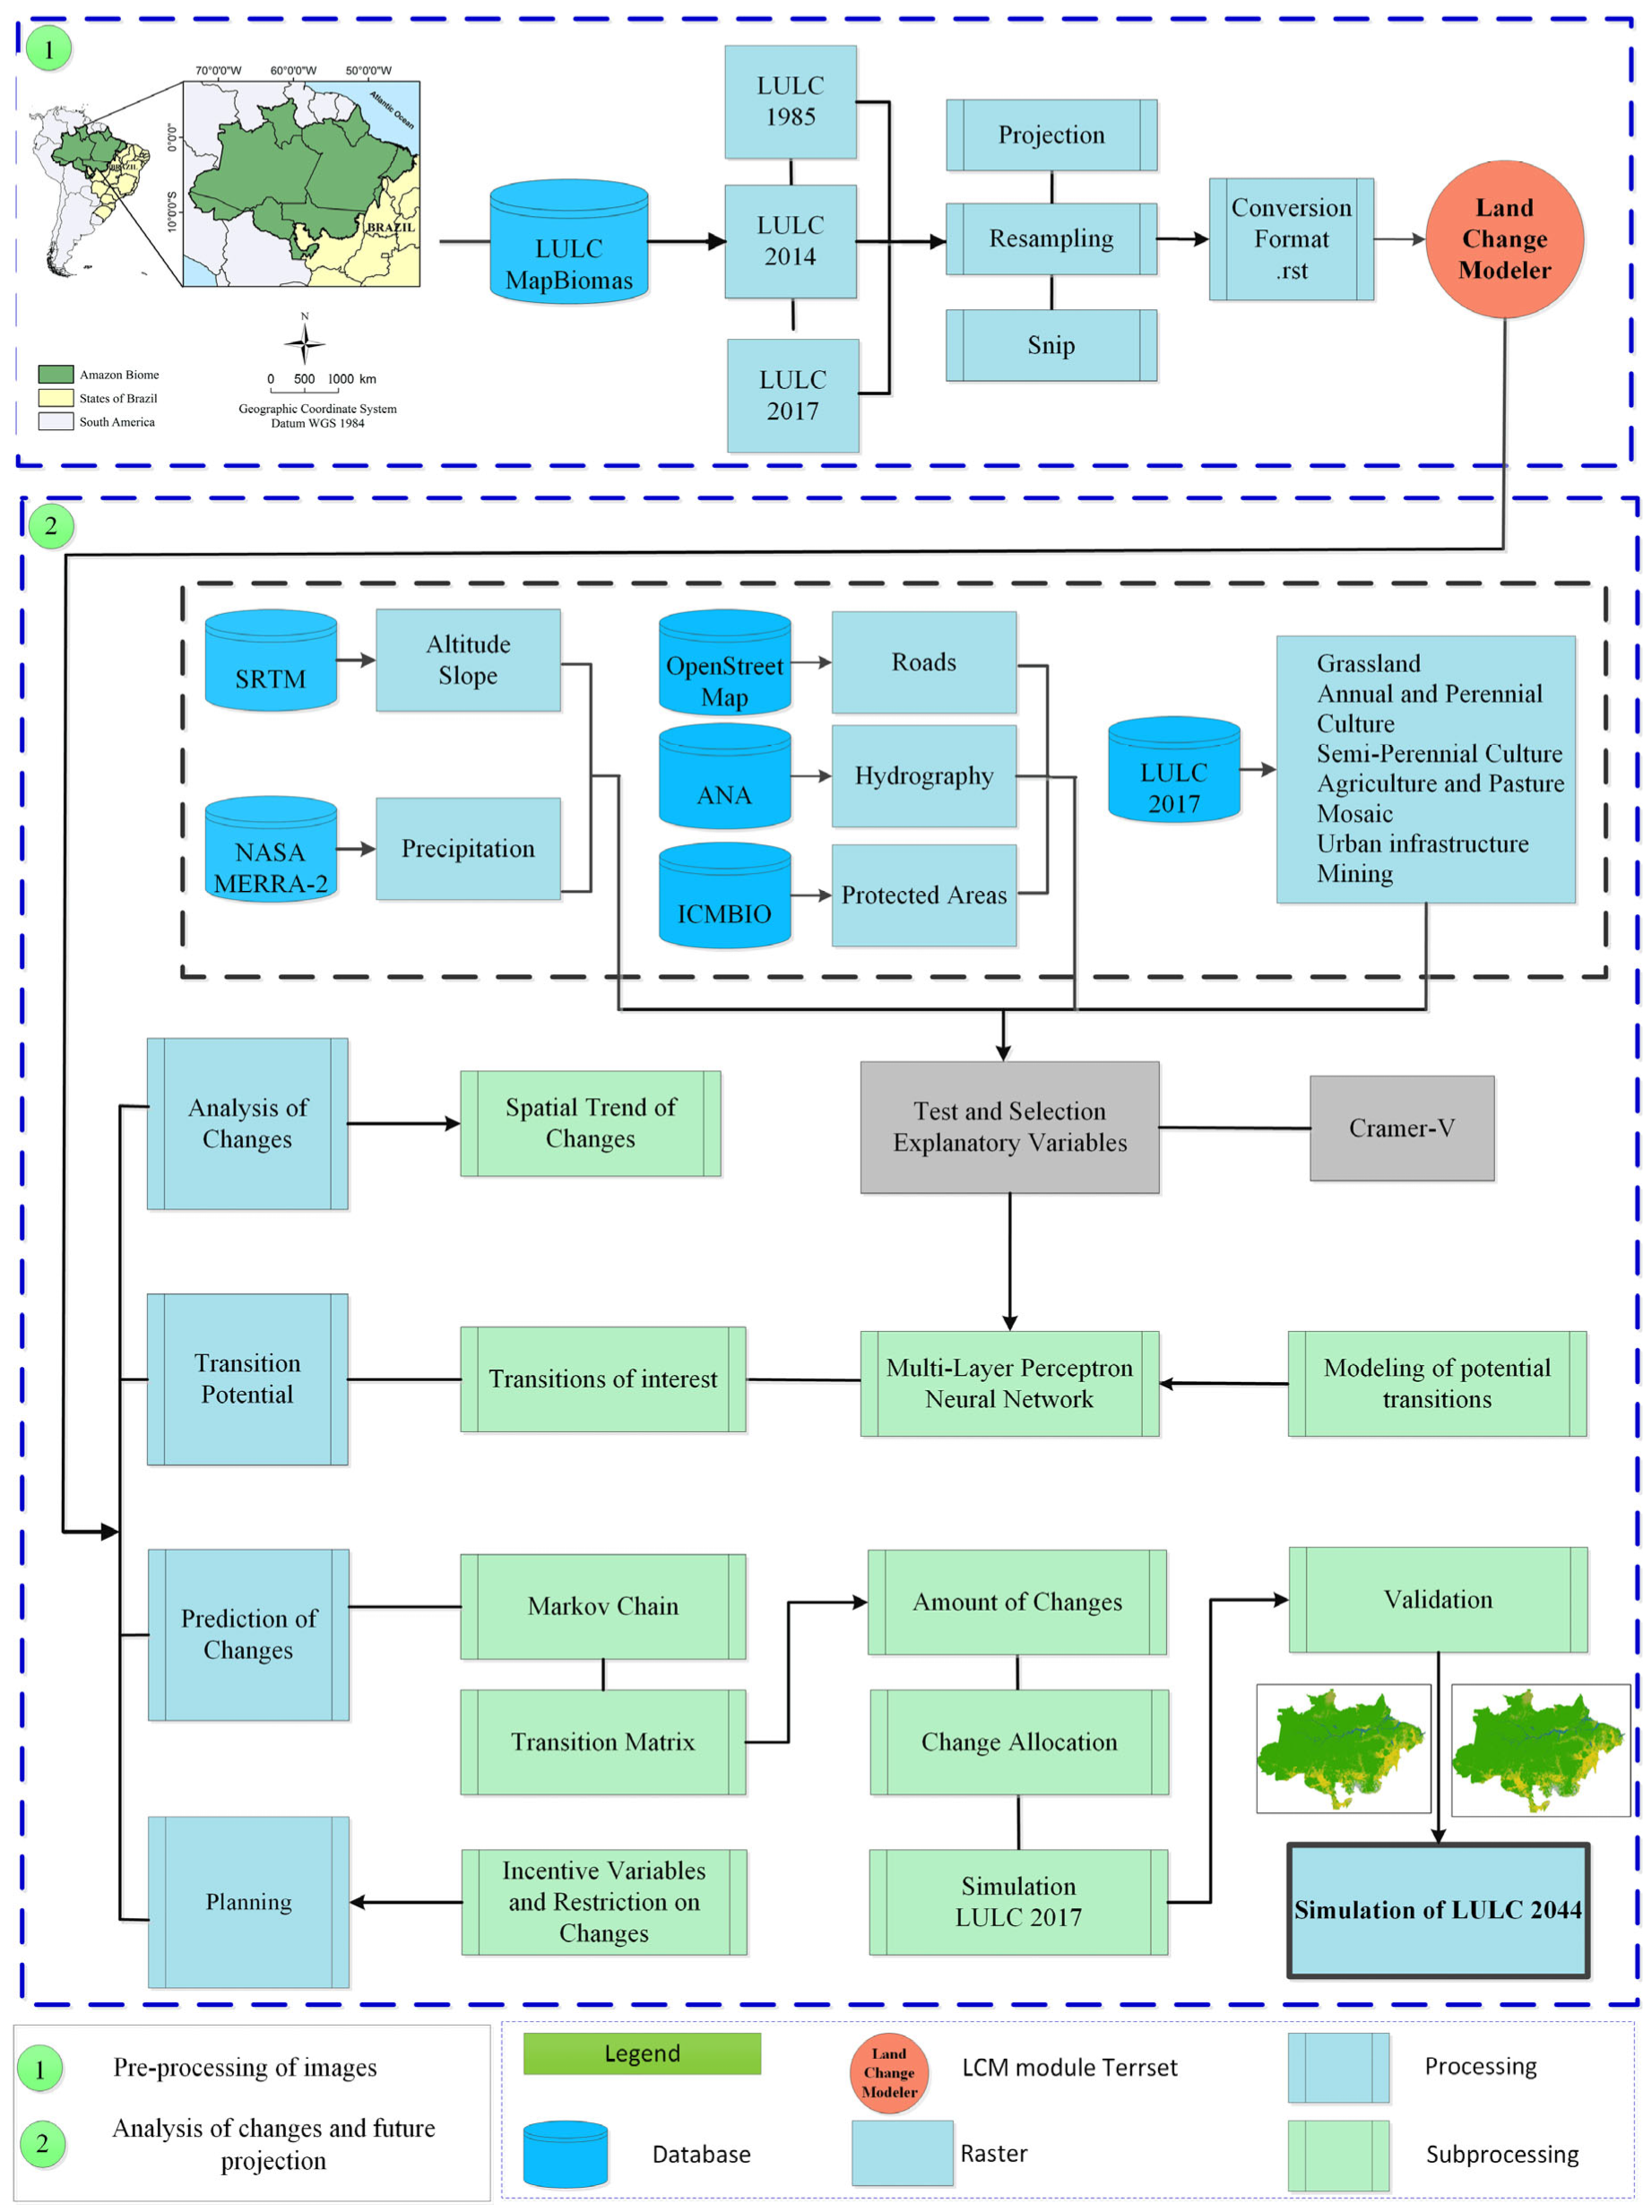
2.3. Images Pre-Processing
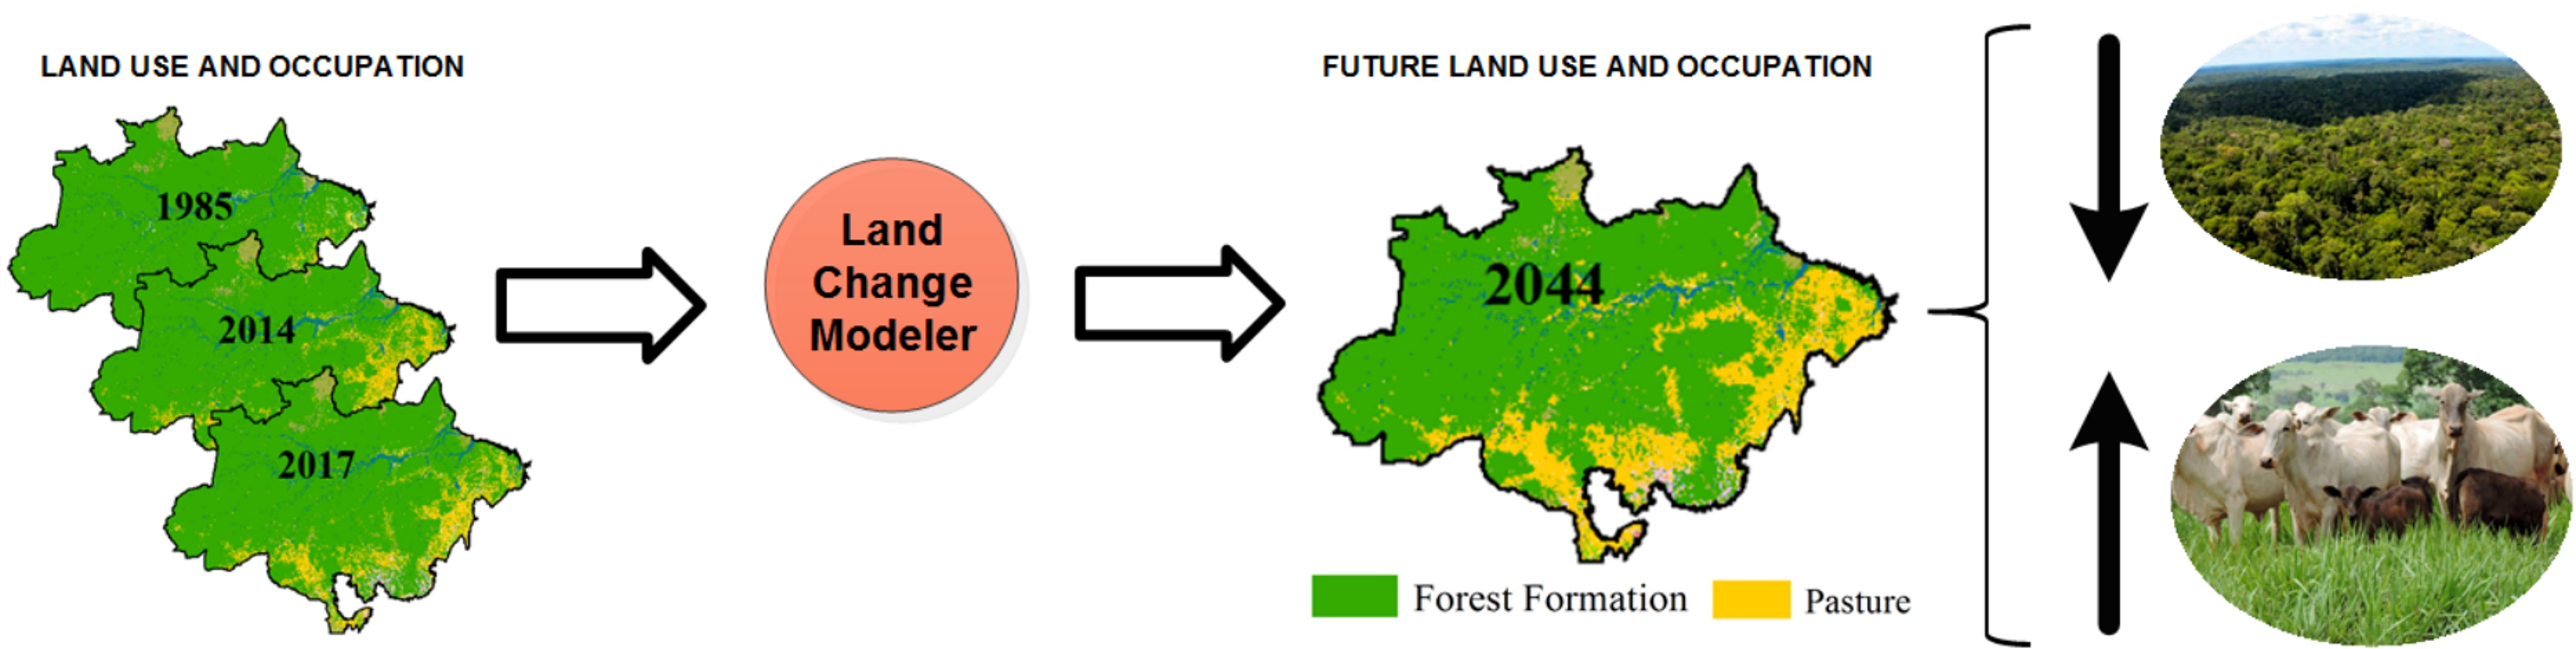
2.4. Dynamics of Changes and Projection of Future Land Use and Cover
3. Results
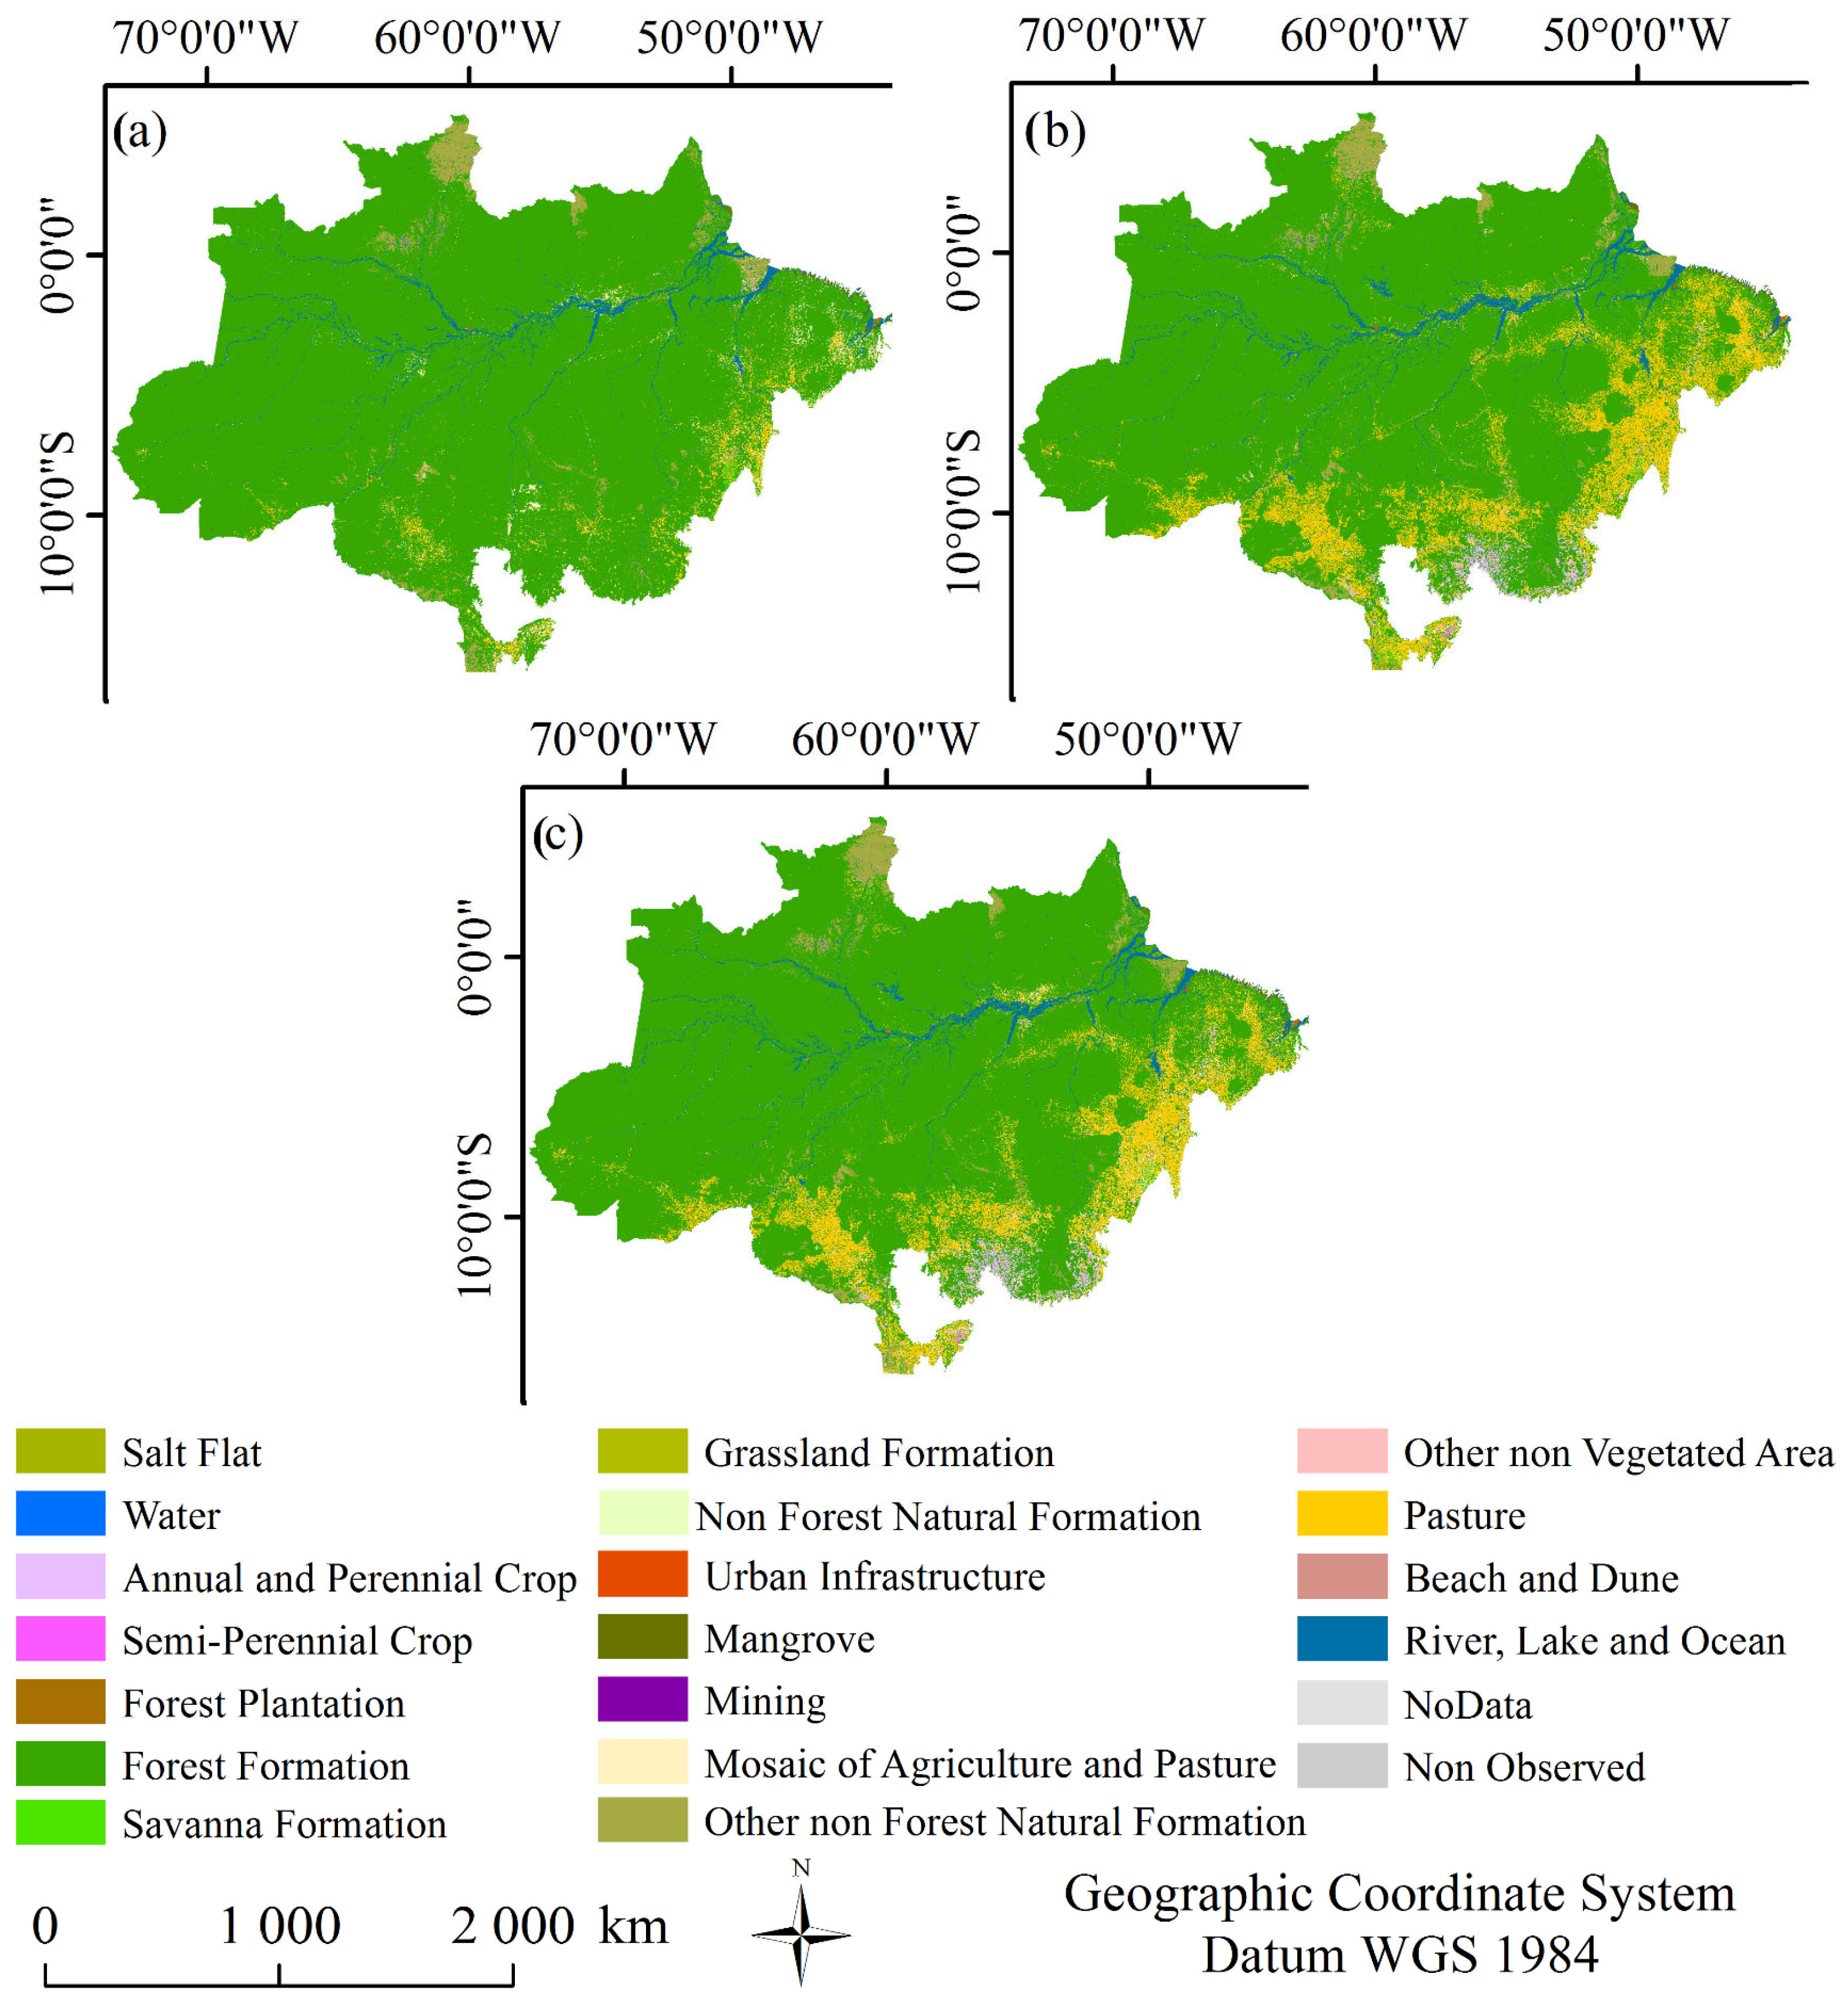
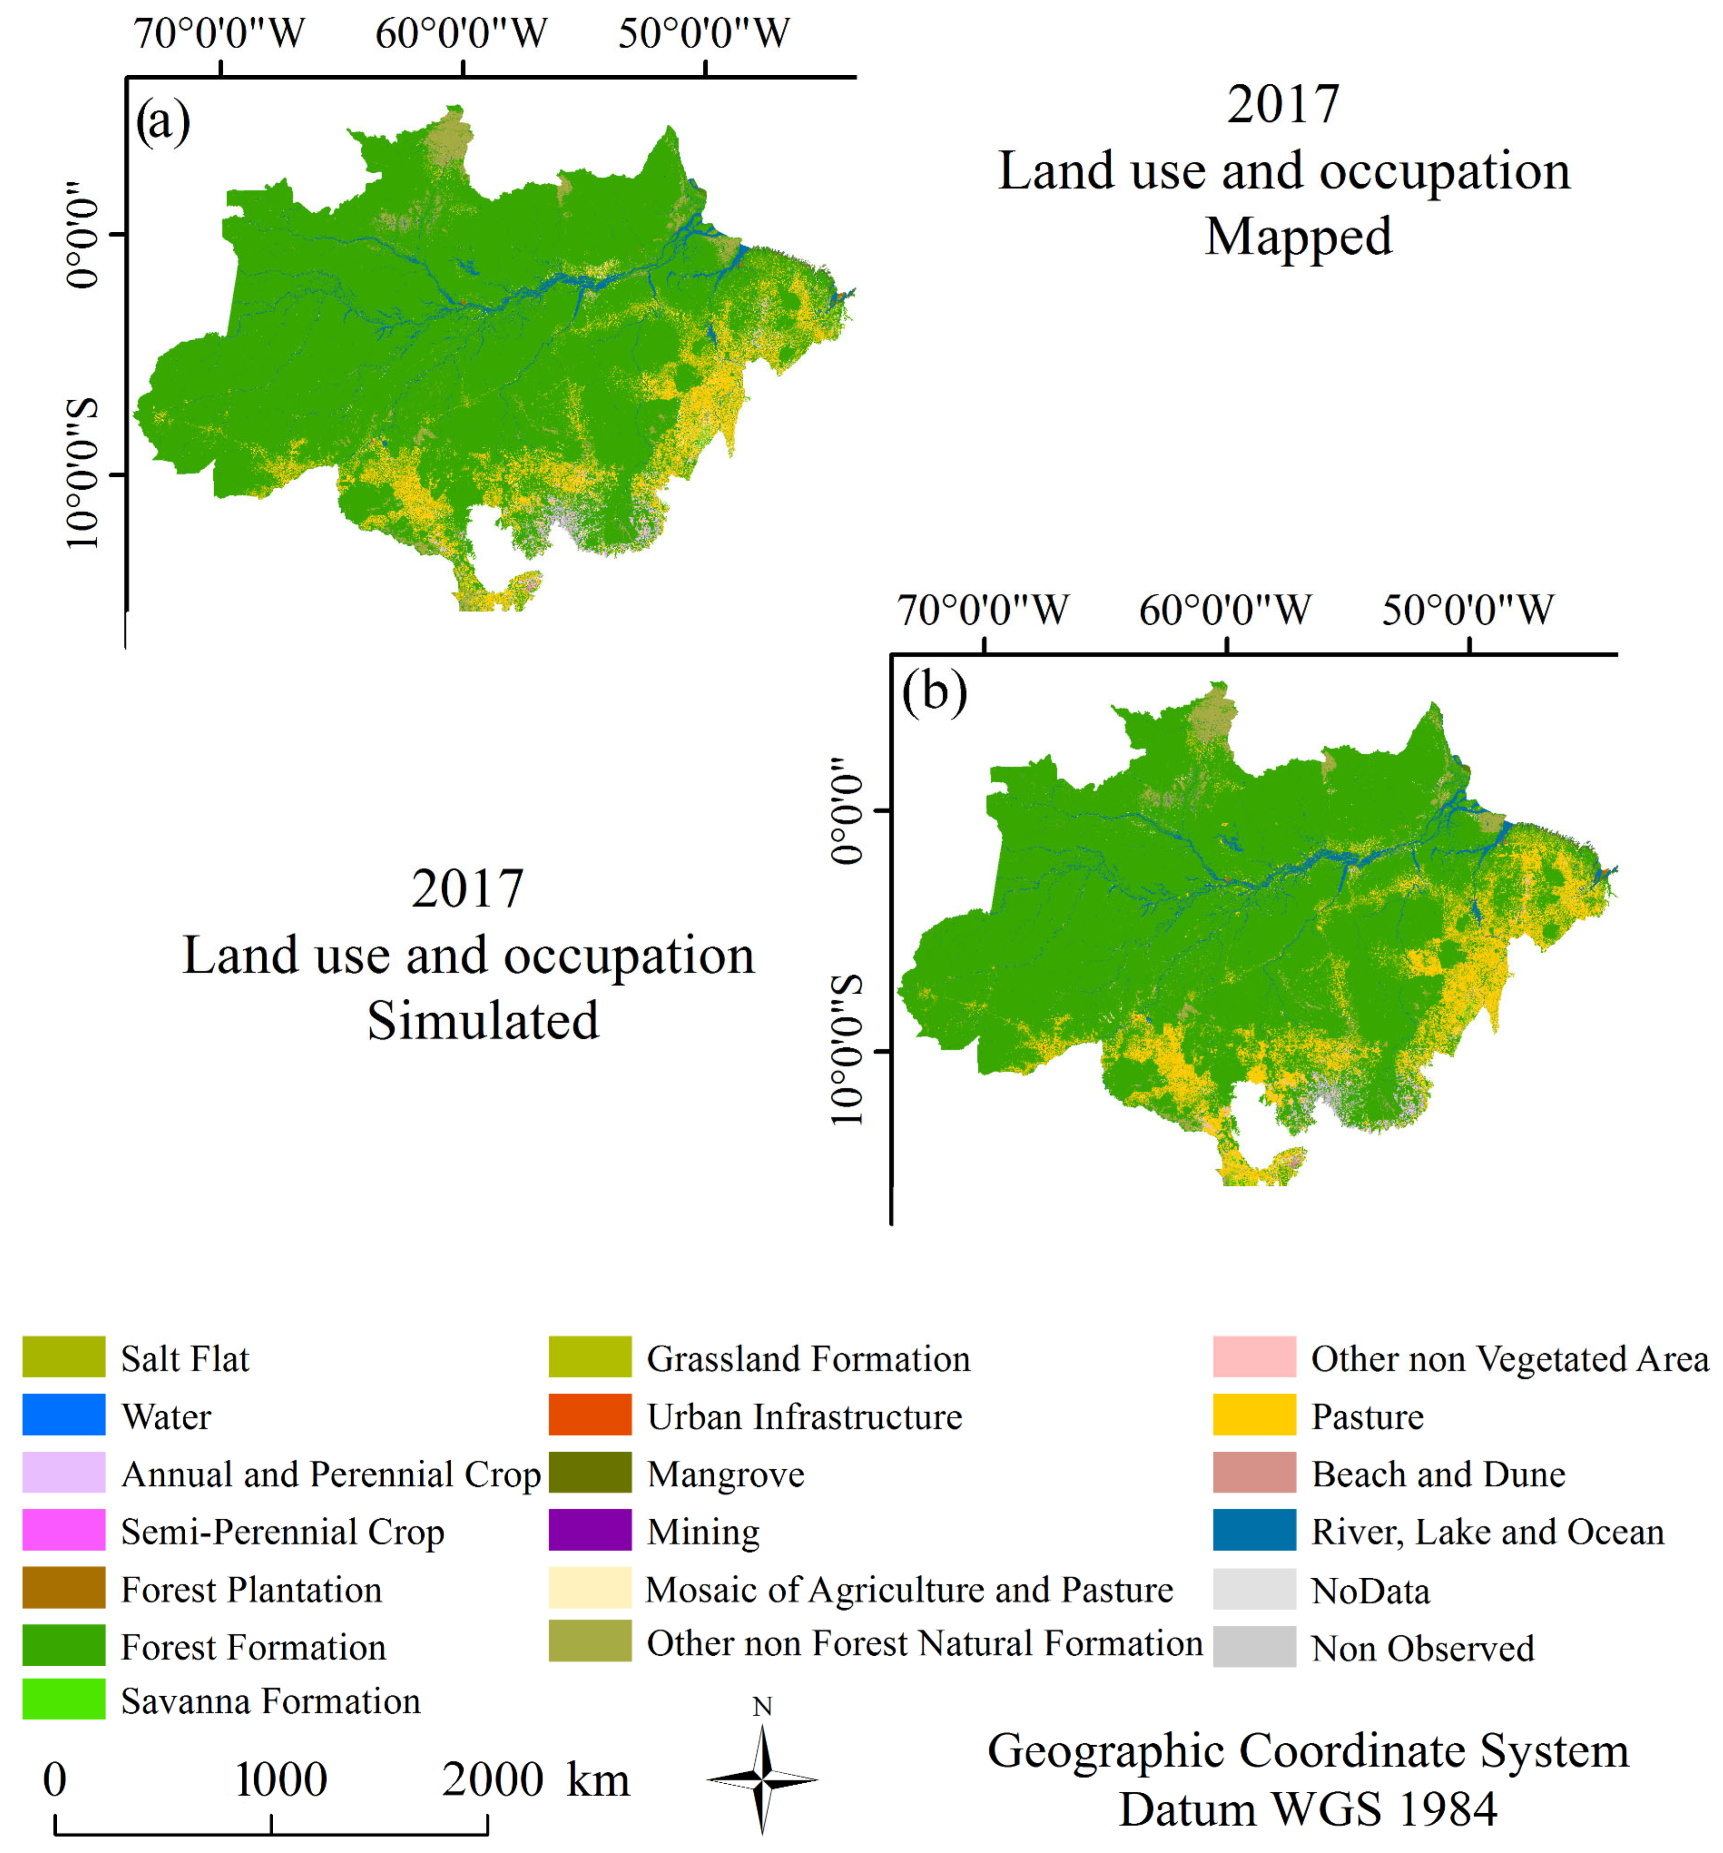
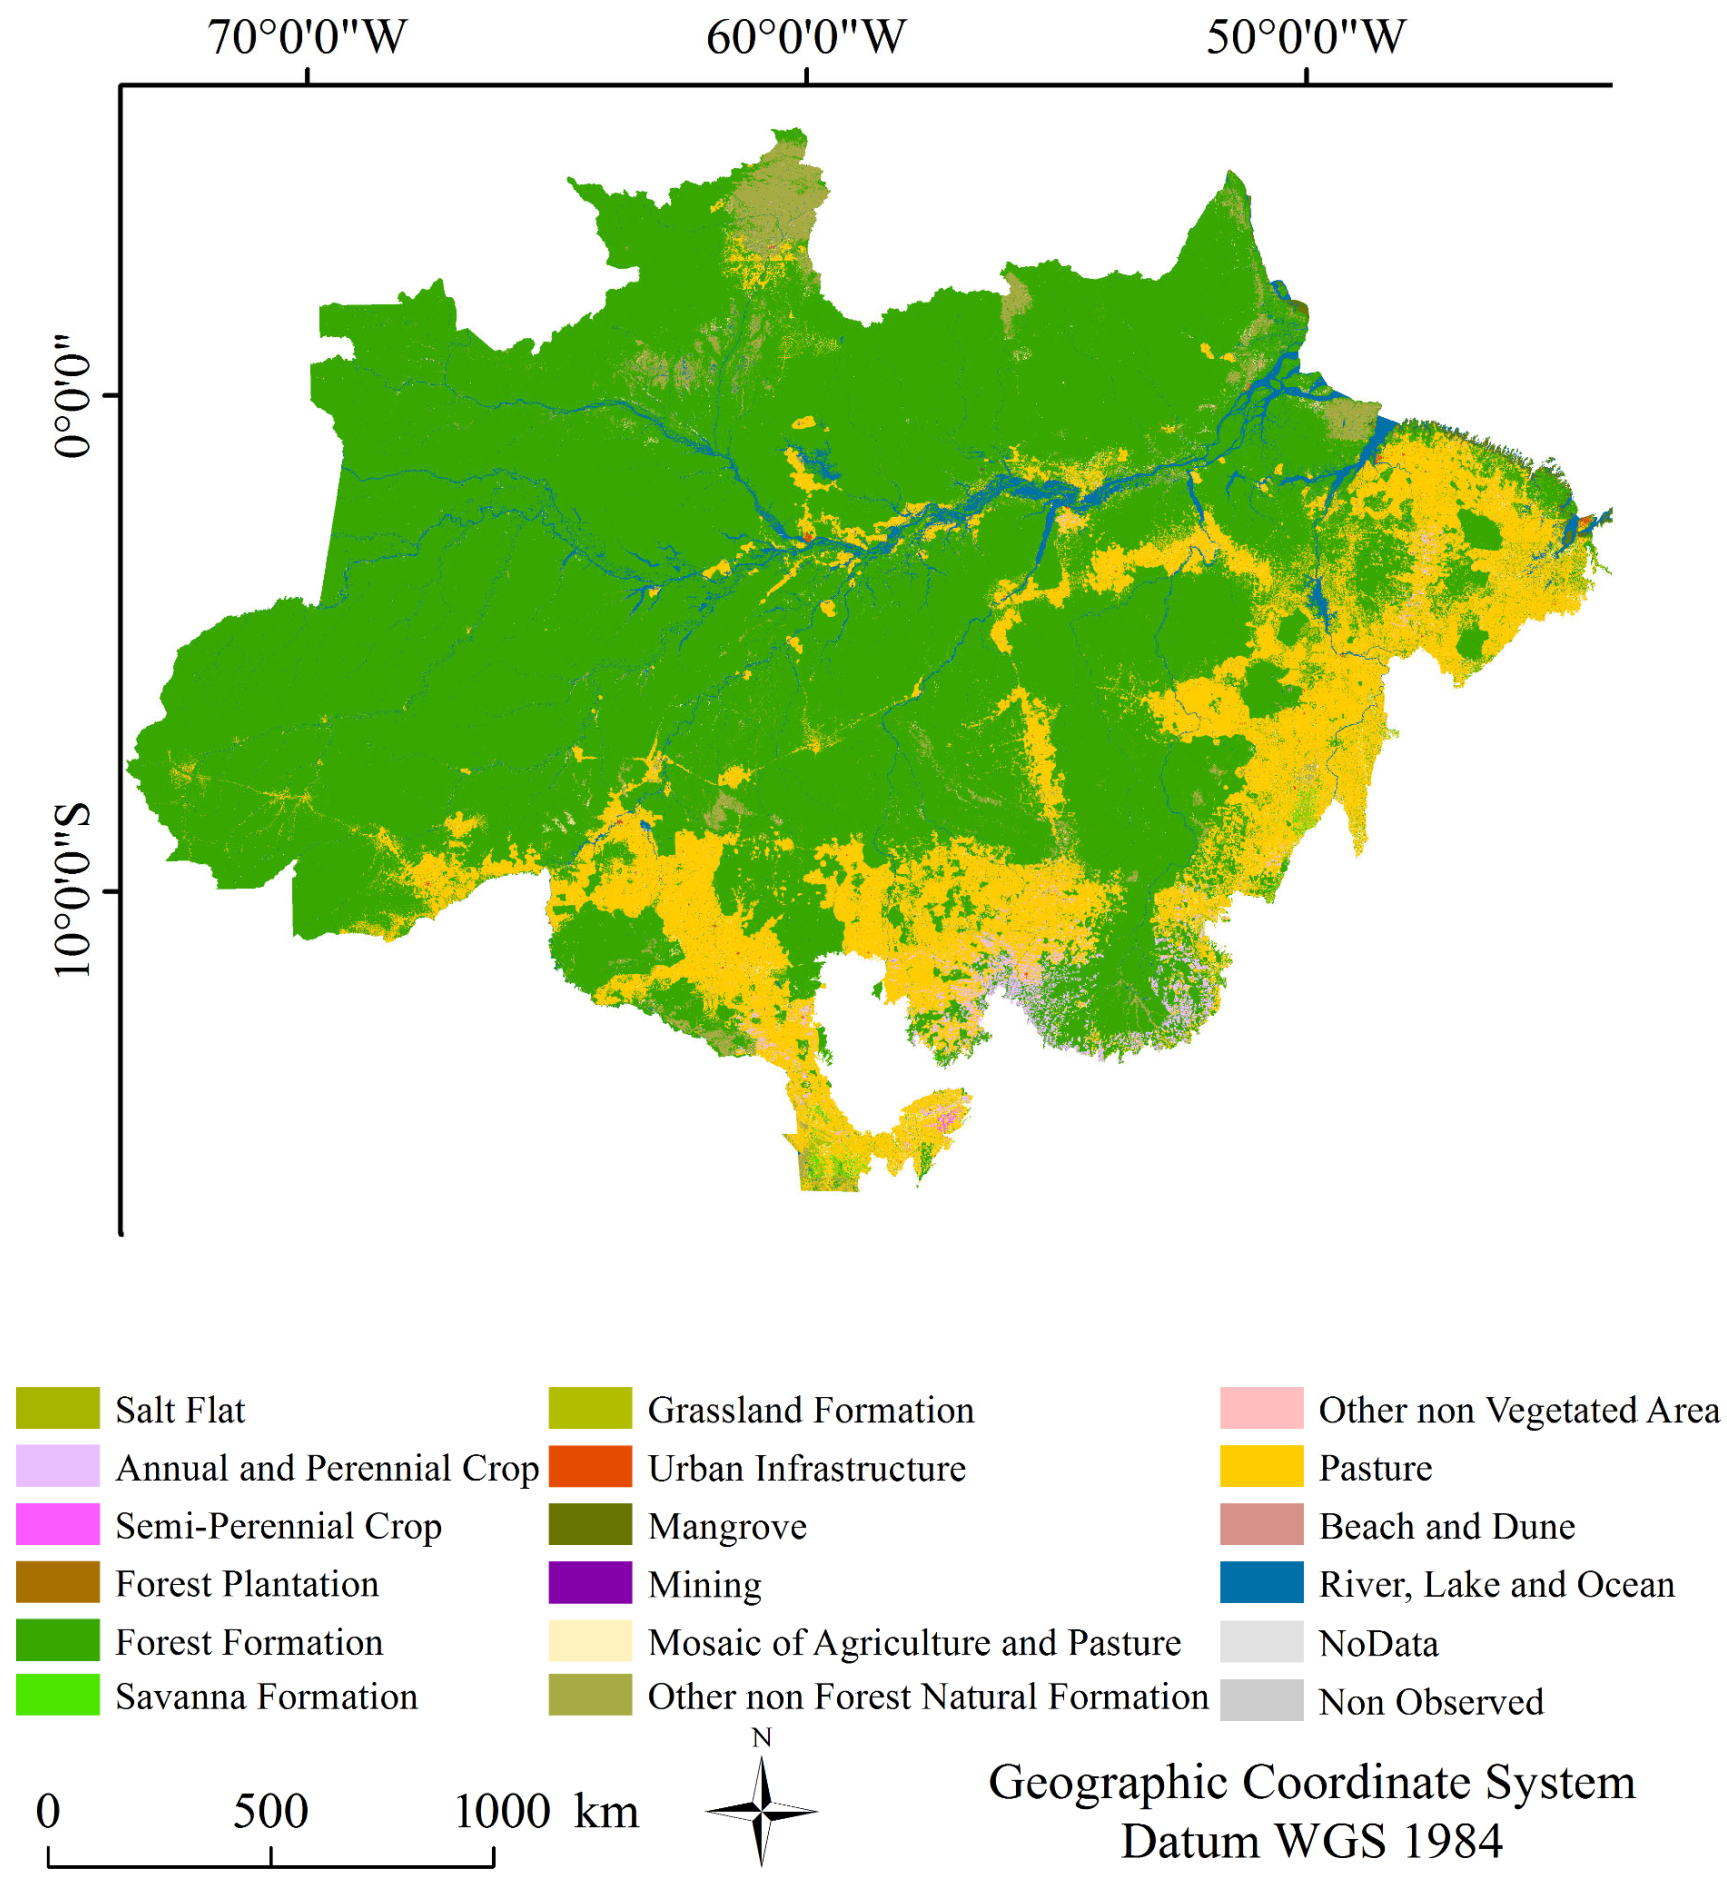
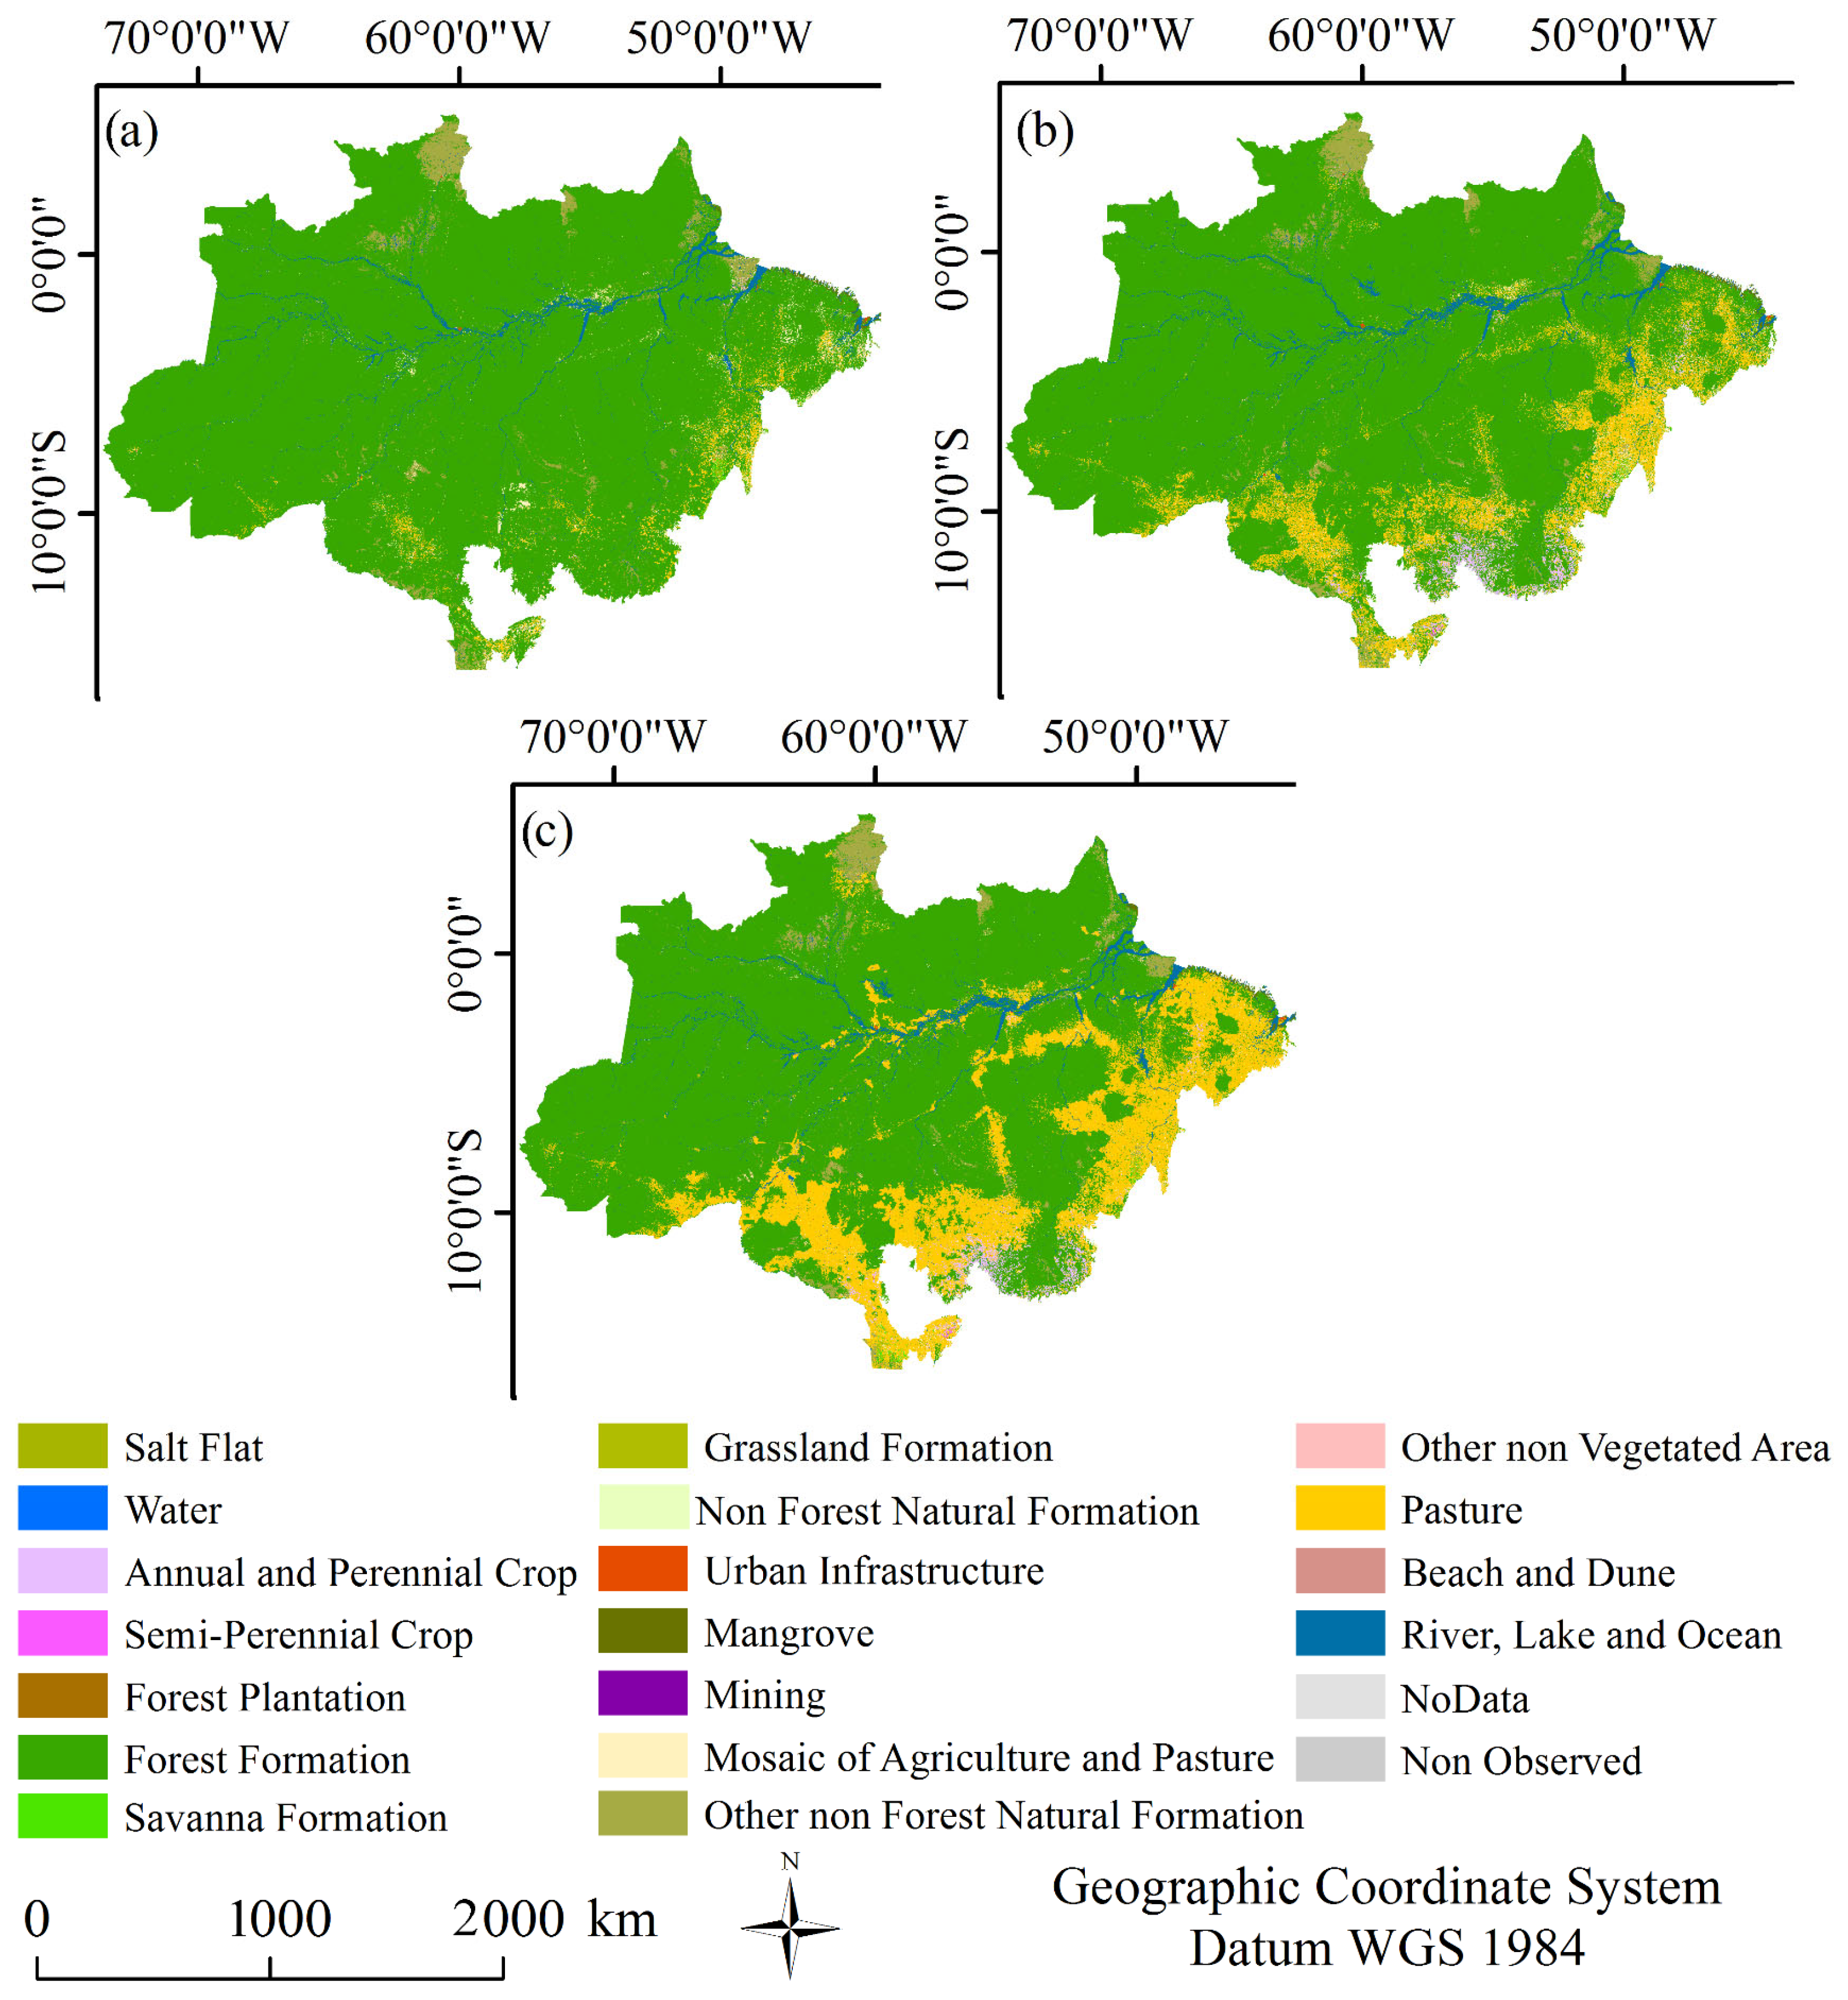
3.1. Mapping Land Use and Land Cover among 1985, 2014, and 2017
3.2. Graphical and Tabular Analysis of Changes between 1985 and 2014
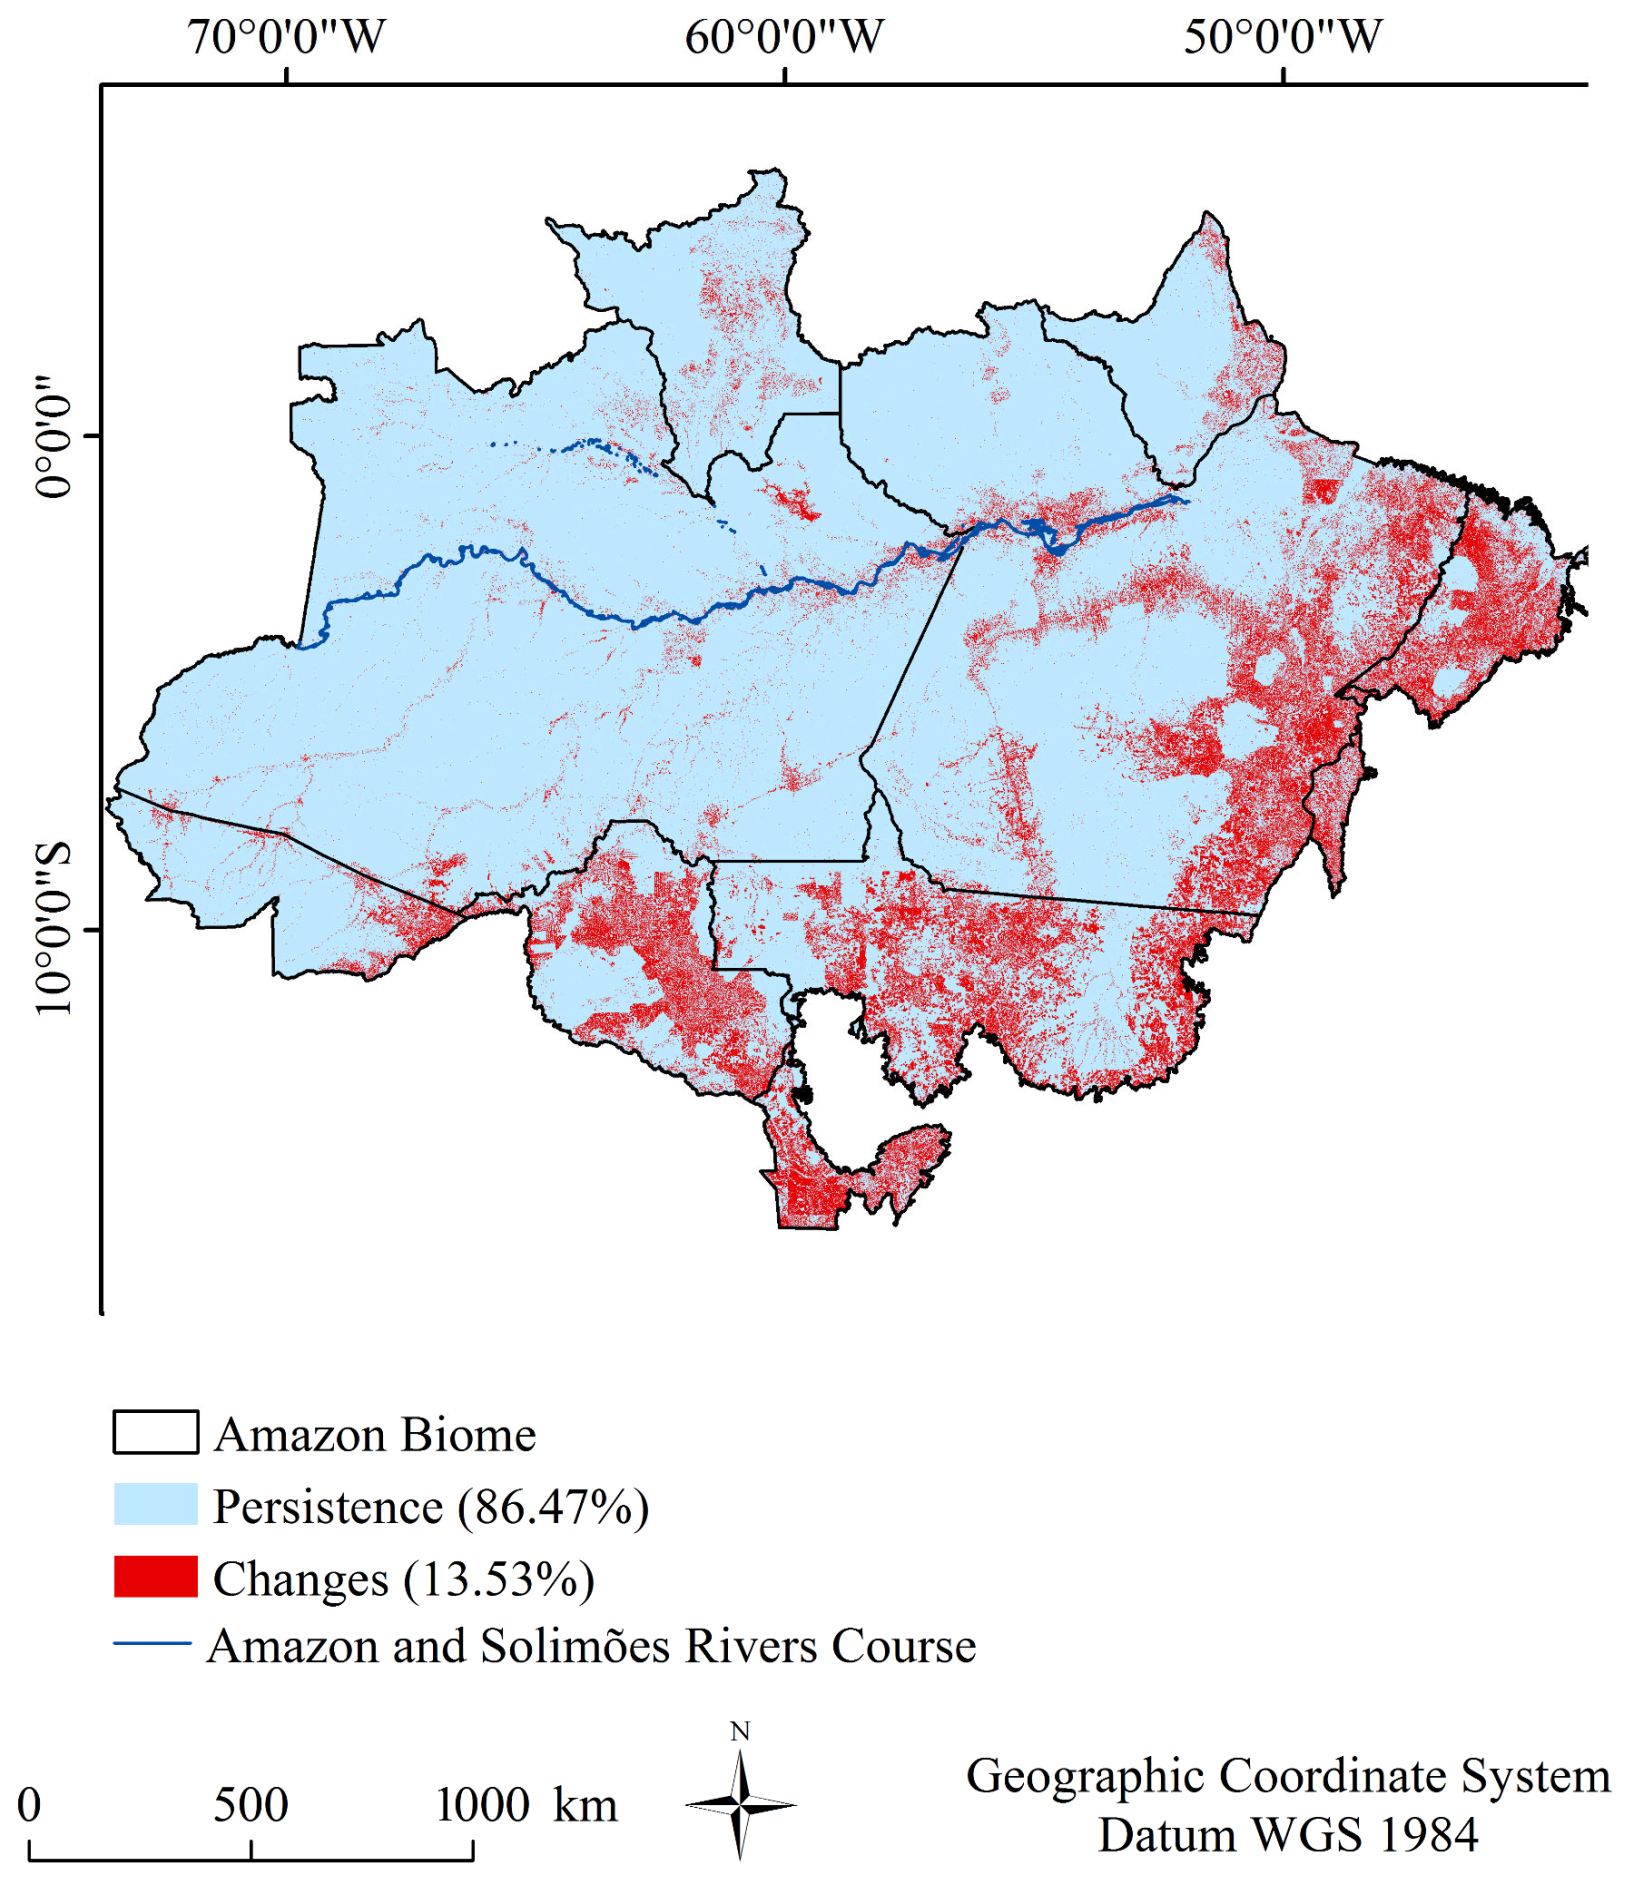
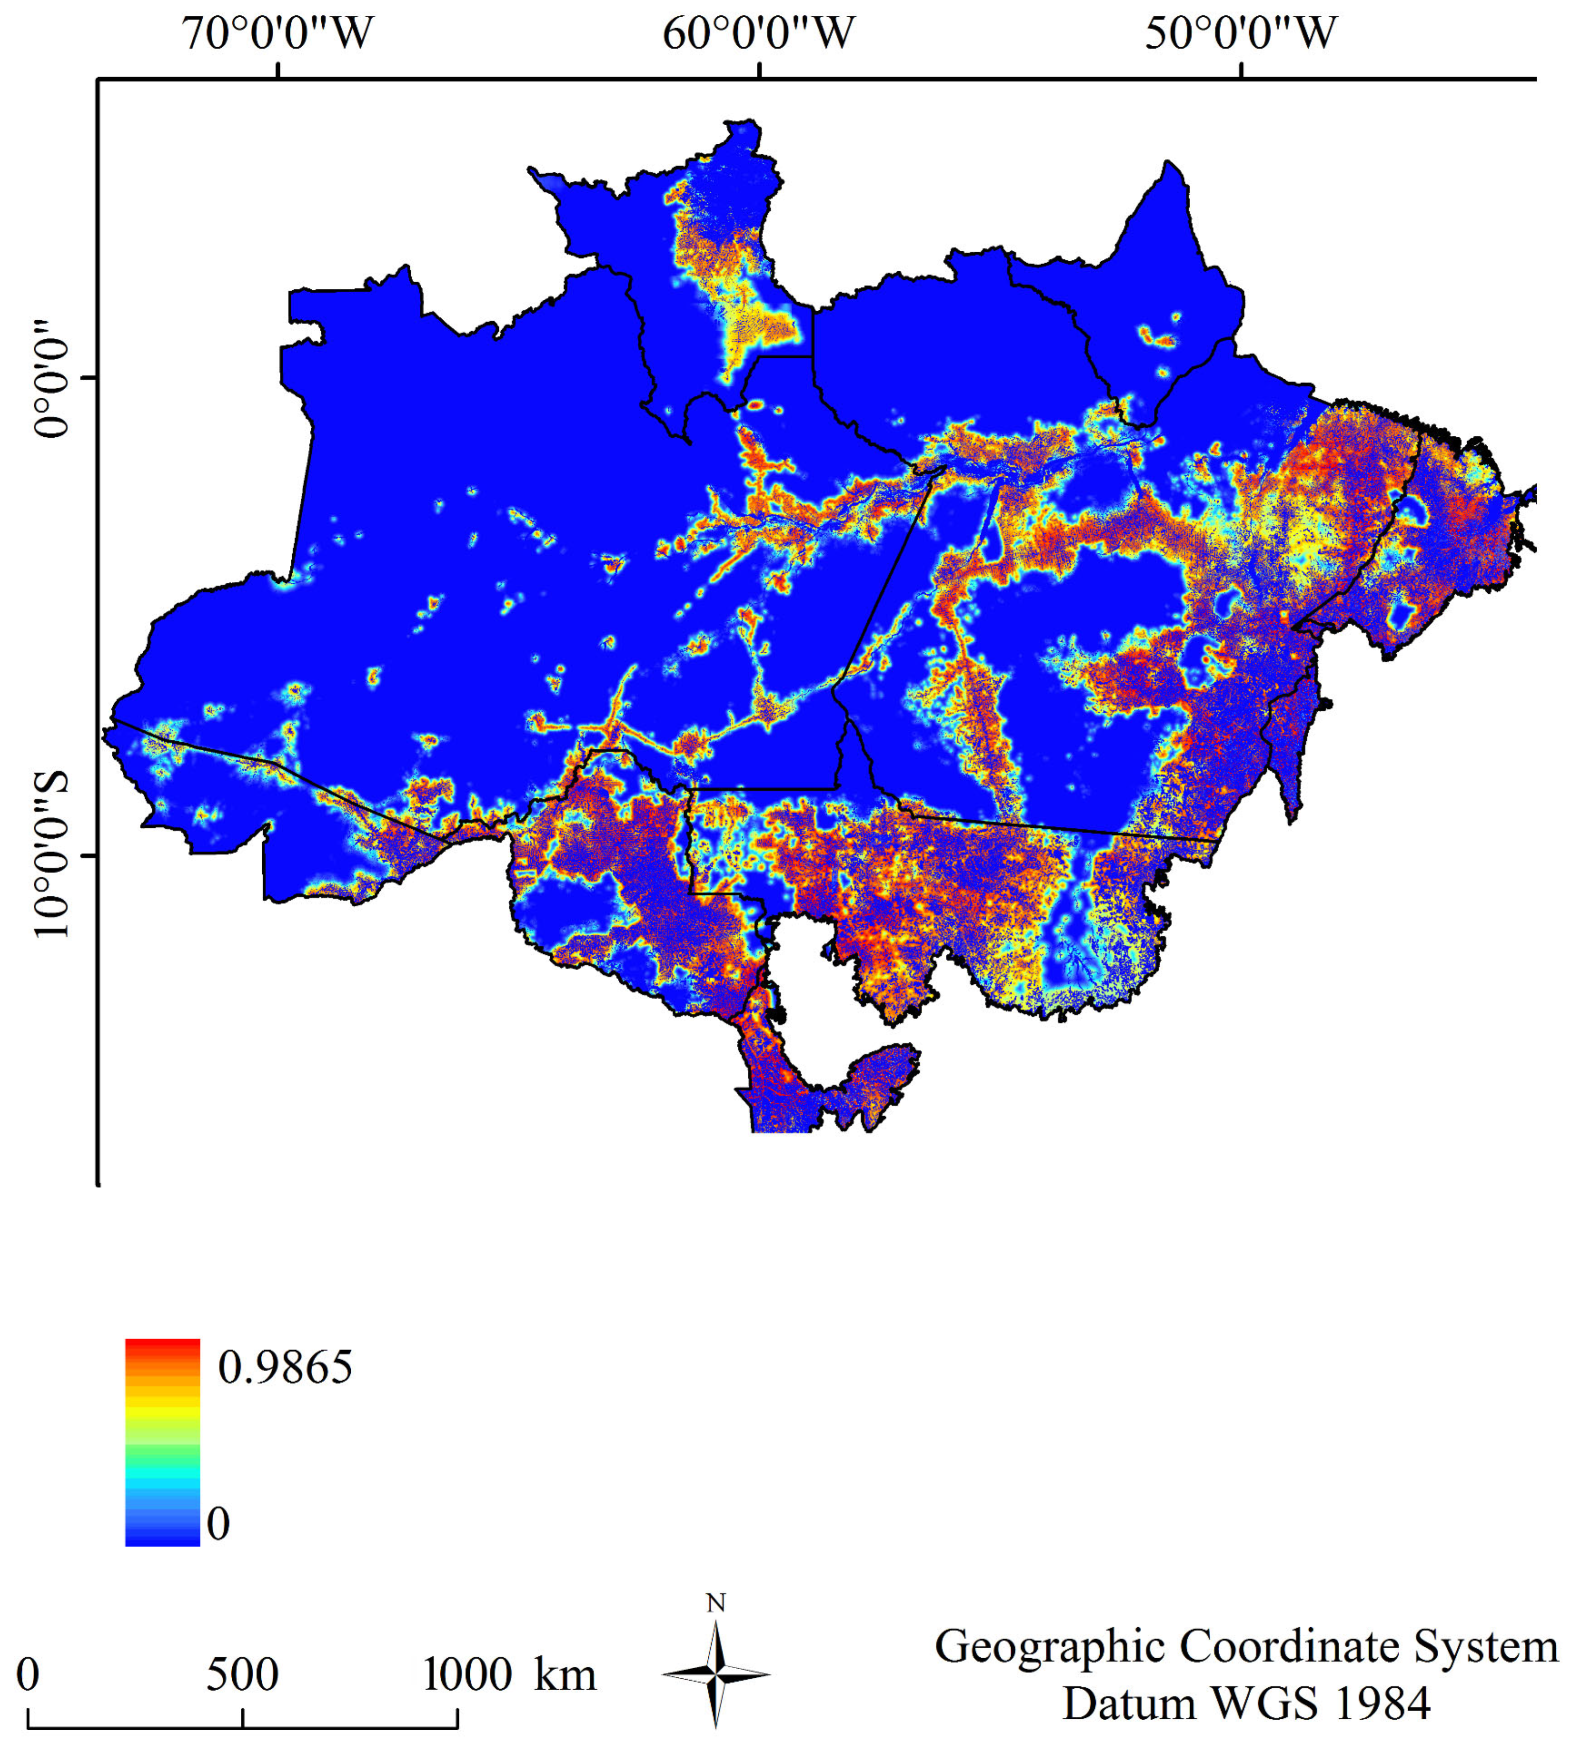
3.3. Land Use and Cover Change Analysis
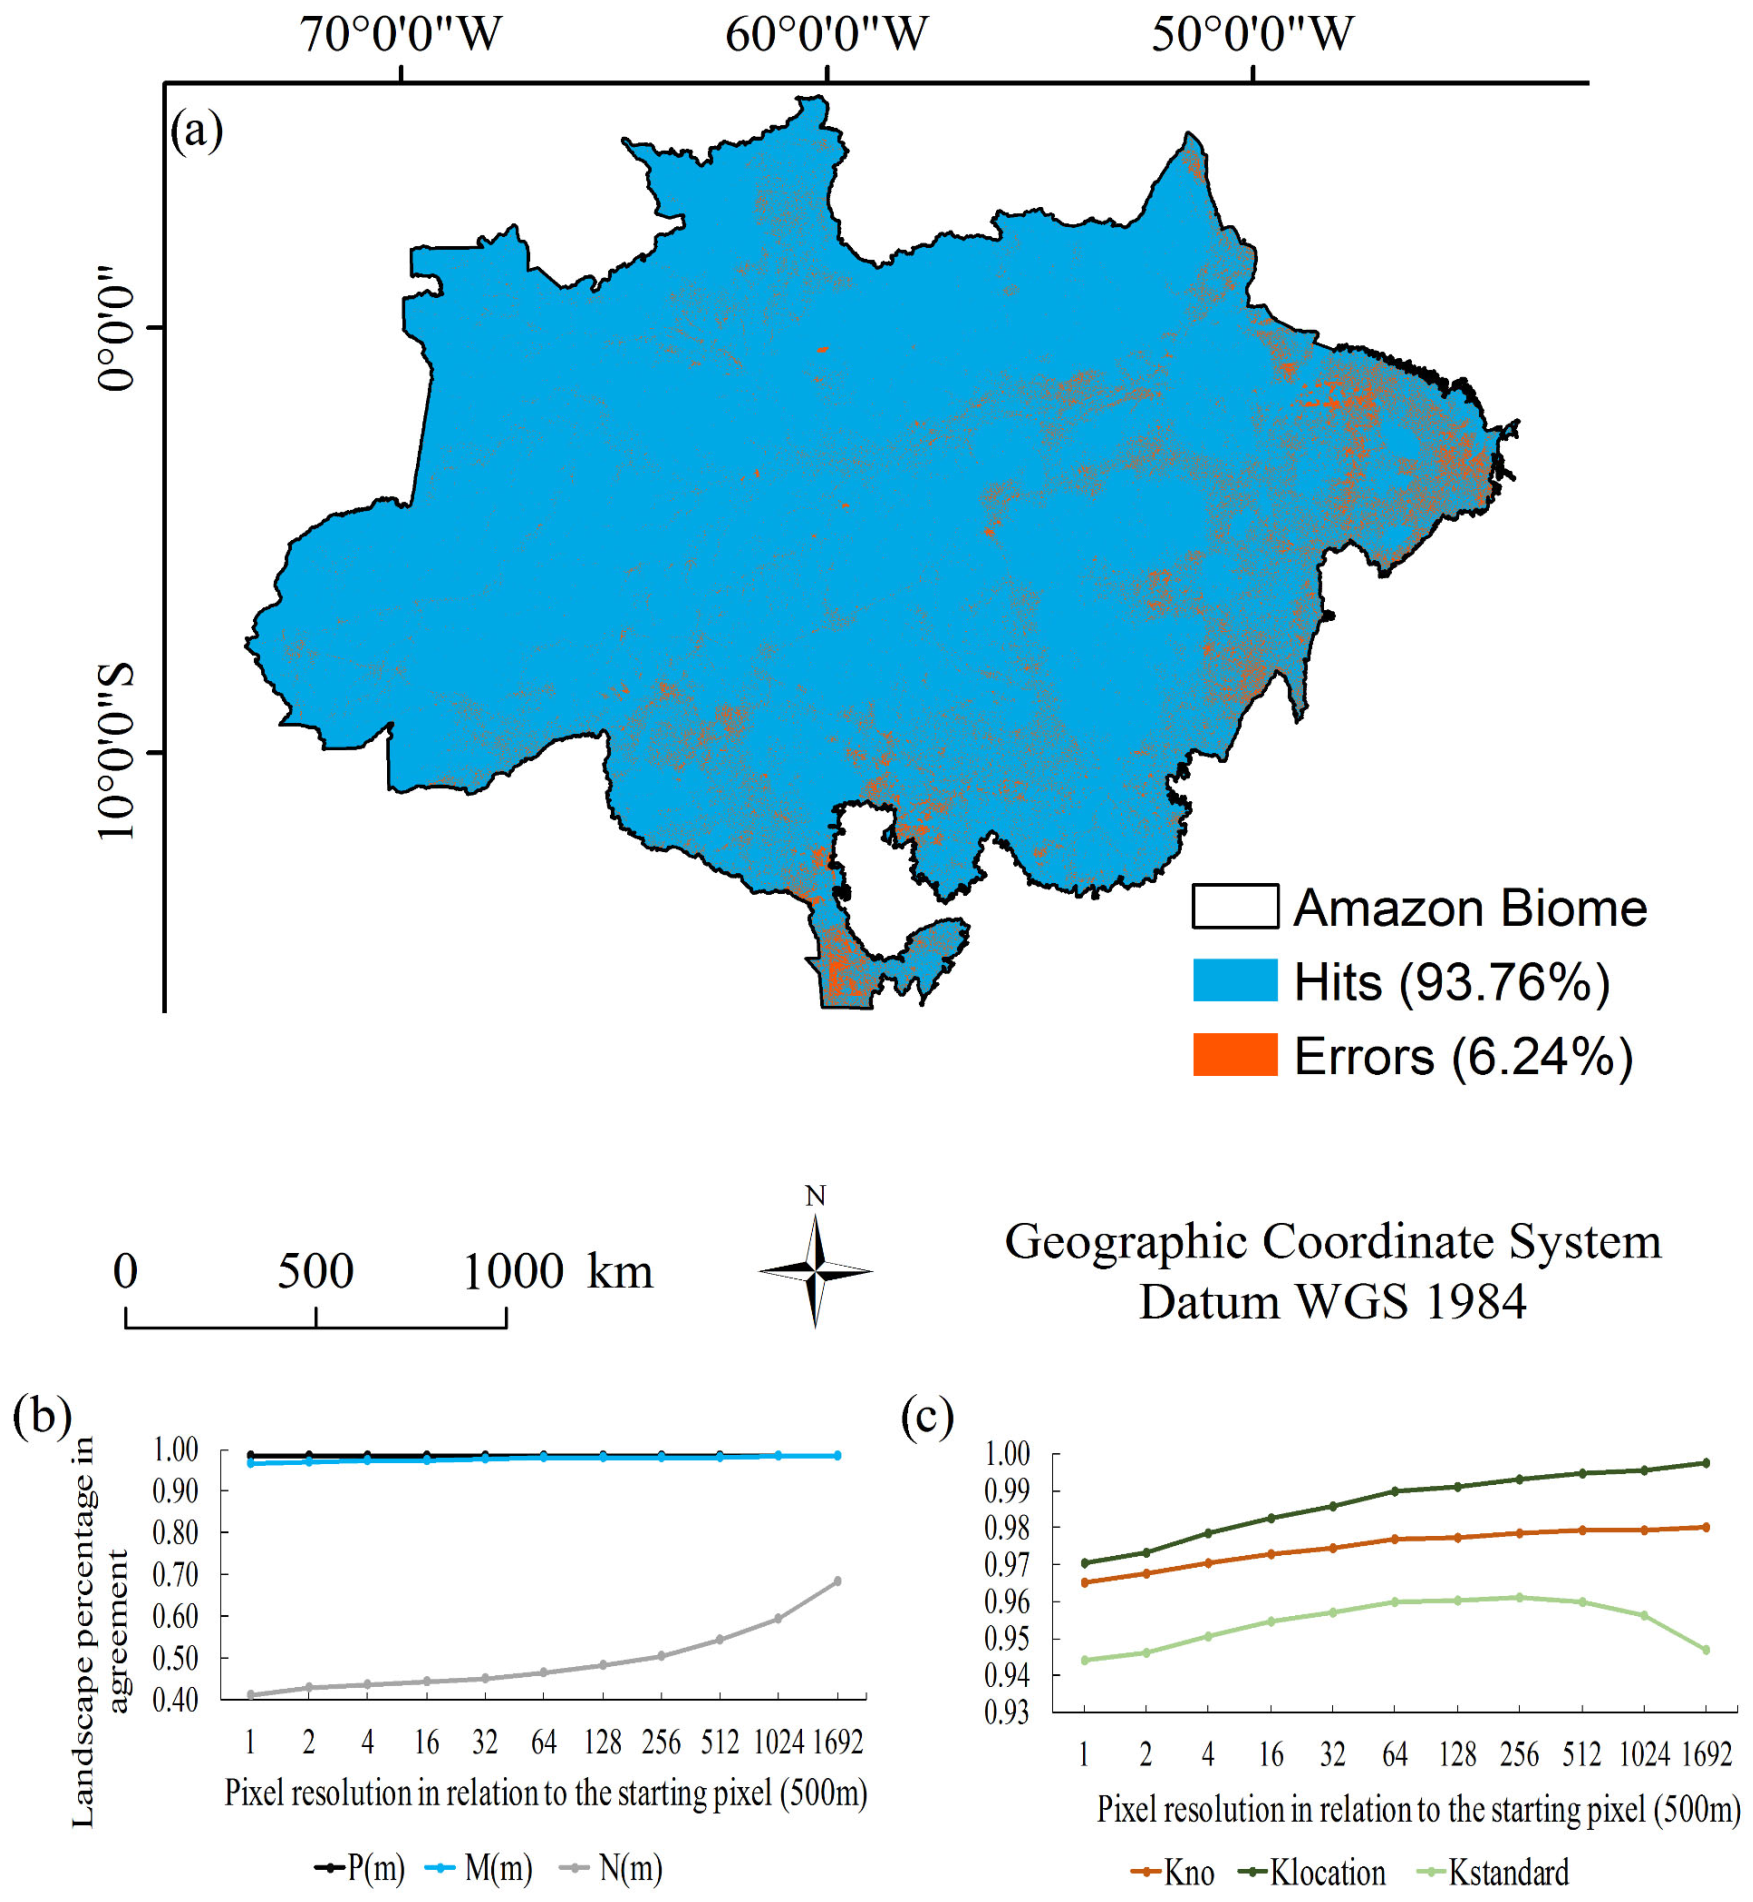
3.4. Calibration and Validation of the Potential Transition Sub-Model
3.4.1. Test and Selection of Explanatory Variables First Bullet
3.4.2. Modeling Potential Transitions through MLPNN
3.5. Modeling Land Cover Changes
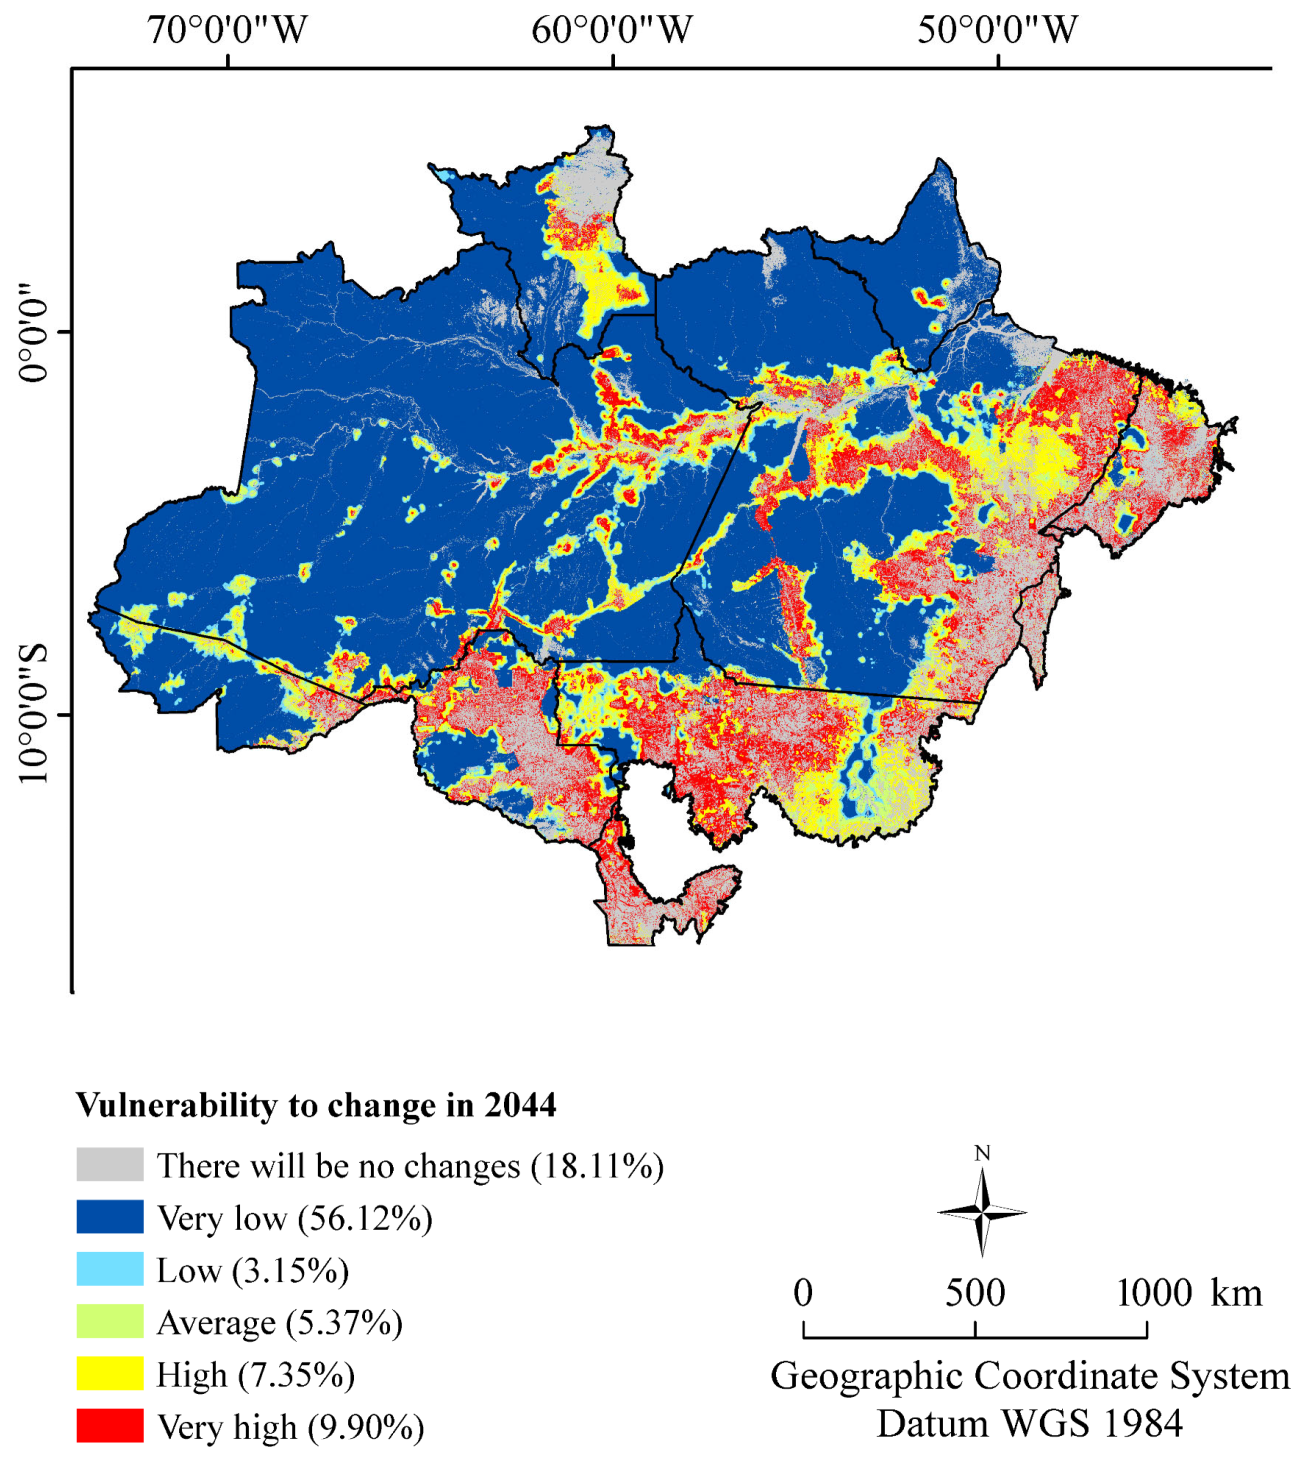
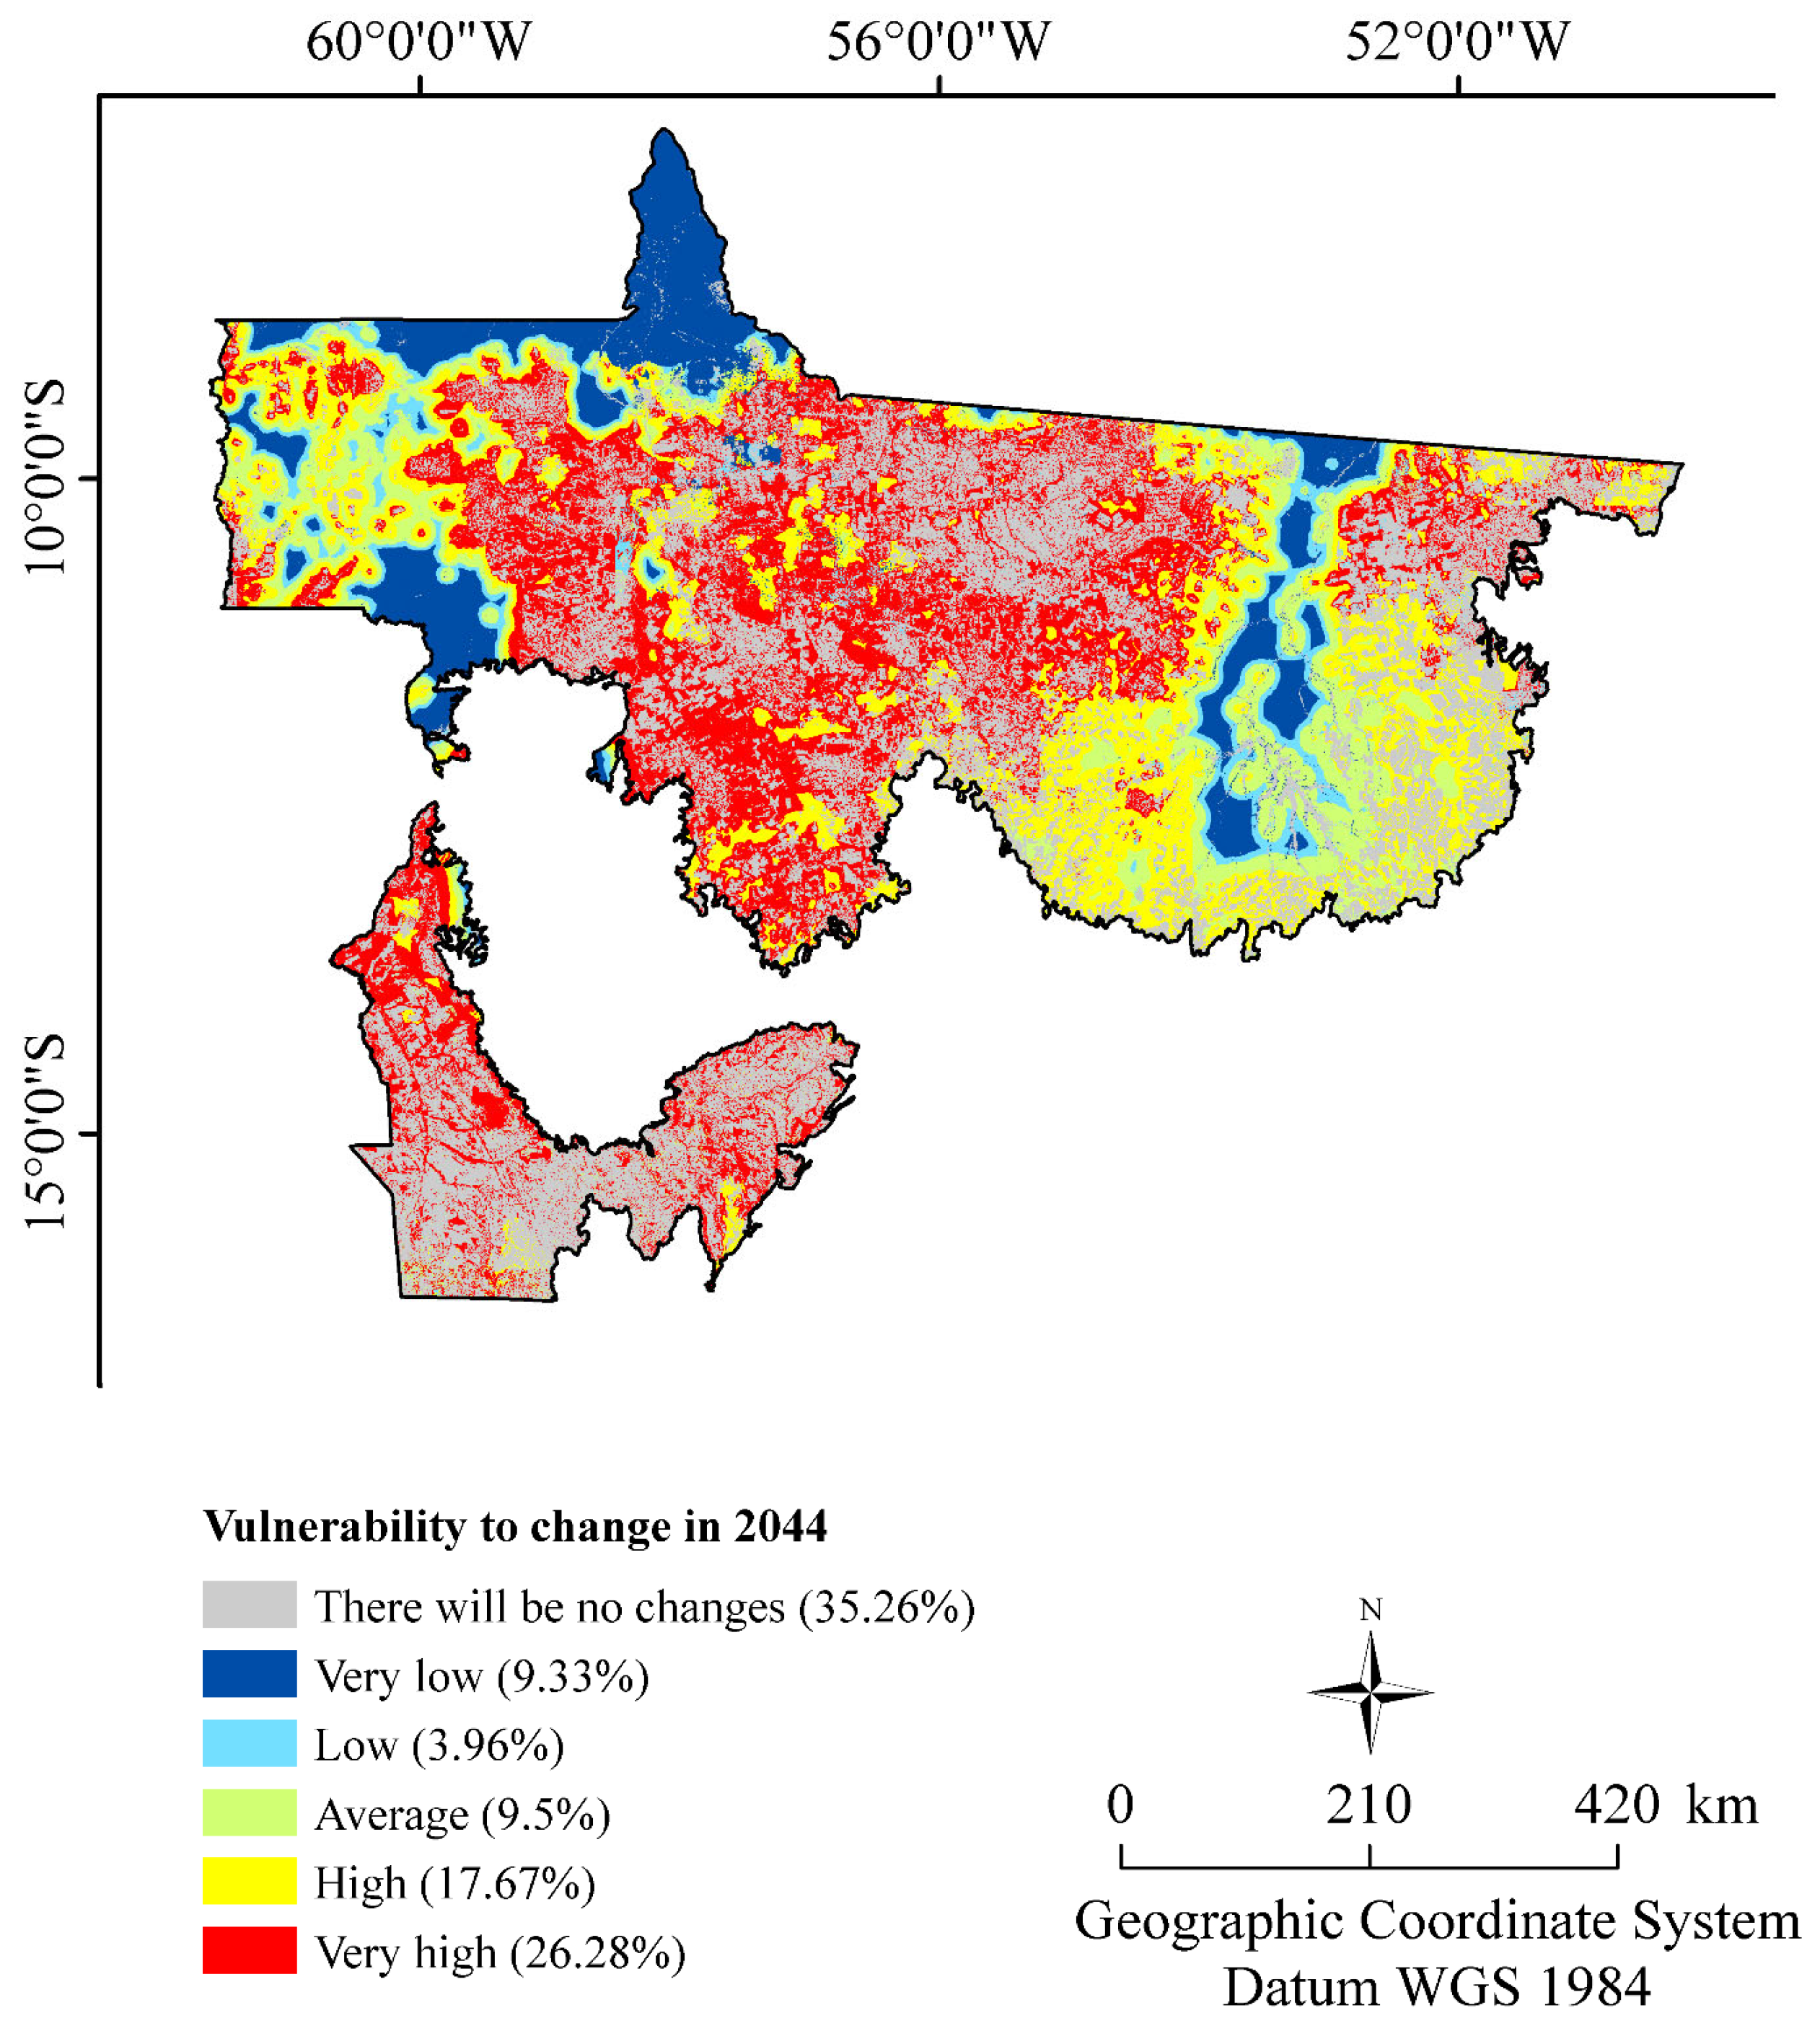
3.6. Land Cover Simulation and Future Prediction for 2044
4. Discussion
4.1. Land Use and Land Cover Dynamics
4.2. Area Gain, Loss, and Net Variation by Categories
4.3. Land Use and Land Cover Change Analysis
4.4. Calibration and Validation of the Potential Transition Sub-Model
4.5. Modeling Land Cover Changes and Simulations Validation
4.6. Land Cover Simulation and Future Prediction for 2044
5. Conclusions
Author Contributions
Funding
Data Availability Statement
Acknowledgments
Conflicts of Interest
References
- Malhi, Y.; Roberts, J.; Betts, R.; Killeen, T.; Li, W.; Nobre, C.A. Climate Change, Deforestation, and the Fate of the Amazon. Science 2008, 319, 168–172. [Google Scholar] [CrossRef] [PubMed]
- Food and Agriculture Organization of the United Nations (FAO). Global Forest Resources Assessment 2010; FAO: Rome, Italy, 2010. [Google Scholar]
- Rocha, H.R.; Goulden, M.L.; Miller, S.D.; Menton, M.C.; Pinto, L.D.V.O.; de Freitas, H.C.; e Silva Figueira, A.M. Seasonality of Water and Heat Fluxes over a Tropical Forest in Eastern Amazonia. Ecol. Appl. 2004, 14, 22–32. [Google Scholar] [CrossRef]
- da Silveira, L.G.T.; Correia, F.W.S.; Chou, S.C.; Lyra, A.; Gomes, W.B.; Vergasta, L.; Silva, P.R.T. Reciclagem de Precipitação e Desflorestamento Na Amazônia: Um Estudo de Modelagem Numérica. Rev. Bras. Meteorol. 2017, 32, 417–432. [Google Scholar] [CrossRef]
- Escobar, H. Amazon Fires Clearly Linked to Deforestation, Scientists Say. Science 2019, 365, 853. [Google Scholar] [CrossRef]
- Clerici, N.; Paracchini, M.L.; Maes, J. Land-Cover Change Dynamics and Insights into Ecosystem Services in European Stream Riparian Zones. Ecohydrol. Hydrobiol. 2014, 14, 107–120. [Google Scholar] [CrossRef]
- Stellmes, M.; Röder, A.; Udelhoven, T.; Hill, J. Mapping Syndromes of Land Change in Spain with Remote Sensing Time Series, Demographic and Climatic Data. Land Use Policy 2013, 30, 685–702. [Google Scholar] [CrossRef]
- Delazeri, L. Determinantes Do Desmatamento Nos Municípios Do Arco Verde—Amazônia Legal: Uma Abordagem Econométrica. Rev. Econ. Ens. 2016, 30, 11–34. [Google Scholar] [CrossRef]
- Santos, M.L.V.; Santos, E.N.; Filho, J.T.S. O Rio Paraíba Do Sul e o Abastecimento No Estado Do Rio de Janeiro. Semioses 2016, 9, 36–42. [Google Scholar] [CrossRef]
- Santos, T.; Filho, V.; Rocha, V.; Menezes, J. Os Impactos Do Desmatamento e Queimadas de Origem Antrópica Sobre o Clima Da Amazônia Brasileira: Um Estudo de Revisão. Rev. Geogr. Acad. 2017, 11, 157–181. [Google Scholar]
- da Silva Cruz, J.; Blanco, C.J.C.; de Oliveira Júnior, J.F. Modeling of Land Use and Land Cover Change Dynamics for Future Projection of the Amazon Number Curve. Sci. Total Environ. 2022, 811, 152348. [Google Scholar] [CrossRef]
- de Almeida, C.A.; Coutinho, A.C.; Esquerdo, J.C.D.M.; Adami, M.; Venturieri, A.; Diniz, C.G.; Dessay, N.; Durieux, L.; Gomes, A.R. High Spatial Resolution Land Use and Land Cover Mapping of the Brazilian Legal Amazon in 2008 Using Landsat-5/TM and MODIS Data. Acta Amaz. 2016, 46, 291–302. [Google Scholar] [CrossRef]
- Ribeiro, M.P.; de Mello, K.; Valente, R.A. How Can Forest Fragments Support Protected Areas Connectivity in an Urban Landscape in Brazil? Urban For. Urban Green. 2022, 74, 127683. [Google Scholar] [CrossRef]
- INPE—Instituto Nacional de Pesquisas Espaciais—Instituto Nacional de Pesquisas Espaciais. Available online: https://www.gov.br/inpe/pt-br (accessed on 3 April 2023).
- Verburg, P.H. Simulating Feedbacks in Land Use and Land Cover Change Models. Landsc. Ecol. 2006, 21, 1171–1183. [Google Scholar] [CrossRef]
- Pontius, R.G.; Cornell, J.D.; Hall, C.A. Modeling the Spatial Pattern of Land-Use Change with GEOMOD2: Application and Validation for Costa Rica. Agric. Ecosyst. Environ. 2001, 85, 191–203. [Google Scholar] [CrossRef]
- Veldkamp, A.; Verburg, P. Modelling Land Use Change and Environmental Impact. J. Environ. Manag. 2004, 72, 1–3. [Google Scholar] [CrossRef]
- Tariq, A.; Yan, J.; Mumtaz, F. Land Change Modeler and CA-Markov Chain Analysis for Land Use Land Cover Change Using Satellite Data of Peshawar, Pakistan. Phys. Chem. Earth Parts A/B/C 2022, 128, 103286. [Google Scholar] [CrossRef]
- Asuquo Enoh, M.; Ebere Njoku, R.; Chinenye Okeke, U. Modeling and Mapping the Spatial–Temporal Changes in Land Use and Land Cover in Lagos: A Dynamics for Building a Sustainable Urban City. Adv. Space Res. 2022, in press. [Google Scholar] [CrossRef]
- Ibarra-Bonilla, J.S.; Villarreal-Guerrero, F.; Prieto-Amparán, J.A.; Santellano-Estrada, E.; Pinedo-Alvarez, A. Characterizing the Impact of Land-Use/Land-Cover Changes on a Temperate Forest Using the Markov Model. Egypt. J. Remote Sens. Space Sci. 2021, 24, 1013–1022. [Google Scholar] [CrossRef]
- Instituto Brasileiro de Florestas—IBF Bioma Amazônico. Available online: https://ainfo.cnptia.embrapa.br/digital/bitstream/item/157638/1/TCC-EMANOELLE.pdf (accessed on 26 March 2023).
- Marcon, J.L.; Menin, M.; Araújo, M.G.P.H. Biodiversidade Amazônica: Caracterização, Ecologia e Conservação, 1st ed.; EDUA: Manaus, Brazil, 2012. [Google Scholar]
- Higuchi, M.I.G.; Higuchi, N. A Floresta Amazônica e Suas Múltiplas Dimensões: Uma Proposta de Educação Ambiental; INPA: Manaus, Brazil, 2004. [Google Scholar]
- Köppen, W.; Geiger, R. Das Geographische System Der Klimate; Fünf Bänden: Berlin, Germany, 1936. [Google Scholar]
- Cerqueira, J.L.R.P. Estudo Radiometeorológico Da Região Amazônica. Ph.D. Thesis, Universidade Católica do Rio de Janeiro, Rio de Janeiro, Brazil, 2006. [Google Scholar]
- Ministério do Meio Ambiente—MMA Mapa de Cobertura Vegetal. Available online: https://www.gov.br/mma/pt-br/noticias/mma-lanca-mapas-de-cobertura-vegetal-nativa-dos-biomas-brasileiros (accessed on 3 April 2023).
- Mapbiomas Brasil. Available online: https://mapbiomas.org/colecoes-mapbiomas-1?cama_set_language=pt-BR (accessed on 10 December 2019).
- Mapbiomas Brasil. Available online: https://mapbiomas.org/visao-geral-da-metodologia (accessed on 3 April 2023).
- de Faria, A.S. Detecção Automática de Desmatamentos No Bioma Cerrado: Desafios Para o Monitoramento Sistemático. 2018. Available online: http://lattes.cnpq.br/1330010506093920 (accessed on 3 April 2023).
- Bonanomi, J.; Tortato, F.R.; Gomes, R.d.S.R.; Penha, J.M.; Bueno, A.S.; Peres, C.A. Protecting Forests at the Expense of Native Grasslands: Land-Use Policy Encourages Open-Habitat Loss in the Brazilian Cerrado Biome. Perspect. Ecol. Conserv. 2019, 17, 26–31. [Google Scholar] [CrossRef]
- Plataforma—Google Earth Engine. Available online: https://earthengine.google.com/platform/ (accessed on 3 April 2023).
- As Projeções Cartográficas. Available online: https://atlasescolar.ibge.gov.br/conceitos-gerais/o-que-e-cartografia/as-projec-o-es-cartogra-ficas.html (accessed on 3 April 2023).
- ESRI Environmental Systems Research Institute. Redlands, Califórnia, USA. ArcGIS® Desktop: Release 10.3, License Type ArcInfo 2015. Available online: https://enterprise.arcgis.com/en/portal/10.3/use/copyright-information.htm (accessed on 14 February 2020).
- ICMBio—Instituto Chico Mendes de Conservação Da Biodiversidade. Available online: https://www.gov.br/icmbio/pt-br (accessed on 30 March 2023).
- Agência Nacional de Águas e Saneamento Básico (ANA). Available online: https://www.gov.br/ana/pt-br (accessed on 31 March 2023).
- Shuttle Radar Topography Mission. Available online: https://www2.jpl.nasa.gov/srtm/mission.htm (accessed on 30 March 2023).
- Weber, E.; Hasenack, H.; Ferreira, C.J. Adaptação Do Modelo Digital de Elevação Do SRTM Para o Sistema de Referência Oficial Brasileiro e Recorte Por Unidade Da Federação; UFRGS Centro de Ecologia: Porto Alegre, Brazil, 2004; ISBN 978-85-63843-02-9. [Google Scholar]
- Merra-2. Available online: https://gmao.gsfc.nasa.gov/reanalysis/MERRA-2/ (accessed on 30 March 2023).
- TerrSet—IDRISI Agora é TerrSet!—Sobre o TerrSet. Available online: http://www.terrset.com.br/index.php/terrset (accessed on 2 April 2023).
- Saga System for Automated Geoscientific Analyses. Available online: https://saga-gis.sourceforge.io/en/index.html (accessed on 2 April 2023).
- Mishra, V.N.; Rai, P.K.; Prasad, R.; Punia, M.; Nistor, M.-M. Prediction of Spatio-Temporal Land Use/Land Cover Dynamics in Rapidly Developing Varanasi District of Uttar Pradesh, India, Using Geospatial Approach: A Comparison of Hybrid Models. Appl. Geomat. 2018, 10, 257–276. [Google Scholar] [CrossRef]
- Cramer’s V—StatsTest.Com. Available online: https://www.statstest.com/cramers-v-2/ (accessed on 3 April 2023).
- Cramér’s V—Beginners Tutorial. Available online: https://www.spss-tutorials.com/cramers-v-what-and-why/ (accessed on 3 April 2023).
- Eastman, J.R. Idrisi Taiga Tutorial. Available online: https://clarklabs.org/ (accessed on 20 March 2017).
- Pontius Junior, R.G.; Huffaker, D.; Denman, K. Useful Techniques of Validation for Spatially Explicit Land-Change Models. Ecol. Modell. 2004, 179, 445–461. [Google Scholar] [CrossRef]
- Munthali, M.G.; Mustak, S.; Adeola, A.; Botai, J.; Singh, S.K.; Davis, N. Modelling Land Use and Land Cover Dynamics of Dedza District of Malawi Using Hybrid Cellular Automata and Markov Model. Remote Sens. Appl. Soc. Environ. 2020, 17, 100276. [Google Scholar] [CrossRef]
- Beroho, M.; Briak, H.; Cherif, E.K.; Boulahfa, I.; Ouallali, A.; Mrabet, R.; Kebede, F.; Bernardino, A.; Aboumaria, K. Future Scenarios of Land Use/Land Cover (LULC) Based on a CA-Markov Simulation Model: Case of a Mediterranean Watershed in Morocco. Remote Sens. 2023, 15, 1162. [Google Scholar] [CrossRef]
- Land Change Modeler in TerrSet. Available online: https://clarklabs.org/terrset/land-change-modeler/ (accessed on 6 April 2023).
- Paegelow, M.; Olmedo, M.T.C. (Eds.) Modelling Environmental Dynamics; Environmental Science and Engineering; Springer: Berlin/Heidelberg, Germany, 2008; ISBN 978-3-540-68489-3. [Google Scholar]
- Eastman, J.R. TerrSet Geospatial Monitoring and Modeling System: Manual; Clark University: Worcester, MA, USA, 2016. [Google Scholar]
- de Melo Ferreira, E.; de Paula Andraus, M.; Cardoso, A.A.; dos Santos Costa, L.F.; Lôbo, L.M.; Leandro, W.M. Recuperação de Áreas Degradadas, Adubação Verde e Qualidade Da Água. Rev. Monogr. Ambient. 2016, 15, 228–246. [Google Scholar] [CrossRef]
- Mondal, M.S.; Sharma, N.; Garg, P.K.; Kappas, M. Statistical Independence Test and Validation of CA Markov Land Use Land Cover (LULC) Prediction Results. Egypt. J. Remote Sens. Space Sci. 2016, 19, 259–272. [Google Scholar] [CrossRef]
- Baker, W.L. A Review of Models of Landscape Change. Landsc. Ecol. 1989, 2, 111–133. [Google Scholar] [CrossRef]
- Fu, X.; Wang, X.; Yang, Y.J. Deriving Suitability Factors for CA-Markov Land Use Simulation Model Based on Local Historical Data. J. Environ. Manag. 2018, 206, 10–19. [Google Scholar] [CrossRef]
- Labs, C. Land Change Modeler for ArcGIS Software Extension (2.0). Available online: clarklabs.org/support/lcm-for-arcgis (accessed on 6 April 2023).
- Luiz, C.H.P. Modelagem Da Cobertura Da Terra e Análise Da Influência Do Reflorestamento Na Transformação Da Paisagem: Bacia Do Rio Piracicaba e Região Metropolitana Do Vale Do Aço; Universidade Federal de Minas Gerais: Belo Horizonte, Brazil, 2014. [Google Scholar]
- Cabral, A.I.R.; Saito, C.; Pereira, H.; Laques, A.E. Deforestation Pattern Dynamics in Protected Areas of the Brazilian Legal Amazon Using Remote Sensing Data. Appl. Geogr. 2018, 100, 101–115. [Google Scholar] [CrossRef]
- Nascimento, N.; West, T.A.P.; Börner, J.; Ometto, J. What Drives Intensification of Land Use at Agricultural Frontiers in the Brazilian Amazon? Evidence from a Decision Game. Forests 2019, 10, 464. [Google Scholar] [CrossRef]
- Gollnow, F.; Göpel, J.; deBarros Viana Hissa, L.; Schaldach, R.; Lakes, T. Scenarios of Land-Use Change in a Deforestation Corridor in the Brazilian Amazon: Combining Two Scales of Analysis. Reg. Environ. Chang. 2018, 18, 143–159. [Google Scholar] [CrossRef]
- Kaimowitz, D.; Mertens, B.; Wunder, S.; Pablo, P. Hamburguer Connection Fuels Amazon Destruction: Cattle Ranching and Deforestation in Brazil; Center for International Forestry Research: Bogor, India, 2004; pp. 1–10. [Google Scholar]
- Vieira, I.; Toledo, P.; Silva, J.; Higuchi, H. Deforestation and Threats to the Biodiversity of Amazonia. Braz. J. Biol. 2008, 68, 949–956. [Google Scholar] [CrossRef]
- Souza, R.A.; Miziara, F.; Marco Junior, P. Spatial Variation of Deforestation Rates in the Brazilian Amazon: A Complex Theater for Agrarian Technology, Agrarian Structure and Governance by Surveillance. Land Use Policy 2013, 30, 915–924. [Google Scholar] [CrossRef]
- Navarro Rau, M.F.; Calamari, N.C.; Mosciaro, M.J. Dynamics of Past Forest Cover Changes and Future Scenarios with Implications for Soil Degradation in Misiones Rainforest, Argentina. J. Nat. Conserv. 2023, 73, 126391. [Google Scholar] [CrossRef]
- Singh Pokhariya, H. Land Use/Land Cover Change Detection and Forecasting Using GEE and Hybrid Markov-CA Model in the Nainital, a District of Uttarakhand State, India. 2023. Available online: https://www.researchsquare.com/article/rs-2452399/v1 (accessed on 6 April 2023).
- Fearnside, P.M. Desmatamento Na Amazônia: Dinâmica, Impactos e Controle. Acta Amaz. 2006, 36, 395–400. [Google Scholar] [CrossRef]
- Foley, J.A.; Asner, G.P.; Costa, M.H.; Coe, M.T.; DeFries, R.; Gibbs, H.K.; Howard, E.A.; Olson, S.; Patz, J.; Navin, R.; et al. Amazonia Revealed: Forest Degradation and Loss of Ecosystem Goods and Services in the Amazon Basin. Front. Ecol. Environ. 2007, 5, 25–32. [Google Scholar] [CrossRef]
- Brasil e Alemanha Celebram Acordos Para Proteção Do Meio Ambiente. Available online: https://www.gov.br/mma/pt-br/noticias/noticia-acom-2015-08-1075 (accessed on 12 June 2020).
- Barandier, H.; Ricardo, M. Gestão Territorial e Cidades Na Amazônia: Municípios e Seus Planos Diretores. Rev. Adm. Munic. 2018, 1, 5–11. Available online: https://pesquisa.bvsalud.org/portal/resource/pt/biblio-911202 (accessed on 4 April 2023).
- Souza-Filho, P.; Nascimento, W.; Santos, D.; Weber, E.; Silva, R.; Siqueira, J. A GEOBIA Approach for Multitemporal Land-Cover and Land-Use Change Analysis in a Tropical Watershed in the Southeastern Amazon. Remote Sens. 2018, 10, 1683. [Google Scholar] [CrossRef]
- dos Santos Silva, D.S.; Blanco, C.J.C.; dos Santos Junior, C.S.; Martins, W.L.D. Modeling of the Spatial and Temporal Dynamics of Erosivity in the Amazon. Model. Earth Syst. Environ. 2020, 6, 513–523. [Google Scholar] [CrossRef]
- Souza, C.M.; Shimbo, J.Z.; Rosa, M.R.; Parente, L.L.; Alencar, A.A.; Rudorff, B.F.T.; Hasenack, H.; Matsumoto, M.; Ferreira, L.G.; Souza-Filho, P.W.M.; et al. Reconstructing Three Decades of Land Use and Land Cover Changes in Brazilian Biomes with Landsat Archive and Earth Engine. Remote Sens. 2020, 12, 2735. [Google Scholar] [CrossRef]
- Pismel, G.O.; Marchezini, V.; Selaya, G.; de Paula, Y.A.P.; Mendoza, E.; Anderson, L.O. Wildfire Governance in a Tri-National Frontier of Southwestern Amazonia: Capacities and Vulnerabilities. Int. J. Disaster Risk Reduct. 2023, 86, 103529. [Google Scholar] [CrossRef]
- Ometto, J.P.; Sousa-Neto, E.R.; Tejada, G. Land Use, Land Cover and Land Use Change in the Brazilian Amazon (1960–2013); Springer: Berlin/Heidelberg, Germany, 2016; pp. 369–383. [Google Scholar]
- Instituto de Pesquisa Ambiental da Amazônia. Arco do Desmatamento. Available online: https://ipam.org.br/glossario/arco-do-desmatamento/ (accessed on 5 April 2023).
- Seidler, R. Biodiversity in Anthropogenically Altered Forests. In Reference Module in Life Sciences; Elsevier: Amsterdam, The Netherlands, 2023. [Google Scholar]
- de Paula, F.R.; Ruschel, A.R.; Felizzola, J.F.; Frauendorf, T.C.; de Barros Ferraz, S.F.; Richardson, J.S. Seizing Resilience Windows to Foster Passive Recovery in the Forest-Water Interface in Amazonian Lands. Sci. Total Environ. 2022, 828, 154425. [Google Scholar] [CrossRef] [PubMed]
- Inpe/Notícias—Resiliência Das Florestas Tropicais Às Mudanças Climáticas Pode Ser Maior, Diz Estudo. Available online: http://www.inpe.br/noticias/noticia.php?Cod_Noticia=3232 (accessed on 3 April 2023).
- Boulton, C.A.; Lenton, T.M.; Boers, N. Pronounced Loss of Amazon Rainforest Resilience since the Early 2000s. Nat. Clim. Change 2022, 12, 271–278. [Google Scholar] [CrossRef]
- Diniz, M.B.; Diniz, M.J.T. Exploração Dos Recursos Da Biodiversidade Da Amazônia Legal: Uma Avaliação Com Base Na Abordagem Do Sistema Nacional/Regional de Inovação. Redes 2018, 23, 210. [Google Scholar] [CrossRef]
- Domingues, M.S.; Bermann, C. O Arco de Desflorestamento Na Amazônia: Da Pecuária à Soja. Ambient. Soc. 2012, 15, 1–22. [Google Scholar] [CrossRef]
- Silva-Junior, C.H.L.; Silva, F.B.; Arisi, B.M.; Mataveli, G.; Pessôa, A.C.M.; Carvalho, N.S.; Reis, J.B.C.; Silva Júnior, A.R.; Motta, N.A.C.S.; e Silva, P.V.M.; et al. Brazilian Amazon Indigenous Territories under Deforestation Pressure. Sci. Rep. 2023, 13, 5851. [Google Scholar] [CrossRef]
- da Silva, R.M.; Lopes, A.G.; Santos, C.A.G. Deforestation and Fires in the Brazilian Amazon from 2001 to 2020: Impacts on Rainfall Variability and Land Surface Temperature. J. Environ. Manag. 2023, 326, 116664. [Google Scholar] [CrossRef]
- Ali, M.J.; Varshney, D. Spatial Modelling of Urban Growth and Urban Influence. Environ. Urban. ASIA 2012, 3, 255–275. [Google Scholar] [CrossRef]
- Jakimow, B.; Griffiths, P.; van der Linden, S.; Hostert, P. Mapping Pasture Management in the Brazilian Amazon from Dense Landsat Time Series. Remote Sens. Environ. 2018, 205, 453–468. [Google Scholar] [CrossRef]
- Carmenta, R.; Vermeylen, S.; Parry, L.; Barlow, J. Shifting Cultivation and Fire Policy: Insights from the Brazilian Amazon. Hum. Ecol. 2013, 41, 603–614. [Google Scholar] [CrossRef]
- Aragao, L.E.O.C.; Shimabukuro, Y.E. The Incidence of Fire in Amazonian Forests with Implications for REDD. Science 2010, 328, 1275–1278. [Google Scholar] [CrossRef]
- Amigo, I. When Will the Amazon Hit a Tipping Point? Nature 2020, 578, 505–507. [Google Scholar] [CrossRef]
- Brasil Lei N° 6.938, de 31 de Agosto de 1981. 1981. Available online: http://www.planalto.gov.br/ccivil_03/leis/l6938.htm/ (accessed on 26 April 2023).
- Brasil Lei N° 9.985, de 18 de Julho de 2000. Available online: http://www.planalto.gov.br/ccivil_03/leis/l9985.htm// (accessed on 26 April 2023).
- Inpe/Msa. Available online: http://www.inpe.br/msa/projetos.php (accessed on 5 April 2023).


| Explanatory Variables | Units |
|---|---|
| Altitude | m |
| Slope | % |
| Annual Average Precipitation | mm |
| Distance from Highways | m |
| Distance from Water Courses | m |
| Distance from Urban Infrastructure | m |
| Distance from Pasture | m |
| Distance of Annual and Perennial Culture | m |
| Distance from Semi-Perennial Culture | m |
| Distance from Agriculture and Pasture Mosaic | m |
| Distance from Mining | m |
| Distance from Protected Areas | m |
| Distance from Change Areas | m |
| Change Vulnerability Percentage | Vulnerability to Change |
|---|---|
| 0% | There will be no change |
| 0%–5% | Very low vulnerability to change |
| 5%–15% | Low vulnerability to change |
| 15%–50% | Medium vulnerability to change |
| 50%–80% | High vulnerability to change |
| 80%–100% | Very high vulnerability to change |
| 1985 | 2014 | 2017 | ||||
|---|---|---|---|---|---|---|
| Classes | Area (km2) | % | Area (km2) | % | Area (km2) | % |
| Forest Formation | 3,844,800.75 | 91.20 | 3,452,129.25 | 81.89 | 3,482,721.50 | 82.61 |
| Savanna Formation | 4708.50 | 0.11 | 4804.50 | 0.11 | 3060.25 | 0.07 |
| Mangrove | 7234.25 | 0.17 | 7510.25 | 0.18 | 6827.50 | 0.16 |
| Planted Forest | 25.00 | 0.00 | 305.25 | 0.01 | 438.00 | 0.01 |
| Non-Forest Natural Formation | 0.50 | 0.00 | 0.00 | 0.00 | 0.00 | 0.00 |
| Grassland Formation | 3340.75 | 0.08 | 5573.75 | 0.13 | 3574.25 | 0.08 |
| Salt Flat | 139.25 | 0.00 | 283.00 | 0.01 | 401.75 | 0.01 |
| Other Non-Forest Natural Formation | 117,054.50 | 2.78 | 110,970.75 | 2.63 | 114,915.75 | 2.73 |
| Pasture | 71,046.50 | 1.69 | 437,670.00 | 10.38 | 375,159.50 | 8.90 |
| Annual and Perennial Culture | 793.25 | 0.02 | 41,232.50 | 0.98 | 44,500.50 | 1.06 |
| Semi-Perennial Culture | 0.00 | 0.00 | 709.00 | 0.02 | 608.75 | 0.01 |
| Mosaic of Agriculture and Pasture | 58,849.75 | 1.40 | 33,311.75 | 0.79 | 69,413.25 | 1.65 |
| Urban infrastructure | 1939.75 | 0.05 | 2798.50 | 0.07 | 2781.25 | 0.07 |
| Mining | 13.25 | 0.00 | 119.00 | 0.00 | 146.75 | 0.00 |
| Beach and Dune | 31.00 | 0.00 | 53.50 | 0.00 | 43.00 | 0,00 |
| Other Non-Vegetated Area | 6299.25 | 0.15 | 3079.25 | 0.07 | 3316.50 | 0.08 |
| Water bodies | 6.00 | 0.00 | 0.00 | 0.00 | 8.25 | 0.00 |
| River, Lake, and Ocean | 99,112.25 | 2.35 | 114,814.50 | 2.72 | 107,465.25 | 2.55 |
| Not observed | 53.75 | 0.00 | 160.75 | 0.00 | 57.75 | 0.00 |
| No Data | 195.00 | 0.00 | 117.75 | 0.00 | 203.50 | 0. 00 |
| Total | 4,215,643.25 | 100 | 4,215,643.25 | 100 | 4,215,643.25 | 100 |
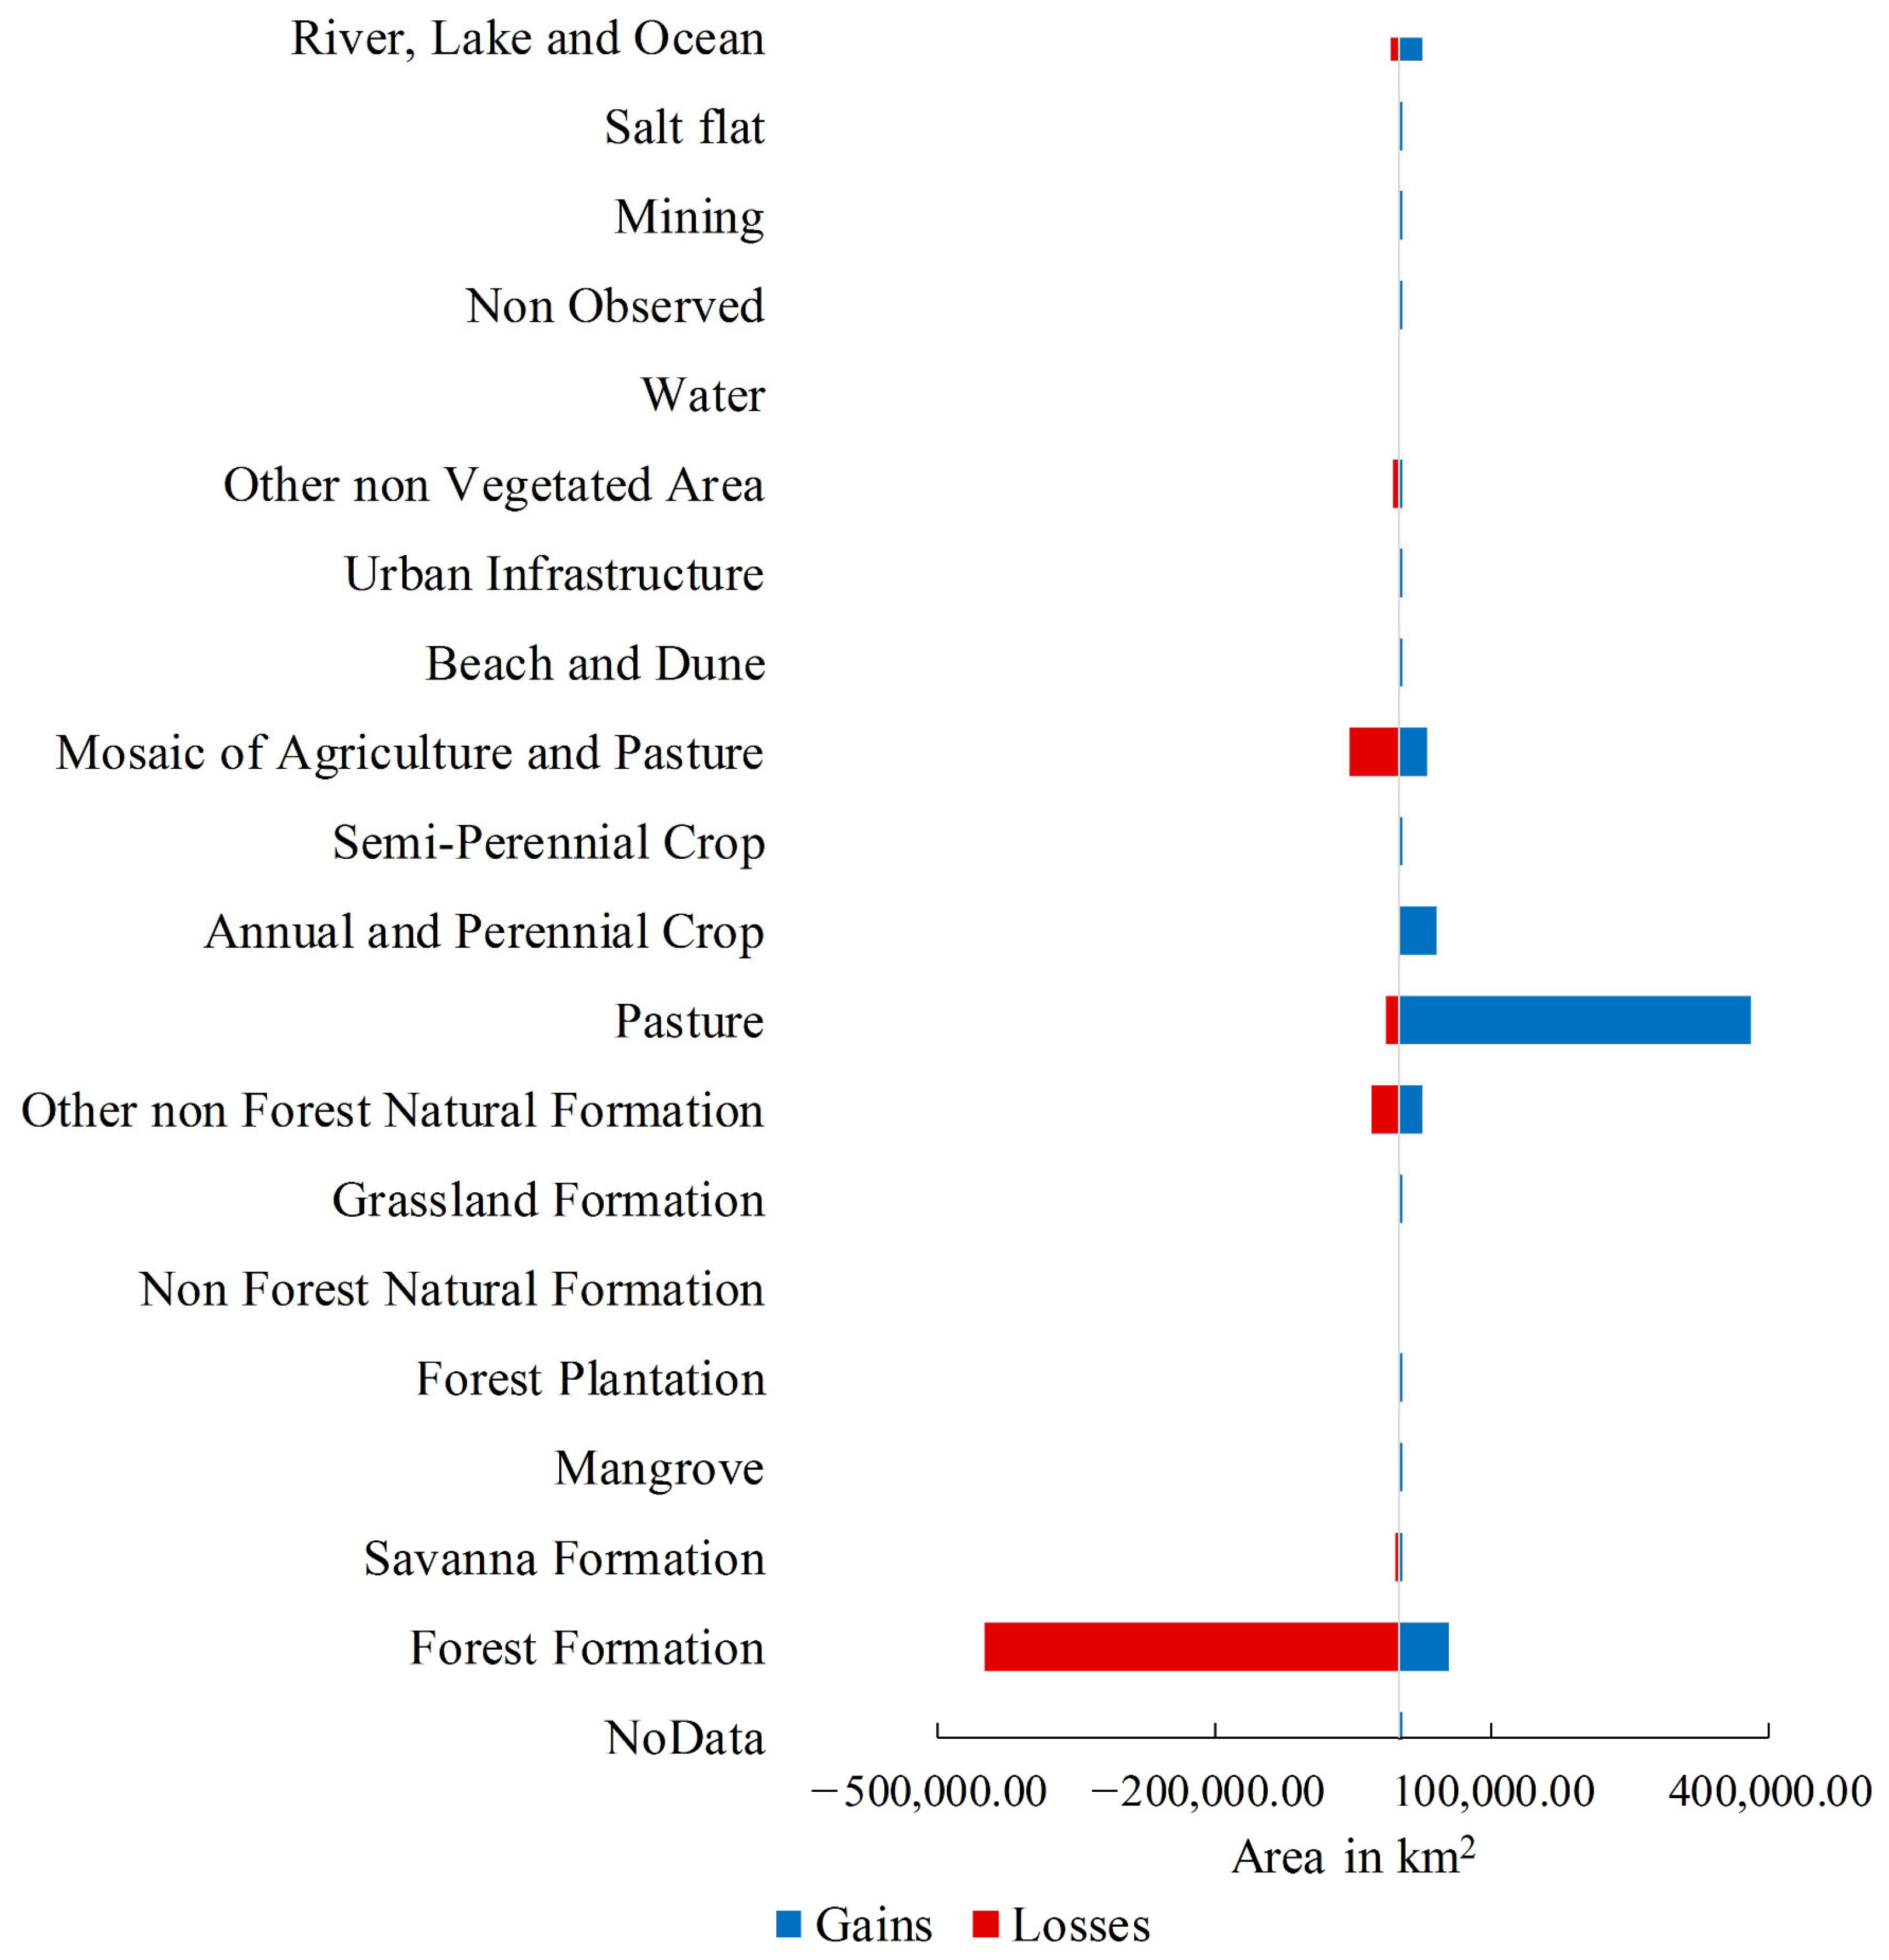
| Classes | Losses (km2) | Gains (km2) | Classes | Losses (km2) | Gains (km2) |
|---|---|---|---|---|---|
| No Data | −115.75 | 38.50 | Semi-Perennial Crop | 0.00 | 709.00 |
| Forest Formation | −447,377.00 | 54,705.50 | Mosaic of Agriculture and Pasture | −54,230.25 | 28,692.25 |
| Savana Formation | −3517.50 | 3613.50 | Beach and Dune | −18.25 | 40.75 |
| Mangrove | −1290.25 | 1566.25 | Urban Infrastructure | −306.25 | 1165.00 |
| Forest Plantation | −22.50 | 302.75 | Other Non-Vegetated Area | −6087.75 | 2867.75 |
| Non-Forest Natural Formation | −0.50 | 0.00 | Water | −6.00 | 0.00 |
| Grassland Formation | −1526.26 | 3759.25 | Non-Observed | −33.25 | 140.25 |
| Other Non-Forest Natural Formation | −31,115.25 | 25,031.50 | Mining | −10.50 | 116.25 |
| Pasture | −14,762.75 | 381,386.25 | Salt flat | −103.50 | 247.25 |
| Annual and Perennial Crop | −167.50 | 40,606.75 | River, Lake, and Ocean | −9566.50 | 25,268.75 |
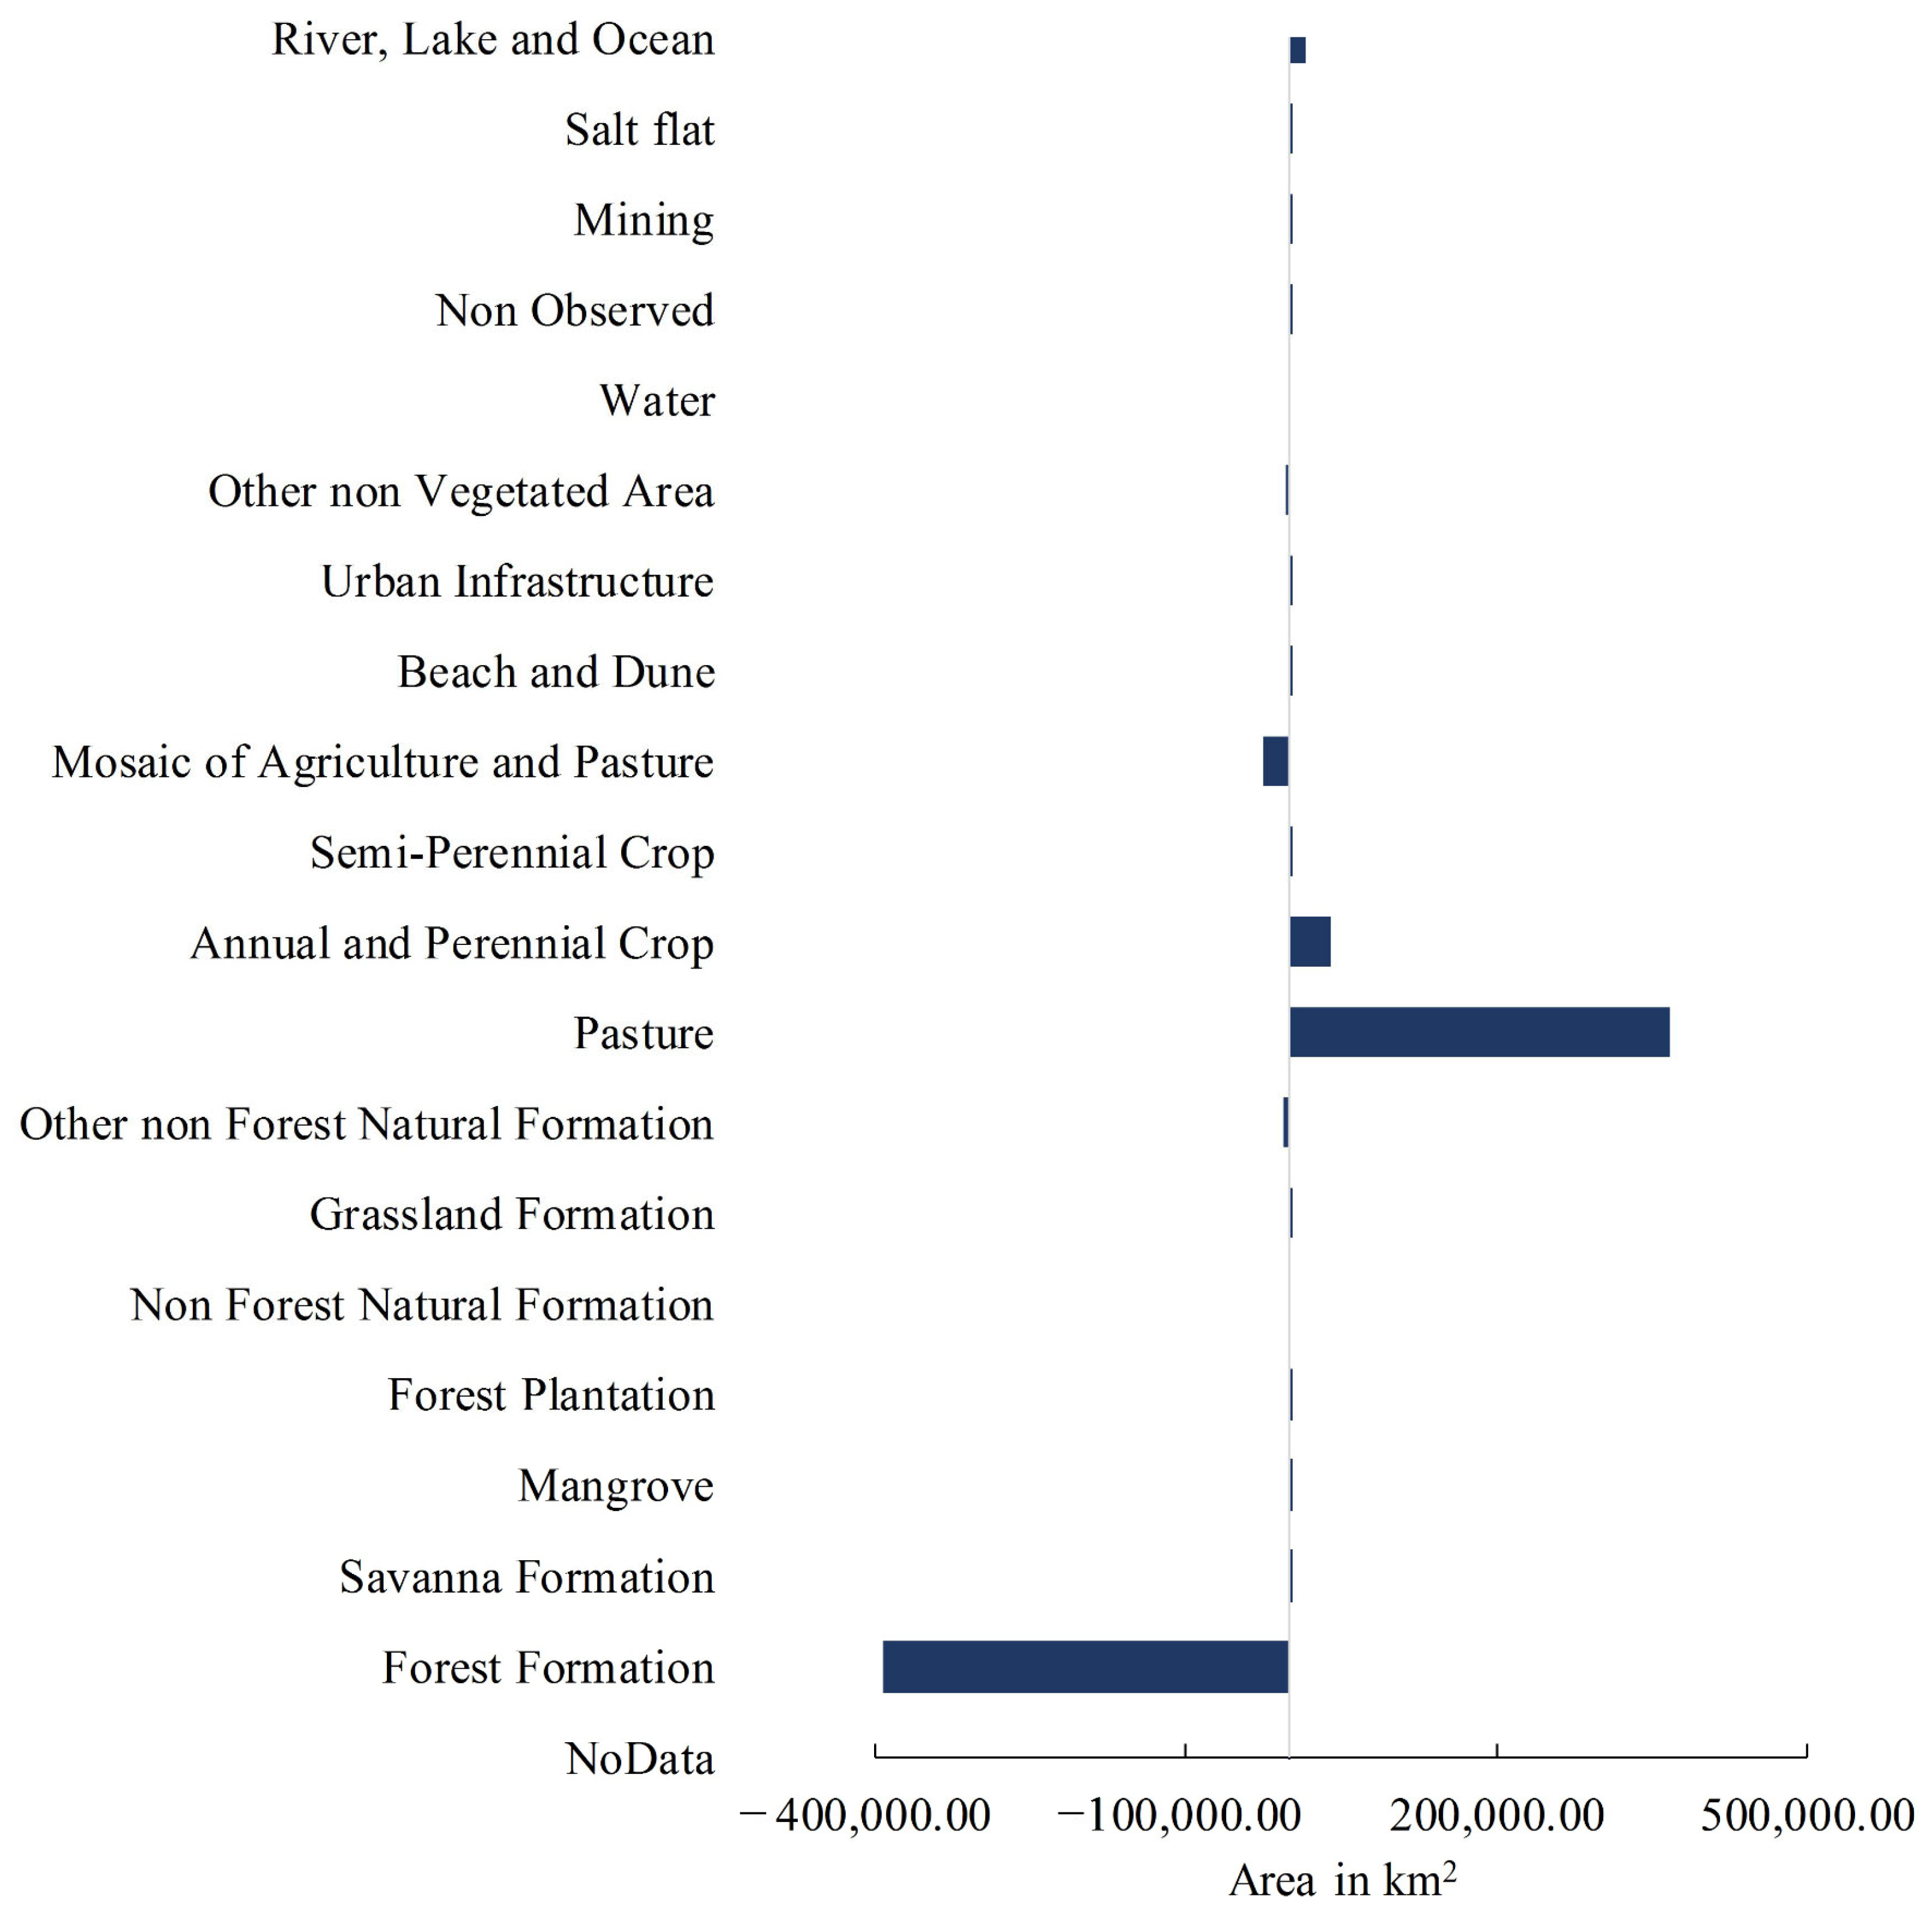
| Classes | Variation (km2) | Classes | Variation (km2) |
|---|---|---|---|
| No Data | −77.25 | Semi-Perennial Crop | 709.00 |
| Forest Formation | −392,671.50 | Mosaic of Agriculture and Pasture | −25,538.00 |
| Savana Formation | 96.00 | Beach and Dune | 22.50 |
| Mangrove | 276.00 | Urban Infrastructure | 858.75 |
| Forest Plantation | 280.25 | Other Non-Vegetated Area | −3220.00 |
| Non-Forest Natural Formation | −0.50 | Water | −6.00 |
| Grassland Formation | 2233.00 | Non-Observed | 107.00 |
| Other Non-Forest Natural Formation | −6083.75 | Mining | 105.75 |
| Pasture | 366,623.50 | Salt flat | 143.75 |
| Annual and Perennial Crop | 40,439.25 | River, Lake, and Ocean | 15,702.25 |
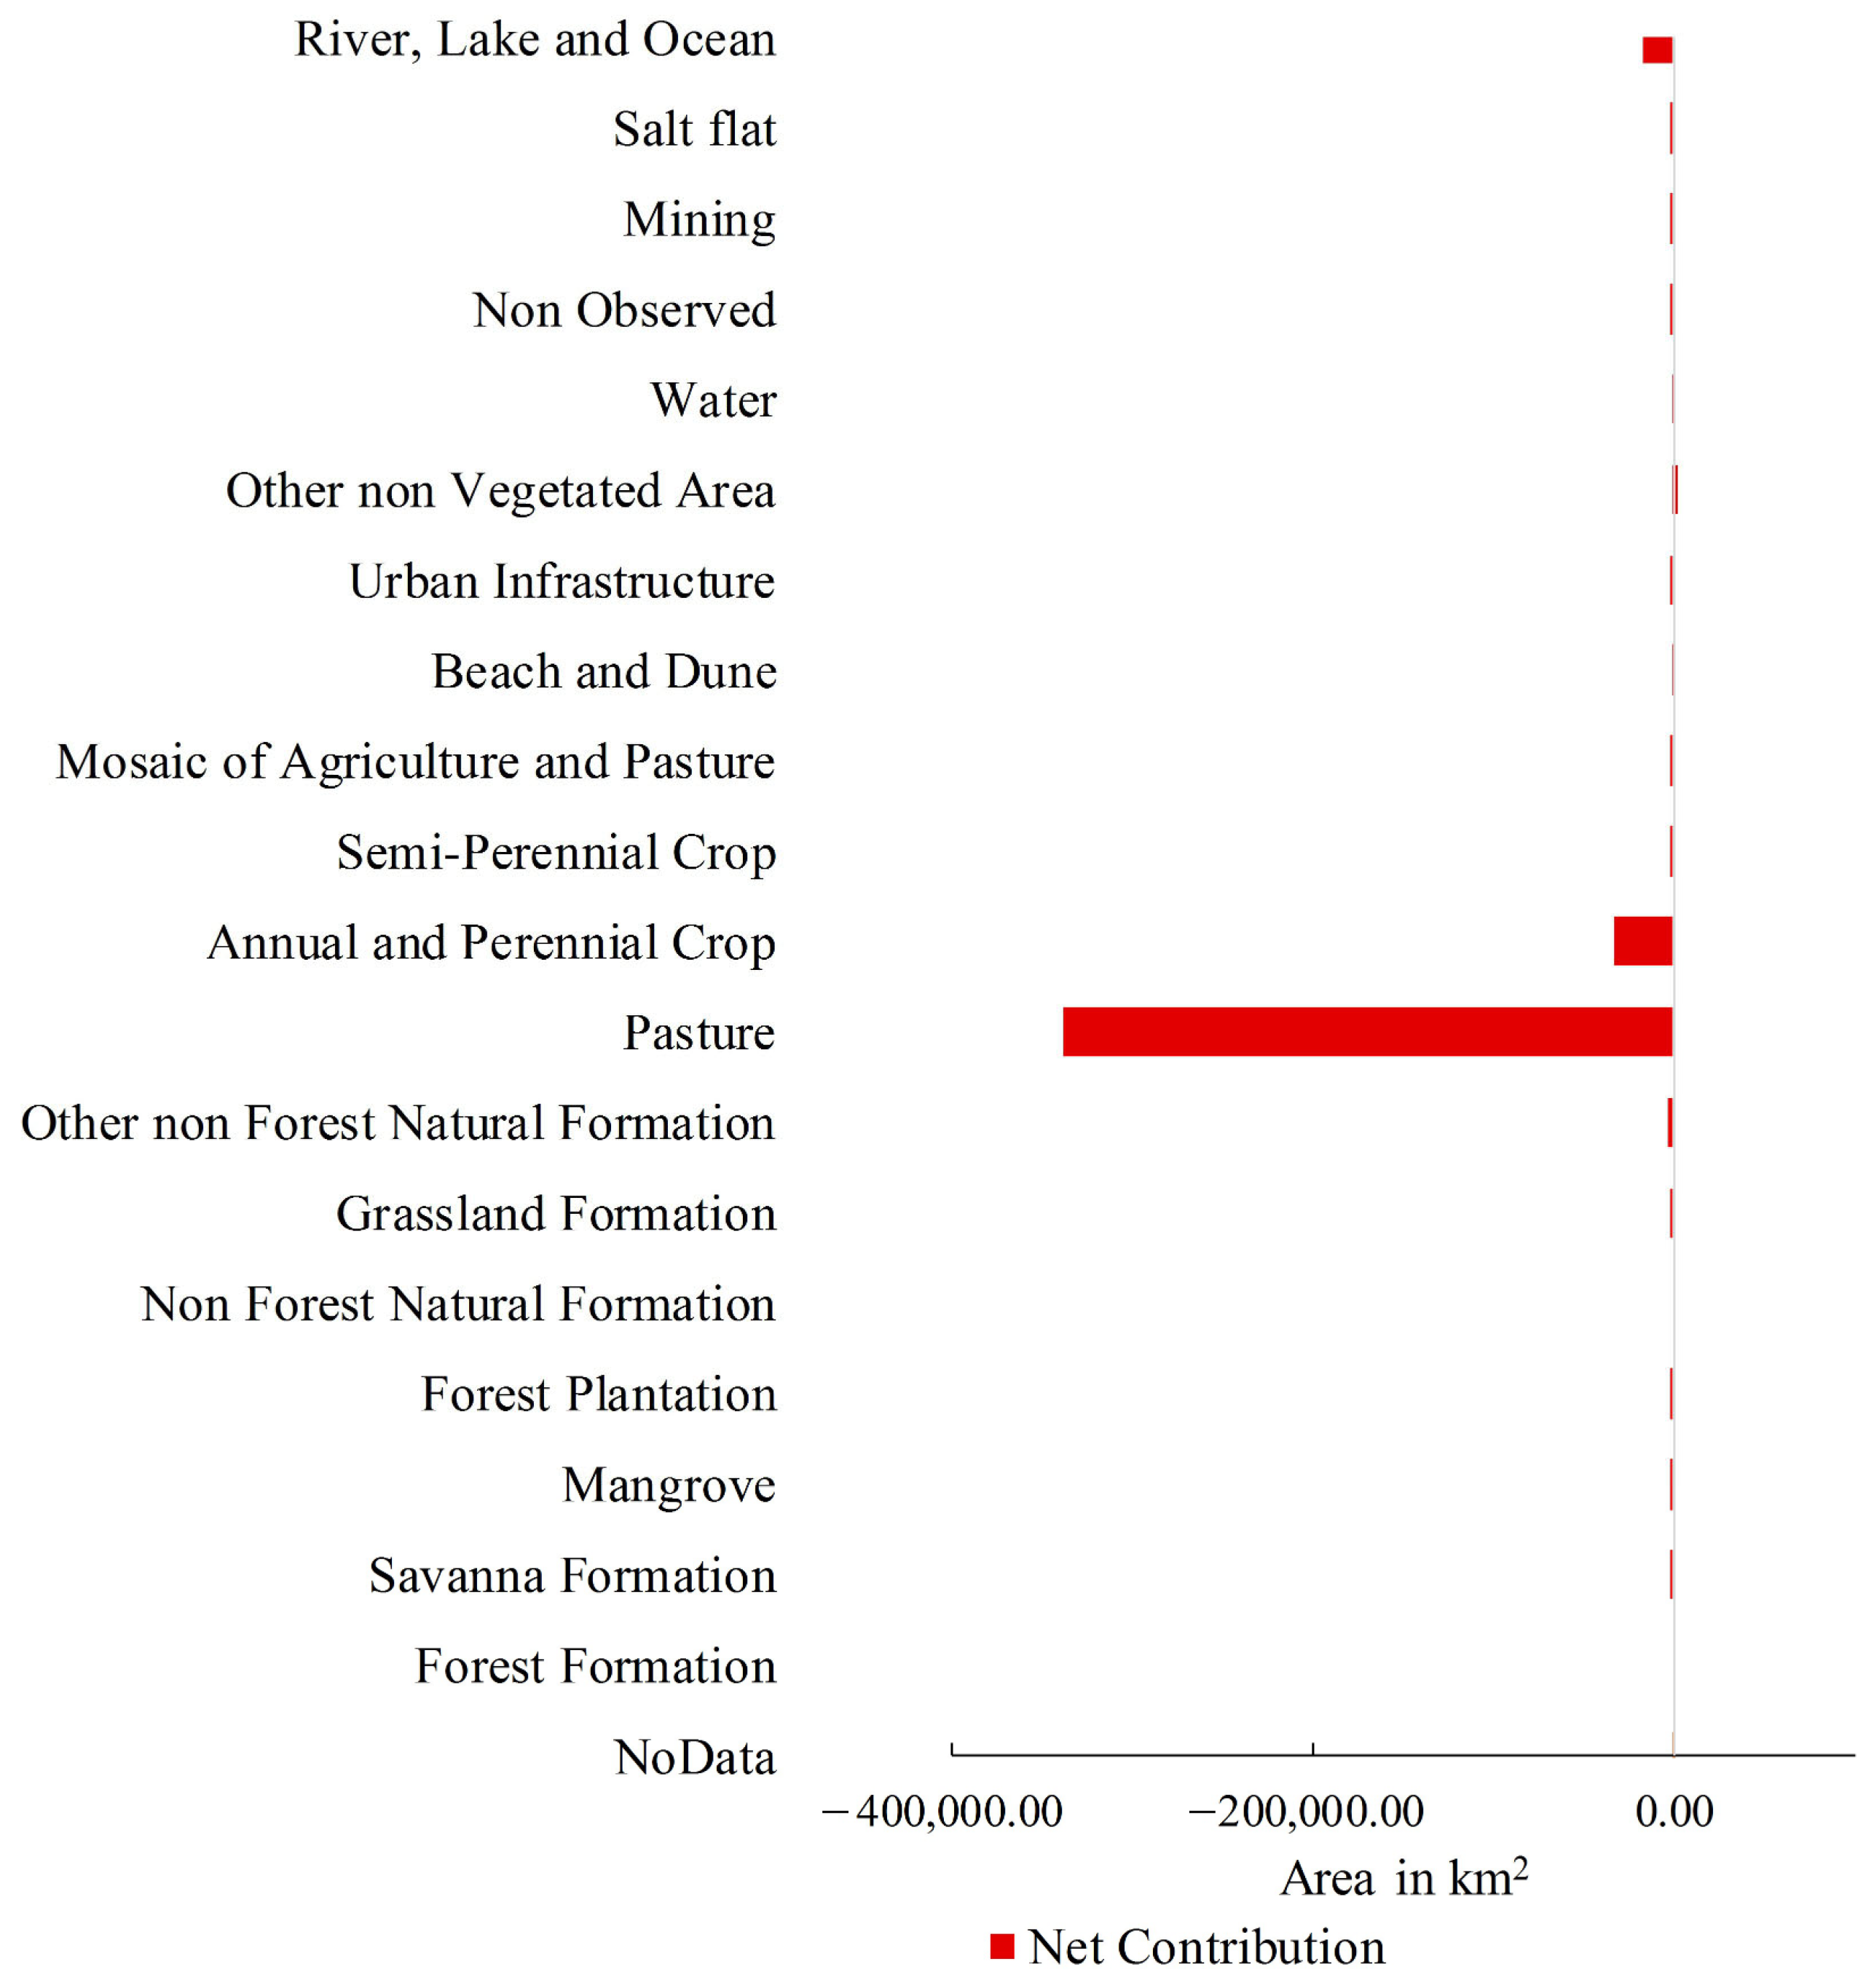
| Classes | Contribution (km2) | Classes | Contribution (km2) |
|---|---|---|---|
| No Data | 10.50 | Semi-Perennial Crop | −186.50 |
| Forest Formation | 0.00 | Mosaic of Agriculture and Pasture | −236.25 |
| Savana Formation | −1032.75 | Beach and Dune | 0.50 |
| Mangrove | −382.25 | Urban Infrastructure | −651.75 |
| Forest Plantation | −232.75 | Other Non-Vegetated Area | 1691.00 |
| Non-Forest Natural Formation | 0.00 | Water | 4.00 |
| Grassland Formation | −417.50 | Non-Observed | −24.50 |
| Other Non-Forest Natural Formation | −3116.75 | Mining | −91.25 |
| Pasture | −337,845.00 | Salt flat | −81.50 |
| Annual and Perennial Crop | −33,603.25 | River, Lake, and Ocean | −16.475.50 |
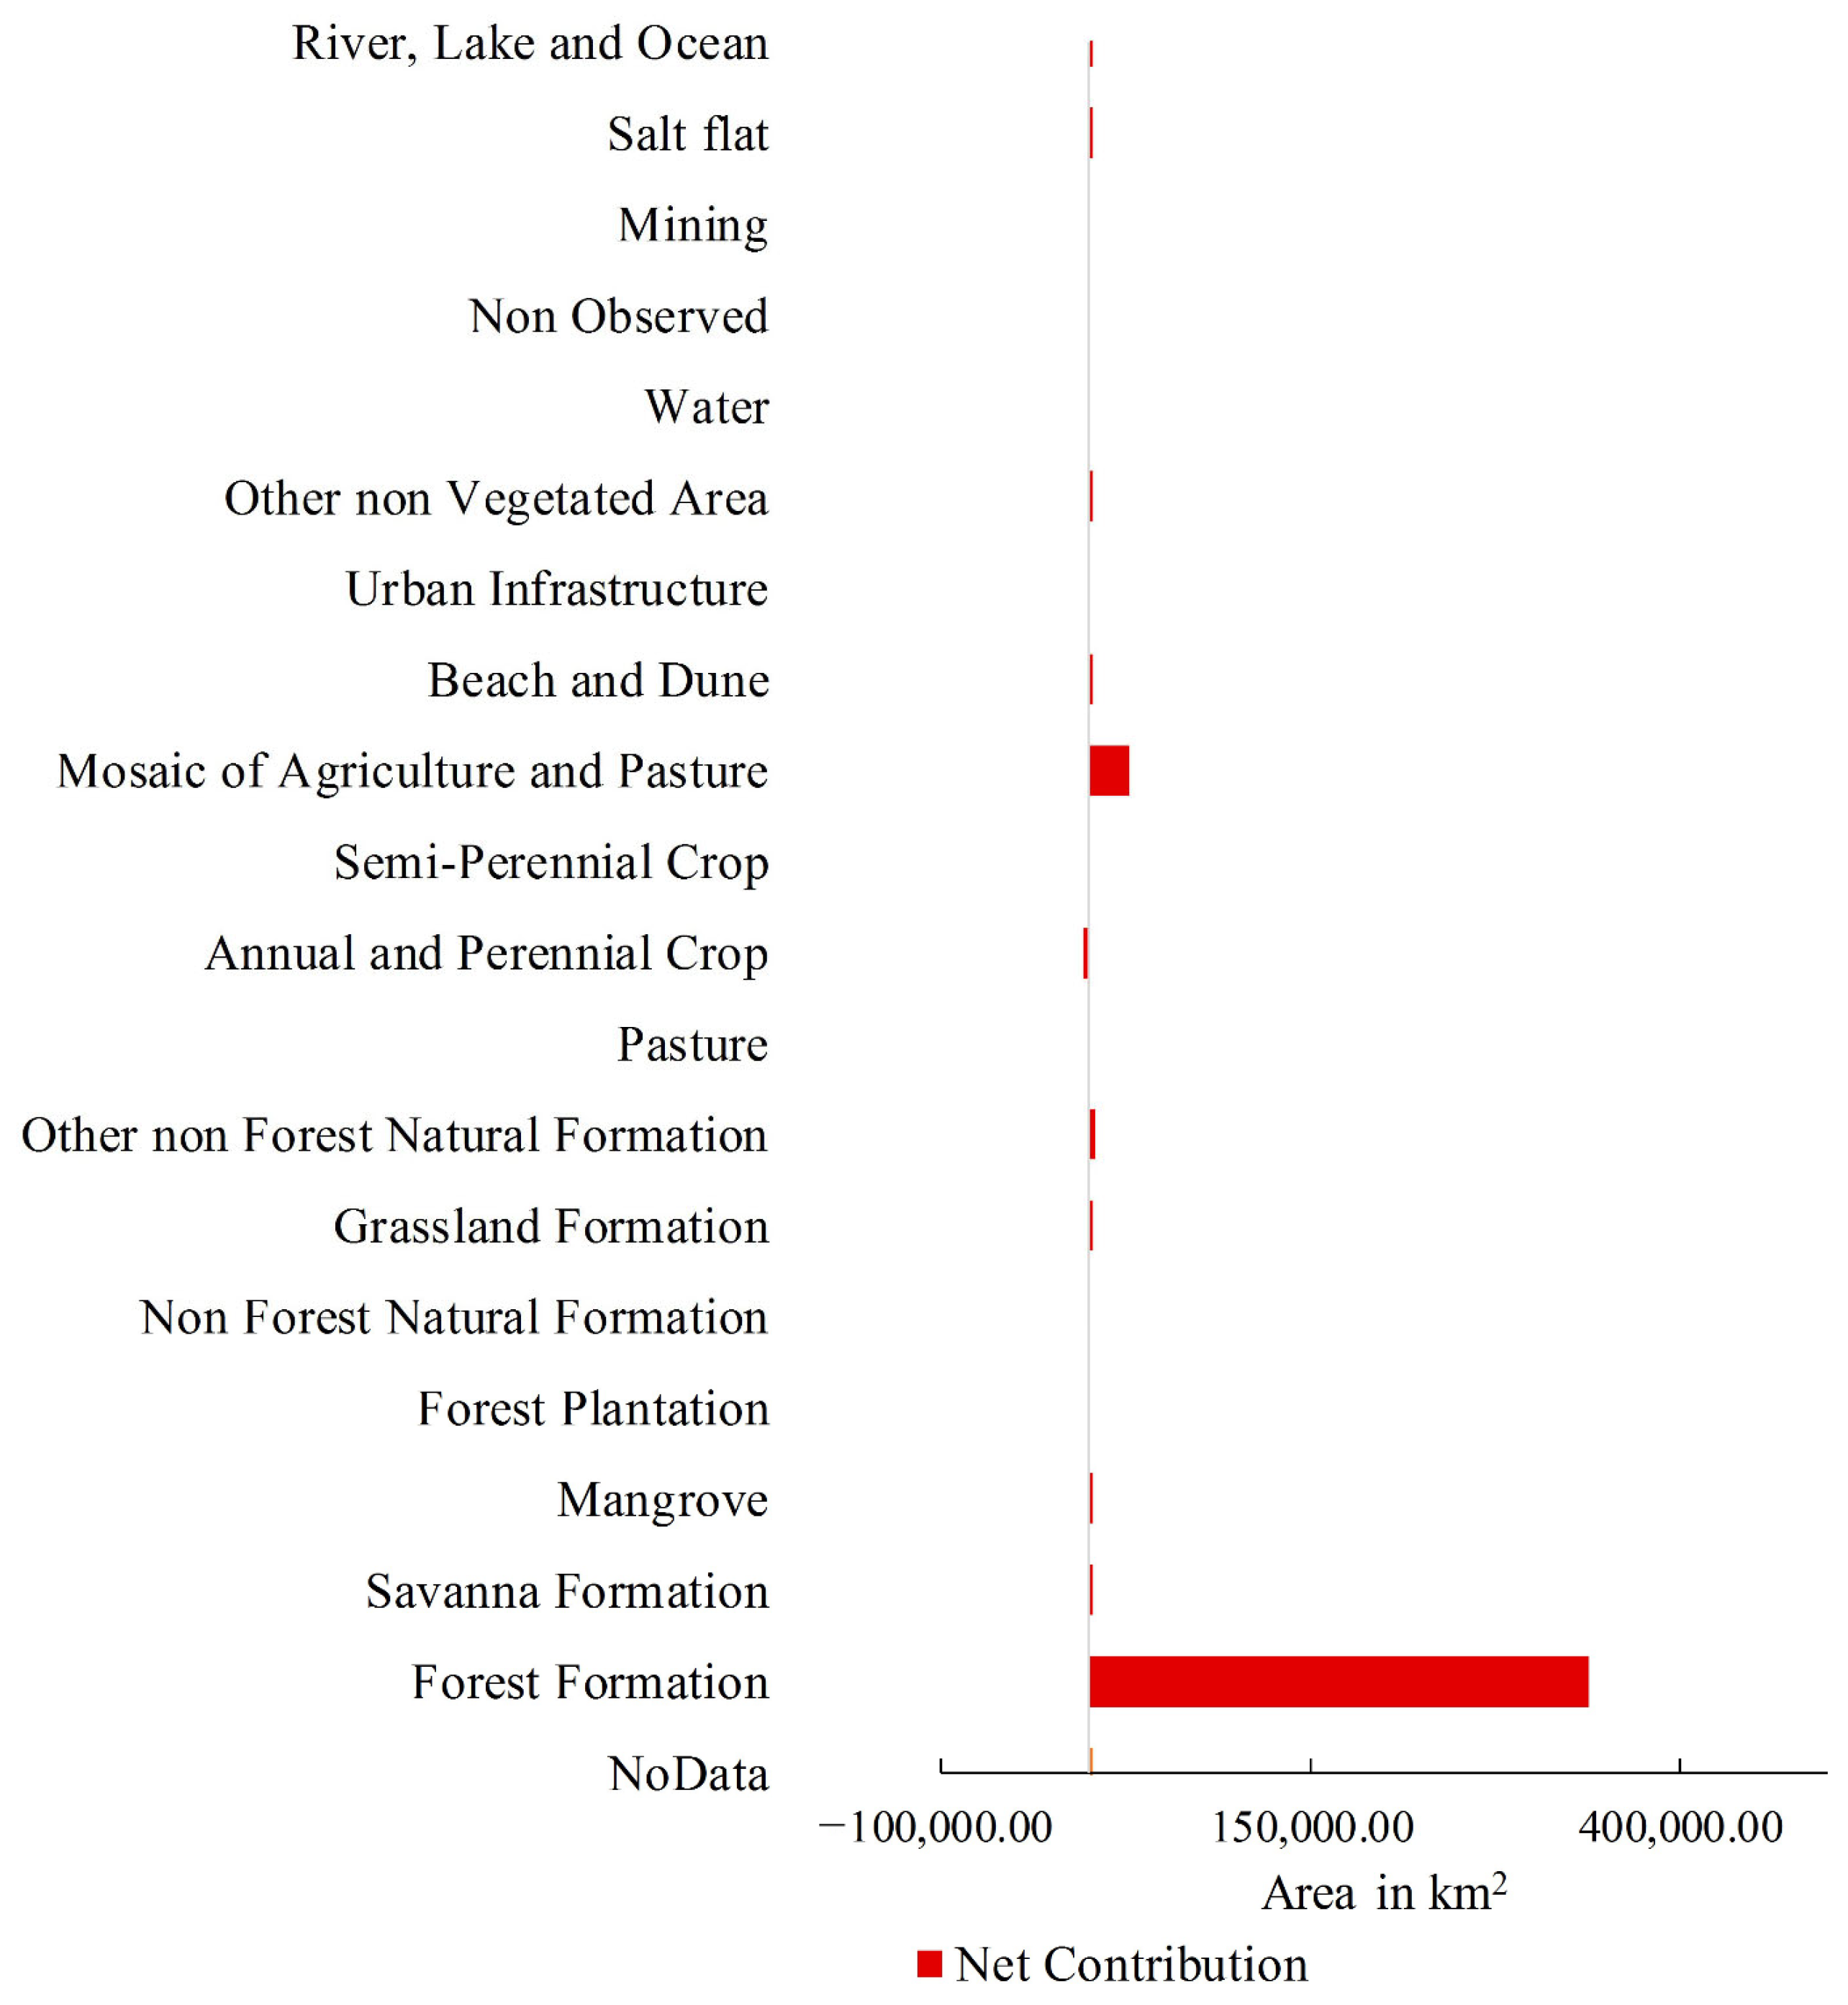
| Classes | Contribution (km2) | Classes | Contribution (km2) |
|---|---|---|---|
| No Data | 7.00 | Semi-Perennial Crop | −321.75 |
| Forest Formation | 337,845.00 | Mosaic of Agriculture and Pasture | 26,178.25 |
| Savana Formation | 1229.50 | Beach and Dune | 0.50 |
| Mangrove | 12.25 | Urban Infrastructure | −61.50 |
| Forest Plantation | −21.75 | Other Non-Vegetated Area | 1188.75 |
| Non-Forest Natural Formation | 0.00 | Water | 0.00 |
| Grassland Formation | 406.25 | Non-Observed | 0.00 |
| Other Non-Forest Natural Formation | 3553.50 | Mining | 0.75 |
| Pasture | 0.00 | Salt flat | 0.50 |
| Annual and Perennial Crop | −3873.25 | River, Lake, and Ocean | 481.00 |
| Explanatory Variables | Unit | Cramer-V | Selection Status |
|---|---|---|---|
| Altitude | m | 0.3015 | Selected |
| Slope | % | 0.3021 | Selected |
| Annual Average Precipitation | mm | 0.3056 | Selected |
| Distance from Highways | m | 0.2142 | Selected |
| Distance from Water Courses | m | 0.2467 | Selected |
| Distance from Urban Infrastructure | m | 0.2361 | Selected |
| Distance from Pasture | m | 0.2214 | Selected |
| Distance of Annual and Perennial Culture | m | 0.1601 | * Not Selected |
| Distance from Semi-Perennial Culture | m | 0.1561 | * Not Selected |
| Distance from Agriculture and Pasture Mosaic | m | 0.2517 | Selected |
| Distance from Mining | m | 0.1604 | Selected |
| Distance from Protected Areas | m | 0.2159 | Selected |
| Distance from Change Areas | m | 0.2597 | Selected |
| 1985 | 2014 | 2017 | 2044 | |||||
|---|---|---|---|---|---|---|---|---|
| Classes | Area (km2) | % | Area (km2) | % | Area (km2) | % | Area (km2) | % |
| Forest Formation | 3,844,800.75 | 91.20 | 3,452,129.25 | 81.89 | 3,482,721.50 | 82.61 | 3,115,892.25 | 73.91 |
| Savanna Formation | 4708.50 | 0.11 | 4804.50 | 0.11 | 3060.25 | 0.07 | 4804.50 | 0.11 |
| Mangrove | 7234.25 | 0.17 | 7510.25 | 0.18 | 6827.50 | 0.16 | 7510.25 | 0.18 |
| Planted Forest | 25.00 | 0.00 | 305.25 | 0.01 | 438.00 | 0.01 | 305.25 | 0.01 |
| Non-Forest Natural Formation | 0.50 | 0.00 | 0.00 | 0.00 | 0.00 | 0.00 | 0.00 | 0.00 |
| Grassland Formation | 3340.75 | 0.08 | 5573.75 | 0.13 | 3574.25 | 0.08 | 5573.75 | 0.13 |
| Salt Flat | 139.25 | 0.00 | 283.00 | 0.01 | 401.75 | 0.01 | 283.00 | 0.01 |
| Other Non-Forest Natural Formation | 117,054.50 | 2.78 | 110,970.75 | 2.63 | 114,915.75 | 2.73 | 110,970.75 | 2.63 |
| Pasture | 71,046.50 | 1.69 | 437,670.00 | 10.38 | 375,159.50 | 8.90 | 773,907,00 | 18.36 |
| Annual and Perennial Culture | 793.25 | 0.02 | 41,232.50 | 0.98 | 44,500.50 | 1.06 | 41,232.50 | 0.98 |
| Semi-Perennial Culture | 0.00 | 0.00 | 709.00 | 0.02 | 608.75 | 0.01 | 709.00 | 0.02 |
| Mosaic of Agriculture and Pasture | 58,849.75 | 1.40 | 33,311.75 | 0.79 | 69,413.25 | 1.65 | 33,311.75 | 0.79 |
| Urban infrastructure | 1939.75 | 0.05 | 2798.50 | 0.07 | 2781.25 | 0.07 | 2798.50 | 0.07 |
| Mining | 13.25 | 0.00 | 119.00 | 0.00 | 146.75 | 0.00 | 119.00 | 0.00 |
| Beach and Dune | 31.00 | 0.00 | 53.50 | 0.00 | 43.00 | 0.00 | 53.50 | 0.00 |
| Other Non-Vegetated Area | 6299.25 | 0.15 | 3079.25 | 0.07 | 3316.50 | 0.08 | 3079.25 | 0.07 |
| Water bodies | 6.00 | 0.00 | 0.00 | 0.00 | 8.25 | 0,00 | 0.00 | 0.00 |
| River, Lake, and Ocean | 99,112.25 | 2.35 | 114,814.50 | 2.72 | 107,465.25 | 2.55 | 114,814.50 | 2.72 |
| Not observed | 53.75 | 0.00 | 160.75 | 0.00 | 57.75 | 0.00 | 160.75 | 0.00 |
| No Data | 195.00 | 0.00 | 117.75 | 0.00 | 203.50 | 0.00 | 117.75 | 0.00 |
| Total | 4,215,643.25 | 100 | 4,215,643.25 | 100 | 4,215,643.25 | 100 | 4,215,643.25 | 100 |
Disclaimer/Publisher’s Note: The statements, opinions and data contained in all publications are solely those of the individual author(s) and contributor(s) and not of MDPI and/or the editor(s). MDPI and/or the editor(s) disclaim responsibility for any injury to people or property resulting from any ideas, methods, instructions or products referred to in the content. |
© 2023 by the authors. Licensee MDPI, Basel, Switzerland. This article is an open access article distributed under the terms and conditions of the Creative Commons Attribution (CC BY) license (https://creativecommons.org/licenses/by/4.0/).
Share and Cite
Barbosa de Souza, K.; Rosa dos Santos, A.; Macedo Pezzopane, J.E.; Machado Dias, H.; Ferrari, J.L.; Machado de Oliveira Peluzio, T.; Toledo, J.V.; Freire Carvalho, R.d.C.; Rizzo Moreira, T.; França Araújo, E.; et al. Modeling Dynamics in Land Use and Land Cover and Its Future Projection for the Amazon Biome. Forests 2023, 14, 1281. https://doi.org/10.3390/f14071281
Barbosa de Souza K, Rosa dos Santos A, Macedo Pezzopane JE, Machado Dias H, Ferrari JL, Machado de Oliveira Peluzio T, Toledo JV, Freire Carvalho RdC, Rizzo Moreira T, França Araújo E, et al. Modeling Dynamics in Land Use and Land Cover and Its Future Projection for the Amazon Biome. Forests. 2023; 14(7):1281. https://doi.org/10.3390/f14071281
Chicago/Turabian StyleBarbosa de Souza, Kaíse, Alexandre Rosa dos Santos, José Eduardo Macedo Pezzopane, Henrique Machado Dias, Jéferson Luiz Ferrari, Telma Machado de Oliveira Peluzio, João Vitor Toledo, Rita de Cássia Freire Carvalho, Taís Rizzo Moreira, Emanuel França Araújo, and et al. 2023. "Modeling Dynamics in Land Use and Land Cover and Its Future Projection for the Amazon Biome" Forests 14, no. 7: 1281. https://doi.org/10.3390/f14071281
APA StyleBarbosa de Souza, K., Rosa dos Santos, A., Macedo Pezzopane, J. E., Machado Dias, H., Ferrari, J. L., Machado de Oliveira Peluzio, T., Toledo, J. V., Freire Carvalho, R. d. C., Rizzo Moreira, T., França Araújo, E., Gomes da Silva, R., Pósse Senhorelo, A., Azevedo Costa, G., Duarte Nader Mardeni, V., Horn Kunz, S., & Cordeiro dos Santos, E. (2023). Modeling Dynamics in Land Use and Land Cover and Its Future Projection for the Amazon Biome. Forests, 14(7), 1281. https://doi.org/10.3390/f14071281