Article

Impact of Crown Closure on Cone Production and Effective Number of Parents in Natural Stands of Taurus Cedar (Cedrus libani A. Rich.)

Faculty of Forestry, Isparta University of Applied Sciences, Isparta 32260, Turkey
*
Author to whom correspondence should be addressed.
Forests 2023, 14(6), 1130; https://doi.org/10.3390/f14061130
Submission received: 30 March 2023 / Revised: 17 May 2023 / Accepted: 26 May 2023 / Published: 30 May 2023

Abstract

:
This study was carried out to estimate the effect of crown closure classes (degraded forest, low crown coverage, medium crown coverage, and full crown coverage) and growth characteristics (three heights, diameter at base, diameter at breast height, and crown diameter) on cone production and to estimate fertility variation and its allied parameters in 130-year-old natural populations of Taurus cedar, also called cedar of Lebanon (Cedrus libani A. Rich.). The effect of biotic (e.g., growth characteristics, crown closure) and abiotic (e.g., light penetration, temperature, humidity, and soil characteristics) factors on cone production, fertility variation, and gene diversity was evaluated in two consecutive years of Taurus cedar. The factors, viz., altitude, temperature, aspect, and rainfall, varied, while some of them could be managed by cultural operations such as management of the crown and stand density. The impact of crown closure on cone production, fertility variation, and related parameters were observed in Taurus cedar’s natural populations sampled from southern Turkey. Maximum cone productions of 29 and 40/tree were recorded with full crown closure in two consecutive years, due to significant differences among individuals within crown closure class. For instance, cone productions were between 10 and 67 in the full crown closure of the first year. The sibling coefficient, which is a measure of the fertility variation in a stand, was the highest (1.16) for the full crown closure in the first (meaning 86% fertile trees) and the second years (1.55, 65%), while it was the lowest for the medium crown closure (1.09, 92%) in both years. Gene diversity decreased from a degraded patch (0.987) to that with full crown closure (0.984). Results of variance analysis showed a significant (p ≤ 0.05) difference between crown closure classes for cone production within the second year and between years. Significant positive (p ≤ 0.05) correlations were noted between years for cone production (r = 0.22) and between cone production and crown closure in the first and second years (r = 0.29). However, growth characteristics had no effect on cone productions in individual crown closure classes, while there were significant (p ≤ 0.05) correlations between the diameter at breast height and cone production for both years (r = 0.15 and 0.17) in pooled populations.

1. Introduction

Taurus cedar (Cedrus libani A. Rich.), also known as cedar of Lebanon, has its main natural occurrence in the Taurus Mountains in southern Turkey, generally between 800 and 2100 m of elevation. It can be found at lower (500–600 m) and higher (2400 m) elevations as small populations or small groups and individuals [1]. Its reported extent in southern Turkey is 405,424 ha [2].
The species is classified as one of the economically and ecologically important tree species by Turkish forestry and the “National Tree Breeding and Seed Production Program” [3] because of its valuable wood product and the social–cultural importance of the species. The species is also used in reforestation and afforestation practices together with landscape planning as a monumental tree.
Annual seed production is about 139 tons for different forestry practices of Taurus cedar, based on forestry inventory [2]. A total of 22 seed stands at 3437.8 ha were selected to supply the seed demand of the species, together with 9 seed orchards established at 60.55 ha [2]. The reported maxima for different individual trees are 1000 years of age, a 3 m stem diameter, and a 50 m height [1].
Taurus cedar generally bears cones by 30 years in natural stands. Male flowers of the dioecious species appear in July and elongate 3–5 cm in August, while female flowers can be seen in September. Pollination takes place in September or early October, depending on the elevation. The following year, between April and June, conelets develop to mature cone sizes. Opening of the cone scales begins in October, about 25–26 months after flowering [4]. Good seed years have been reported as generally every 2–3 years [1] or 3–5 years [4] in the species.
Knowledge of the fecundity and fertility (expressed as the individual’s ability to fertilize—reproductive success), estimated from cones, flowers, pollen, fruit, and seed production [5,6,7,8], is an important prerequisite of the breeding and seed production program. Fertility variation is estimated based on reproductive characters and is an easy, cheap, and light survey in plant science. While some studies reported reproductive data of the species (i.e., [4,9,10,11,12]), the impact of crown closure on cone production and genetic parameters have not been studied.
It is clear that many biological (i.e., number of individuals per area, age, species, growth characteristics, stand structure, and population) [8,9,10,13,14] and environmental (i.e., edaphic, altitude, temperature, aspects, and rainfall) [7,12,13,15,16] factors negatively or positively impact cone production and fertility variation. However, crown closure can be managed by silvicultural practices.
While preparatory cutting practice for natural regeneration in the shelter-wood method has many ecological and biological functions, such as improving the soil characteristics and seedbed, it also results in increased strobili, cone, and seed productions in Taurus cedar. Boydak [1] reported that additional seeds were suggested for shelter-wood and clear-cut areas in natural regeneration practices of Taurus cedar. Therefore, additional seeds are needed in the natural regeneration practices of the species. One of the stages of the shelter-wood method is to provoke seed trees in natural regeneration practices by crown closure balancing to obtain additional cone/seed crops. Odabasi [4] reported that cone production could be related to crown closure. However, it has not been investigated in detail yet. The effects of crown closure on cone production, fertility variation, and related parameters need to be observed to estimate the seed productivity of a population.
The purposes of this study are (1) to estimate the effect of crown closure classes on cone production; (2) to estimate fertility variation and its allied parameters, such as the effective number of parents and gene diversity in natural populations; and (3) to estimate relations among the growth characteristics and cone productions to improve natural regeneration, management of seed sources, and other silvicultural practices of C. libani.

2. Materials and Methods
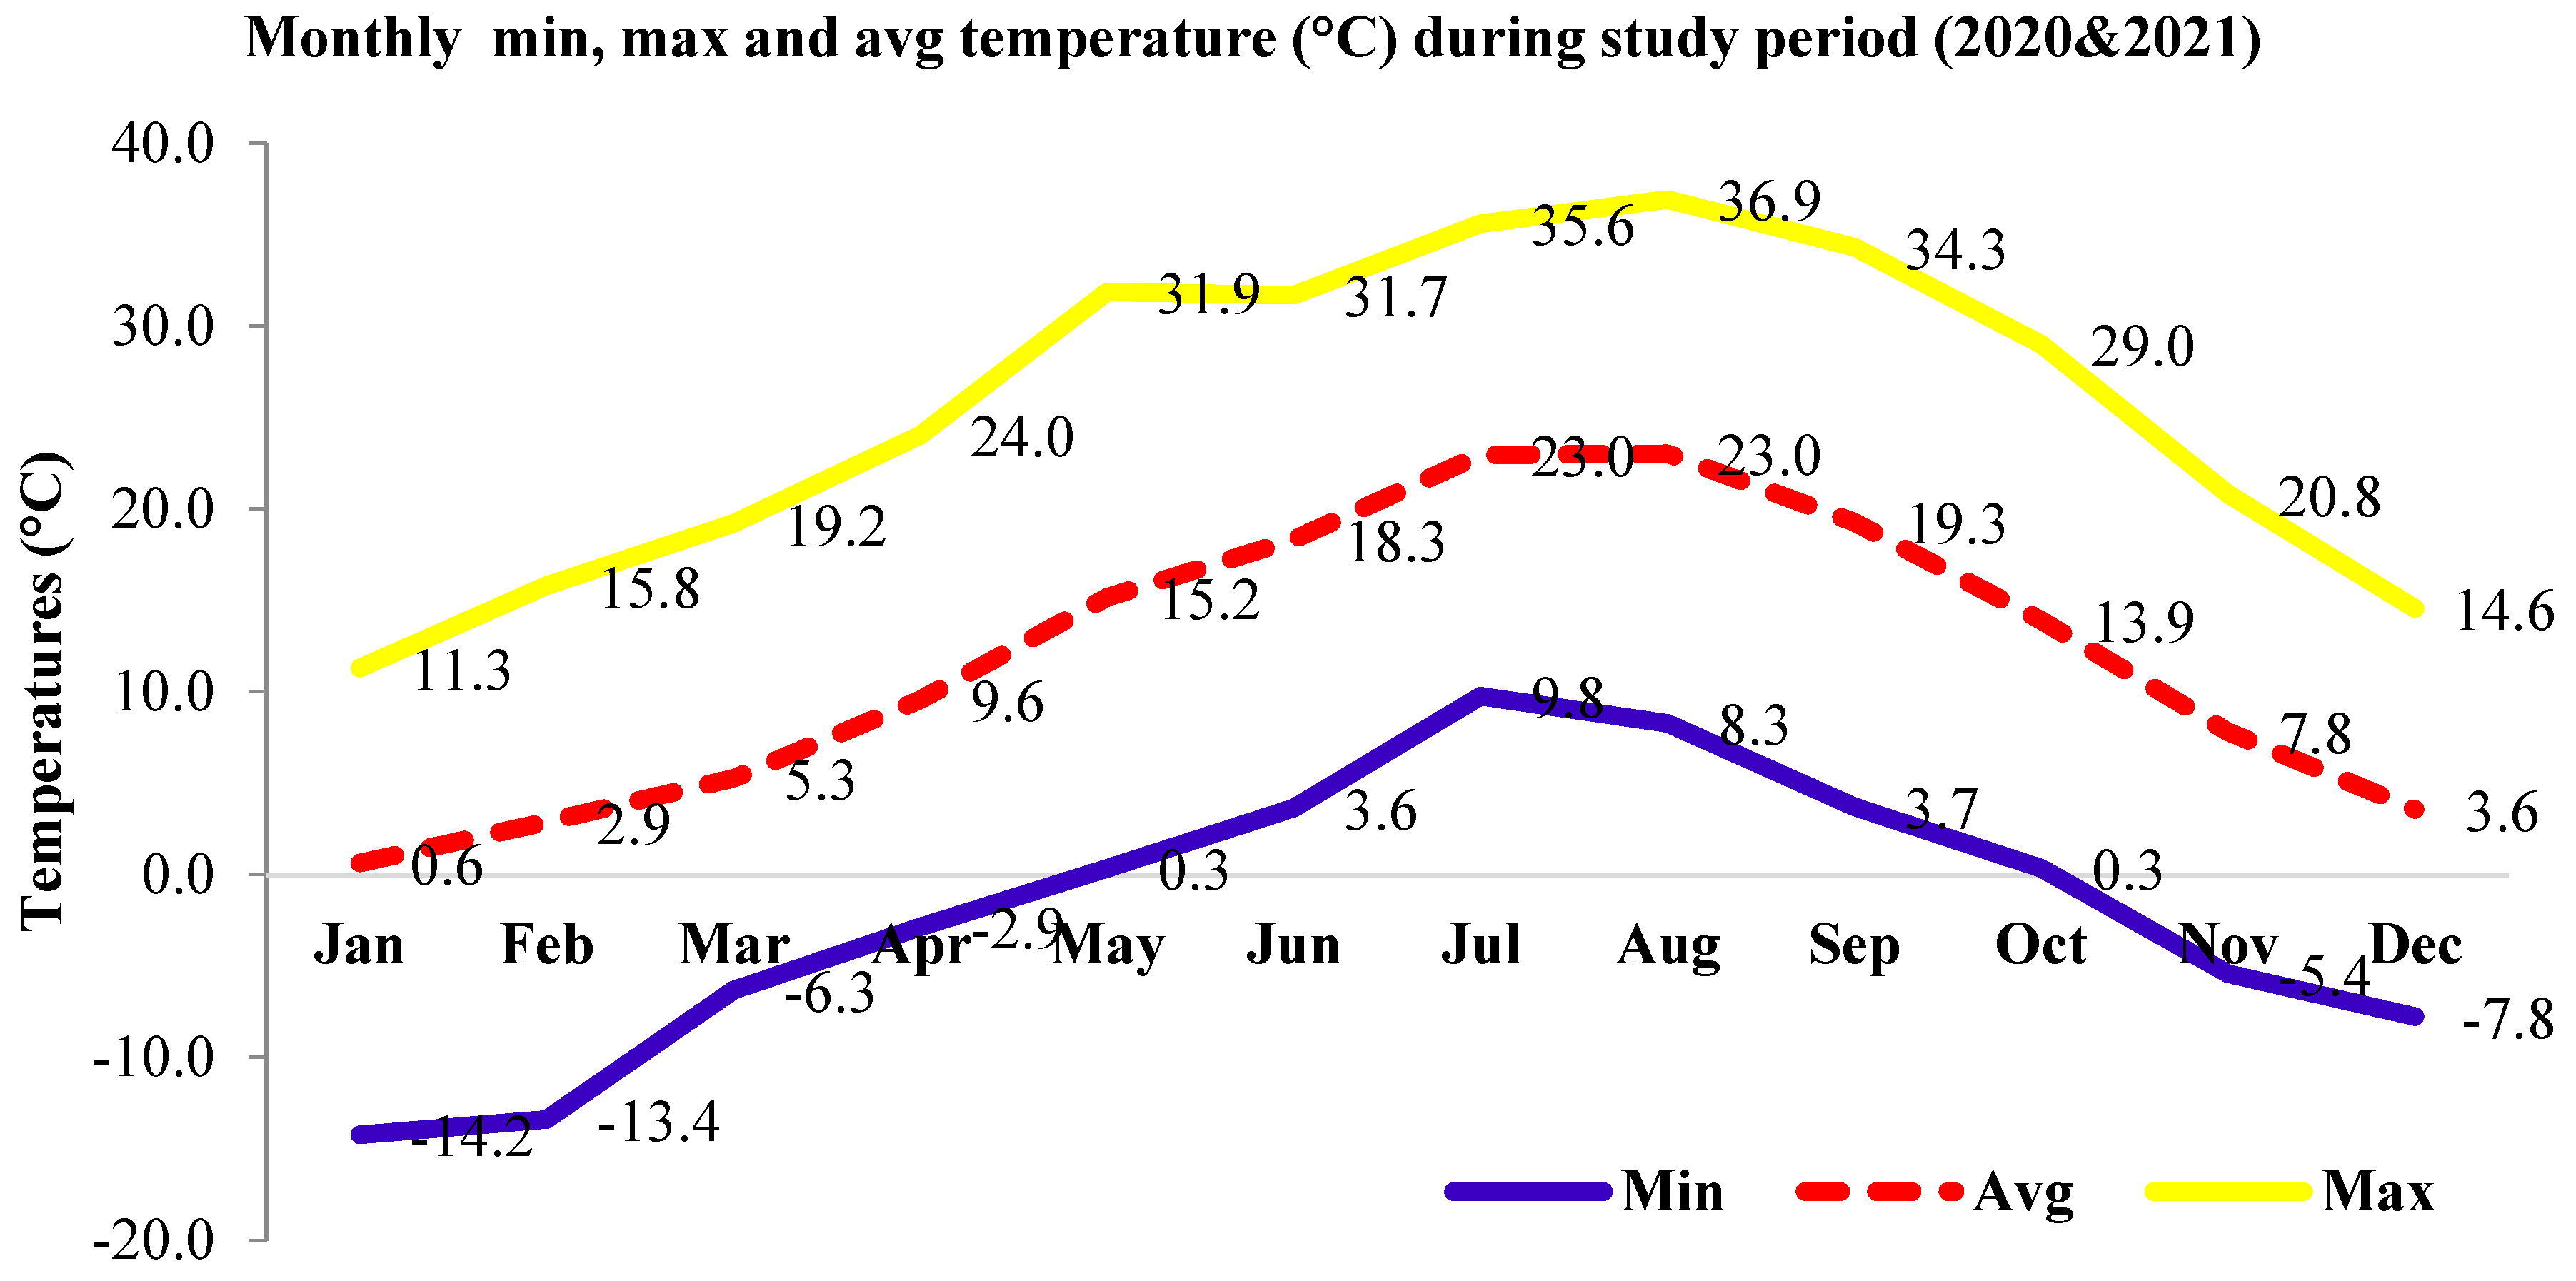
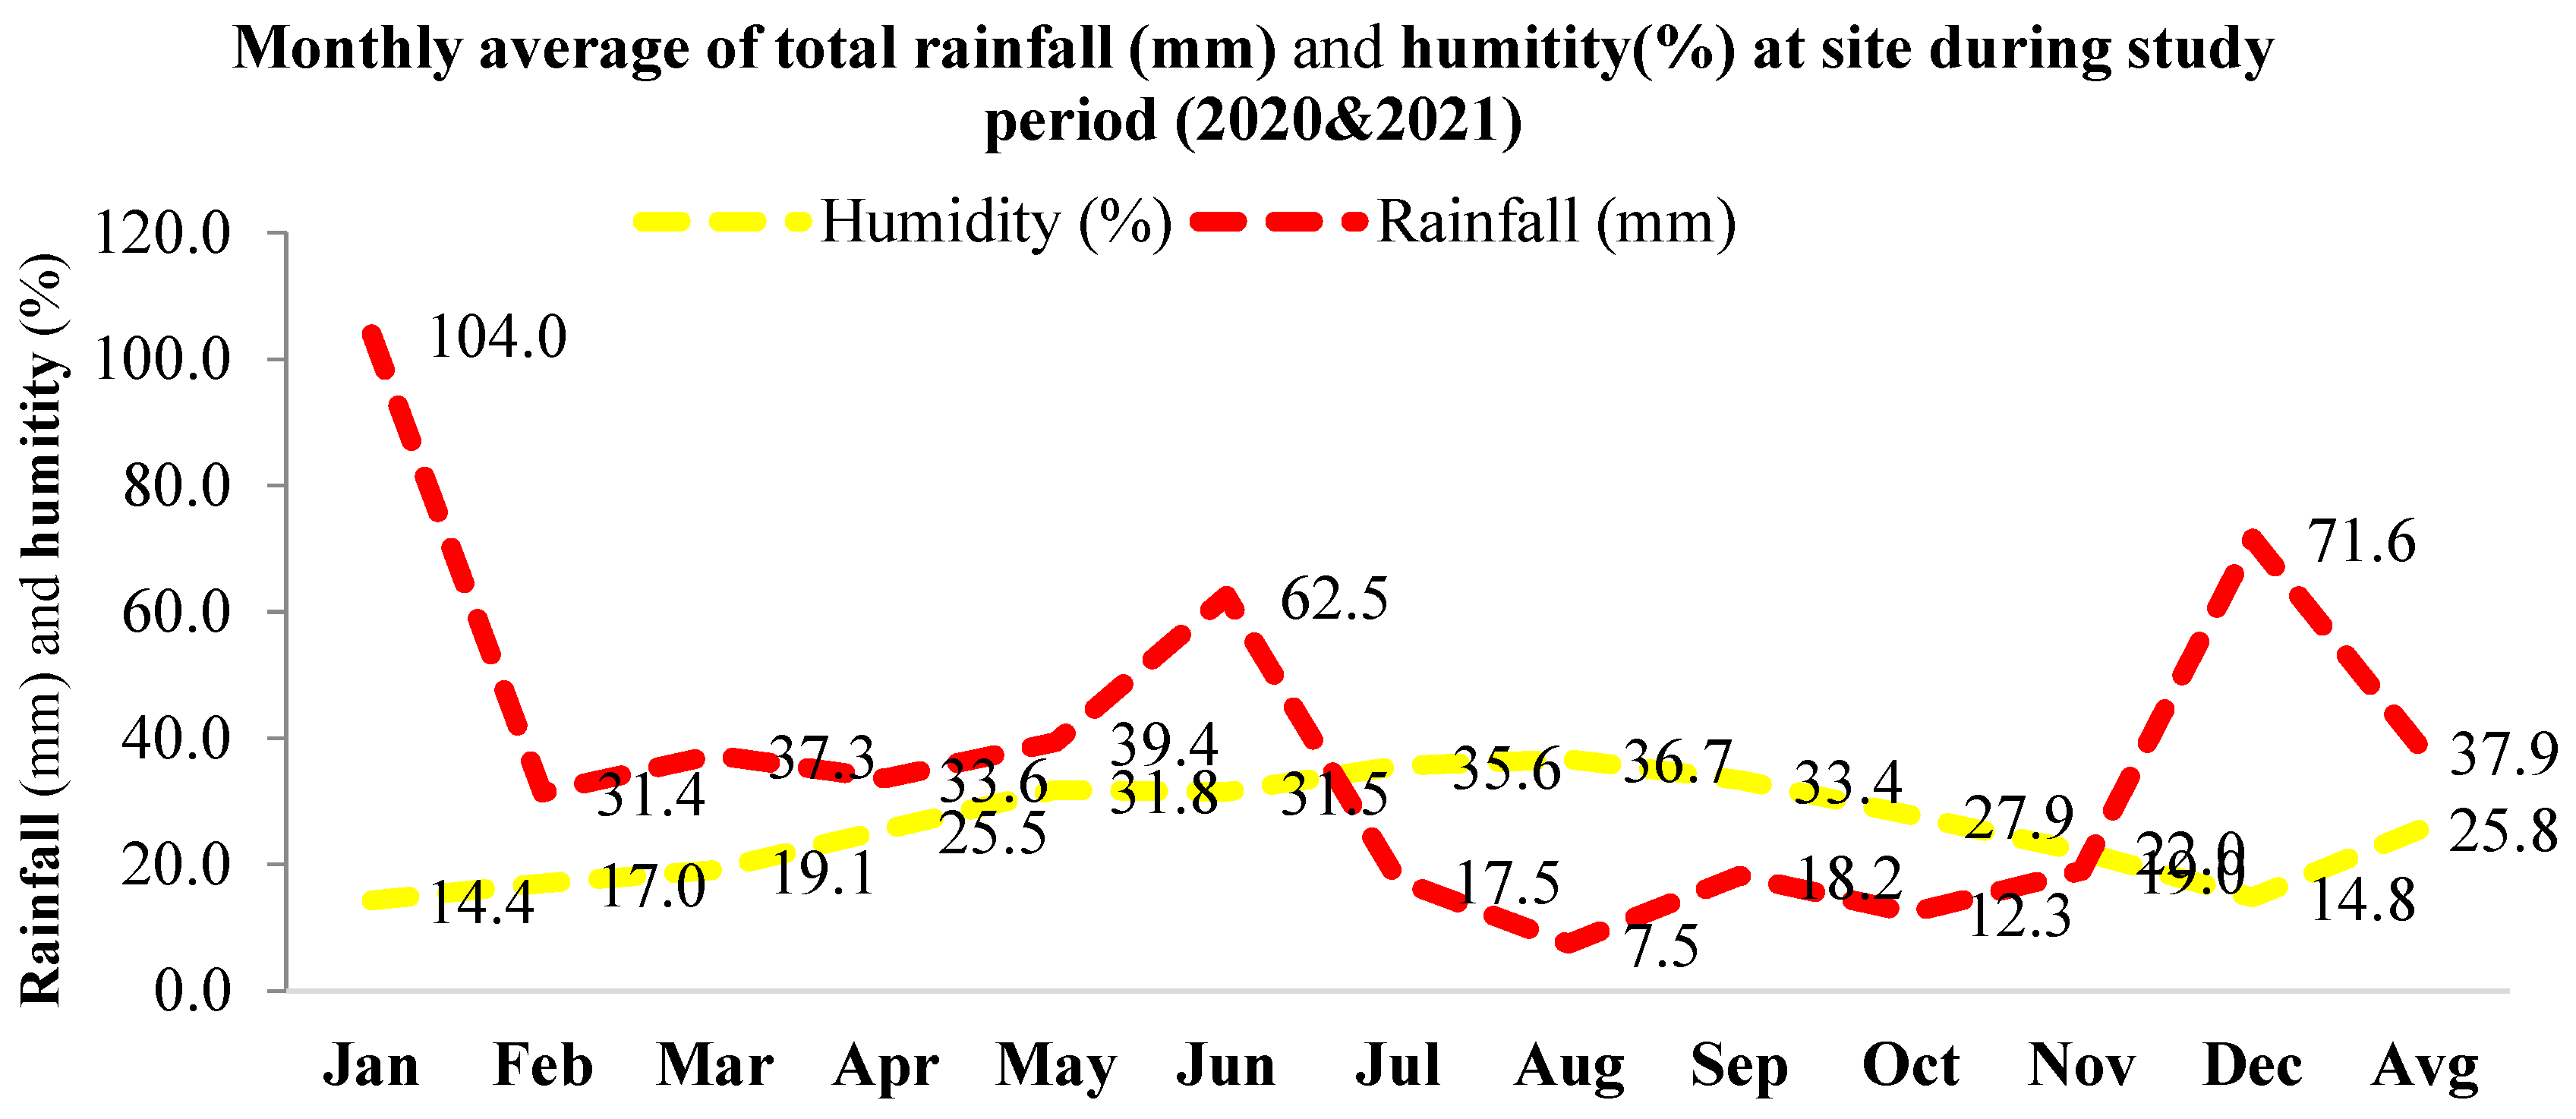
2.1. Study Area

Populations of Taurus cedar were selected from natural stands available between 37°50′ and 37°53′ N and between 31°17′ and 31°20′ E at an average of 1630 m from southern Turkey. Averages of the three heights (H), diameter at base (D0), diameter at breast height (d1.30), crown diameter (CD) and age, and altitude of the crown closure classes (CCCs) are given in Table 1.
Monthly maximum, minimum, and average temperatures (Figure 1) and average monthly precipitation and relative humidity (Figure 2) of the location were observed during the study period for two consecutive years (2020-year 1 and 2021-year 2).
Fifty genotypes each were selected from four crown closure classes [17]; crown closures were classified using a spherical densitometer as: degraded forest (DF-up to 10%), low crown coverage (LC-11% to 40%), medium crown coverage (MC-41% to 70%), and full crown coverage (FC-71% to 100%) from natural areas of the species.

2.2. Data Collection and Analysis

The numbers of brown mature cones that were 8.5 cm in length and 5 cm in diameter (Odabasi, 1990) (Figure 3) were counted from the fifty phenotypically selected and marked trees during two consecutive years (2020–2021).
The following GLM of ANOVA was used to analyze the differences in cone productions among CCCs and years using the SAS software [18] in the present study.
Y i j k = μ + F i + B ( F ) j ( i ) + e i j k
where Yijk is the observation from the kth tree of the jth crown closure in the ith year, μ is the overall mean of cone production, Fi is the effect of the ith year, B(F)j(i) is the effect of the jth population in the ith year, and eijk is the random error.
The CCCs were grouped by Duncan’s multiple range test for cone production based on the results of the analysis of variance. The pairwise comparisons of four crown closure classes (DF, LC, MC, FC) for cone productions were performed using the Games–Howell test.
Phenotypic Pearson’ correlation of cone production between years was estimated by Rohlf and Sokal [19].
Cone fertility variation (expressed as the sibling coefficient Ψ) was estimated, per Kang and Lindgren [20] and Bilir [7], as:
Ψ = N i = 1 N C o n i 2 = C V 2 + 1
where N is the census number of trees, Coni is the cone fertility of the ith individual, and CV is the coefficient of variation in total fertility. The coefficients of variation (CV) for cone fertility were calculated and applied to estimate the fertility variations in the parents.
In this paper, the fertility of the ith individual was estimated by the proportion of cone production in each crown closure. Therefore, the cone fertility represented the total contribution as zygotic parents.
The effective number of parents (Np), defined as the number of individuals in which an idealized population would produce the same number of offspring (sibs) as the real population, or defined as a function of fertility variation, was estimated [20] as:
N p = N / Ψ
The gene diversity (GD) was estimated, based on the census number (N) and fertility variation (Ψ) [21], as:
G D = 1 0.5 Ψ N

3. Results

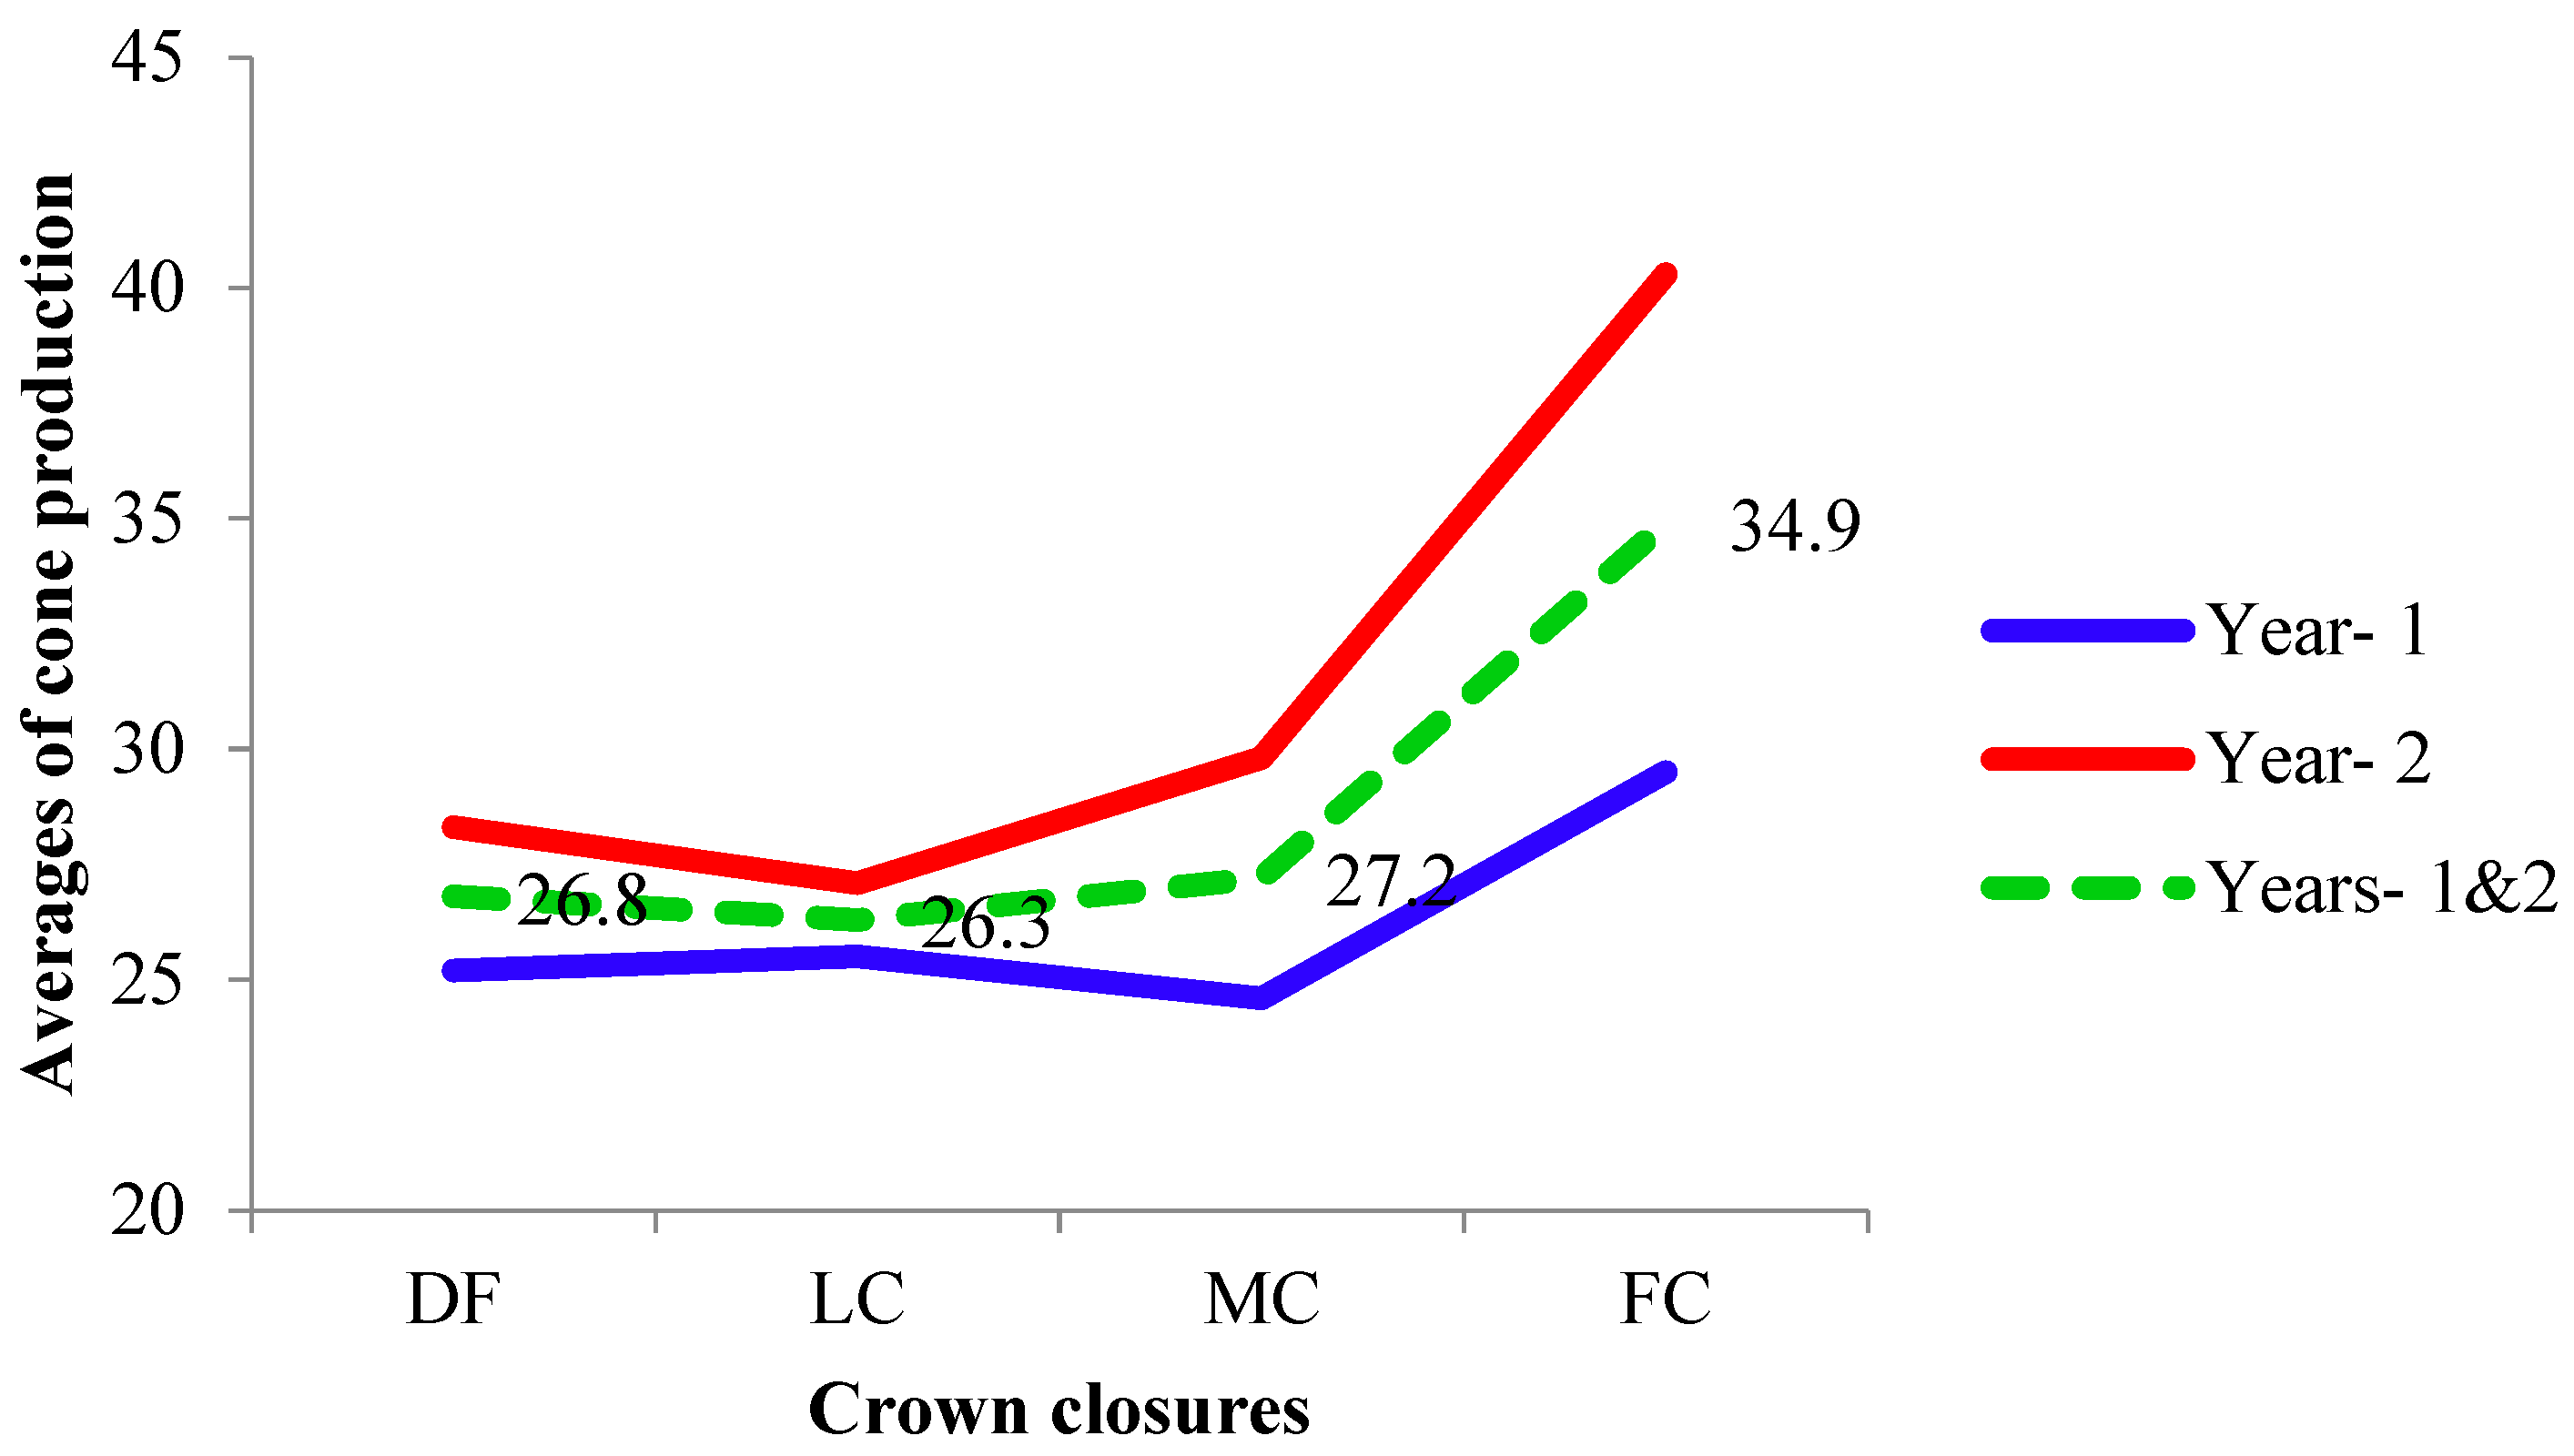
3.1. Cone Production

The mean cone production varied between years and among crown closure classes within the year (Figure 4) and among individuals within the crown closure class (Table 2).
The highest average cone production was noticed in FC in both years (year 1 and 2, respectively—Table 2), while for both years pooled, it ranged in the different CCCs (Figure 4).
The cone production was 20% higher (31.4/tree) in year 2 than in year 1 (26.2). The most fecund five trees (10% of trees) produced about 17% and 24% of the total cones in years 1 and 2, respectively, in all the crown classes. Cone production varied significantly among individual trees within the crown class in both years (Table 2). The cone production in FC was very different from the other crown classes in both years (Table 2). The coefficient of variation (CV) increased from DF to FC in year 1 and from DF to FC in year 2 (Table 2). It was also 37.4% in year 1, 67.1% in year 2, and 43.6% for pooled years across the CCCs. The differences between years and among CCCs in the second year were significant (p ≤ 0.05) for the cone productions, while CCCs x year interaction was not significant (p > 0.05) (Table 3).
Full crown coverage (FC) was different than the others, according to results of the Games–Howell test performed on the pairwise comparison of the CCCs for cone productions (Table 4).
Correlation analysis showed positive and significant (p < 0.05) correlations between years (r = 0.22) for cone production and between the cone production and crown closure classes (r = 0.29). Growth characteristics had no effect on cone production in individual crown closure classes, contrary to the significant (p ≤ 0.05) correlations between the diameter at breast height and cone production (r = 0.15 and 0.17) for both years in pooled populations.

3.2. Fertility Variation, Effective Number of Parents, and Gene Diversity

The fertility variation (sibling coefficient, Ψ) ranged from DF and LC to FC in year 1 and increased with the crown closure from DF to FC in year 2. The fertility variations of CCCs in year 2 were decreased by combining the years, while the combined fertility variation (1.09) was lower than each year of MC (Table 5 and Figure 5). It was 1.14 (88% fertile trees), 1.45 (69%), and 1.19 (84%) for years 1 and 2 and across CCCs, respectively.
The fertility variation was more or less similar between different crown closure classes in year 1, compared to year 2, in CCCs (Table 5). Depending on the fertility variation, the effective number of parents (Np) also showed the same trend with the fertility variation (Table 5). The effective population size, equivalent to the ideal populations, was 21% larger in year 1 than in year 2, based on the fertility variation of individuals in the full crown closure, while it was 13% in the low crown closure (Table 5).
Gene diversity was higher in the first year than in the second year in all CCCs (Table 5). The estimated loss in gene diversity from other crown closure classes to FC was 0.001 in year 1. Between the two years, FC had the highest loss in gene diversity, which was 0.004. However, the gene diversity was higher (0.988 and 0.989) in the pooled years of each CCC than in year 2 (Table 5). The relative number of parents showed significant differences in all classes of crowns (Table 5).

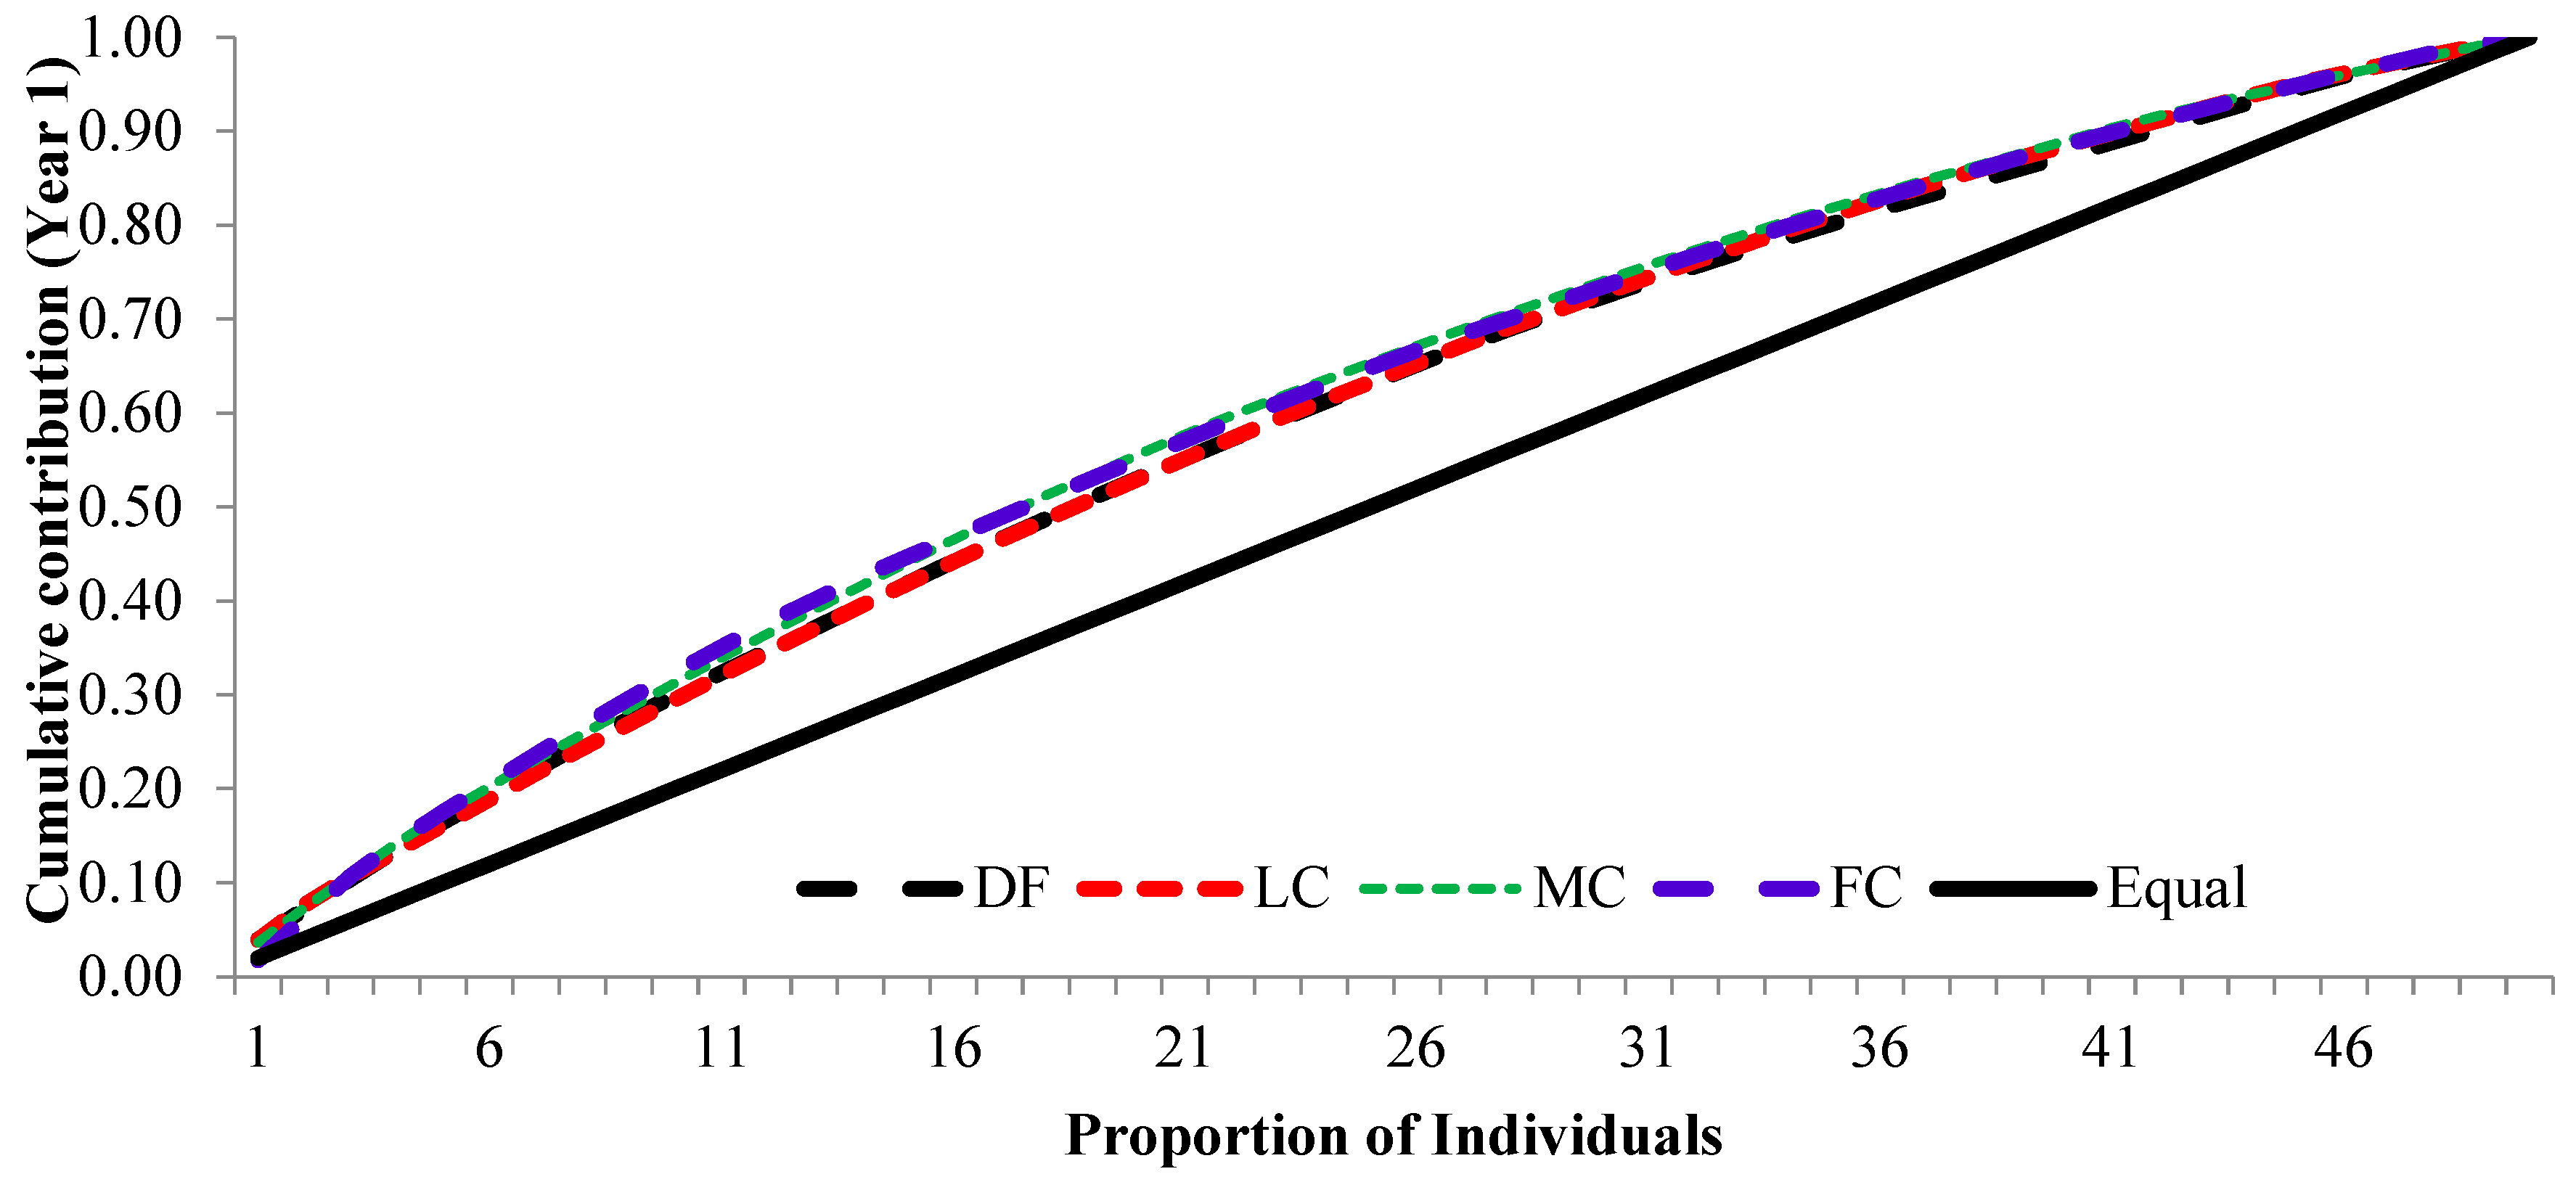
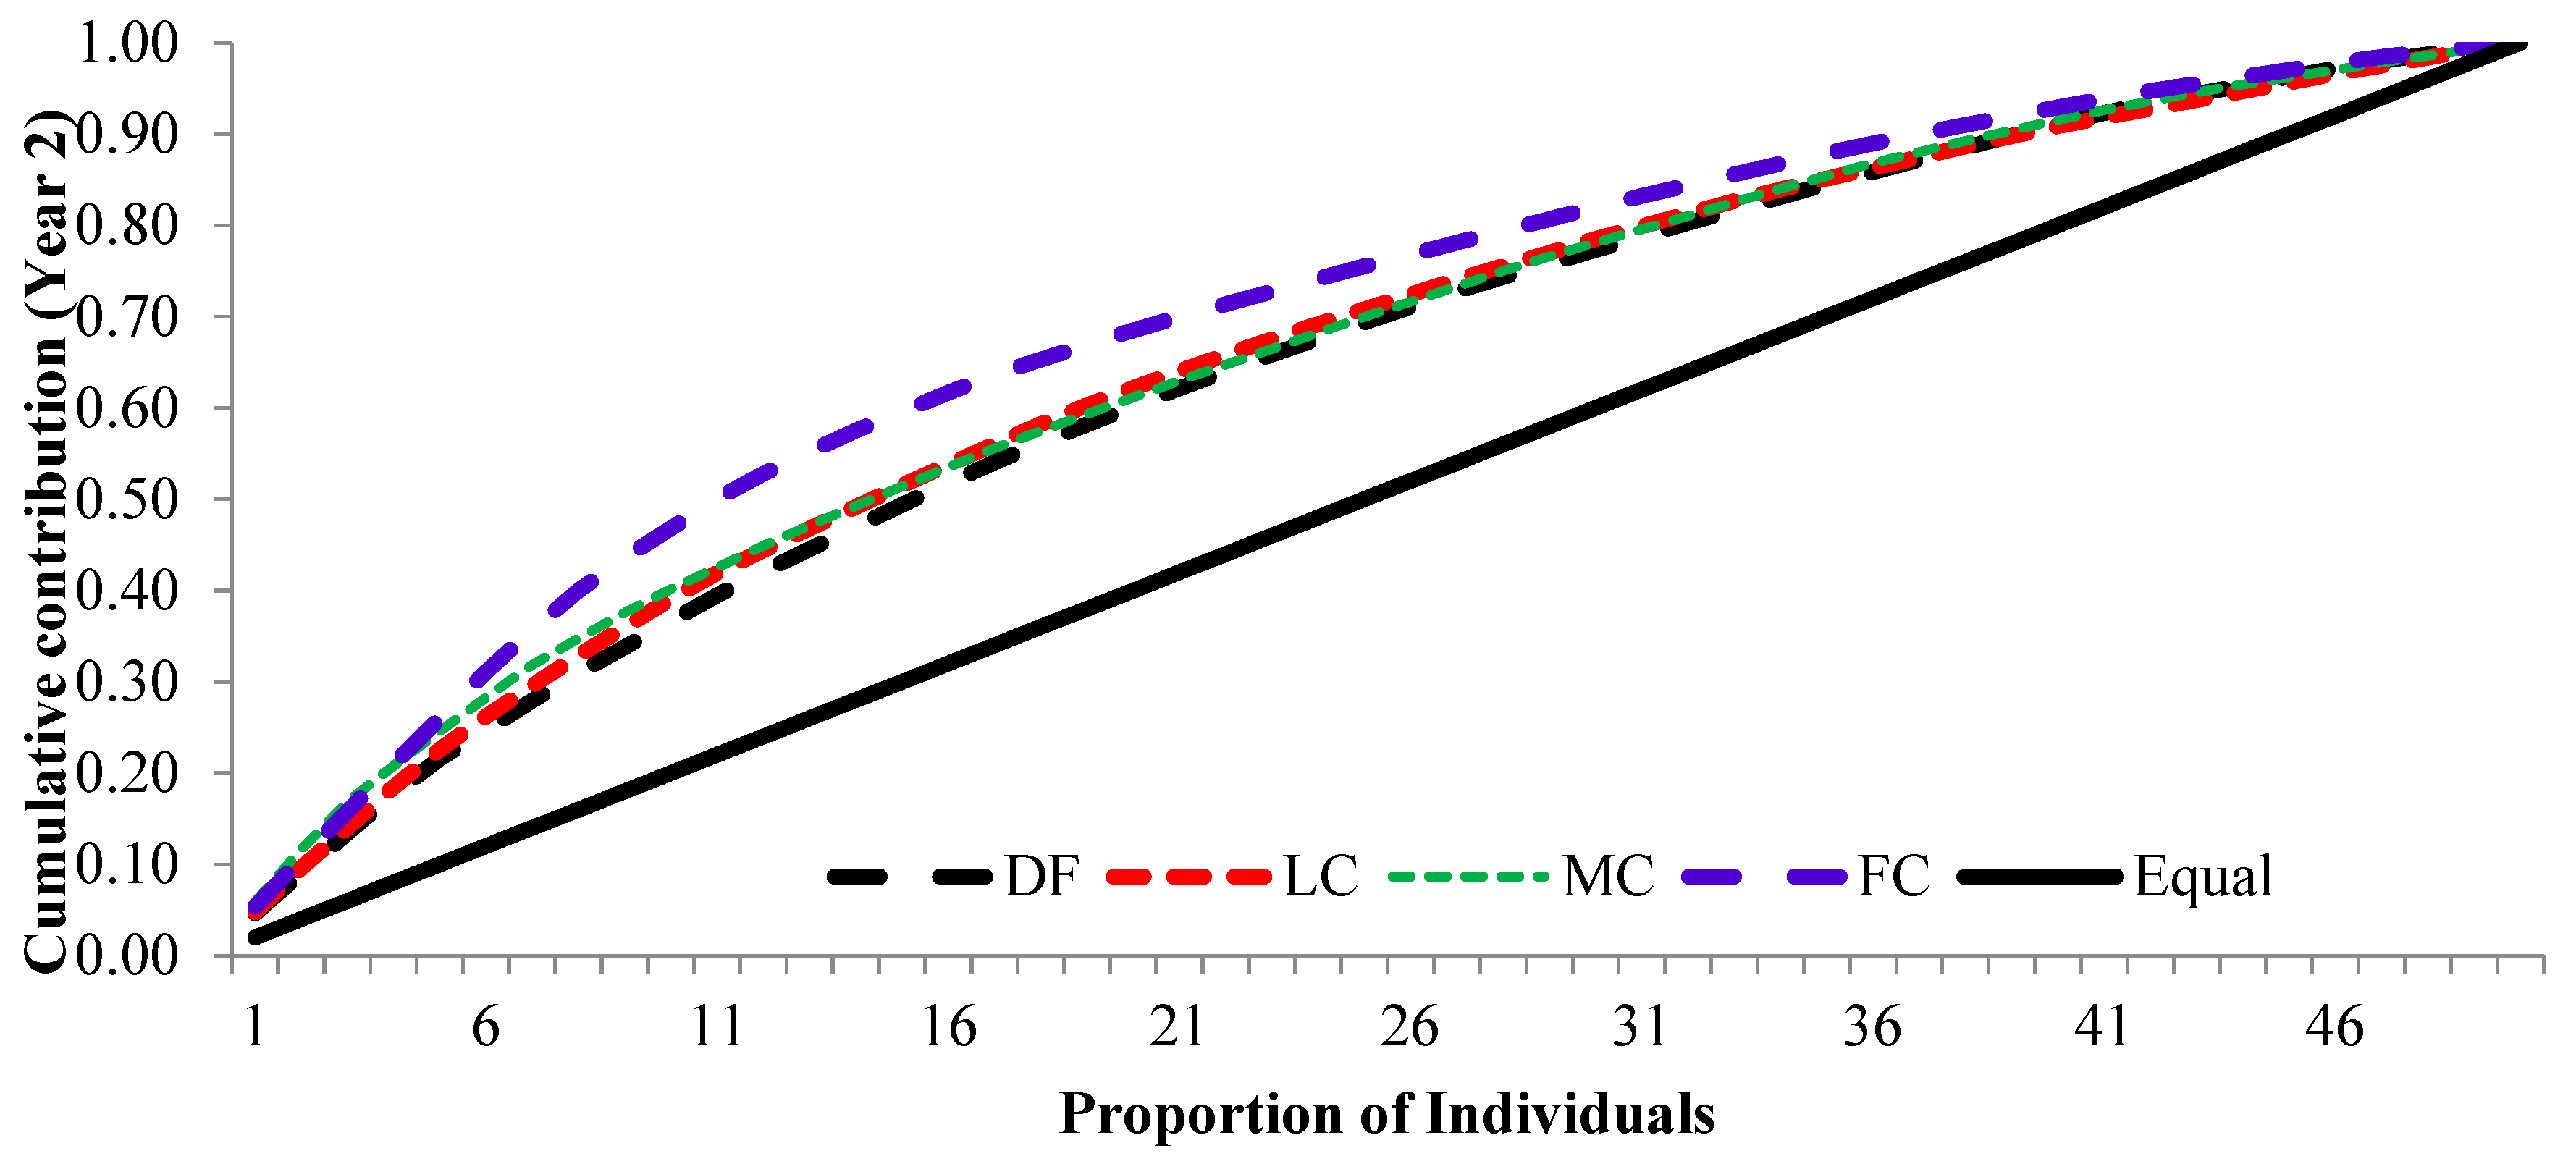
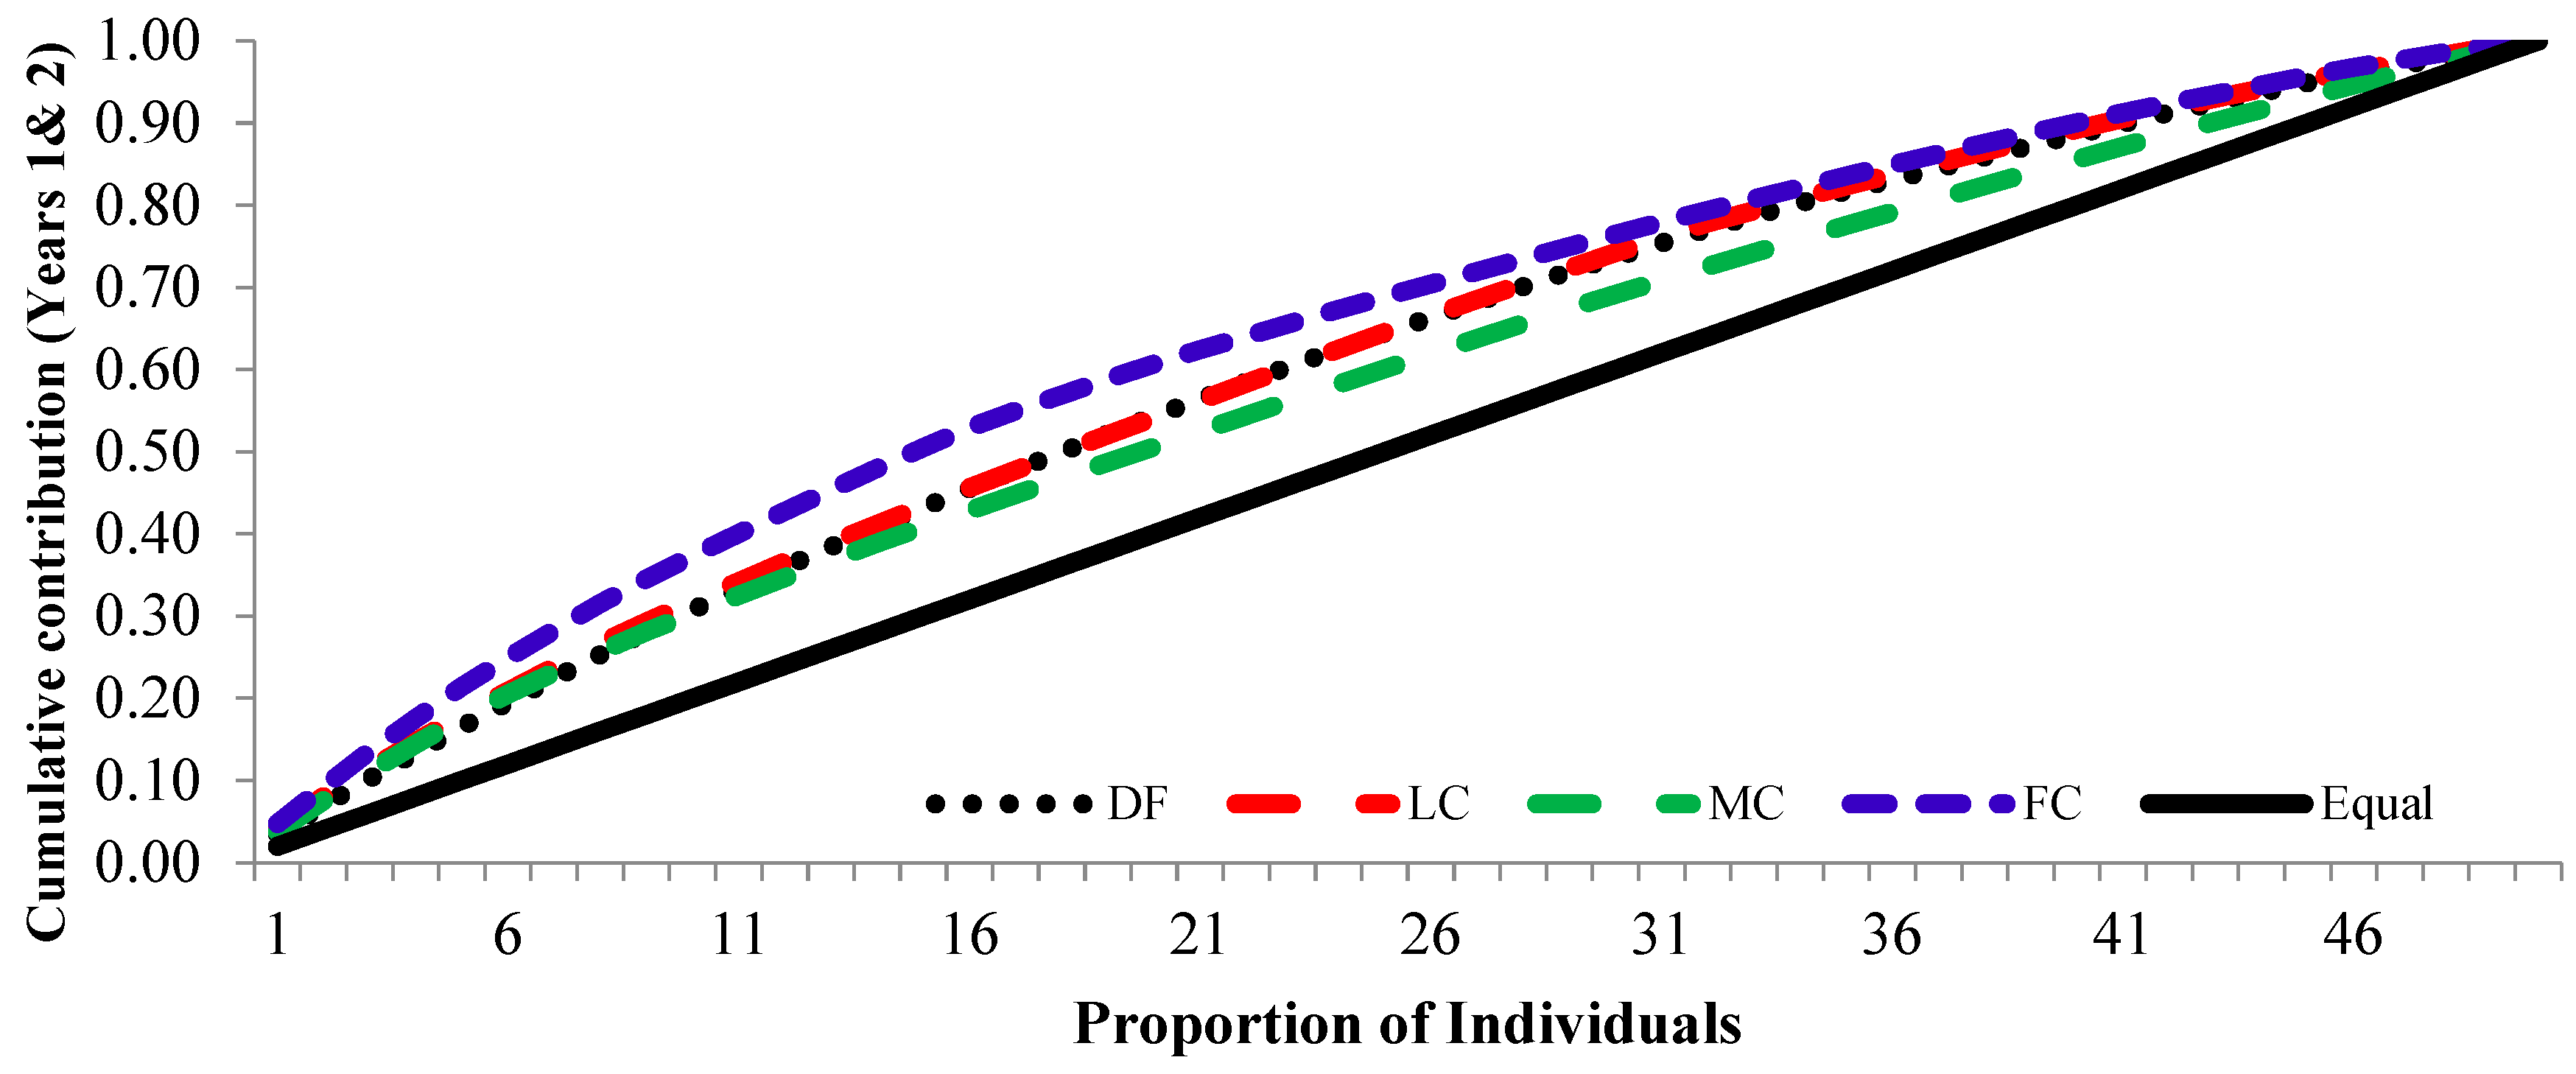
3.3. Cumulative Contribution Curve

The cumulative contribution of trees to the overall fertility estimates for years 1 and 2 and the pooled contribution of two years is shown in Figure 6, Figure 7 and Figure 8.
The cumulative contribution curve describes the relative proportion of trees to the accumulative gamete contribution. In an ideal situation, an equal contribution from each of the individuals (a condition where Ψ = 1) is expected; this cumulative curve attained a straight line. There was a deviation in cumulative contribution from the expectation in all crown closure classes. It could be inferred that various crown closure classes (DF, LC, MC and FC) showed a similar trend in both years (Figure 6 and Figure 7). Only FC showed a skewed distribution in year 2. It could thus be concluded that the FC deviated from the ideal situation more, compared to the other three crown closures, only in year 2 (Figure 7), and fertility combined for two years (Figure 8). When the seed crops of the two years were mixed, the cumulative contribution increased (Figure 8) in all crown closure classes.

4. Discussion

4.1. Cone Production

The average cone numbers of DF, LC, and MC (Table 2 and Figure 4) were slightly higher than two populations of the species reported earlier (20 and 22) [9] and a population (19) [11] of Taurus cedar, while it was dramatically higher in FC (40.3) in year 2. It could be due to more competition among trees in FC than the other crown closure classes. Rotation periods of Taurus cedar were 120–140 years on good sites and 160–180 years on poor sites [1]. The crown closure in populations that were at the end of rotation age seemed stable for cone productions in the present study. It is generally suggested that taller trees allocate much of their energy to vegetative growth rather than to reproductive growth [21]. Initial research results and observation suggested that 15–20 kg/ha of additional seeds was sufficient for shelter-wood areas, but higher rates of 20–30 kg/ha were necessary for the strip clear-cut areas of the species [1]. The results of the study showed that additional cones/seeds could be obtained by CCC management, such as balancing of the tree density and crown closure using forestry practices.
Cone production gave an estimate of the seed yield in the different crown management practices. The large difference in cone productivity among individuals within each crown closure class (Table 2) showed the importance of individual selection of seed trees for regeneration and other silvicultural practices. A statistically significant (p ≤ 0.05) difference in average cone production across years (26.2/tree and 31.4) and among CCCs within the second year emphasized the need for considering the crown closure management practice in forestry for seed harvest, natural regeneration, and other forestry practices (Table 3 and Table 4). The results were in accordance with differences in cone numbers among aspects and years reported by Yazici and Bilir [12] and for strobili productions among years and populations by Bilir and Kang [9,10] in the species. Large differences among individuals within a population and among populations in fecundity and reproductive characteristics were also reported in natural stands of different forest tree species (e.g., [14,15,16,22,23]) and in Taurus cedar (e.g., [9,10,12]). Odabasi [4] reported 144 seeds per cone in Taurus cedar, which worked out to 750 additional seeds per tree in year 2, compared to year 1. However, cone production, which gives an estimate of seed yield, could be affected by many biotic and abiotic factors. Odabasi [4] also reported that altitude had an effect on cone size and weight, contrary to aspect. Growth characteristics did not significantly impact (p > 0.05) cone productions in CCCs for both years, contrary to the significant (p ≤ 0.05) correlations between the diameter at breast height for both years (r = 0.15 and 0.17) in pooled populations. Correlation analysis showed a significant (p ≤ 0.05) positive correlation between cone production and crown closure during both years (r = 0.29). Similar observations were also made by Odabasi [4] for Cedrus libani and Eler [13] for Pinus brutia. Positive correlations in cone production (r = 0.22) and crown closure across years observed in the study were in line with the findings on cone [12] and strobilus [10] productions in the species and other forest tree species (e.g., [16,23]). The results highlighted the importance of considering fertility and crown closure in forest management. Climatic data recorded at the studied location (Figure 1 and Figure 2) were similar to the climate data of the natural distribution of the species reported by Boydak [1]. Eler [13] found that age, elevation, and crown closure were important factors of seed yield for Pinus brutia. Differences in age and environmental variation, mainly in soil properties, might have influenced the observed variation in fruiting and the seed set within each population in the natural forests [15]. Altitudinal differences were reported in strobili production in Pinus brutia [16], cone production among populations in P. nigra [8], and reproductive characteristics in other forest tree species [23]. As the result of a recent study indicating a higher influence of the year and probably of the sensitivity to climate, there was less variability between clones for cone production in a silver fir (Abies alba Mill.) seed orchard [24]. It was also reported that the repeatability of mean annual clone production suggested the moderate continuity of cone crops in the production rank of individual clones, while heritability was under genetic control [24]. However, crown closure was silviculturally manageable.
The coefficient of variation in cone production ranged from 51.4% (DF) to 74.6% (FC) in the second year, while it varied between 32.8% (DF) and 41.0% (FC) in the first year (Table 2). Lower cone production in year 1 than in year 2 was contradictory to an earlier estimation of strobilus production in the species [10]. A low coefficient of variation (CV) is desirable for higher gene diversity for forest managers. It was suggested as a rough, generalized heuristic rule that CV should be lower than 140% (Ψ ≤ 3) for natural populations [25], and the crown closure classes considered in the current study had lower CVs.

4.2. Fertility Variation, Effective Number of Parents, and Gene Diversity

The fertility variation (Ψ) increased with the crown closure, which reduced gene diversity in the second year, while it was similar in different crown closure classes in the first year (Table 5 and Figure 5). It is suggested as a thumb rule that Ψ should be lower than 3 in natural stands and less than 2 in managed populations, such as seed orchards [14]. The proportions of the numbers of cones and fertility variations estimated in the current study populations were acceptable, especially with respect to the highest Ψ value of FC (1.56) in year 2, which is typical of natural populations [14,21] (Table 5). Fertility variations (cone production) of 1.55, 3.05, and 1.64 in pooled stands were aspectual for three consecutive years [12], and 1.43 in a natural population [11] and 1.57 and 1.26 in two natural populations [9] were reported for the species. Fertility, with respect to strobili production, varied between 1.22 and 1.91 in three natural populations of the species for three consecutive years [10]. The results emphasized the importance of the estimation of fertility and reproductive characteristics across years. Data collection on cone production was easier, cheaper, and more accurate than that of other reproductive characteristics, such as strobilus or pollen count, as also suggested by Bilir and Kang [9]. The tree kept the cone in for a longer period than the strobili or the pollen in a year.
The Ψ could also be related by the standard deviation (S) and the average ( x ¯ ) of cone production based on the CV given in equation 1 by Kang and Lindgren [26] and Bilir [7]. It showed the importance of the balance between the amount of cone production and the variation among individual trees for a lower fertility variation and a higher gene diversity.
The effective number of parents (Np) decreased from DF to FC in both years. The effective number of parents (Np) was related by gene diversity (GD) as GD = 1–0.5/Np by Kang and Lindgren [26]. The estimated loss in gene diversity was 0.003 between crown closures in the second year. The highest loss in gene diversity was in FC (0.004) (Table 5). However, it could be balanced to increase gene diversity by natural regeneration, forest tending, or other forestry practices (i.e., mixed seeds from different crown closure classes and years). For instance, gene diversity from the seed crop of year 2 was increased by mixing the seeds from both years (Table 5). Forestry practices such as seed cutting in natural regeneration and seed harvesting were preferred, generally, in a good seed year. However, a poor seed year could also be used for seed collection if the right strategies are used to increase the genetic diversity using suitable management strategies. The results could be used in the establishment of seed collection areas (e.g., spacing). It showed that mixed cones should be harvested from different crown closure classes and years to increase gene diversity in natural regeneration or plantation forestry.

4.3. Future Prospect

Balancing of the crown closure could be considered a management practice in seed sources (i.e., seed orchard, seed stand) and natural stands of the species. The stand structure could be directed to the full crown closure to harvest higher cone productions using forestry practices in natural regeneration areas. Full crown closures could be considered a scale in the management and establishment of seed sources, such as spacing and tree density per area.

5. Conclusions

Differences in cone production and fertility among crown closure classes emphasized the importance of crown closure classes and which ones could be managed by forestry practices (i.e., natural regeneration or plantation forestry). Gene diversity could be enhanced by harvesting cones from different crown closure classes and years. Results of the study could be used in managing gene conservation, seed collection areas (i.e., spacing, balancing of tree density), and other forestry operations, such as natural regeneration practices using the shelter-wood method of the species. Crown closure classes could be used as a guide in forestry practices of the species by forest managers and forest owners.
The impacts of crown closure classes on cone production were investigated in the present study. New studies should be carried out to estimate the impact of crown closure classes on the quality and quantity of seed production and the size, weight, and other characteristics of cones.

Author Contributions

N.Y. conducted data collection with the participation of N.B. and performed the bibliographic review. N.B. and N.Y. analyzed data and organized the manuscript. N.Y. prepared the figures and tables. N.B. edited the final version of the manuscript. All authors have read and agreed to the published version of the manuscript.

Funding

This research received no external funding.

Institutional Review Board Statement

Not applicable.

Data Availability Statement

The data presented in this study are available upon request from the corresponding author.

Acknowledgments

The authors thank the graduate students for their help with data collection and the regional forest directorate for their administrative support. We also thank the anonymous reviewers who made valuable comments that helped improve the manuscript.

Conflicts of Interest

The authors declare no conflict of interest.

References

  1. Boydak, M. Regeneration of Lebanon cedar (Cedrus libani A. Rich.) on karstic lands in Turkey. For. Ecol. Manag. 2003, 178, 231–243. [Google Scholar] [CrossRef]
  2. Anonymous. Forest Inventory of Turkey, Ankara. 2022. Available online: https://www.ogm.gov.tr/tr/e-kutuphane (accessed on 5 May 2022).
  3. Koski, V.; Antola, J. National Tree Breeding and Seed Production Programme for Turkey 1994–2003; The Research Directorate of Forest Tree Seeds and Tree Breeding: Ankara, Turkey, 1993. Available online: https://ortohum.ogm.gov.tr (accessed on 5 May 2019).
  4. Odabasi, T. Research on Cone and Seed Characters of Cedrus libani; General Directorate of Forestry: Ankara, Turkey, 1990. Available online: https://www.ogm.gov.tr (accessed on 5 May 2019).
  5. Griffin, A.R. Clonal variation in radiata pine seed orchards. I. Some flowering, cone and seed production traits. Aust. For. Res. 1982, 12, 295–302. Available online: http://jkv.50megs.com/afr.html (accessed on 5 May 2019).
  6. Savolainen, O.; Karkkainen, K.; Harju, A.; Nikkanen, T.; Rusanen, M. Fertility variation in Pinus sylvestris: A test of sexual allocation theory. Am. J. Bot. 1993, 80, 1016–1020. [Google Scholar] [CrossRef]
  7. Bilir, N. Fertility variation in wild rose (Rosa canina) over habitat classes. Int. J. Agric. Biol. 2011, 13, 110–114. [Google Scholar]
  8. Bilir, N.; Catal, Y.; Tekocak, S.; Cercioglu, M. Fertility variation in endemic populations of Ehrami black pine (Pinus nigra Arnold. subsp. Pallasiana var. pyramidata). J. For. Res. 2017, 28, 683–686. [Google Scholar] [CrossRef]
  9. Bilir, N.; Kang, K.S. Estimation of fertility variation by strobili and cone productions in Taurus cedar (Cedrus libani A. Rich.) populations. In Proceedings of the IUFRO Forest Tree Breeding Conference, Prague, Czech Republic, 25–29 August 2014; p. 42. Available online: http://www.iufrobreeding2014.org/ (accessed on 5 May 2019).
  10. Bilir, N.; Kang, K.S. Fertility variation, seed collection and gene diversity in natural stands of Taurus cedar (Cedrus libani). Eur. J. For. Res. 2021, 40, 199–208. [Google Scholar] [CrossRef]
  11. Bilir, N.; Ozel, H.B. Fertility variation in a natural stand of Taurus cedar (Cedrus libani A. Rich.). In Proceedings of the International Forestry and Environment Symposium (IFES), Trabzon, Turkey, 7–10 November 2017; Available online: http://www.ktu.edu.tr/ifes2017 (accessed on 5 May 2019).
  12. Yazici, N.; Bilir, N. Aspectual fertility variation and its effect on gene diversity of seeds in natural stands of Taurus cedar (Cedrus libani A. Rich.). Int. J. Genom. 2017, 2017, 2960624. [Google Scholar] [CrossRef] [PubMed]
  13. Eler, U. Seed Yield in Calabrian Cluster Pine (Pinus brutia Ten.) by Age; Technical Bulletin No. 225; Forest Research Institute: Antalya, Turkey, 1990; p. 78. Available online: https://centralanatolia.ogm.gov.tr (accessed on 5 May 2019).
  14. Kang, K.S.; Bila, A.D.; Harju, A.M.; Lindgren, D. Fertility variation in forest tree populations. Forestry 2003, 76, 329–344. [Google Scholar] [CrossRef]
  15. Bila, A.D.; Lindgren, D. Fertility variation in Milletias thuhlmannii, Brachystegia spiciformis, Brachystegia bohemii and Leucaena leucocephala and its effects on relatedness in seeds. For. Genet. 1998, 5, 119–129. Available online: https://kf.tuzvo.sk/sites/default/files/FG05-2_119-129.pdf (accessed on 5 May 2019).
  16. Bilir, N.; Kang, K.S.; Lindgren, D. Fertility variation in six populations of Brutian pine (Pinus brutia Ten.) over altitudinal ranges. Euphytica 2005, 141, 163–168. [Google Scholar] [CrossRef]
  17. Saatcioglu, F. Silviculture-I; Forestry Faculty of Istanbul University Press: Istanbul, Turkey, 1976; Available online: https://cerrahpasa.iuc.edu.tr/ (accessed on 5 May 2019).
  18. SAS. Statistical Analysis System; SAS Institute, Inc.: Cary, NC, USA, 2004; Available online: https://www.sas.com (accessed on 5 May 2019).
  19. Rohlf, F.J.; Sokal, R.R. Statistical Tables; Macmillan: New York, NY, USA, 1995; Available online: https://www.scirp.org (accessed on 5 May 2019).
  20. Kang, K.S.; Lindgren, D. Fertility variation among clones of Korean pine (Pinus koraiensis S. et Z.) and its implications on seed orchard management. For. Genet. 1999, 6, 191–200. Available online: https://kf.tuzvo.sk/sites/default/files/FG06-3_191-200.pdf (accessed on 5 May 2019).
  21. Kang, K.S. Genetic Gain and Gene Diversity of Seed Orchard Crops. Ph. D Thesis, Swedish University of Agricultural Science, Acta Universitatis Agriculturae Sueciae, Umeå, Sweden, 2001; p. 75. Available online: https://www.upsc.se (accessed on 5 May 2019).
  22. Shea, K.L. Effects of population structure and cone production on out crossing rates in Engelmann spruce and Subalpine fir. Evolution 1987, 41, 124–136. [Google Scholar] [CrossRef]
  23. Kamalakannan, R.; Varghese, M.; Park, J.M.; Kwon, S.H.; Song, J.H.; Kang, K.S. Fertility variation and its impact on effective population size in seed stands of Tamarindus indica and Azadirachta indica. Silvae Genet. 2015, 64, 91–99. [Google Scholar] [CrossRef]
  24. Teodosiu, M.; Botezatu, A.; Ciocîrlan, E.; Mihai, G. Variation of cones production in a Silver fir (Abies alba Mill.) clonal seed orchard. Forests 2023, 14, 17. [Google Scholar] [CrossRef]
  25. Kang, K.S.; Bilir, N. Seed Orchards (Establishment, Management and Genetics); OGEM-VAK Press: Ankara, Turkey, 2021; Available online: https://www.ogemvak.org.tr/ (accessed on 5 May 2022).
  26. Kang, K.S.; Lindgren, D. Fertility variation and its effect on the relatedness of seeds in Pinus densiflora, Pinus thunbergii and Pinus koraiensis clonal seed orchards. Silvae Genet. 1998, 47, 196–201. Available online: https://www.degruyter.com (accessed on 5 May 2019).
Figure 1. Monthly maximum, minimum, and average temperatures of the studied location during the study period.
Forests 14 01130 g001
Figure 2. Monthly average of total rainfall and the humidity of the studied location during the study period.
Forests 14 01130 g002
Figure 3. Mature cones of Taurus cedar in the studied population.
Forests 14 01130 g003
Figure 4. Averages of cone production (DF was degraded forest, LC was low crown coverage, MC was medium crown coverage, and FC was full crown coverage).
Forests 14 01130 g004
Figure 5. Fertility variation for crown closures and years. (DF was degraded forest, LC was low crown coverage, MC was medium crown coverage, and FC was full crown coverage.)
Forests 14 01130 g005
Figure 6. Cumulative contribution of parental-balance curves in different crown closure classes in year 1. (DF was degraded forest, LC was low crown coverage, MC was medium crown coverage, and FC was full crown coverage.)
Forests 14 01130 g006
Figure 7. Cumulative contribution of parental-balance curves in different crown closure classes in year 2. (DF was degraded forest, LC was low crown coverage, MC was medium crown coverage, and FC was full crown coverage.)
Forests 14 01130 g007
Figure 8. Cumulative contribution of parental-balance curves in different crown closure classes in years 1 and 2. (DF was degraded forest, LC was low crown coverage, MC was medium crown coverage, and FC was full crown coverage.)
Forests 14 01130 g008
Table 1. Growth details and altitudes of the crown closure classes.
CCCs *
CharacteristicsDFLCMCFC
H (m)20.321.220.021.6
D0 (cm)64.174.972.189.4
d1.30 (cm)53.963.462.478.2
CD (m)7.38.98.410.0
Age (year)121131127139
Altitude (m)1632163016281628
*: DF was degraded forest, LC was low crown coverage, MC was medium crown coverage, and FC was full crown coverage.
Table 2. Average ( x ¯ ), range, and coefficient of variation (CV %) in numbers of cone production for the crown closures and years.
CCCs *DFLCMCFC
YearsYear 1Year 2 **Year 1Year 2Year 1Year 2Year 1Year 2
x ¯ 25.228.3 a25.527.1 a24.629.8 a29.540.3 b
Range11–509–6610–5010–6510–4510–8810–678–108
CV32.851.433.556.037.561.141.074.6
*: CCCs was crown closure classes, DF was degraded forest, LC was low crown coverage, MC was medium crown coverage, and FC was full crown coverage. **; The same letters showed no significant different at p > 0.05 within the year.
Table 3. Analysis of variance for cone productions between years and among CCCs.
SourceVariabledfSum SquareMean SquareFp
Modelyear 13135,077.948 a45,025.983509.161***
year 23196,108.588 b65,369.529164.498***
Year (Y)year 11134,838.434134,838.4341524.774***
year 21191,717.364191,717.364482.444***
CCCsyear 11238.595238.5952.698NS
year 213735.8693735.8699.401**
Y × CCCs interactionyear 110.9190.9190.010NS
year 21655.355655.3551.649NS
Erroryear 119717,421.05288.432
year 219778,285.412397.388
Totalyear 1200152,499.000
year 2200274,394.000
a and b: R2 values were 0.886 and 0.715, respectively. *** Indicates statistically significant difference at the probability level of 0.01, ** indicates statistically significant difference at the probability level of 0.05, and NS indicates no statistically significant difference (p > 0.05).
Table 4. Pairwise comparison of the CCCs for cone productions.
CCCs (I)CCCs (J)Year 1Year 2
Mean Difference (I–J)Sig. (p) *Mean Difference (I–J)Sig. (p) *
LC−0.26NS1.14NS
DFMC0.60NS−1.48NS
FC−4.28NS−12.00p ≤ 0.05
DF0.26NS−1.14NS
LCMC0.86NS−2.62NS
FC−4.02NS−13.14p ≤ 0.05
DF−0.60NS1.48NS
MCLC−0.86NS2.62NS
FC−4.88NS−10.52p ≤ 0.05
DF4.28NS12.00p ≤ 0.05
FCLC4.02NS13.14p ≤ 0.05
MC4.88NS10.52p ≤ 0.05
* Indicates statistically significant difference at the probability level of 0.05, and NS indicates no statistically significant difference (p > 0.05).
Table 5. Fertility variation (Ψ), effective number of parents (Np), relative effective number of parent (Nr), and gene diversity (GD) in the crown closure classes and years.
CCCs *DFLCMCFC
YearsYear 1Year 21 and 2Year 1Year 21 and 2Year 1Year 21 and 2Year 1Year 21 and 2
Ψ1.111.261.121.111.311.141.141.371.091.161.551.26
Np45.2339.7144.6045.0438.2543.7343.9536.6245.7942.9232.3539.60
Nr **0.910.790.890.900.770.870.880.730.920.860.650.79
GD0.9890.9870.9890.9890.9870.9890.9890.9860.9890.9880.9840.988
*: CCCs was crown closure classes, DF was degraded forest, LC was low crown coverage, MC was medium crown coverage, and FC was full crown coverage. **; Nr = Np/N.
Disclaimer/Publisher’s Note: The statements, opinions and data contained in all publications are solely those of the individual author(s) and contributor(s) and not of MDPI and/or the editor(s). MDPI and/or the editor(s) disclaim responsibility for any injury to people or property resulting from any ideas, methods, instructions or products referred to in the content.

