Article

Effect of High-Temperature Paraffin Impregnation on the Properties of the Amorphous Cellulose Region Based on Molecular Dynamics Simulation

College of Mechanical and Electrical Engineering, Northeast Forestry University, Harbin 150040, China
*
Author to whom correspondence should be addressed.
Forests 2023, 14(6), 1068; https://doi.org/10.3390/f14061068
Submission received: 23 April 2023 / Revised: 19 May 2023 / Accepted: 21 May 2023 / Published: 23 May 2023
(This article belongs to the Section Wood Science and Forest Products)

Abstract

:
A paraffin–cellulose composite model was created using Materials Studio software, establishing a cellulose chain with a polymerization degree of 20 and paraffin molecules. A theoretical foundation for the research of wood heat treatment was established by explaining the changes in macroscopic qualities, such as mechanical properties, water absorption, etc., from a microscopic point of view. The model tended to a stable state with lower energy through geometric optimization and kinetic relaxation. The dynamics simulation was run based on this condition at a total of five different temperatures: 100 °C, 150 °C, 170 °C, 190 °C, and 210 °C. The energy balance, paraffin molecular diffusion coefficients, cell parameters and densities, hydrogen bonding numbers and mechanical parameters of the paraffin–cellulose composite model were analyzed. The results demonstrated that the paraffin diffusion range increased with temperature, and the paraffin diffusion coefficient was greatest at 210 °C, which also resulted in the maximum cell volume, the lowest density, and the lowest water absorption at this temperature. On the other hand, the paraffin–cellulose hybrid model had the most hydrogen bonds and the most stable system at 100 °C. The mechanical properties of the amorphous cellulose region of wood are influenced by temperature. According to the calculation of Lamé constants, with the system’s temperature rise, Young’s modulus (E) and shear modulus (G) were maximum at 100 °C, indicating the wood’s optimal toughness and plasticity. Poisson’s ratio and K/G values were largest at 210 °C, indicating the optimal toughness and plasticity of wood. The thermal modification of wood under different conditions can not only retain its natural advantages, but also improve its own performance, expand the application range of wood, and increase the utilization rate of wood. Therefore, the appropriate temperature and other conditions can be selected according to the actual needs of the wood heat treatment, which has significant practical significance for the study of wood heat treatment.

1. Introduction

Wood is a natural material for construction and home decoration, widely used by the public in daily life. However, plantation wood has many deficiencies, such as low survival rate, low dimensional stability, poor mechanical properties, easy to decay, and other problems, which reduce the scope of its production and utilization. Wood modification is essential to improve the performance and utilization of wood. One of the most typical forms of wood modification is heat treatment, which has been widely applied in industrialization [1].
Wood heat treatment is widely used for the functional improvement of wood. On one hand, this is because many studies have shown that the technology is excellent and has broad application prospects; on the other hand, it is due to its environmental protection, low cost, ease of operation, and other advantages. Compared with untreated wood, different treatment media, treatment methods, treatment time, and other factors will affect the mechanical properties of wood. Kamperidou et al. [2] found that the mechanical properties of wood were affected differently by using different treatment times to heat treat Scots pine wood. The impact bending strength of the wood tended to decrease significantly as the heat treatment time increased. Guo et al. [3] found that the rigidity and anti-deformation ability of cellulose chains increased and then decreased with increasing oxygen concentration during wood heat treatment, peaking at 2% oxygen concentration. If the treatment conditions are not appropriately set, the wood may deform or crack, which will affect the subsequent use of the wood. Esteves et al. [4] found that after steam heat treatment, the dimensional stability of the wood improved, but the mechanical properties decreased. Durmaz et al. [5] conducted heat treatment of Scots pine, and the results showed that the shrinking and swelling characteristics, the bending strength, and the modulus of elasticity of wood reduced with the rise in heat treatment temperature and time. Fang et al. [6] conducted heat treatment in canola oil and found that oil heat treatment significantly reduced the Brinell hardness, strength of extension, and fracture modulus of densified wood veneer. Therefore, rational wood process optimization is of great significance and value.
Paraffin wax is an inexpensive, hydrophobic, and non-hazardous chemical used in candle making, civil engineering, and wood preservation for its hydrophobic properties to protect the wood from water damage. Dimensional stability is improved due to reduced water absorption by the wood [7]. Amthor [8] found that paraffin waxes and paraffin emulsions are used in the long term to minimize water immersion, improve the dimensional stability of particleboard, and for hydrophobic treatment of solid wood. Esteves et al. [9] found that by impregnating wood with paraffin wax, the wood’s bending strength and hardness could be increased, and the mechanical properties of wood could be improved. Reinprecht et al. [10] found that impregnating wood with paraffin wax at a temperature higher than 190 °C significantly decreased the impact bending strength. Therefore, combining wood paraffin impregnation techniques with thermal modification in paraffin wax can have a synergistic effect. Humar et al. [11] found that the combination of wax treatment and thermal modification of Norwegian spruce specimens could improve hydrophobicity and mechanical properties of wood, thus improving the durability of wood.
Molecular simulations have existed since the 20th century, evolving from the earliest ball-and-stick model. Until now, molecular simulation technology has experienced considerable development and is becoming increasingly mature [12]. It has been regarded as another essential research method after the experimental and theoretical analysis methods. The molecular dynamics simulation method is one of the most commonly used molecular simulation methods, which obtain the trajectories of particles by solving the classical mechanical equations of the motion of molecules or molecular systems. The method can calculate the structure and properties of the simulated system. This method provides an excellent theoretical foundation for available macroscopic experiments [13]. It offers a way of predicting research for the further development of macro experiments, which can reduce the experiment-related research cost and time cost. However, there are few articles that used this method to study wood heat treatment, so this paper uses molecular dynamics to explain the effect of temperature change on wood-related properties during heat treatment processing from a microscopic perspective, so as to find the heat treatment temperature interval that can better improve the desired properties.
Cellulose is the main ingredient of wood and determines the structure and properties of wood. It is a compound polymerized by D-glucopyranose rings and is made up of a crystalline region and an amorphous region [14]. The cellulose molecules in the crystalline region are arranged compactly and neatly, which provides good mechanical properties even at high temperatures [15]. In contrast, the distribution of cellulose molecules in the amorphous zone is irregular with a large number of pores, which are easier for small molecules to penetrate, which causes the structure between cellulose to become easily disrupted and further affects the mechanical properties of cellulose. Consequently, the amorphous zone of cellulose was determined as the focus of this study to explore the changes of wood during the heat treatment process.
The effect of paraffin impregnation heat treatment on wood properties has been studied by macroscopic characterization, but the study of the internal mechanism is lacking. In this study, a paraffin–cellulose amorphous zone model was developed to simulate the impact of high-temperature paraffin impregnation treatment on wood from a microscopic perspective using Materials Studio software, which was analyzed based on energy variation, paraffin molecular diffusion coefficients, cell parameters and density, hydrogen bonding numbers, and mechanical properties. This leads to the mechanism of the impact of temperature on the properties of the amorphous zone of cellulose from the microscopic point of view, explaining more obviously how it affects wood, which is essential to improve wood utilization.

2. Materials and Methods

2.1. Model Establishment

Materials Studio software can more easily build 3D structural models, which can help researchers solve a series of significant problems in chemistry, materials, and so on [16]. Therefore, this software was chosen for use in this study to explain the effect of different temperatures on certain aspects of wood properties from a microscopic point of view. The amorphous region of cellulose Iβ was established using the method of unstructured polymer construction [17]. Existing research results show that the degree of cellulose polymerization has little impact on the material’s properties in a molecular dynamics simulation. The simulation results are consistent with the actual situation when the cellulose polymerization degree is greater than 10 [18]. Although the actual chain length of cellulose is quite large, the increase in the chain length in the simulation process will increase the simulation time and complexity. Therefore, a cellulose chain with a polymerization degree of 20 was selected in this study. The amorphous region model of the cellulose chain is shown in Figure 1a. The paraffin molecule was represented by C28H58, and the molecular model is depicted in Figure 1b.
The hybrid model of paraffin–cellulose amorphous zone was set up by the Amorphous Cell module, which consists of eight paraffin molecules and one cellulose chain with a degree of polymerization of 20. The paraffin–cellulose amorphous zone hybrid model with a density of 1.5 g/cm3 [19], the established model, is shown in Figure 2. Cellulose molecules are shown in stick mode, and the paraffin molecules are shown in ball-and-stick mode, with red balls representing carbon atoms and white balls representing hydrogen atoms.

2.2. Dynamic Simulation

After the modeling was completed, the initial geometry optimization of the paraffin–cellulose model was performed using the Forcite Geometry Optimization module with the Smart algorithm for 5000 steps to relax the molecules throughout the model [20]. After energy minimization and stabilization of the system, the initial dynamic relaxation was used in the Forcite Dynamic module, setting the temperature to 27 °C for regular system molecular dynamics (NVT) simulations. The initial speed was set as random, the time step was 1 fs, the total time of the simulation was 1000 ps, and the output frame was every 5000 steps. Through relaxation, the initial internal stress of the system decreased, the energy reached a lower stable state, and the initial framework of the following dynamic simulation was obtained. The simulated temperatures were 100 °C, 150 °C, 170 °C, 190 °C, and 210 °C for five simulated systems. During the simulations, the pcff force field applicable to the calculation of organic compounds was chosen because the mixing system of paraffin molecules and cellulose chains involves the calculation of organic compounds [21]. An isothermal isobaric (NPT) ensemble was used for dynamic simulation. The temperature was controlled by the Andersen method [22]. The pressure was influenced by the Berendsen method [23]. The electronic overlay used the Ewald method. The van der Waals force was calculated using the atom-based method [24].

3. Results and Discussion

3.1. Energy

3.1.1. Balance of the System

In molecular dynamics, the trend of energy and temperature changes over time can be a criterion to determine whether the system is stable [25]. After the dynamics simulation of the paraffin–cellulose model of 1 ns, the energy and temperature changes of the system with time are shown in Figure 3. The system was judged to be in equilibrium when the rise and fall of the system energy were within the range of 5%–10%. To more accurately judge whether a simulation system is balanced, the energy convergence parameter is used to evaluate the system’s energy balance [26], which can be obtained from Equation (1).
δ E = 1 N i = 1 N E i E 0 E 0
In the formula, E 0 indicates the initial trial energy value of the simulation, E i indicates the energy value after i steps, and N indicates the total length of steps of the simulation. When δ E ≤ 0.001–0.003, it suggests that the system converges to equilibrium and the simulation results are reliable. Through calculation, we found that at the last 200 PS, δ E = 0.0014, which proves that the energy converged and reached equilibrium.
As shown in Figure 3b, the temperature variance over time during the simulation was slight and varied within ±25 °C, indicating that the system was in a state of balance. It can be seen that the energy of the paraffin–cellulose hybrid system was energetically stable after the initial geometry optimization and dynamic relaxation, which proves the reliability of this study.

3.1.2. Total Potential Energy and Non-Bond Energy

In this study, the pcff force field was adopted, and the sum of the bond and non-bond energies is equal to the total potential energy of the system [27]. The equation is as follows.
ETotal = Ebond + Enonbond
In the formula, ETotal, Ebond, and Enonbond represent total potential energy, bond energy, and non-bond energy, respectively. Enonbond includes hydrogen bonds, van der Waals interaction, and electrostatic interaction. In molecular dynamics simulations, when the total potential energy and non-bond energy change with temperature, the bond energy at this time also changes. Table 1 shows the total potential energy, bond energy, and non-bond energy under five different temperature models.
As illustrated in Table 1, the total potential energy is greater than the non-bond energy, and the total potential energy increases with increasing temperature while its stability decreases gradually. At the same time, the difference between the non-bond energy and the total potential energy gradually increases with the increase in temperature, and the repulsive forces between atoms within molecules gradually increase.

3.2. Mean Square Displacement of Paraffin

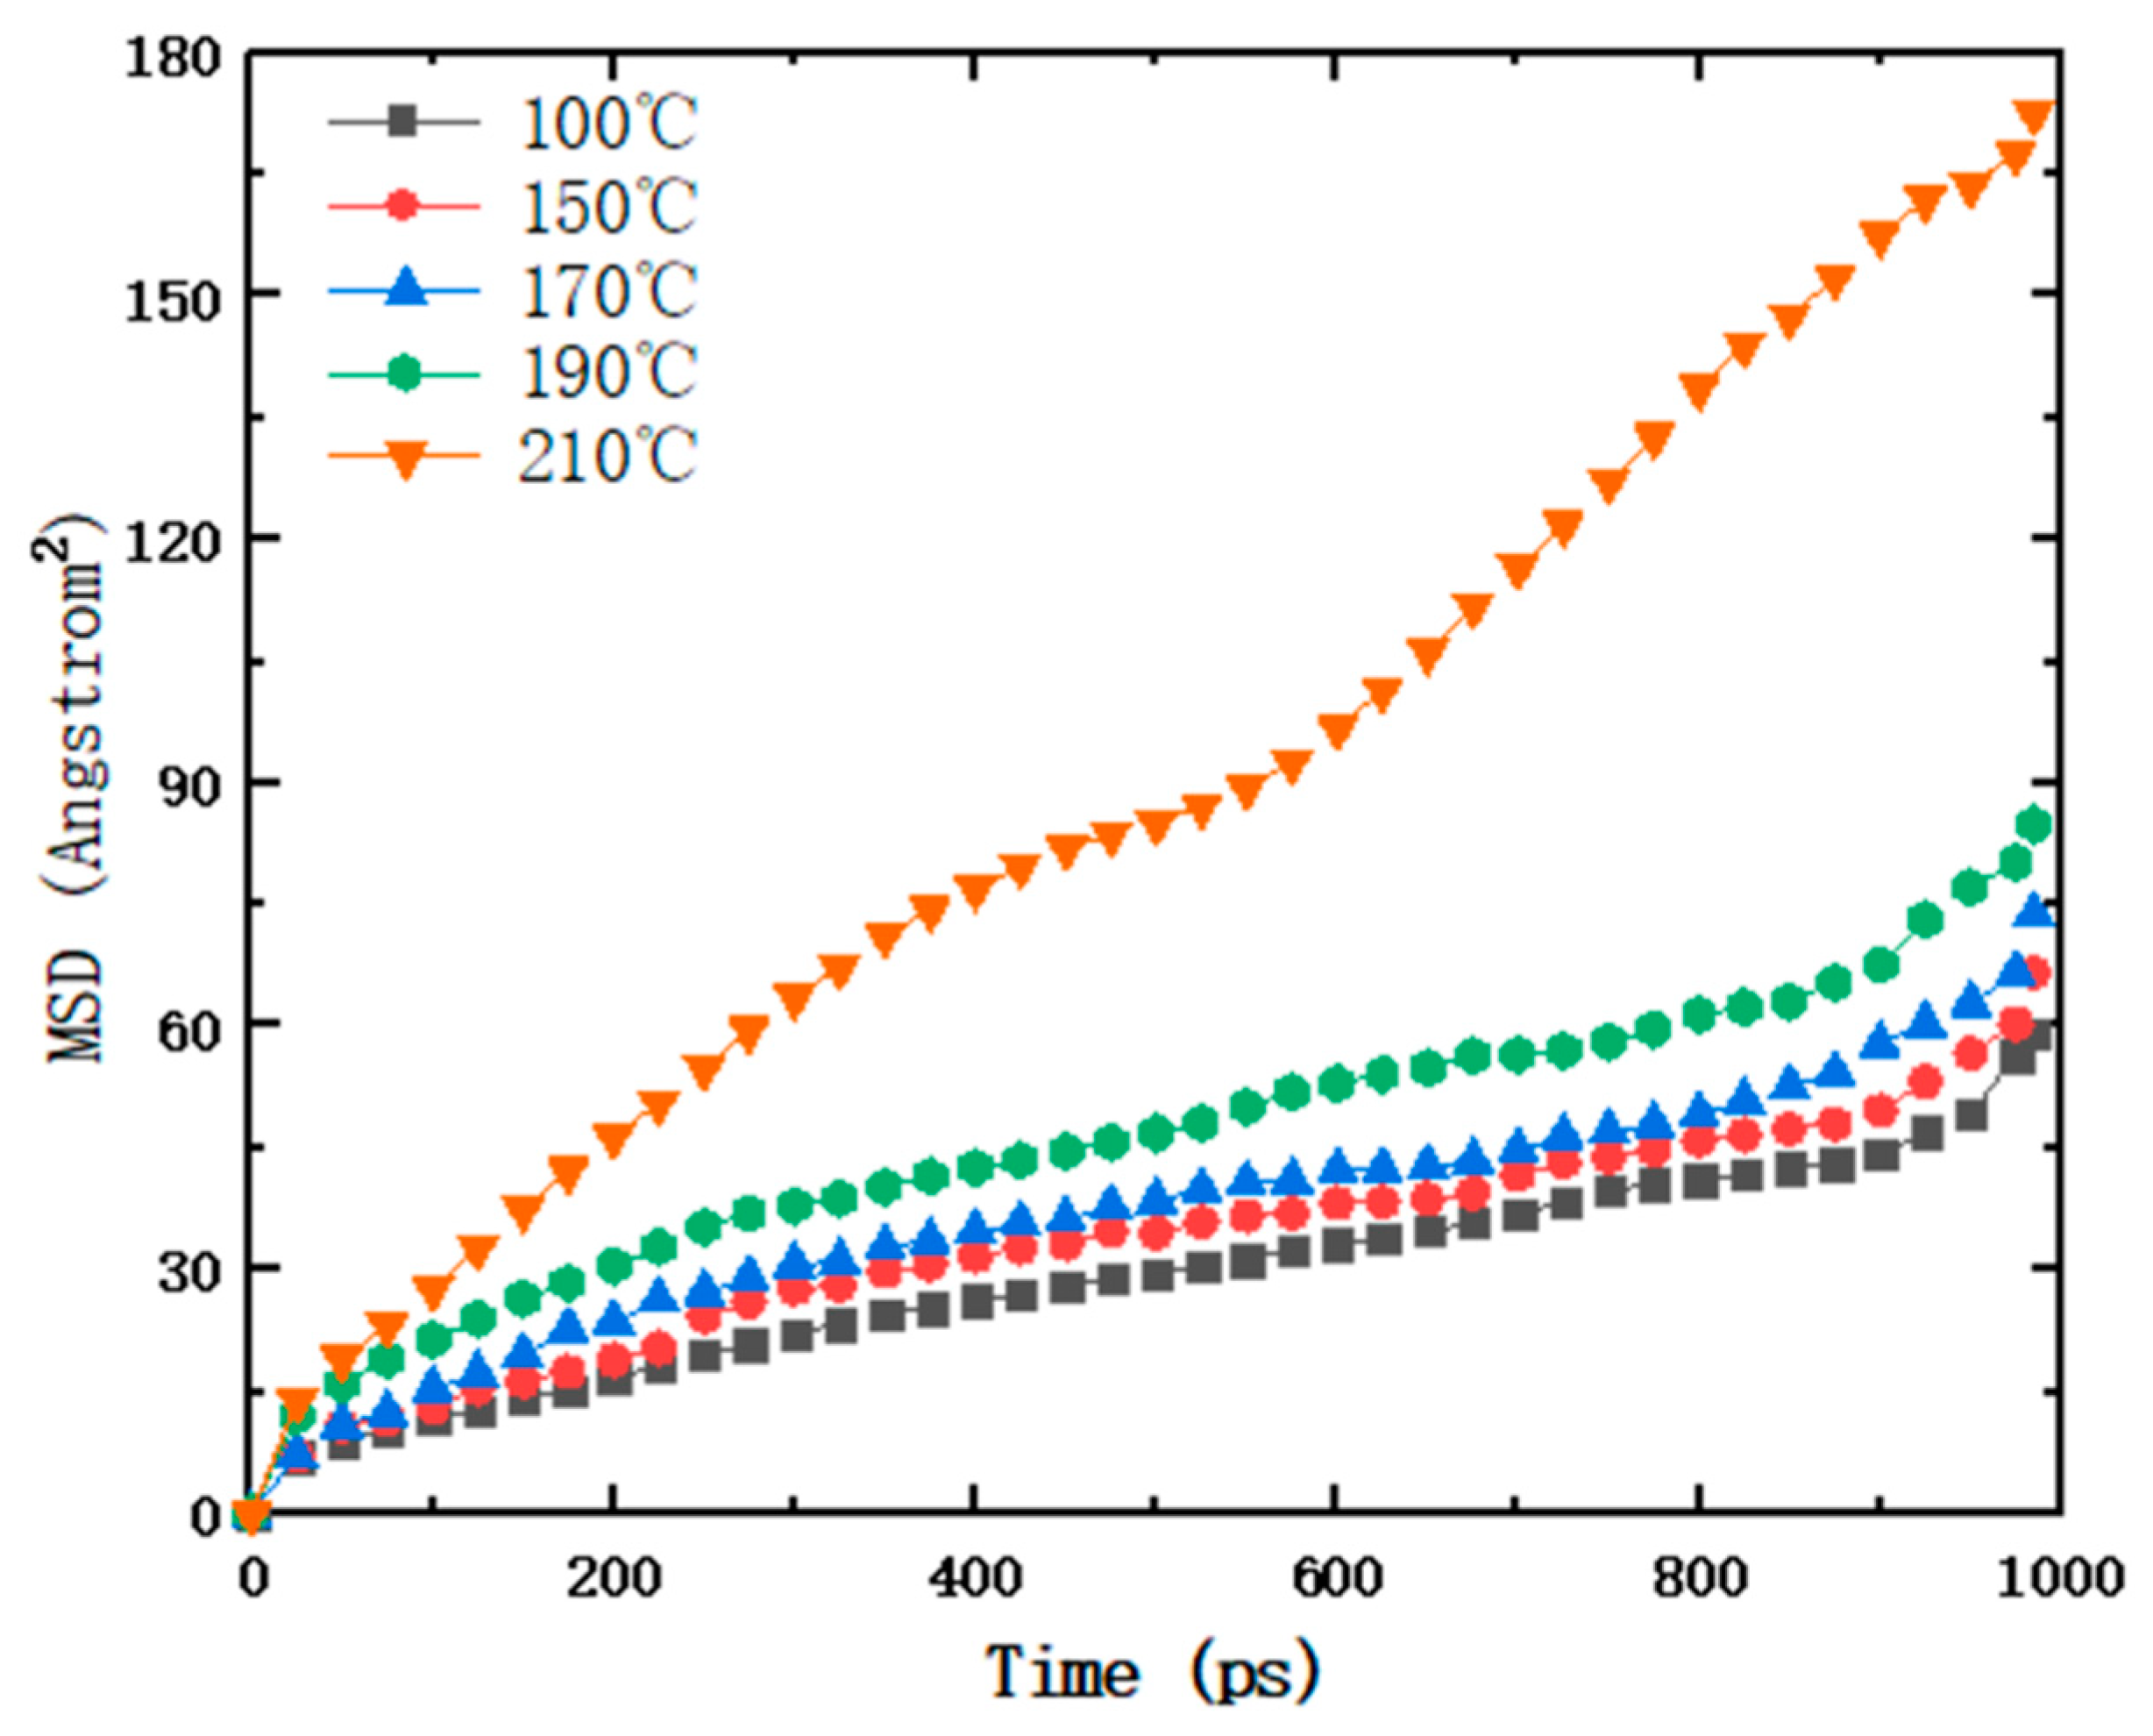
Mean square displacement is the mean square sum of the changes in position vectors of the molecules in the system after a series of simulations [28]. MSD can effectively represent the movement behavior and migration path of molecules in the model over a period of time and plays a role in understanding the diffusion changes of the molecules. MSD is calculated as Equation (3), which refers to the sum of squares of the difference between the distance traveled by all particles in the system and the absolute distance traveled by all particles after t time, where <> indicates the average value, and n is the number of diffusing particles.
MSD = i = 1 n r i t r i 0 2
The molecular diffusion coefficient (D) is commonly used to describe the diffusion behavior of small molecules of a gas and can be obtained from Equation (4).
D = 1 6 n l i m t d d t i = 1 n | r i t r i 0 | 2
The molecular diffusion coefficient (D) can be further simplified in Equation (5). The k in the equation means the slope obtained after fitting the MSD curve.
D = k 6
The paraffin–cellulose mixed model was analyzed, and the MSD curves of paraffin molecules at different temperatures were obtained, as shown in Figure 4.
Moreover, the MSD curve obtained by the simulation process was linearly fitted to obtain the slope k of the fitted line and the diffusion coefficient D of paraffin molecules, as shown in Table 2.
As can be seen in Table 2, the fits are all above 0.85, so the obtained diffusion coefficients are reliable and can proceed to the following analysis. With the temperature rise, the diffusion coefficients in paraffin molecules within the amorphous zone of cellulose gradually increased. As the temperature rose from 100 °C to 210 °C, the diffusion coefficient of paraffin molecules went from 0.0062 to 0.0330, about five times larger. On one hand, it is because the increase in temperature increases the activity of paraffin molecules and makes the diffusion of paraffin molecules more effective. Especially after increasing the temperature to 210 °C, the thermal movement of paraffins is more intense and can move better around the cellulose chains, thus affecting the change of the diffusion coefficient. On the other hand, the energy of atoms and molecules increases with temperature. Therefore, the high temperature makes it easier to cross the energy barrier between paraffin molecules and cellulose with a constant energy barrier, which makes the diffusion coefficient of paraffin molecules tend to increase with temperature.

3.3. Lattice Parameters and Density

The cell can fully reflect the distribution of atoms or ions inside the crystal in the three-dimensional space. The cell of the paraffin–cellulose system is a regular cube. The size of the cell can be indicated by three sets of axial lengths, which are the characteristic parameters of the crystal, called the cell parameters. Table 3 illustrates the changes in the cell parameters, volume, and density of the model at different temperatures.
As seen in Table 3, the cell parameter increased gradually from 24.69 to 24.94, with an overall increasing trend in the size of the crystals. This is also the result of the enhanced thermal motion of paraffin molecules with the increase in the temperature and molecular diffusion coefficient. Water is a colorless and odorless transparent liquid at room temperature and pressure. When the temperature is 4 °C, the density of water is 1 g/cm3. As the temperature rises, the density of water reduces gradually. When the external solution of the paraffin–cellulose model is water, the density of the cell is higher than that of water. The greater the cell density, the higher the osmotic potential generated, the greater the osmotic pressure, and the stronger the cell water absorption capacity. The volume of the cell increased from 15,044.329 to 15,517.501, and the density gradually decreased from 1.100 to 1.066, indicating that the water absorption capacity of the cell gradually decreased. Wood absorbs too much water; it is prone to deformation, rot, mildew, and so on. This also proves that high-temperature paraffin impregnation of wood can reduce the moisture absorption of wood and increase the service life of wood.

3.4. Hydrogen Bonding

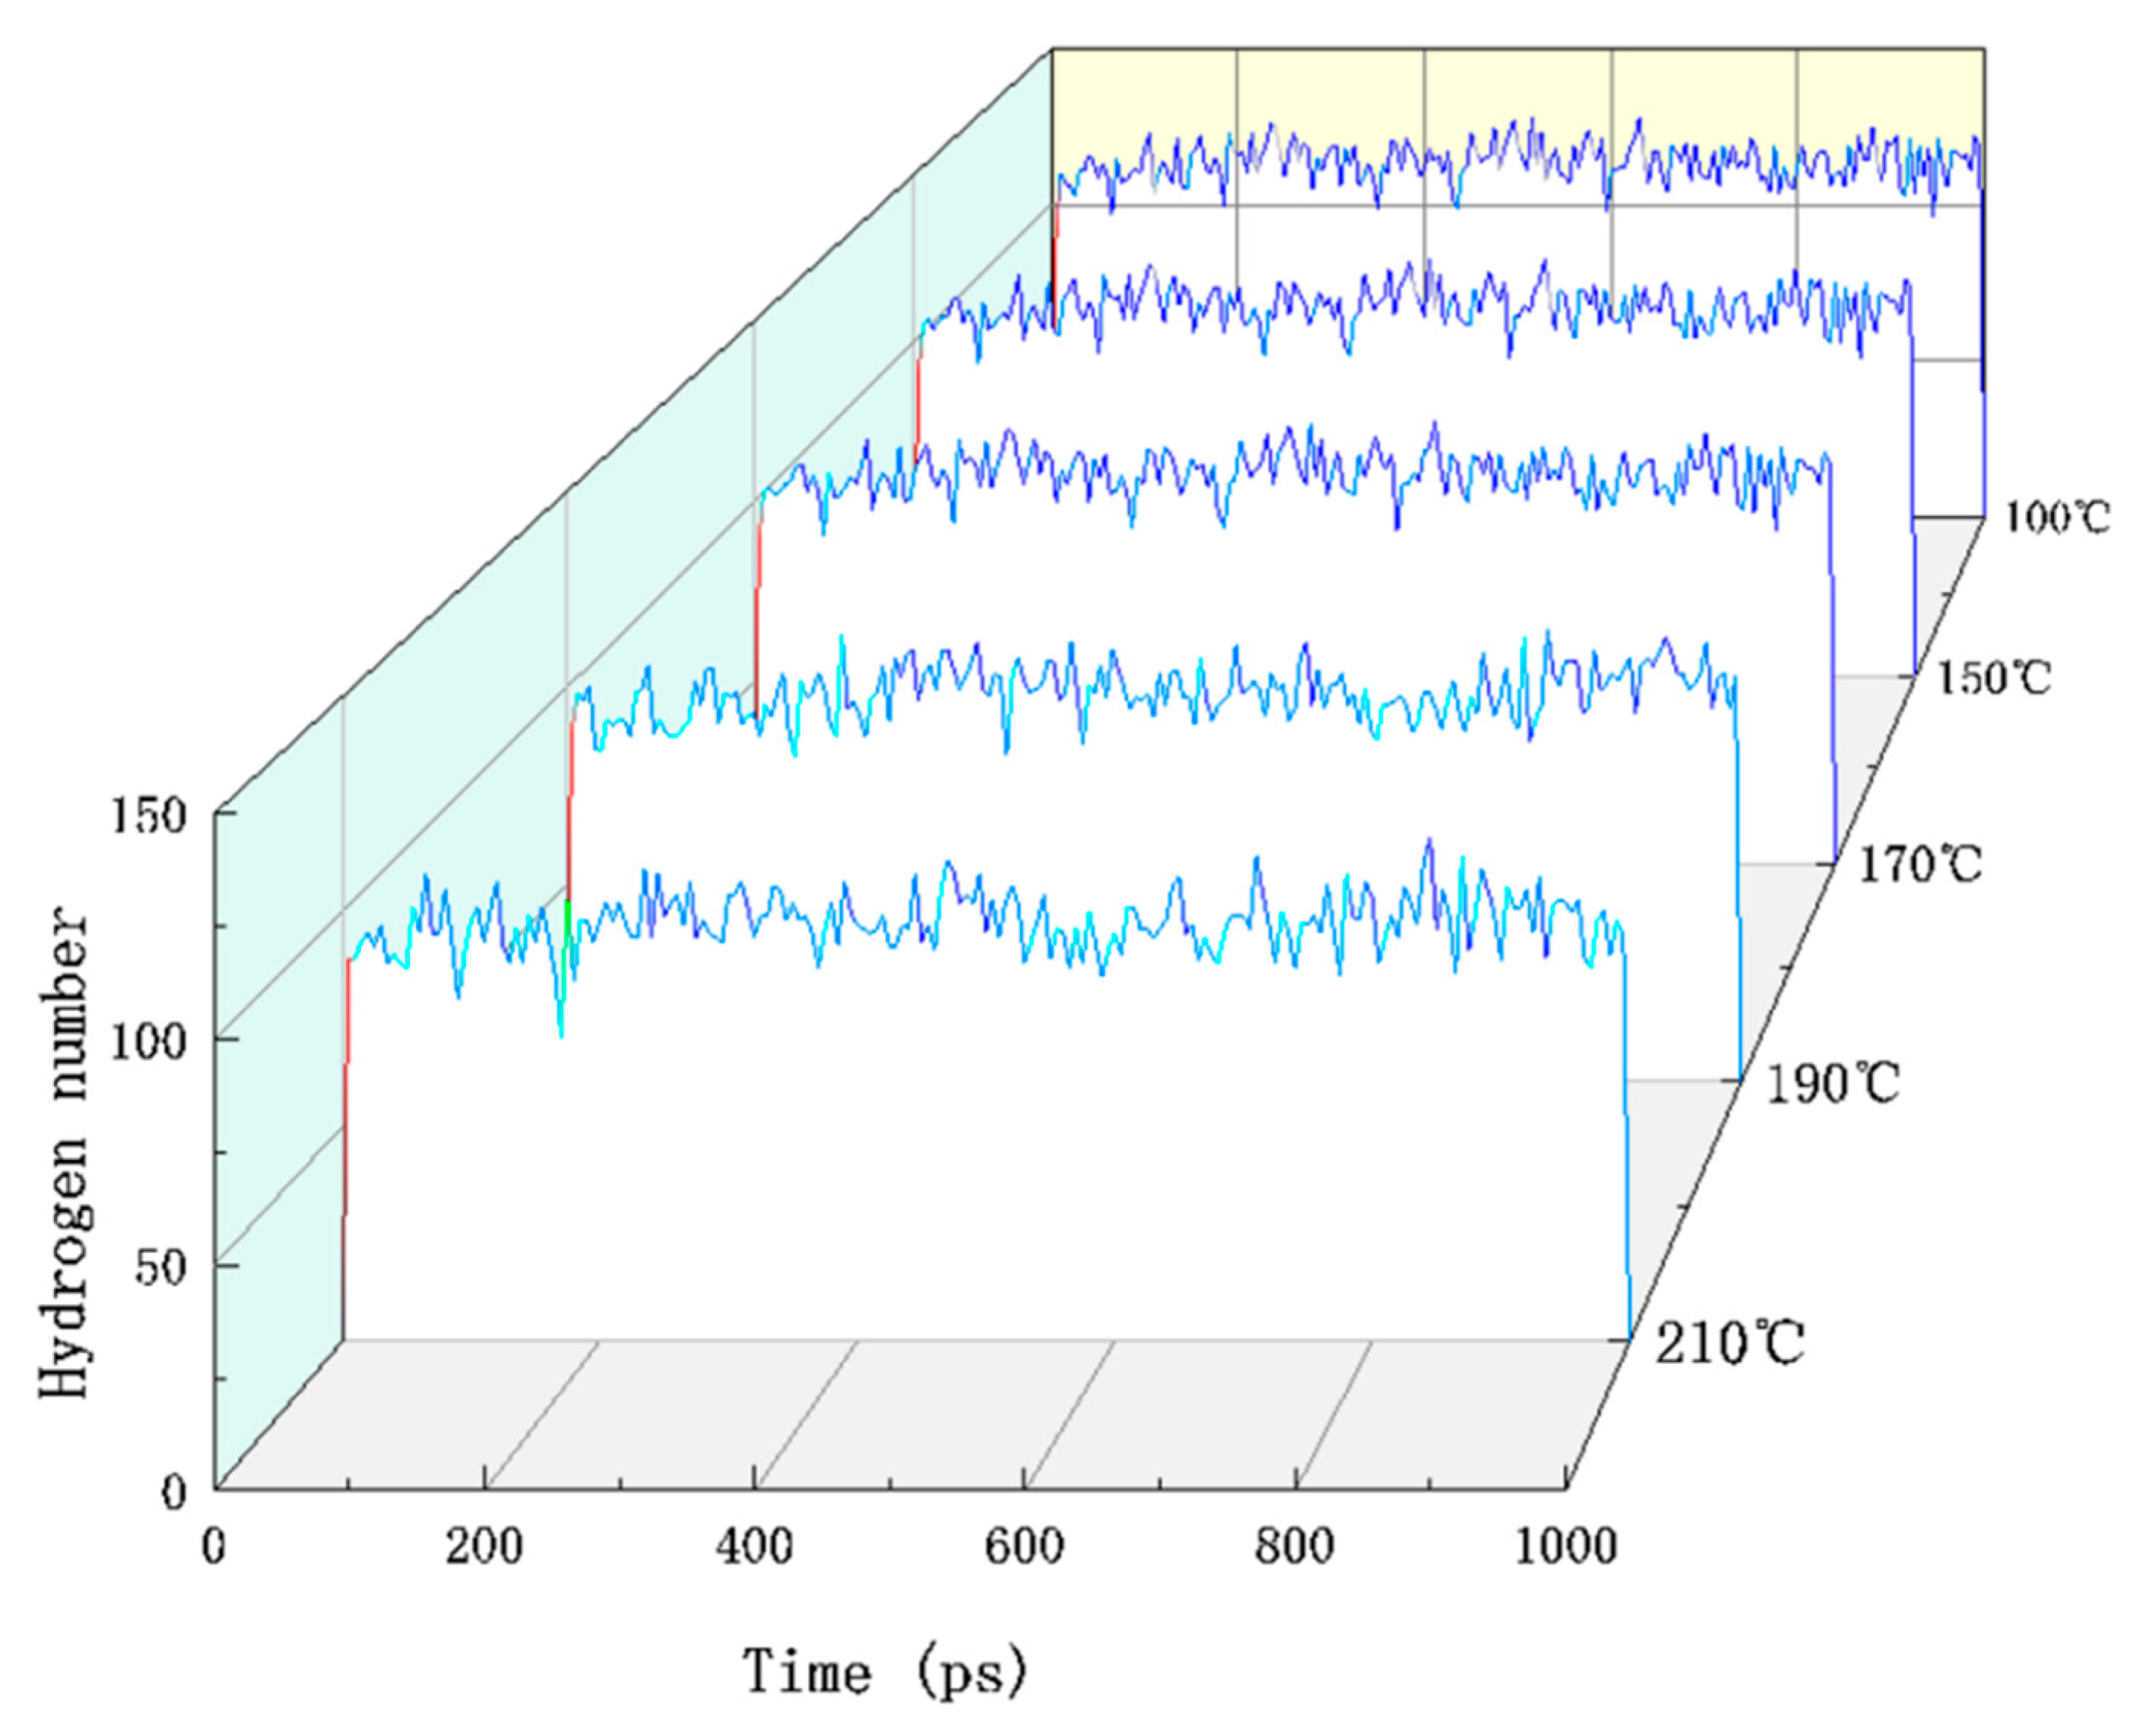
A hydrogen bond is a special intermolecular or intramolecular interaction whose strength lies in the interaction between chemical bonds and atoms [29]. Any hydrogen atom connected with a more electronegative atom in a compound molecule may be connected with another more electronegative atom in the same molecule or another molecule. There are hydrogen and oxygen atoms in cellulose molecules and hydrogen and oxygen atoms in adjacent positions, so they have the conditions for hydrogen bonding. Hydrogen bonding is an interaction that is slightly stronger than intermolecular forces and much weaker than covalent and ionic bonds. Hydrogen bonding in the paraffin–cellulose model plays a vital role in the cellulose molecules’ thermal and mechanical stability. Figure 5 shows the number distribution of hydrogen bonds between the paraffin and cellulose amorphous regions at different temperatures.
As can be seen in Figure 5, the number of hydrogen bonds reduces with increasing temperature. On one hand, the decrease in the number of hydrogen bonds was due to the temperature rise, which intensified the movement of cellulose molecular chains and paraffin molecular chains, leading to the increase in molecular chain spacing and the decrease in the number of hydrogen bonds. On the other hand, because the bond energy of the hydrogen bond is very low, the increase in temperature will cause the hydrogen bond to break.

3.5. Mechanical Properties

A series of molecular dynamics simulations of mechanical parameters can characterize the mechanical properties of wood. The kinetic trajectory files of the model at each temperature are calculated to obtain a matrix of elastic coefficients to calculate the mechanical properties of cellulose using Equation (6).
C i j = λ + 2 μ λ λ 0 0 0 λ λ + 2 μ λ 0 0 0 λ λ λ + 2 μ 0 0 0 0 0 0 μ 0 0 0 0 0 0 μ 0 0 0 0 0 0 μ
The λ and μ in the equation are known as Lamé constants and are often used to calculate mechanical parameters. By using the Lamé constant, we can obtain Young’s modulus (E), shear modulus (G), bulk modulus (K), Poisson’s ratio (γ), and other related values. The formulas are as follows:
E = μ 3 λ + 2 μ λ + μ
G = μ
K = λ + 2 3 μ
γ = λ 2 λ + μ
The mechanical parameters of the paraffin–cellulose model were calculated by molecular dynamics simulations at different temperatures, as shown in Table 4.
Elastic modulus is a measure of the resistance to elastic deformation of a material and an index of the stiffness of a material. Young’s modulus (E), shear modulus (G), Poisson’s ratio (γ), and so on, are different under different stress conditions. Young’s modulus (E) is used to characterize the ability of the material to resist deformation, and it is a response to the strain and stress in the longitudinal law of change. The better the value is, the stronger the ability to resist external forces without deformation, and the material is not easy to deform. Shear modulus (G) represents the resistance of a material to shear strain, and the larger the value, the stronger the rigidity and the poorer the ductility of the material. Poisson’s ratio (γ), also called the transverse coefficient of variability, is the ratio of transverse positive strain to positive axial strain when a material is under unidirectional tension or compression. The larger the value, the stronger the plasticity of the material. K/G indicates the toughness and ductility of the material, which is positively correlated with the toughness of the material.
Judging from the pattern of presentation in Table 4, Young’s modulus (E) and shear modulus (G) of cellulose gradually reduced with the increase in temperature. However, Poisson’s ratio (γ) and the K/G value increased by degrees. This indicates that the increase in temperature weakened the rigidity of the material and enhanced its toughness and malleability. The increase in temperature decreased the deformation resistance of the amorphous region of cellulose. As a result, the range of wood use is expanded, and its utilization is increased.

4. Conclusions

In this study, a paraffin–cellulose mixed model was developed using the molecular simulation software Materials Studio. After structural optimization and dynamic relaxation, the system energy of the model tended to be stable, the dynamic simulation under this system could be carried out, and the results were highly reliable. The dynamics simulation was run based on this condition at a total of five different temperatures: 100 °C, 150 °C, 170 °C, 190 °C, and 210 °C. The energy balance, the molecular diffusion coefficient of paraffin, cell parameters and density, hydrogen bond number and mechanical parameters of the model were analyzed. In summary, the following conclusions could be obtained:
  • The total potential energy was minimized when the system temperature was 100 °C. The difference between the non-bonding and total potential energy was the minimum, and the inter-atomic repulsive force within the molecule was the weakest. This confirmed that the number of hydrogen bonds in the system was the highest, and the structure of the cellulose was the most stable.
  • The paraffin molecular diffusion coefficient peaked at a system temperature of 210 °C. The temperature rise increased the activity of the paraffin molecules, increasing the intensity of movement and consequently leading to the largest cell volume at this temperature, resulting in the lowest density and weakest water absorption.
  • The mechanical parameters were calculated with Lamé’s constant in the temperature range of 100–210 °C. The results show that Young’s modulus (E) and shear modulus (G) were the largest at the system temperature of 100 °C, and the wood had the best rigidity; the Poisson’s ratio (γ) and K/G values were the largest at the system temperature of 210 °C, and the cellulose ductility and plasticity were the best. Therefore, according to the needs of the actual application process, the wood can be heat treated at the appropriate temperature selected during production and processing in order to improve the utilization of wood.

Author Contributions

Conceptualization, Z.Q.; methodology, Z.Q.; software, Z.Q.; validation, Z.Q., W.W., Y.H. and S.C.; formal analysis, Z.Q.; investigation, Y.H.; resources, Z.Q.; data curation, Z.Q.; writing—original draft preparation, Z.Q.; writing—review and editing, Z.Q.; visualization, Z.Q.; supervision, Y.H. and S.C.; project administration, W.W.; funding acquisition, W.W. All authors have read and agreed to the published version of the manuscript.

Funding

This research was supported by the Natural Scientific Foundation of Heilongjiang Province, grant number LC201407.

Data Availability Statement

Data are available upon request from the corresponding author.

Conflicts of Interest

The authors declare no conflict of interest.

References

  1. Pelaez-Samaniego, M.R.; Yadama, V.; Lowell, E.; Espinoza-Herrera, R. A review of wood thermal pretreatments to improve wood composite properties. Wood Sci. Technol. 2013, 47, 1285–1319. [Google Scholar] [CrossRef]
  2. Kamperidou, V.; Barboutis, I.; Vasileiou, V. Influence of thermal treatment on mechanical strength of scots pine (Pinus sylvestris L.) wood. Wood Res. 2014, 59, 373–378. [Google Scholar]
  3. Guo, Y.; Wang, W.; Jiang, X. Molecular Dynamics Study on Mechanical Properties of Cellulose with Water Molecules Diffusion Behavior at Different Oxygen Concentrations. Forests 2023, 14, 371. [Google Scholar] [CrossRef]
  4. Esteves, B.; Ferreira, H.; Viana, H.; Ferreira, J.; Domingos, I.; Cruz-Lopes, L.; Nunes, L. Termite Resistance, Chemical and Mechanical Characterization of Paulownia tomentosa Wood before and after Heat Treatment. Forests 2021, 12, 1114. [Google Scholar] [CrossRef]
  5. Durmaz, E.; Ucuncu, T.; Karamanoglu, M.; Kaymakci, A. Effects of heat treatment on some characteristics of scots pine (Pinus sylvestris L.) wood. BioResources 2019, 14, 9531–9543. [Google Scholar] [CrossRef]
  6. Fang, C.H.; Cloutier, A.; Blanchet, P.; Koubaa, A. Densification of wood veneers combined with oil-heat treatment. Part I: Dimensional stability. BioResources 2011, 6, 373–385. [Google Scholar] [CrossRef]
  7. Wang, J.Y.; Cooper, P.A. Effect of oil type, temperature and time on moisture properties of hot oil-treated wood. Holz Als Roh-Und Werkst. 2005, 63, 417–422. [Google Scholar] [CrossRef]
  8. Amthor, J. Paraffin dispersions for waterproofing of particle board. Holz Als Roh-Und Werkst. 1972, 30, 422–429. [Google Scholar] [CrossRef]
  9. Esteves, B.; Nunes, L.; Domingos, I.; Pereira, H. Improvement of termite resistance, dimensional stability and mechanical properties of pine wood by paraffin impregnation. Eur. J. Wood Wood Prod. 2014, 72, 609–615. [Google Scholar] [CrossRef]
  10. Reinprecht, L.; Repák, M. The impact of paraffin-thermal modification of beech wood on its biological, physical and mechanical properties. Forests 2019, 10, 1102. [Google Scholar] [CrossRef]
  11. Humar, M.; Kržišnik, D.; Lesar, B.; Thaler, N.; Ugovšek, A.; Zupanic, K.; Žlahtic, M. Thermal modification of wax-impregnated wood to enhance its physical, mechanical, and biological properties. Holzforschung 2017, 71, 57–64. [Google Scholar] [CrossRef]
  12. Karplus, M.; Petsko, G.A. Molecular dynamics simulations in biology. Nature 1990, 347, 631–639. [Google Scholar] [CrossRef]
  13. González, M.A. Force fields and molecular dynamics simulations. École Thématique Société Française Neutron 2011, 12, 169–200. [Google Scholar] [CrossRef]
  14. Lee, S.H.; Rossky, P.J. A comparison of the structure and dynamics of liquid water at hydrophobic and hydrophilic surfaces—A molecular dynamics simulation study. J. Chem. Phys. 1994, 100, 3334–3345. [Google Scholar] [CrossRef]
  15. Meier, R.J.; Maple, J.R.; Hwang, M.J.; Hagler, A.T. Molecular Modeling Urea- and Melamine-Formaldehyde Resins. 1. A Force Field for Urea and Melamine. J. Phys. Chem. 1995, 99, 5445–5456. [Google Scholar] [CrossRef]
  16. Hou, T.; Zhang, W.; Xu, X. Binding Affinities for a Series of Selective Inhibitors of Gelatinase-A Using Molecular Dynamics with a Linear Interaction Energy Approach. J. Phys. Chem. B 2001, 105, 5304–5315. [Google Scholar] [CrossRef]
  17. Theodorou, D.N.; Suter, U.W. Detailed molecular structure of a vinyl polymer glass. Am. Chem. Soc. 1984, 187, 1467–1478. [Google Scholar] [CrossRef]
  18. Wang, X.; Tang, C.; Wang, Q.; Li, X.; Hao, J. Selection of Optimal Polymerization Degree and Force Field in the Molecular Dynamics Simulation of Insulating Paper Cellulose. Energies 2017, 10, 1377. [Google Scholar] [CrossRef]
  19. Onyon, P.F. Polymer Handbook. Nature 1972, 238, 56. [Google Scholar] [CrossRef]
  20. Wang, W.; Wang, Y.; Li, X. Molecular dynamics study on mechanical properties of cellulose with air/nitrogen diffusion behavior. BioResources 2018, 13, 7900–7910. [Google Scholar] [CrossRef]
  21. Maple, J.R.; Hwang, M.J.; Stockfisch, T.P.; Dinur, U.; Waldman, M.; Ewig, C.S.; Hagler, A.T. Derivation of class II force fields. I. Methodology and quantum force field for the alkyl functional group and alkane molecules. J. Comput. Chem. 1994, 15, 162–182. [Google Scholar] [CrossRef]
  22. Andersen, H.C. The role of long ranged forces in determining the structure and properties of liquid water. J. Chem. Phys. 1983, 79, 4576–4584. [Google Scholar] [CrossRef]
  23. Berendsen, H.J.; Postma, J.V.; Van Gunsteren, W.F.; DiNola, A.; Haak, J.R. Molecular dynamics with coupling to an external bath. J. Chem. Phys. 1984, 81, 3684–3690. [Google Scholar] [CrossRef]
  24. Ewald, P. Evaluation of optical and electrostatic lattice potentials. Ann. Der Phys. 1921, 64, 253–287. [Google Scholar] [CrossRef]
  25. Ouyang, F.; Wang, W. Effect of Thermo-Hydro-Mechanical Treatment on Mechanical Properties of Wood Cellulose: A Molecular Dynamics Simulation. Forests 2022, 13, 903. [Google Scholar] [CrossRef]
  26. Michael, P.; Tildesley, D.J. Computer Simulation of Liquids; Oxford University Press: Oxford, UK, 2017. [Google Scholar] [CrossRef]
  27. Maple, J.R.; Hwang, M.J.; Stockfisch, T.P.; Hagler, A.T. Derivation of class II force fields. III. Characterization of a quantum force field for alkanes. Isr. J. Chem. 1994, 34, 195–231. [Google Scholar] [CrossRef]
  28. Wang, W.; Cao, Y.; Sun, L.; Wu, M. Effect of Temperature on Formaldehyde Diffusion in Cellulose Amorphous Region: A Simulation Study. BioResources 2021, 16, 3200–3213. [Google Scholar] [CrossRef]
  29. Jiang, X.; Wang, W.; Guo, Y.; Dai, M. Effect of Pressurized Hydrothermal Treatment on the Properties of Cellulose Amorphous Region Based on Molecular Dynamics Simulation. Forests 2023, 14, 314. [Google Scholar] [CrossRef]
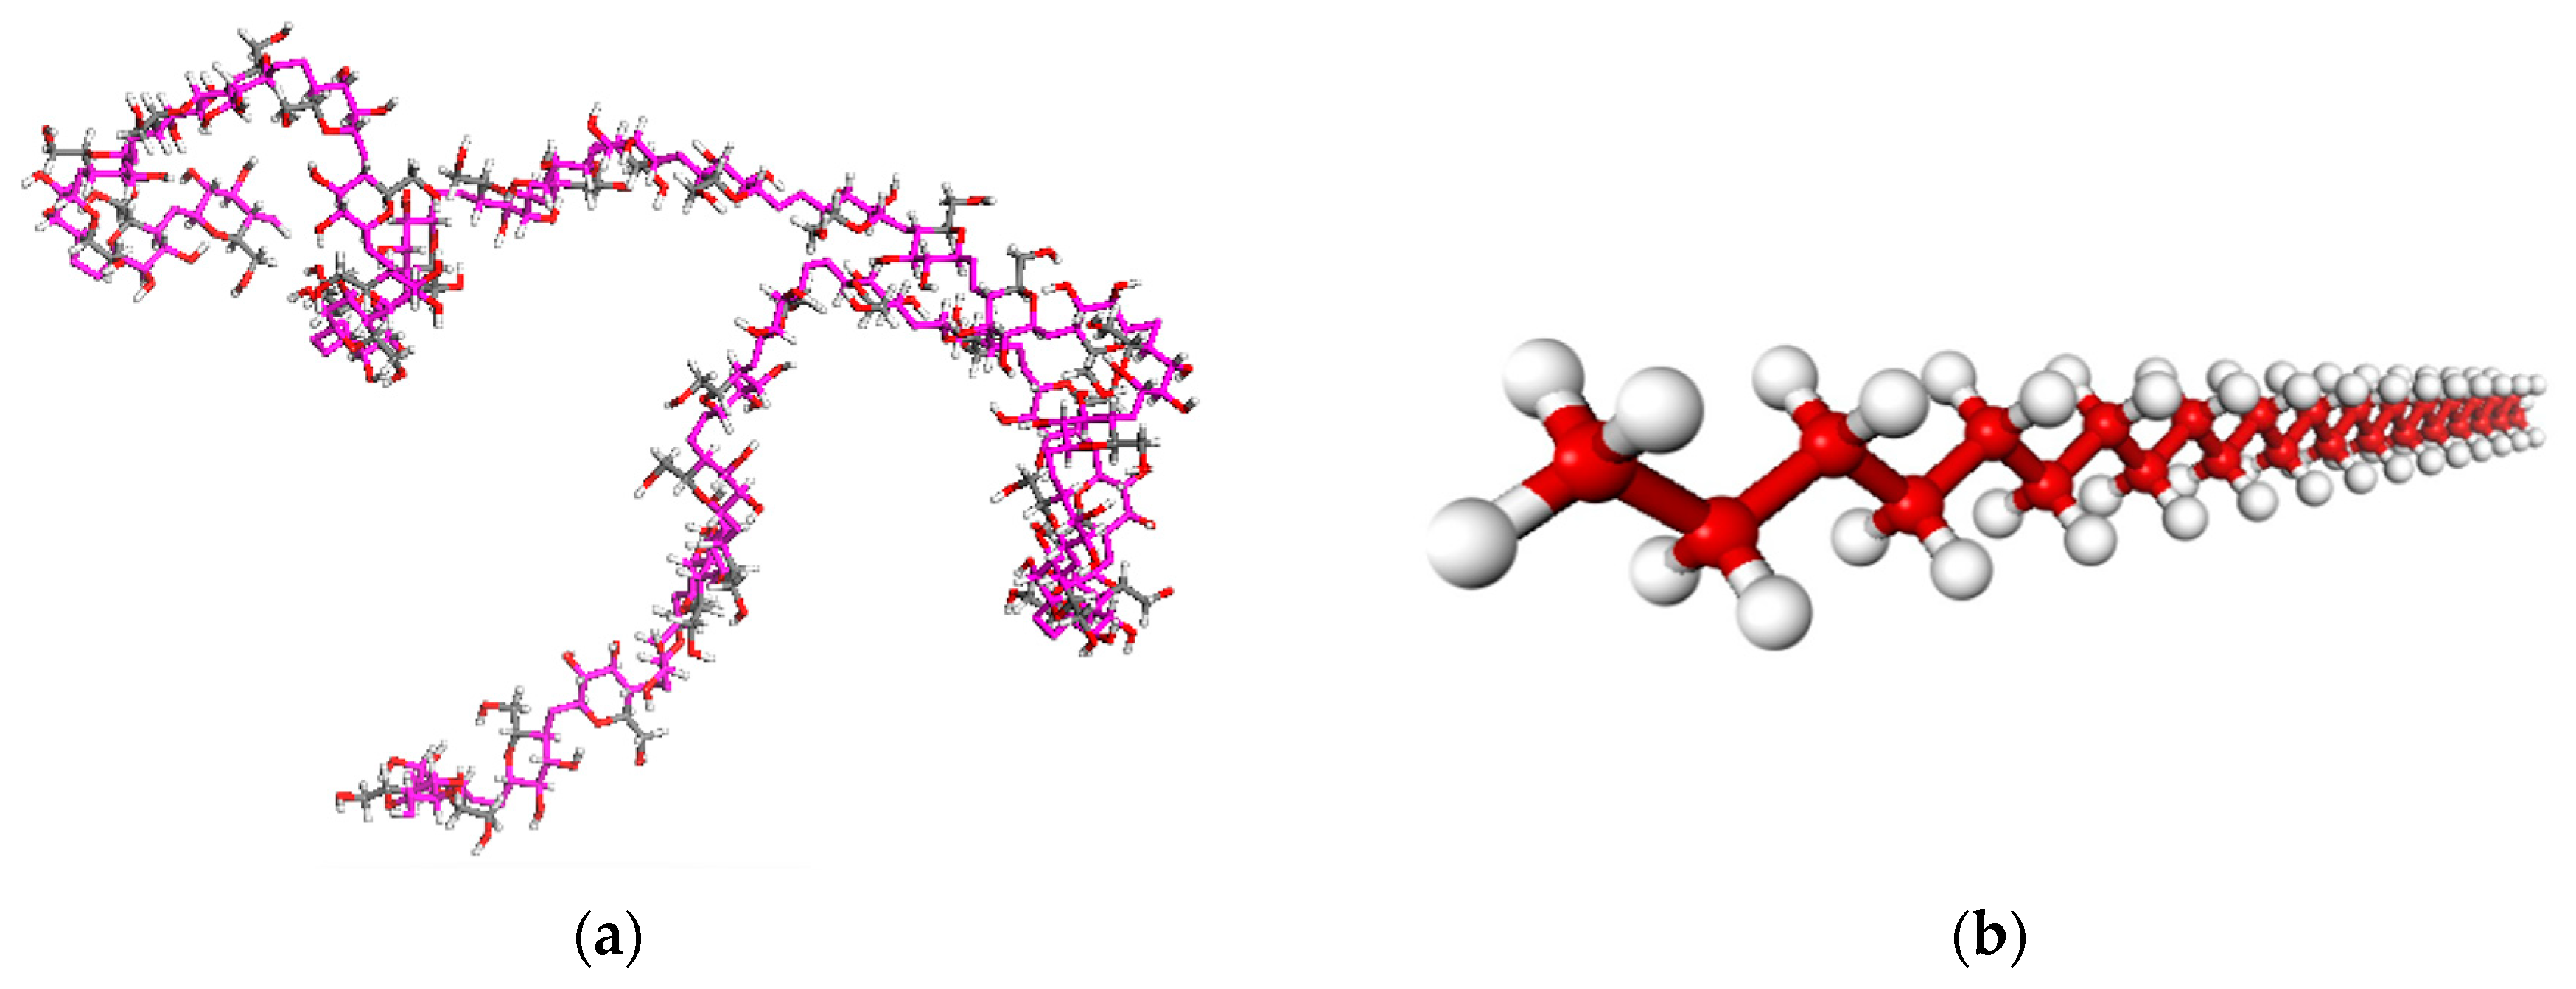
Figure 1. Molecular model: (a) Model of the cellulose amorphous region; (b) Paraffin molecular model.
Forests 14 01068 g001
Figure 2. Model of the paraffin–cellulose amorphous region.
Forests 14 01068 g002
Figure 3. Energy and temperature changes of the model: (a) Energy–Time; (b) Temperature–Time.
Forests 14 01068 g003
Figure 4. Mean square displacement curves of paraffin molecules at different temperatures.
Forests 14 01068 g004
Figure 5. The number of hydrogen bonds in paraffin–cellulose models at different temperatures.
Forests 14 01068 g005
Table 1. Total potential energy, bond energy, and non-bond energy at different temperatures.
Temperature (°C)100150170190210
ETotal2769.2773280.9213426.1003739.6763938.125
Ebond1788.7142268.0722393.8782701.8072871.446
Enonbond980.5631012.8491032.2221037.8691066.679
Table 2. Diffusion coefficients of the paraffin–cellulose model under different temperatures.
Temperature (°C)100150170190210
k0.037240140.052946760.054576960.065856720.19829112
D (A2/ps)0.006206690.008824460.009096160.010976120.03304852
R20.993296210.985411970.874901450.863964990.97642928
Table 3. Cell parameters, volume, and density of paraffin–cellulose model under different temperatures.
Temperature
(°C)
Cell Parameters (Å)Volume
(A3)
Density
(g/cm3)
The LengthThe WidthThe Height
10024.6924.6924.6915,044.3291.100
15024.7924.7924.7915,241.5041.086
17024.8224.8224.8215,296.1721.082
19024.9224.9224.9215,470.9511.070
21024.9424.9424.9415,517.5011.066
Table 4. Variation of mechanical parameters at different temperatures.
Temperature
(°C)
λμEGγK/G
10017.15252.36416.80592.36410.43947.9220
15018.04672.32466.70852.32460.44298.430
17019.84031.45004.25121.45000.465914.3469
19020.57151.39734.10301.39730.468115.3889
21020.24251.33083.91031.33080.469115.8774
Disclaimer/Publisher’s Note: The statements, opinions and data contained in all publications are solely those of the individual author(s) and contributor(s) and not of MDPI and/or the editor(s). MDPI and/or the editor(s) disclaim responsibility for any injury to people or property resulting from any ideas, methods, instructions or products referred to in the content.