Article

Effect of Geometry Precision and Load Distribution on Branch Mechanical Response

1
Faculty of Forestry and Wood Technology, Mendel University in Brno, Zemědělská 3, 61300 Brno, Czech Republic
2
Université de Lorraine, AgroParisTech, INRAE, UMR Silva, 5400 Nancy, France
*
Author to whom correspondence should be addressed.
Forests 2023, 14(5), 930; https://doi.org/10.3390/f14050930
Submission received: 2 April 2023 / Revised: 27 April 2023 / Accepted: 28 April 2023 / Published: 30 April 2023
(This article belongs to the Special Issue Tree Stability and Tree Risk Analysis)

Abstract

:
Tree risk assessment requires mechanical response studies, but simplification of the shape, material, or boundary conditions is necessary when dealing with such complex structures. To observe overall tree response, sub-structuring to several levels of detail can be used, enabled by recent developments in numerical methods and three-dimensional laser scanning (3D scan). This study aimed to determine an appropriate level of geometry and loading simplification allowed for high-order branches at the crown border, which is useful for the mechanical analysis of structured tree models. Four higher-order branches were pruned and experimentally tested by single-point loading. Beam and solid finite-element models (FEMs) were created based on measured geometric parameters and detailed 3D scans, respectively. The FEMs were used to analyze seven loading scenarios with force applied at (a) the center of gravity, (b) the top of side branches, (c) key discrete points, and (d) uniformly to the whole volume (to each finite element). Force was distributed by ratios weighted according to the mass, area, and diameter of side branches; or according to the mass of each finite element. The results showed no significant difference between the beam model and 3D scan-based model. The scenarios with finite elements’ mass-based force distribution deviated significantly from those of the other scenarios. The most simplified single-point loading caused a deviation in the deflection curve. The deviation of single-point loading in the case of the bending moment was related to force distribution ratios given by the branches architecture. Therefore, such loading simplification is not considered always appropriate. Consistency between the bending moment and branch deflection provided a representative mechanical response, recommended for further modeling of trees by sub-structuring.

1. Introduction

Scientific papers and technical reports on the tree failure process have increased in recent years. Especially in urban areas, risk assessment of individual trees is of high importance [1]. Trees are complex structures in terms of their shape, architecture [2,3], and material properties [4]. In addition, they live in a changing environment, where stochastic wind load is an important factor [5]. Therefore, some level of simplification is always needed for the analysis of a tree’s mechanical response. In practice, a common approach is to consider load as the result of the wind flow acting on the center of gravity and causing a bending moment along the stem or at the anchorage position [6,7,8]. Regarding material properties, bending strength or stiffness is used [9], which can be derived from wood density [10]. Finally, the stem’s cross-section shape, represented by a circle, ellipse, or precisely derived moment of inertia, is used to calculate stress and, subsequently, safety factor calculations [9,11].
Simplification was part of the range of previous studies that were based on analytical and numerical solutions [12,13,14]. The simplification was applied to the root–soil complex, stem shape, crown properties, and observed response parameters. The development of numerical computations opens a possibility for understanding complex mechanics. For example, Kim et al. [12] and Vojáčková et al. [13] used a similar approach of a cone stem anchored in root–soil composite and added mass to represent the crown to understand the effect of defects on trees’ static response. In the area of dynamics, the effect of material stiffness, density, stem taper, and crown mass distribution on the first natural frequency was observed in a similarly simplified tree model [14]. While previous studies provide valuable insights, crown structure seems to be a significant factor, especially for the analysis of frequency and time-domain response [15]. Three-dimensional (3D) terrestrial laser scanning (TLS) and advanced data processing have several applications in tree structure modeling [16,17,18]. The quantitative structure model (QSM) [19] was successfully used for the generation of the beam model and finite-element analysis of wind damage [20,21], where the simulation predicted stem strain and natural frequency. The model predicted strains with high accuracy (R2 0.4–0.81, depending on wind velocity), but it was highly sensitive to the level of detail in the QSM (number of averaging iterations). Even with the high-precision model of the crown structure, the small branches (cylinders under 20 mm) were removed due to the TLS’s resolution. The other approach used laser scanning as a tool to calculate plant area density (PAD). The PAD was used as a parameter in the simulation of the tree, that is, as a distributed sink in the momentum equations [22]. A numerical grid with attributed equations created a whole tree structure and surroundings, which enabled the simulation to involve the conditions with and without leaves. The results were sensitive to the level of detail in the numerical grid (the coarser grid provided results that were closer to those of the experiment). A similar homogenization approach (substitution by porous volume) was used [23] for the wind tunnel and finite-element model (FEM) simulation of 3D-printed scaled-down fractal trees in combination with the L-system presented by Gobeawan et al. [24]. The porous volumes were defined as ellipsoids with a center at the tips of the branches, and the frontal optical porosity of the 3D-printed model closely resembled real trees. Similarly, in a study by Dellwik et al. [22], the numerical grid with attributed equations was used for simulations, but the bulk drag coefficient and frontal silhouette area density were local input parameters. These previous studies suggested the method of sub-structuring in numerical tree modeling. This requires the substitution of branches and leaves according to their physical attributes (e.g., mass, area, force, or bending moment) at a specific level of the crown structure.
Furthermore, the bending moment is a useful and measurable parameter for static and dynamic analyses [22,25,26]. The emergence of tree structure (crown and stem) creation provides the option to apply, for example, (a) beam-shaped geometry based on directly measured and 3D scan-based parameters [20,27]; (b) solid geometry, which can be generated from a 3D scan by cylinders [28,29]; or (c) solid geometry, precisely extracted by Poisson surface reconstruction [30,31,32]. Solid geometry opens the possibility of implementing wood anisotropy and heterogeneously distributed properties [28]. The precisely extracted scanned shapes used in the details (stem junction) showed more agreement with the static response in the experiment than the cylinder-created geometry [30]. In a modal analysis, the model accuracy varied according to the type of mode shape [32]. In a dynamic analysis of the whole tree, the beam model provided the best prediction of the first natural frequency [27]. In addition, the beam model was the preferable option due to the lower number of elements and time demands for computations.
This study aimed to explore whether a certain level of simplification in geometry and loading is appropriate for further sub-structuring of tree crown modeling. Related to this overall aim there are two specific questions: (1) Can the precise solid geometry of the branch be replaced by simplified finite-element beam structure for analysis of deflection and force-moment reaction? (2) Is a force applied to the center of gravity an appropriate simplification for the modeling of deflection and force-moment reaction induced by wind load? To test the hypotheses, the higher-order branches can be modeled by two different approaches: (1) beam-based geometry, defined by directly measured parameters; and (2) precise solid geometry, based on the 3D-scanned surface. The models provided can be subsequently used for the analysis of static loading scenarios with different force distributions. Analysis of loading scenarios freely followed previous work [26].

2. Materials and Methods
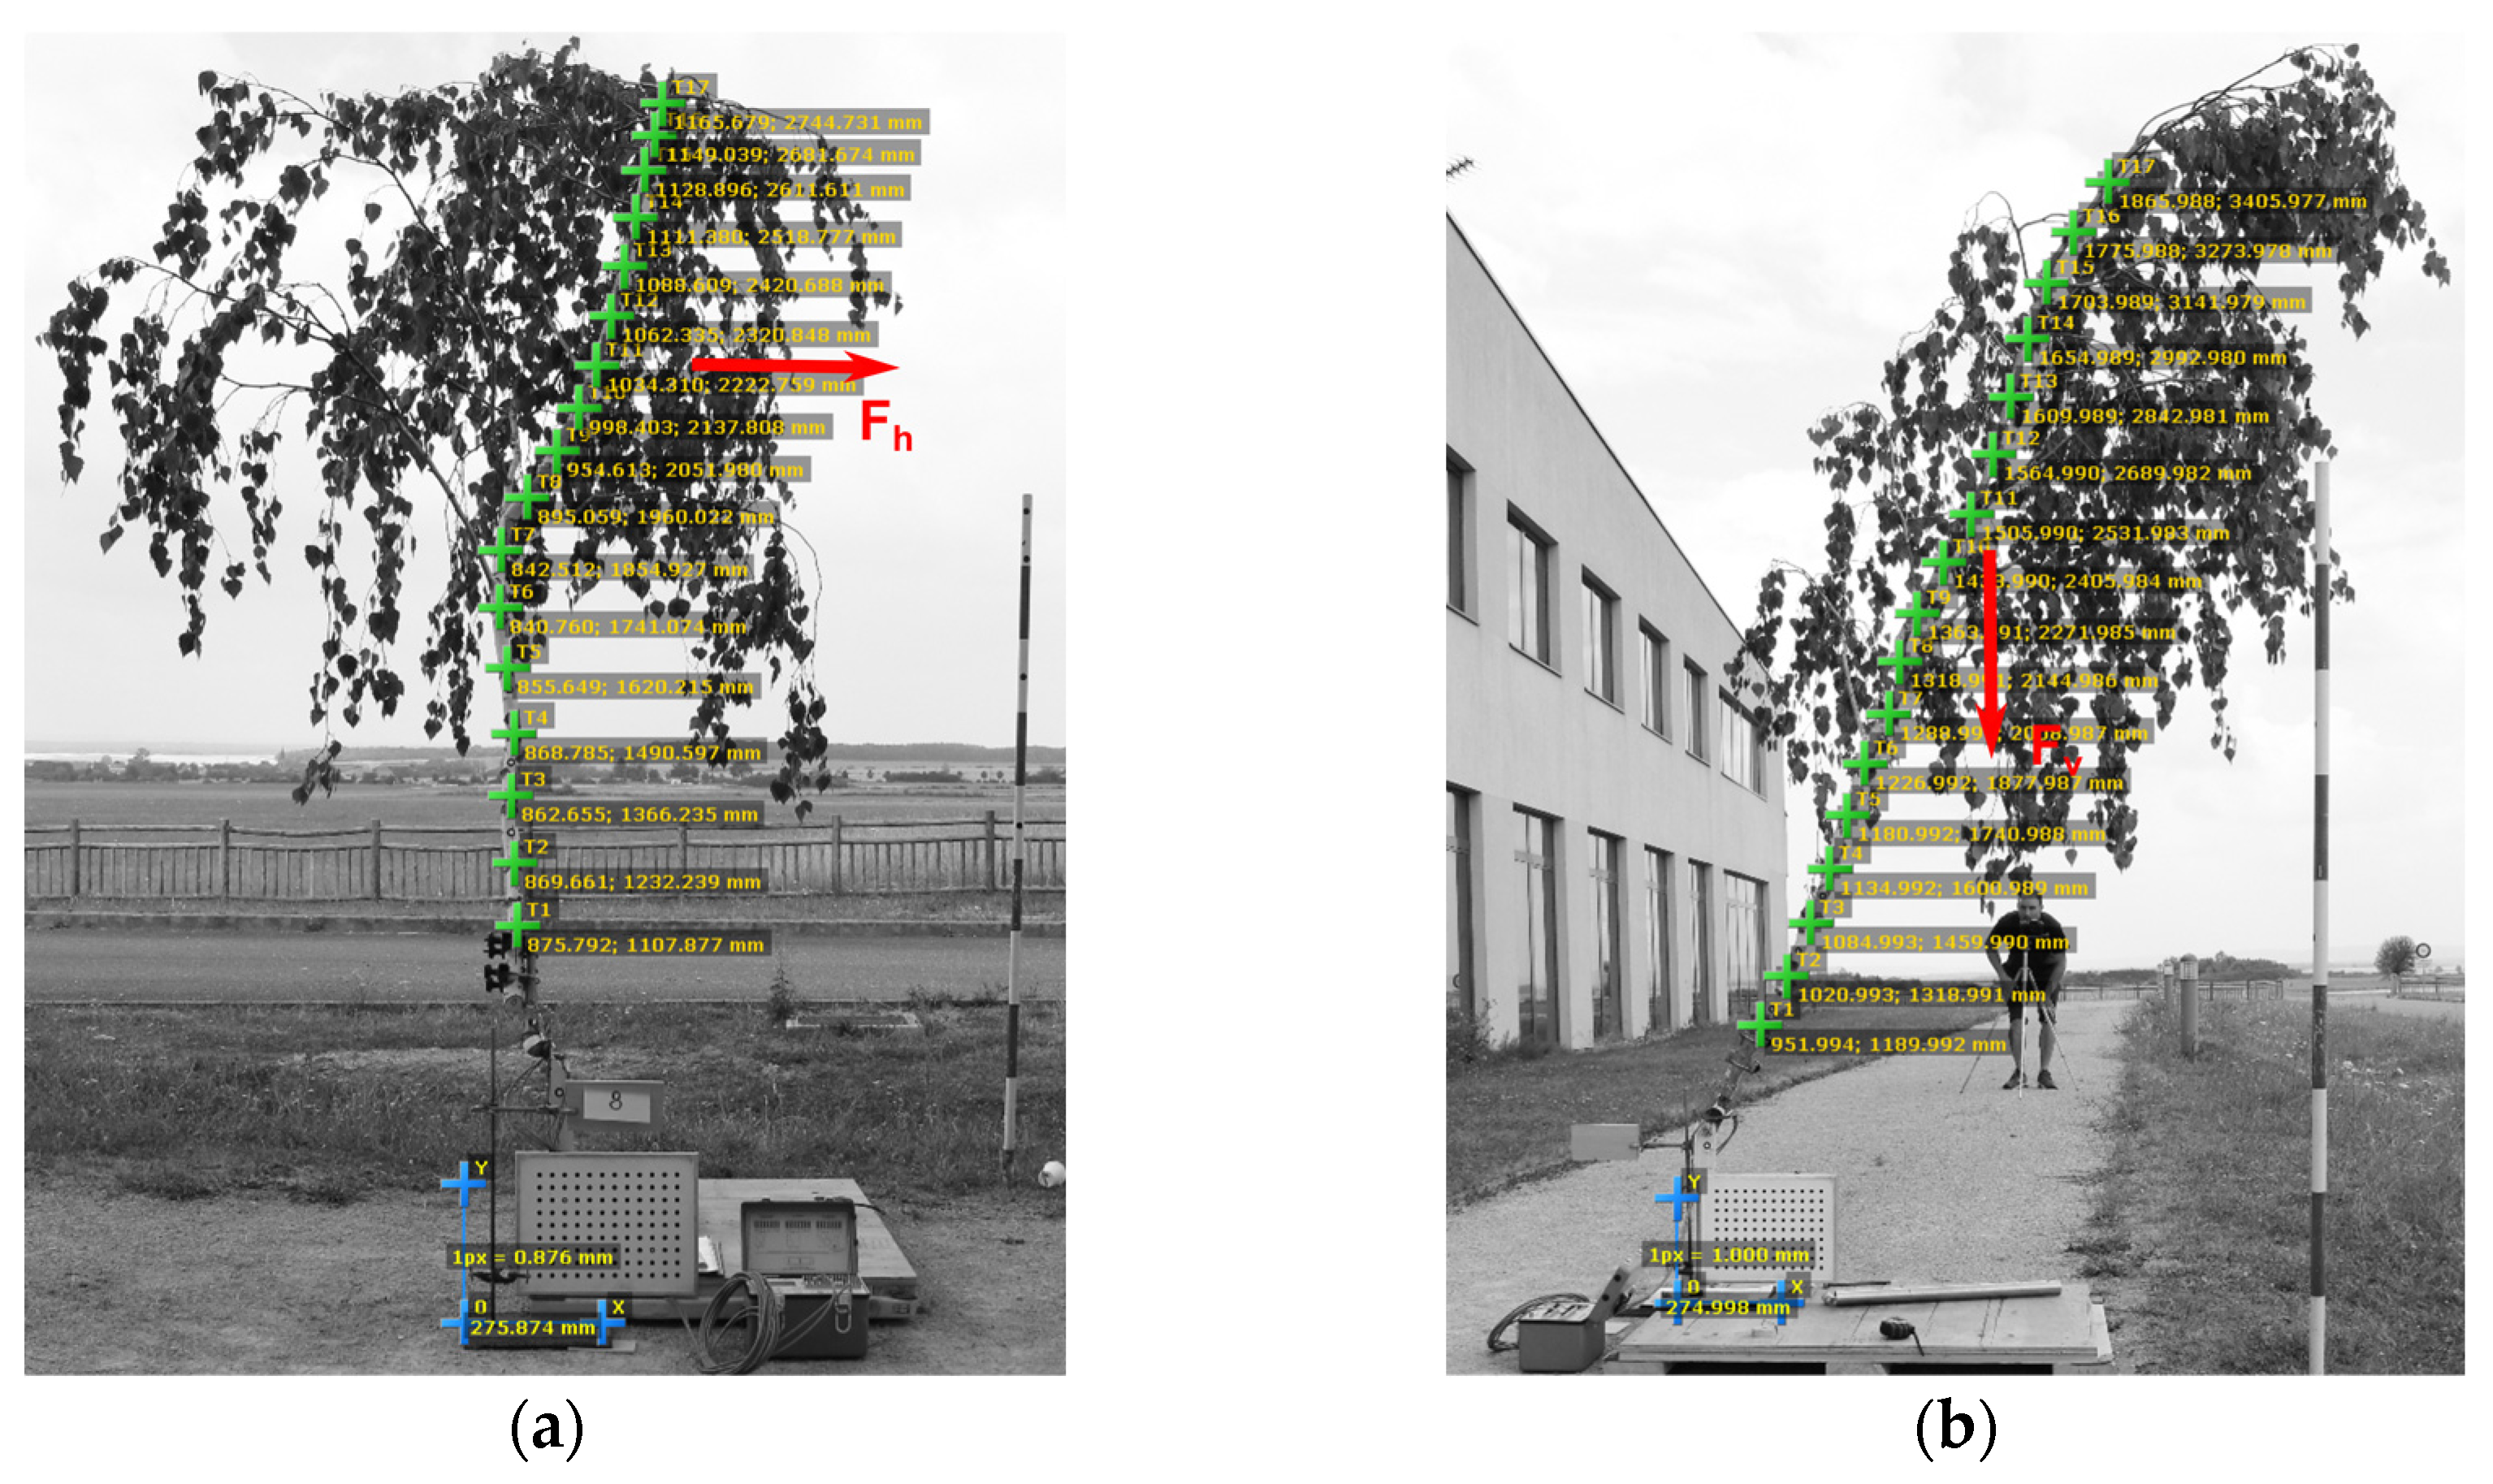
2.1. Experiment

Two tree species with different branch types were selected for the experiment, namely, birch (Betula pendula Roth), with small leaves and fine, overhanging branches; and horse chestnut (Aesculus hippocastanum L.), with large leaves and massive, upright branches. In total, four branches (two birch and two horse chestnut) were pruned from the top part of selected solitary urban trees. Along the main axis of the branches, markers were placed 0.15 m from each other. Near the position of the first marker, the branches were anchored to the holder (steel pipe frame) at the same angle as they had been growing on the tree (Table 1, Figure 1). The branches were vertically (Fv) and horizontally (Fh) loaded by pulling at the center of gravity. The vertical direction represented additional mass load and the horizontal direction represented wind load. The acting force was determined by hanging scales (Kern HDB, precision 5 g), and the magnitude was similar in both directions (Table 1). The unloaded and loaded state of the branches was captured by a Canon EOS700D (precision 1.6 mm, 0.2 fps) camera placed perpendicularly to the pulling direction. The displacement of the main axis at the position of the markers was processed with digital image correlation software (Mercury, Sobriety Ltd., Kuřim, Czech Republic).
Branches were protected from moisture content loss and were weighed immediately after mechanical testing, and subsequently measured to describe geometry and boundary conditions for the FEM. The following parameters were determined for all branches: the vertical and horizontal diameters (dvi, dhi) at the markers’ positions along the main axis, the length of the main axis (la), the center of gravity’s position in the length (lg) (determined by hanging the branch in a balanced position), the overall mass (m), and the angle of attachment (α) (Figure 2c). Consequently, the lateral (side) branches were pruned at the bottom edge of the leafy part (Figure 2a,b). On the retained (uncut) part of the lateral branches, the angle of orientation along the circumference of the main axis (pj), the diameter of the base (dsj), the angle of anchorage to the main axis (αsj), the distance of the base from the marker (lmsj), and the overall length of retained parts (lsj) were measured (Figure 2c). The removed parts of the lateral branches were weighed to obtain their mass (msj) and captured by the camera to measure the frontal area (Asj) by image analysis software (RealTree, Sobriety, Ltd., Kuřim, Czech Republic) (Figure 2b). Images of the branches with shortened lateral branches were captured by the camera to obtain the shape of the main axis in the horizontal and vertical direction. The angles (αmi) at the points of curvature change of the main axis were measured by image analysis software (ImageJ 1.53t, Rasband, W.S., ImageJ, U. S. National Institutes of Health, Bethesda, MD, USA). For the complete list of measured parameters and figures of branches, see Supplementary Materials (File S1-Figures S1–S4 and File S2).
The 30 cm long section samples were made from the bottom part of each branch. The dynamic longitudinal modulus of elasticity (ELd) was assessed using the frequency resonance method (BING® method, Cirad FR) (Table 1). The green wood density (ρ) of samples was obtained by the mass of the green wood divided by section volume.
Finally, all branches were scanned by terrestrial laser scanner (Faro Focus 3D × 130). The scanner was set to high quality, with field of view hor. [0°,90], vert. [−60°,90°]; spatial resolution level ½, that is, 20,480/360°, and quality control level 4×, that is, 122 kpt/s. Point cloud data were cleaned, and the surface mesh was generated in CloudCompare (version 2.11.1, GPL software, 2011) by Poisson surface reconstruction [33].

2.2. Numerical Simulations—FEM Set Up

Two FEMs of branches were built in Mechanical APDL (Ansys® Academic Research Mechanical, Release 2021 R2, ANSYS, Inc., Canonsburg, PA, USA), based on beam finite elements (Section 2.2.1) and solid finite elements (Section 2.2.2). Each model was parameterized, which allowed adaptation to the different branches. The FEMs were set up for the static structural analysis of linear-elastic material behavior at different force distributions and were used for the analysis of the four experimentally tested branches (Table 1). The linear-elastic material behavior was assumed to be appropriate for the purpose of this study, since most methods for stability evaluation in practice are based on the non-destructive approach within elastic range of material response [7,8].

2.2.1. Beam Model

The geometry of the beam model was created by lines connecting key points (KPs). To build the main axis, the cylindrical local coordinate system (LCSYS) for each marker position (0.15 m apart) and the positions of the points of curvature change of the main axis were created. The cylindrical LCSYS defined the X-axis oriented in the radial direction (branch diameter) and the Y-axis in the tangential direction. The longitudinal Z-axis was oriented in the main axis of the branch, defined by the angle (αmi) (see Supplementary Materials S2). The Z-axis determined the direction of the LCSYS’s offset to its next position. At the origin of each LCSYS, a KP was created, and all KPs were connected by lines. Similarly, LCSYSs with Z-axis directions determined by the position along the circumference of the main axis (pj) and by the angle of anchorage (αsj) were created at the locations of the side branches’ bases. Side branches were defined by the lines connecting KPs in the distance corresponding to side branch length (lsj). Lines were meshed by a beam element (BEAM 189, Help System, Mechanical APDL, Element reference, ANSYS, Inc.), based on Timoshenko beam theory with included shear-deformation effect. The size of the elements was set to 1 mm. Cross-sections of elements were defined by the user option (ASEC command) for the main axis and the circle of side branches (defined by diameter dsj). The input values for the ASEC command (moments of inertia and section areas) were calculated for the elliptical shape of the cross-section of measured diameters (dvi, dhi) at the position of each KP. Bark thickness (3 mm for the main axis and 1 mm for side branches) was subtracted from the diameters. Side branches were bound to the main axis by constraint equations (CE command), with full transfer of all degrees of freedom (Figure 3a).
The material model was defined by the longitudinal modulus of elasticity (ELb), the shear modulus of elasticity (GLR), and the Poisson ratio (µLR) (Table 2). Static ELb was derived from measured dynamic ELd by reducing it to 90%, which is assumed to be the standard value [34,35], although the relationship can vary, especially in living trees [36,37]. The procedure for setting GLR and µLR based on ELb is described in Section 2.2.2. Density was determined based on measured values (Table 1). The complete list of elastic constants can be found in Table 2.
To get values corresponding to the experiment and the solid scan-based model, the Cartesian coordinate system for boundary conditions and results extraction was set to the position of anchorage KP (Section 2.2.2). All nodes of finite elements were rotated into this coordinate system by the NROTAT command. Boundary conditions were defined in two load steps. In the first step, the mass of each pruned part (msj) was added to the top node of the side branch. The branch was fully anchored at the position of the bottom marker. The state after the first load step represented the branch position before additional loading by pulling, where branches are naturally loaded by self-weight. For the second load step, the small initial displacements (ux, uy, uz) and rotations (rotx, roty, rotz) were defined at the position of anchorage to account for the slight movement of the holder during loading (see Supplementary Materials S2). To validate the model, the branches were loaded by single-point loading in the vertical and horizontal direction at the center of gravity according to the experiment. The validated model was used for seven loading scenarios with different force distributions in the horizontal direction (Table 3). The overall magnitude (total force) was equal to that in the experiment and in scenario 2 (single-point loading). In scenarios 1, 3, and 4, a proportional part of the force was applied to the top nodes (endpoints) of each side branch. The total force was distributed by weighting ratios obtained from (a) area of the pruned part (EP area—scenario 1); (b) side branch diameter (EP diameter—scenario 3); and (c) mass of the pruned part (EP mass—scenario 4) (Figure 4).
In scenario 5 (KP area) the force was distributed to all KPs of the main axis and side branches. The total frontal area consisted of frontal areas of structural branches (main axis + side branches), and the frontal area of the pruned parts was the parameter directly interacting with wind flow [22,28,38]. For weighting, the partial frontal area of each branch section (area of branch structure) and the partial frontal area of each pruned part (area of leaves and branches, Figure 2b) were used.
Two other parameters (mass and diameter, used in scenarios 3 and 4) were chosen to apply distribution based on the frontal area of the pruned parts. Diameters can be simply and precisely measured or may be obtained by scanned geometry [39]. As there is a functional relationship between stem or branch diameter and leaf area or mass [40,41,42,43], the diameter could replace the frontal area as the weighting factor for force distribution. The correlations between measured mass (msj), area (Asj), and diameter (dsj) were verified by Spearman correlation coefficients (0.68–0.89) [26]. Scenarios 6 (ACEL) and 7 (ACEL and EP diameter) worked with the ACEL command, which allowed the entire object to be loaded in a distributed way by the elements‘ mass and global acceleration. This scenario provided easy distribution of loading, especially in solid scan-based models; acceleration was calculated based on overall mass and total horizontal force. Scenario 6 worked with the ACEL command only, and scenario 7 added loading on endpoints (representing pruned parts) to ACEL. Scenario 7 used the side branch diameters as a distribution factor.
In the post-processing stage, nodal solutions to displacement (nodes along the main axis) were used for the evaluation of branch deflection. The reaction, described by bending moment components at the anchorage point, was used for the evaluation of overall branch response. See the complete code of simulation in Ansys Parametric Design Language in the Supplementary Materials (S3).

2.2.2. Scanned Model (Solid Model)

Branch geometry defined by surface mesh (described in Section 2.1) was imported into SpaceClaim (Ansys® Academic Research Mechanical, Release 2021 R2, ANSYS, Inc.). The geometry had been adjusted to fulfill the conditions of FEM mesh. The sequence of operations: (a) repairing (deleting/creating) of self-intersecting, over-connected, sharp, and protruding facets by a combination of manual and automatic detection, followed by (b) regularizing (branch nos. 1 and 2) or (c) using the shrink-wrap function (branch nos. 3 and 4) to make a regular, smooth surface with a maximum facet edge size of 3 mm. The final operation was the conversion of the surface to solid and the import of the model into mechanical APDL through the Workbench package. In the mechanical APDL, the workflow was defined by the following steps: (a) volume meshing by solid elements; (b) assigning of coordinate systems and material numbers; (c) setting of boundary conditions; (d) solution; and (e) post-processing. At first, all branches were meshed by free mesh with a solid tetrahedral 10-node element, with an initial size of 5 mm (SOLID187, Help System, Mechanical APDL, Element reference, ANSYS, Inc.). The naturally complex shape of the branches required segmentation and the creation of cylindrical LCSYS for each segment, where the Z-axis followed the longitudinal direction of the wood. This segmentation and assignment of LCSYSs ensured the realistic orientation of material axes. The size of the segment was set at approx. 30 mm (5× element size) to accommodate shape variability, especially at branch junctions (Figure 5). For each segment, the LCSYS was defined at its center of gravity, where the Z-axis was aimed to the center of gravity of the consecutive segment.
Constants of orthotropic linear-elastic material were derived from measured ELd (Section 2.1). Scanned geometry included bark thickness, which caused an increase in flexural stiffness. To compensate for this effect, the elastic modulus was proportionally reduced. Bark thickness near the branch base was measured (1.5 mm on each side), therefore diameter needed to be reduced by 3 mm. According to the equation for cantilever beam deflection [44], to achieve an equivalent increase in the displacement, a 70% reduction in the elastic modulus was needed. This approach is consistent with the study provided by Larjavaara and Muller-Landau [45], who stated that the ratio for the reduction of stiffness due to material properties (density) is 1.26 in comparison to diameter. In addition, to consider the lower properties of the static modulus compared with the dynamic one, the 10% reduction was added and EL was reduced 60% in total. The remaining elastic constants were derived from ELs through elastic ratios. Elastic ratios and Poisson’s ratios (Table 2) were taken from the Wood Handbook 2021 [46] for wood with 12% moisture content. The effect of moisture content on elastic ratios was neglected, since the values of all elastic ratios are not available for green wood of similar species and the effect of moisture content on elastic ratios is disputable [38,47]. For birch (Betula pendula Roth), the properties of yellow birch (Betula alleghaniensis Britton) were used, and for horse chestnut, (Aesculus hippocastanum L.) the properties of basswood (Tilia americana L.) were used. The selection of this substitute species assumed the corresponding properties (density and modulus of elasticity) and followed a similar methodology as used in [13]. For density, the measured values were used (Table 1).
The Cartesian LCSYS was created to place the branch in the same position as during measuring. The system was defined by the position of attachment and branch angle. All nodes were rotated into the coordinate systems by the NROTAT command, which allowed the orientation of boundary conditions and result extraction (or RSYS) equal to those of the experiment (Figure 3b).
Boundary conditions were applied in two load steps, similar to those for the beam analysis (the first load step involved full anchorage and mass of the pruned part, and the second step included the movement at attachment points corresponding to the measured and added load by horizontal and vertical pulling). Forces applied to the ends of side branches were equally distributed to the sets of nodes (in five rows of elements). The mass of the pruned part in the first load step and the distribution of force in scenarios 1, 3, 4, 5, and 7 in the second load step were defined in this manner. Nodes on the branch surface at the position of the bottom marker (zone length of 35 mm) were selected for the anchorage definition. As the solid elements did not allow the application of rotation to nodes, the master node (with interaction by contact elements TARGE170 and CONTA175) was used for full transfer of all boundary conditions. The applied conditions corresponded to that of the beam model and the experiment.
The validation process and loading scenarios were analogous to the beam analysis (Section 2.2.1). Table 3 presents the loading scenarios. A different approach was used only for scenarios 5 and 7. For scenario 5 (EP diametersc), the approach for the distribution of forces used only the values available from the scans (the side branch diameters were extracted from the FEM). Some side branches were completely pruned near the main axis and not detected by the scan; therefore, the total force was distributed to the detected branches only. The differences between the measured and the extracted diameters caused by the reconstruction error are shown in Figure 6. A balance between the creation of a good quality surface mesh and maintaining the original shape [30,31] was preferred. Scenario 7 (ACEL and EP diametersc) combined scenario 5 with mass-acceleration loading (scenario 6).
To get solutions that corresponded to the experiment (markers), the mean values of the positions and displacements in the RSYS were calculated for the surface nodes, and reactions in the bending moment components from the master node were used. See the complete code of simulation in Ansys Parametric Design Language in the Supplementary Materials (S3).

2.2.3. Post-Processing of the Results

The experiment and FEM results were post-processed in MATLAB (MATLAB Version: 9.11.0.1873467 (R2021b) Update 3, The MathWorks, Inc., Natick, MA, USA). Experimental values of the markers’ positions and displacements in the case of horizontal loading were transformed by the pinhole camera model [48] to avoid an influence of the perspective on the captured images (the values from vertical loading images were used as the reference values for the markers’ distance to the camera). Camera distances/focal lengths for branch nos. 1, 2, 3, and 4 were 3.9 m/18 mm; 4.3 m/19 mm; 3.9 m/18 mm; and 3.9 m/22 mm, respectively.
Due to the complex shapes of the main axes, the relative error (RE) was used as the parameter for validation and comparison of loading scenarios. To eliminate high RE values in the case of small displacement and local derivations, the RE was calculated based on the sum of displacement values. From the experiment, only the displacements in two directions were available; hence, the displacements in vertical and horizontal directions were compared separately to validate the model. To observe overall branch response in different loading scenarios, the displacement sum (Usum, resultant of directional displacements) was used. The values from loading scenario 1, EP area (force distribution according to the area of pruned parts), were used as reference.

3. Results and Discussion

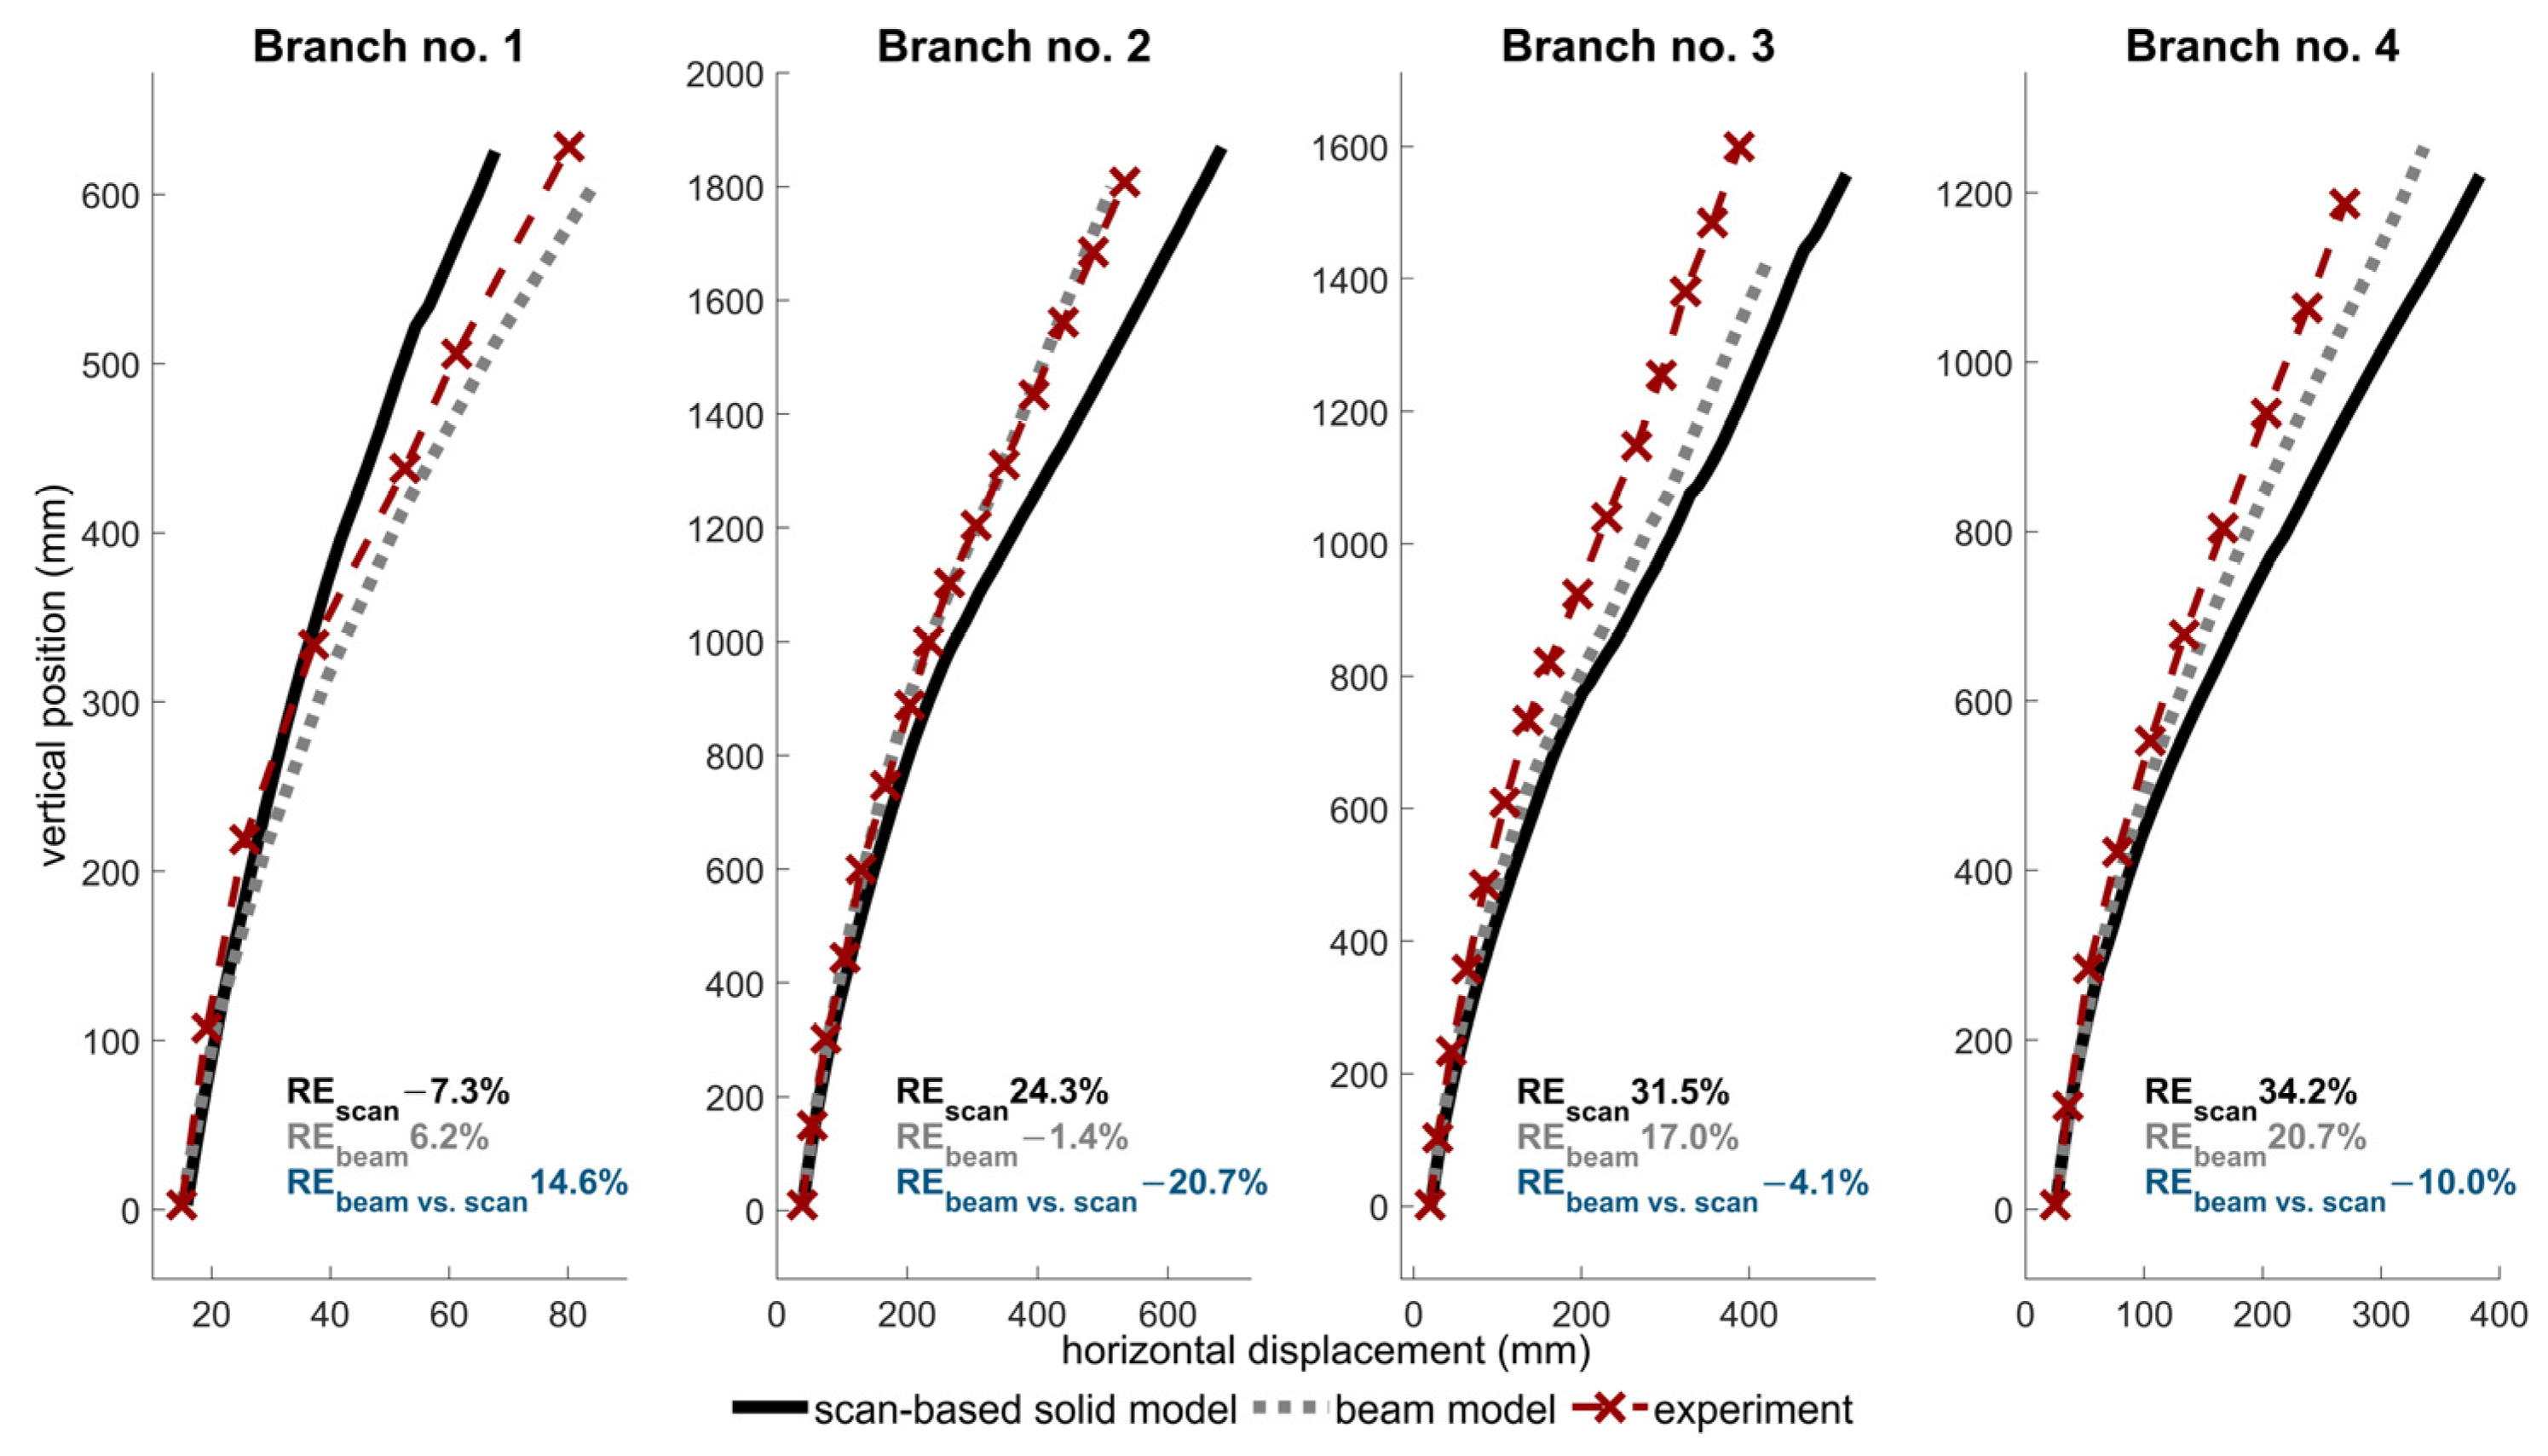
3.1. Experiment and Validation

Displacements in the direction of loading (horizontal and vertical) were used for the validation of the FEMs. In the case of horizontal loading, the RE of the scan-based solid model ranged from −7.3% to 34.2% (Figure 7). The range in RE for the beam model was −1.4% to 20.7%. The horse chestnut branches (nos. 3 and 4) showed a higher RE in both cases of geometry (beam and scan) than the birch branches. Only the scan-based geometry of branch no. 1 showed significantly lower deflections (RE −7.3%), corresponding mainly to the close-to-linear bottom part of the deflection curve. The scan-based geometry of branch no. 1 had approximately 10% higher diameter at the bottom part than measured diameter used for beam geometry. This was caused by the reconstruction errors due to the point cloud noise. Validation of this branch’s model was only possible for its lower half (without the leaves). In addition, the beam model of branch no. 2 showed lower deflection values than the experiment (RE −1.4%), while scan-based geometry showed higher deflection than the experiment (RE 24.3%), especially in the upper part. There was a complicated junction at the middle of the branch with unpredictable material properties which could contribute to the above-described inconsistent response of beam and scan-based solid geometry, which was also related to the directions of loading (Figure 7 and Figure 8).
In contrast, the FEMs’ displacements in vertical loading were lower than those in the experiment (REscan from −34.8% to 23.5%, REbeam from −40% to −11.3%), except in the case of branch no. 4 (REscan 27.3%, REbeam 7.9%) (Figure 8). Although orthotropy of the wood considered, the material properties for radial and tangential directions and the shear modulus were adopted from the literature [46] on similar species at 12% of moisture content. The developed material model was used in the entire branch, without incorporating expected variability of material properties [49] in different parts of the branch, or without the effect of moisture content on the elastic ratios. These two factors may have been the main contributors to the contradictory behavior of branches in different loading directions. Branch no. 2 showed the highest RE in both cases of geometry (REbeam −40% and REscan −34.8%). There was significant deviation in the upper part of this branch, which caused the bending curve to be unrealistically straight. Such a complicated branch shape with a junction point in the middle can cause deviation, since there is a high probability of different material properties at the junction [50].
In general, the REs expressing the difference in the sum of displacements were higher than in other studies [20,22,27,51], except for the detailed static analysis of inosculated joints [30]. However, it is necessary to emphasize that none of the FEMs of branches in our study were calibrated to fit the results. For example, involving the distribution of variable material properties or bark thickness could improve the models’ agreement with the experiment. These parameters were intentionally fixed to test our hypotheses, to obtain comparable results for different geometries, and to eliminate the number of variables in loading scenarios. Furthermore, the relatively high RE value may have been intensified by the monitoring of more positions in detail [13,30,51]. While the overall FEM deflection was sensitive to the initial displacement at the anchorage point [51], the low accuracy in the optical measurement of relatively low displacements of holder movement was probably responsible for increasing the RE. In addition, the movement of the holder was captured in two directions only; thus, the FEM was fully fixed for the third direction. In general, the attention to the branch’s anchorage point in both the experiment and the FEM should be improved in future research. Despite the numerically higher REs, the overall shape of branch deflection was very realistic and close to the experiment in both the beam and the solid scan-based FEM. Therefore, the FEMs were considered valid for the loading simulations.
There was no significant difference in the range of RE for precisely reconstructed scan-based geometry (REscan −34.8% to 34.2%) and derived beam geometry (REbeam −40% to 20.7%), although the results of the beam FEM were closer to the experimental values in six out of eight cases. The maximum difference between beam and scan-based geometry was up to 25.1% in the case of branch no. 1. Similar to previous studies’ findings [27,30,32], there was no significantly better correspondence to the experiment for either type of FEM. In the solid (scan-based) models, the possibilities associated with the wood material model definition [28,30] were not fully taken advantage of, as the data for concrete material properties (from species to specimen) are difficult to experimentally obtain, and the description of influence of factors (e.g., structure changes, moisture content) with property distribution, the full anisotropy, the non-linear nature, and similar factors are complex and were beyond the scope of this study.

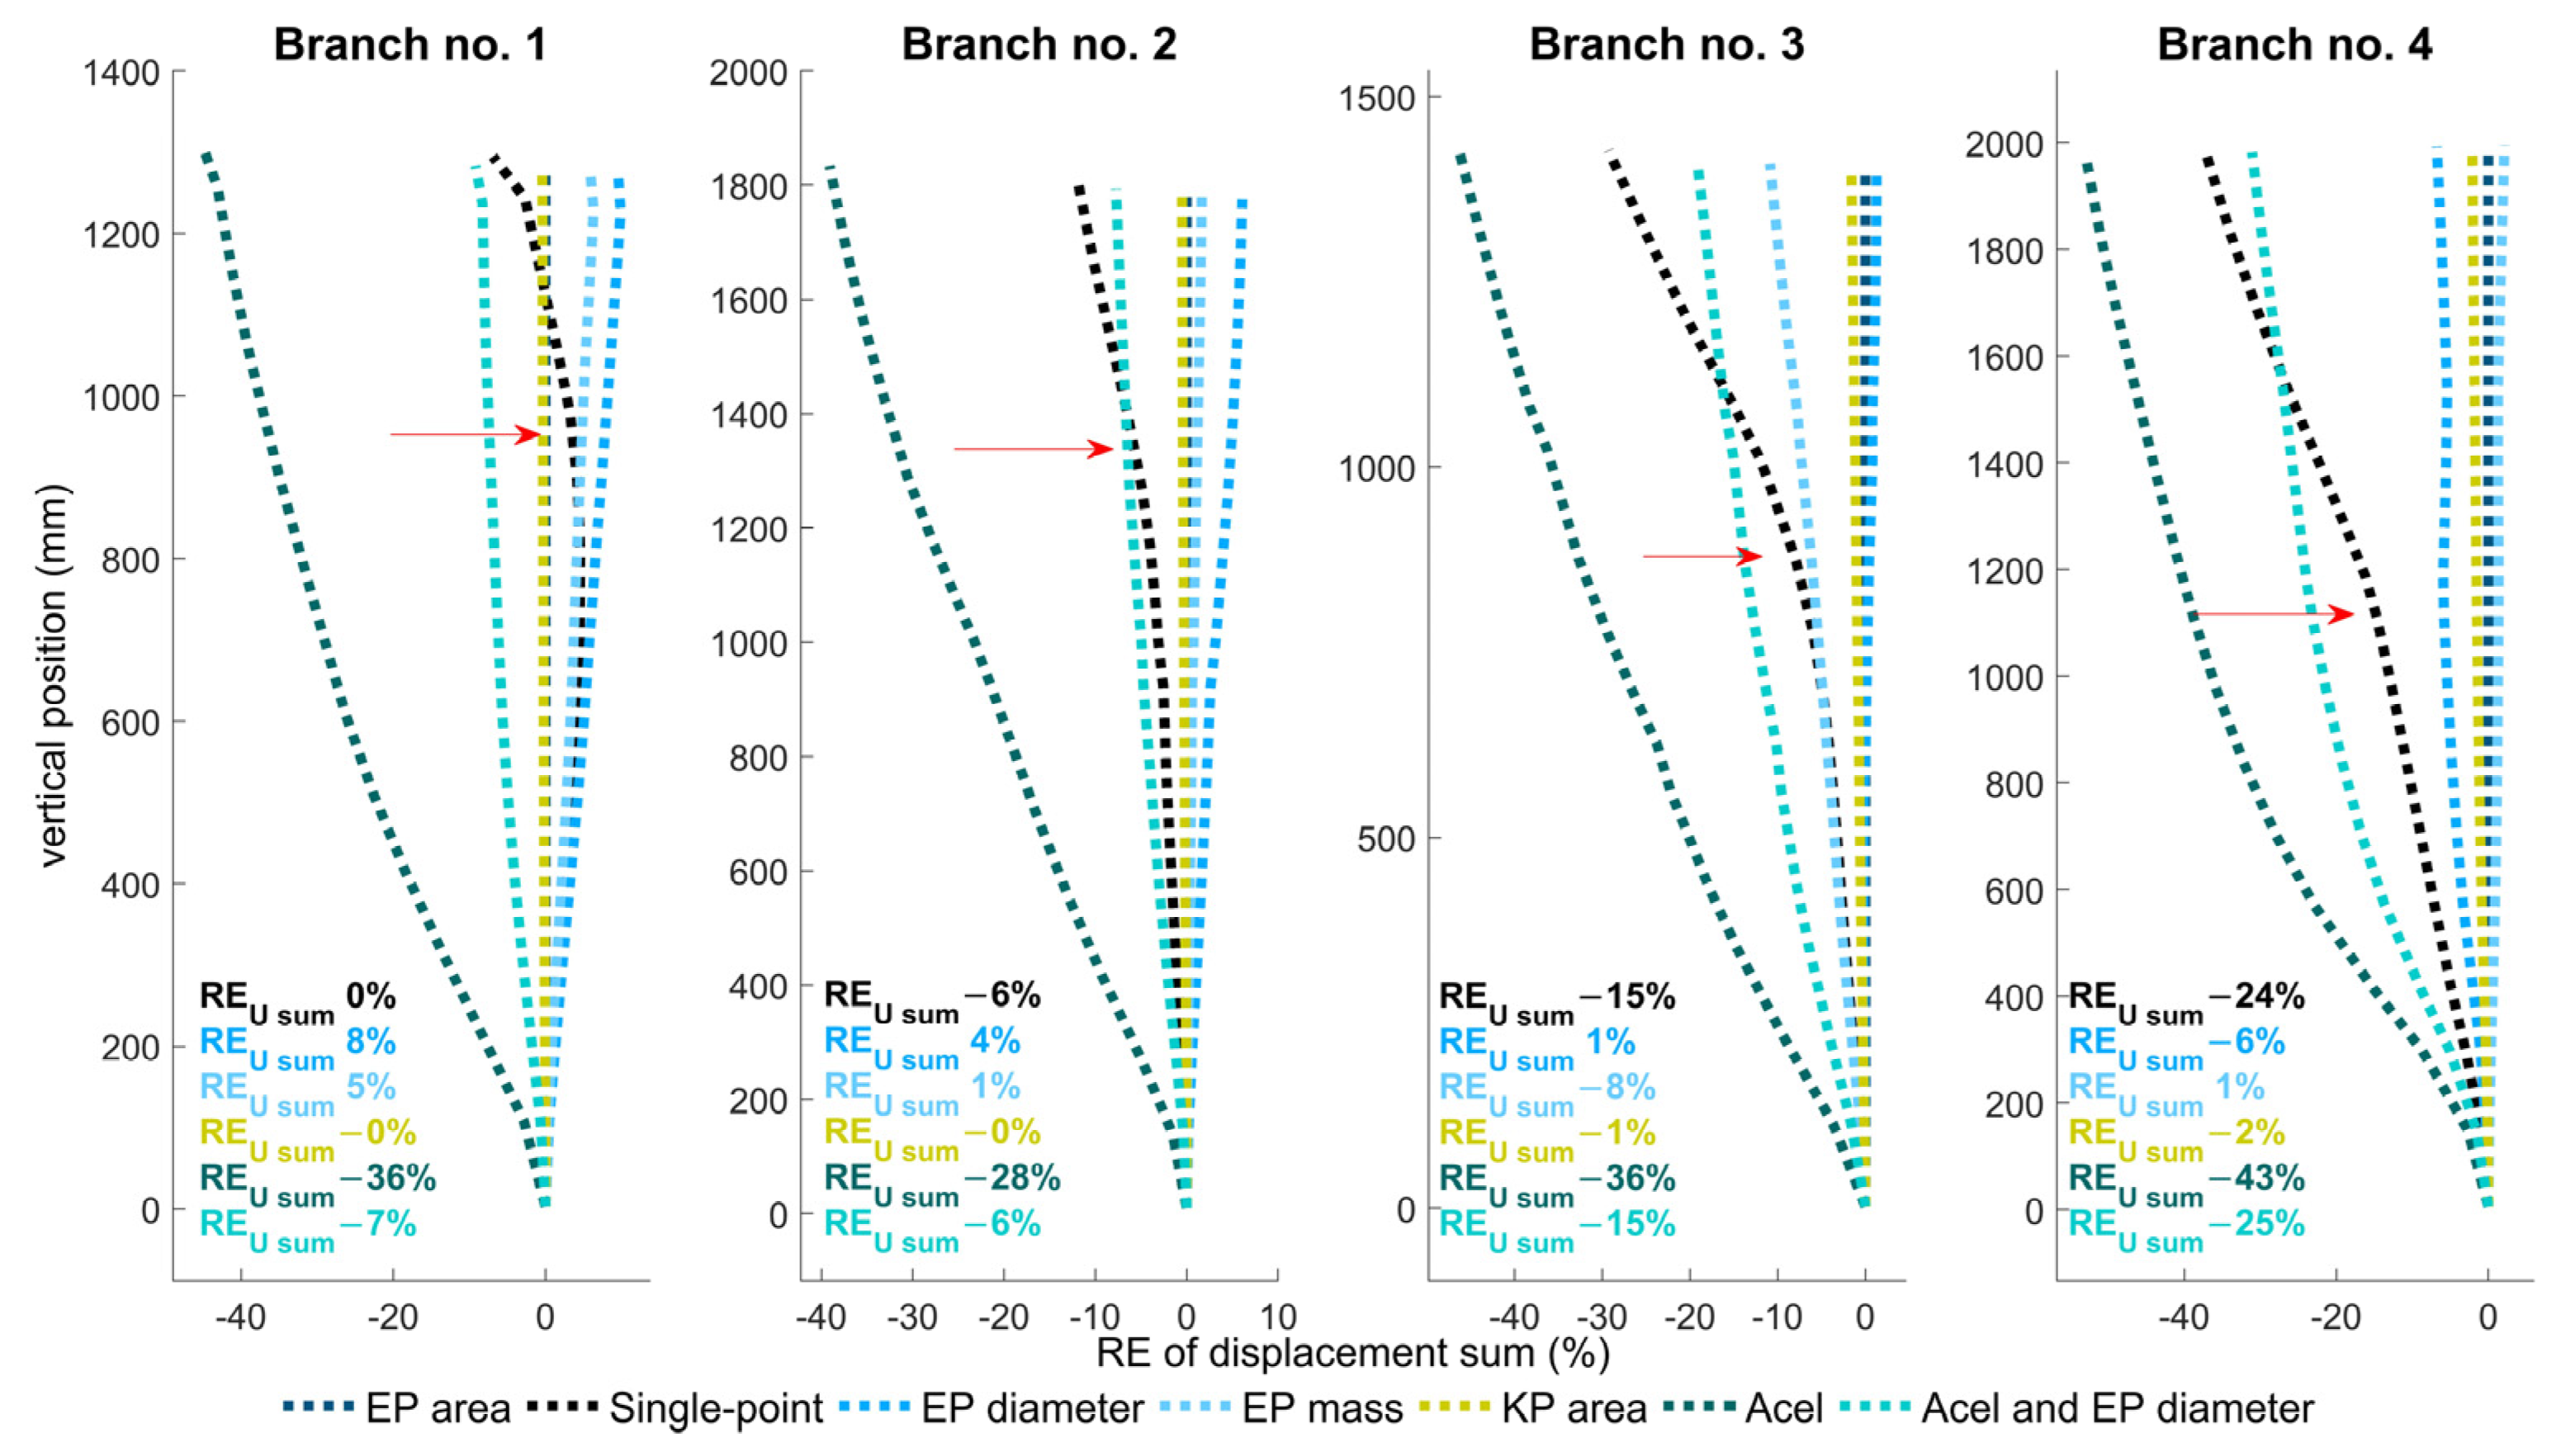
3.2. Branch Deflection for Different Loading Scenarios

Following the validation of the FEMs, seven loading scenarios were simulated. As reference one, the scenario in which the force was distributed according to the area of pruned parts (EP area) was chosen. To observe the different characteristics of branch deflections, the example of the single-point scenario and the EP area scenario are presented in Figure 9. The beam (a) and the scan-based solid (b) FEMs show similar characteristics of deflection in both loading scenarios. In the EP area scenario, the beam and the solid FEM are more deflected (curved) at the upper part. The exception is branch no. 1, where the deflection is almost identical for both loading scenarios.
To observe the differences in deflection more clearly for all loading scenarios, the course of RE along branches is shown in Figure 10 and Figure 11. In both FEMs (beam and solid), the behavior was similar in all loading scenarios except scenario 5. In comparison to other scenarios, scenario 5 used more different procedures for force distribution in the beam and scan-based solid FEMs. Force in the solid model was distributed according to the extracted diameters of side branches (EP diametersc); hence, the character of the deflection was closely related to that in scenario 3 (EP diameter, where the diameter was derived from experimental values). The missing values of the diameters that belonged to completely pruned side branches (not detected by the geometry scan) and the higher values of several extracted diameters (Figure 6) caused different distributions of force in scenario 5; therefore, there was a small difference in response (RE up to 5%) in scenarios 3 and 5 for branch nos. 3 and 4. In the case of branch no. 1, all exported side diameters consistently showed higher values than the measured value, but the response was, paradoxically, comparable, as the distribution of total force by weighting was comparable in both cases.
In the beam FEM of scenario 5, the force was distributed to all KPs according to the stem and leaves frontal area (KP area). Hence, the response of this FEM in scenario 5 was closely related to its response in scenario 1 (EP area).
In general, the response of the beam and scan-based solid FEMs were consistent in all loading scenarios. Regarding the next goal of this study, that is, determining the differences among loading scenarios, the greatest deviation from reference 1 (EP area) was presented by scenario 6 (ACEL), where both types of FEM showed the lowest levels of deflection (RE −44% to −25%). This was followed by scenario 7, where the RE ranged from −25% to −6%. The assumption was that the volume distribution of force would be close to the real wind load and enable a simple (automatic) way for force distribution. Unfortunately, the results show that it was not comparable with the commonly used frontal area option [22,28,52]. Beam models of branches had lower deflection in scenario 7 (ACEL and EP diameter) than in scenario 5 (KP area), even though they were considered to be similar. The sum of the frontal surface area of structural branches was relatively low compared to the volume of the branch. Thus, the distribution of force between the pruned parts (mainly leaves) and the structural part led to 29%–45% more force being added to the leafy part in scenario 5 (KP area) than in scenario 7 (ACEL and EP diameter).
Single-point loading (scenario 2), generally used to test the stability of trees [6,13,53,54], showed a different deflection curve (also visible in Figure 5). There was less curvature in the upper part of the branches (above the position of the load point), which can be observed by the high course of deviation in the deflection curves in Figure 10 and Figure 11. The overall RE (up to −27%) was average because of the combination of a well-fitting lower part of the curve and much deviation in the upper part. In the case of branch no. 1, it was possible to observe relatively more displacement at the lower part of the curve and less displacement at almost the top of the branch, indicating that branch no. 1 tended to have greater overall incline but less curvature than in scenario 1 (EP area). Branch no. 1 had proportionally the most mass/leaf area concentrated at the center of gravity (loading point), which, naturally, caused similar branch deflections in scenarios 1 (EP area) and 2 (single-point).
The remaining loading scenarios (1, 3, 4, and 5) were closely related to each other, which corresponds to the functional relationships between diameter, mass, and leaf area [40,43] The force distribution scenario according to diameter (scenario 3, EP diameter) showed a relatively greater branch deflection (up to 8%) compared with scenario 1 (EP area). Only in the case of branch no. 4 was the deflection lower (up to −6%) where the course of the displacement slightly changed (at the “S” shape of the curve). This was caused by the lower level of force distribution according to diameter in comparison with the other two options (mass and area). This was a factor for two side branches in the upper half of the branch (see values 0.12 vs. 0.32 and 0.24; 0.08 vs. 0.23 and 0.17 in Figure 4). Compared with scenario 3 (EP diameter), scenario 4 (EP mass) was even closer to the reference scenario (EP area), where the deflection was up to 5%, except in the case of branch no. 3 (with RE up to −8%). There was greater difference in the ratios of mass and area (0.21 vs. 0.16) at the side branch near the center of gravity. Therefore, the character of the deflection curve in the bottom part was similar to that with single-point loading (scenario 2). The distribution of force according to all ratios determined the shape of the deflection curve. This was clear in the behavior of branch no. 2, where the equal distribution of force in scenario 3 (EP diameter) caused the relatively greater incline of the whole branch, with less curvature, but the RE was higher because the overall incline was higher. The nature of deflection curves combining both incline and curvature, as well as the sensitivity of curve shape to local changes of FEM properties were discussed in previous studies on stem response [13]. In future research, the use of the non-linear relationship between the diameter and the leaf area—or rather, cross-section area instead of diameter [43,55,56]—may be considered to obtain ratios that are closely related to frontal surface areas.

3.3. Bending Moments for Different Loading Scenarios

Bending moments in all three directions (x, y, and z) at the branches’ attachment points are presented in Figure 12. The behavior of bending moments was consistent with branch deflection. The bending moment reactions were similar for the beam model and the scan-based solid model. In all loading scenarios, there was no difference in bending moment around the Y axis (MY), which was induced by the constant loading by leaves’ mass in the x direction. Contrary to other branches, the MY was of equal magnitude to the other two directions (MX, MZ) for branch no. 1, as the load of branch no. 1 caused by mass was two times greater than the pulling applied in the horizontal direction.
In general, bending moments around the Z axis (MZ) showed the highest values, as MZ represented the main direction of loading. The third axis (MX) represented loading by mass, added by pulling proportionally according to branch position and tilt.
The highest RE values in bending moments were found in scenarios 6 (RE −57.6% to −31.7%) and 7 (RE −32.9% to −9%) in both directions (MX and MZ). This was similar to the response of branches in deflection (Figure 10 and Figure 11). In other scenarios, the RE was up to 12.3%, except for branch no. 4, for which the RE in scenario 2 (single-point) ranged from −13.1% to −18.8%. This deviation was caused by a higher proportion of distributed force according to leaf area (68% of force is distributed above the position of single-point loading), contrary to other branches (nos. 1, 2, 3, where the proportion of distributed force above this position is 36%, 46%, and 35%, respectively). The single-point loading induced smaller bending moments in comparison with scenario 1 (EP area), except in the case of branch no. 1 and in the case of MX for branch no. 2 (1.7%). This is consistent with the deflection results for branch no. 1. Branch no. 1 had most of the leaf area concentrated closely to the center of gravity (see Section 3.2 and Figure 4). Together with the overall proportions of loads induced by mass and pulling force (mass load two times higher than pulling force) it caused similar values of MZ (up to 1.1% difference between scenario 1 and 2), but higher deviation of MX (up to 12.3%). In general, the difference in bending moment of scenario 2 (single-point) and scenario 1 (EP area) is affected by branch structure (side branches positions and leaf distribution).
Loading scenario 3 (EP diameter) showed a higher RE (up to 9.5%) in comparison with the REs (up to 6%) of scenario 1 (EP area) and scenario 4 (EP mass). The exception was branch no. 3, where the bending moment showed more deviation in the case of EP mass. This was the only instance where the moment was lower for EP mass than for EP area (RE −7.7% to −5.6%). In the case of loading scenario 3 (EP diameter), the bending moment increased for branch nos. 1 and 2 and decreased for branch nos. 3 and 4. This behavior corresponded with that in branch deflection (see Section 3.2), and was caused by the deviations in the force distribution ratios for mass, leaf area, and diameter. The consistency between branches’ bending moments and deflections confirms the validity of implementing bending moment as a global parameter for tree response description [22,25]. This also implies its possible use as a simplified loading parameter to substitute small branches in sub-structural analyses of complex tree models. However, based on our results, the bending moment can be sensitive to force distribution, and in particular, simplification of single-point loading can influence the output of simplified structural analyses.

4. Conclusions

This study aimed to explore the impact of simplification on the results of static structural analysis of wind loading on higher-order branches. The effect of geometry simplification combined with the effect of different force distributions on branches’ deflection and bending moment at the anchorage position was investigated.
On the geometric level, the detailed scan-based solid FEM did not provide significantly precise output in the area of deflection within linear-elastic range of behavior. The geometry of the solid model was influenced by the initial resolution of the scan and corresponding adjustments for import into finite-element software. Even in the case of detailed scan-based geometry, the FEM’s precision can be significantly influenced by definitions of the material (involving bark thickness, orthotropicity, distribution, moisture content, etc.) and boundary conditions (fixing and loading scenarios). Since the beam model, defined by directly measured parameters, provided comparable results in the experimental validation and consistency in the simulations of loading scenarios, the use of such simplified geometry in complex crown structures was proven to be valid for further research.
The simplification of total force to single-point loading significantly influenced branch deflection in comparison with multi-point scenarios. Even there, branch response was influenced by force distribution. The distribution of force by volume mass caused a significant underestimation of branch response. The remaining scenarios provided comparable results. The branch diameter can be used as a parameter for force distribution based on its functional relationship with the leaf area. However, the precision of this relationship could be evaluated in future studies.
The variability in the resulting anchorage bending moments does not allow such a clear conclusion about single-point loading. However, the reliability of single-point force is influenced by force distribution given by branch structure (side branches distribution), and in general the single-point loading cannot be recommended as a relevant simplification for modeling or substituting wind load in risk analysis. The consistency of moments with branch deflection opens the possibility of its use as an aggregate parameter for the transformation of loading small branches of a higher order to the lower order. Such an option for sub-structuring can provide a tool for complex analyses of tree structures in further work.

Supplementary Materials

The following supporting information can be downloaded at: https://www.mdpi.com/article/10.3390/f14050930/s1, S1: Figures S1–S5; S2: input _parameters (input tables for each branch in APDL .mac file and overall table .txt file), S3: branch_mac (macros with complete code in APDL).

Author Contributions

Conceptualization, J.T.; Methodology, B.V. and J.T.; Software, B.V. and J.T.; Validation, J.D. and R.M.; Formal Analysis, J.T. and R.M.; Investigation, B.V. and J.D.; Resources, J.D. and T.C.; Data Curation, B.V., M.H.V. and T.C.; Writing—Original Draft Preparation, B.V.; Writing—Review & Editing, J.T., R.M., J.D. and T.C.; Visualization, B.V.; Supervision, J.T.; Project Administration, B.V.; Funding Acquisition, J.T. and J.D. All authors have read and agreed to the published version of the manuscript.

Funding

The work dedicated to scan modeling and result processing was funded by the Ministry of Education, Youth and Sports in the Czech Republic, project no. LL1909, ERC CZ. The acquisition of data and scans of branches was funded by a grant overseen by the French National Research Agency (ANR) as part of the “Investissements d’Avenir” program (ANR-11-LABX-0002-01, Lab of Excellence ARBRE). The acquisition of data and beam modeling was funded by Internal Grant Agency of FFTW MENDELU, doctoral student’s project no. 2018036.

Data Availability Statement

The data presented in this study are available on request from the corresponding author. The complete code for FEMs and input parameters are available in the Supplementary Materials.

Conflicts of Interest

The authors declare no conflict of interest. The funders had no role in the design of the study; in the collection, analyses, or interpretation of data; in the writing of the manuscript; or in the decision to publish the results.

References

  1. van Haaften, M.; Liu, Y.; Wang, Y.; Zhang, Y.; Gardebroek, C.; Heijman, W.; Meuwissen, M. Understanding tree failure—A systematic review and meta-analysis. PLoS ONE 2021, 16, e0246805. [Google Scholar] [CrossRef]
  2. Seidel, D.; Ehbrecht, M.; Dorji, Y.; Jambay, J.; Ammer, C.; Annighöfer, P. Identifying architectural characteristics that determine tree structural complexity. Trees 2019, 33, 911–919. [Google Scholar] [CrossRef]
  3. Seidel, D.; Annighöfer, P.; Stiers, M.; Zemp, C.D.; Burkardt, K.; Ehbrecht, M.; Willim, K.; Kreft, H.; Hölscher, D.; Ammer, C. How a measure of tree structural complexity relates to architectural benefit-to-cost ratio, light availability, and growth of trees. Ecol. Evol. 2019, 9, 7134–7142. [Google Scholar] [CrossRef] [PubMed]
  4. Thibaut, B.; Gril, J.; Fournier, M. Mechanics of wood and trees: Some new highlights for an old story. Comptes Rendus De L’academie Sci.-Ser. IIb Mec. 2001, 329, 701–716. [Google Scholar] [CrossRef]
  5. Gardiner, B.A.; Achim, A.; Nicoll, B.; Ruel, J.C. Understanding the interactions between wind and trees: An introduction to the IUFRO 8th Wind and Trees Conference (2017). Int. J. For. Res. 2019, 92, 375–380. [Google Scholar] [CrossRef]
  6. Peltola, H.M. Mechanical stability of trees under static loads. Am. J. Bot. 2006, 93, 1501–1511. [Google Scholar] [CrossRef]
  7. Detter, A.; Rust, S.; Krišāns, O. Experimental test of non-destructive methods to assess the anchorage of trees. Forests 2023, 14, 533. [Google Scholar] [CrossRef]
  8. Sani, L.; Lisci, R.; Moschi, M.; Sarri, D.; Rimediotti, M.; Vieri, M.; Tofanelli, S. Preliminary experiments and verification of controlled pulling tests for tree stability assessments in Mediterranean urban areas. Biosyst. Eng. 2012, 112, 218–226. [Google Scholar] [CrossRef]
  9. Dahle, G.A.; James, K.R.; Kane, B.; Grabosky, J.C.; Detter, A. A review of factors that affect the static load-bearing capacity of urban trees. Arboric. Urban For. 2017, 43, 86–106. [Google Scholar] [CrossRef]
  10. Niklas, K.J.; Spatz, H.C. Worldwide correlations of mechanical properties and green wood density. Am. J. Bot. 2010, 97, 1587–1594. [Google Scholar] [CrossRef]
  11. Koizumi, A.; Hirai, T. Evaluation of the section modulus for tree-stem cross sections of irregular shape. J. Wood Sci. 2006, 52, 213–219. [Google Scholar] [CrossRef]
  12. Kim, Y.; Rahardjo, H.; Tsen-Tieng, D.L. Mechanical behavior of trees with structural defects under lateral load: A numerical modeling approach. Urban For. Urban Green 2021, 59, 126987. [Google Scholar] [CrossRef]
  13. Vojáčková, B.; Tippner, J.; Horáček, P.; Sebera, V.; Praus, L.; Mařík, R.; Brabec, M. The effect of stem and root-plate defects on the tree response during static loading—Numerical analysis. Urban For. Urban Green 2021, 59, 127002. [Google Scholar] [CrossRef]
  14. Dargahi, M.; Newson, T.; Moore, J.R. A numerical approach to estimate natural frequency of trees with variable properties. Forests 2020, 11, 915. [Google Scholar] [CrossRef]
  15. Sellier, D.; Fourcaud, T. Crown structure and wood properties: Influence on tree sway and response to high winds. Am. J. Bot. 2009, 96, 885–896. [Google Scholar] [CrossRef]
  16. Fan, G.; Nan, L.; Dong, Y.; Su, X.; Chen, F. AdQSM: A new method for estimating above-ground biomass from TLS point clouds. Remote. Sens. 2020, 12, 3089. [Google Scholar] [CrossRef]
  17. Raumonen, P.; Kaasalainen, M.; Markku, Å.; Kaasalainen, S.; Kaartinen, H.; Vastaranta, M.; Holopainen, M.; Disney, M.; Lewis, P. Fast automatic precision tree models from terrestrial laser scanner data. Remote. Sens. 2013, 5, 491–520. [Google Scholar] [CrossRef]
  18. Bucksch, A.; Lindenbergh, R.; Menenti, M. Robust skeleton extraction from imperfect point clouds. Vis. Comput. 2010, 26, 1283–1300. [Google Scholar] [CrossRef]
  19. Terryn, L.; Calders, K.; Disney, M.; Origo, N.; Malhi, Y.; Newnham, G.; Raumonen, P.; Åkerblom, M.; Verbeeck, H. Tree species classification using structural features derived from terrestrial laser scanning. ISPRS J. Photogramm. Remote. Sens. 2020, 168, 170–181. [Google Scholar] [CrossRef]
  20. Jackson, T.; Shenkin, A.; Wellpott, A.; Calders, K.; Origo, N.; Disney, M.; Burt, A.; Raumonen, P.; Gardiner, B.; Herold, M.; et al. Finite element analysis of trees in the wind based on terrestrial laser scanning data. Agric. For. Meteorol. 2019, 265, 137–144. [Google Scholar] [CrossRef]
  21. Yang, M.; Défossez, P.; Dupont, S. A root-to-foliage tree dynamic model for gusty winds during windstorm conditions. Agric. For. Meteorol. 2020, 287, 107949. [Google Scholar] [CrossRef]
  22. Dellwik, E.; van der Laan, M.P.; Angelou, N.; Mann, J.; Sogachev, A. Observed and modeled near-wake flow behind a solitary tree. Agric. For. Meteorol. 2019, 265, 78–87. [Google Scholar] [CrossRef]
  23. Chan, W.L.; Eng, Y.; Ge, Z.; Lim, C.W.C.; Gobeawan, L.; Poh, H.J.; Wise, D.J.; Burcham, D.C.; Lee, D.; Cui, Y.; et al. Wind loading on scaled down fractal tree models of major urban tree species in Singapore. Forests 2020, 11, 803. [Google Scholar] [CrossRef]
  24. Gobeawan, L.; Wise, D.J.; Yee, A.T.K.; Wong, S.T.; Lim, C.W.; Lin, E.S.; Su, Y. Convenient Tree Species Modeling for Virtual Cities. In Lecture Notes in Computer Science; Springer: Cham, Switzerland, 2019; Volume 11542, pp. 304–315. [Google Scholar] [CrossRef]
  25. Angelou, N.; Dellwik, E.; Mann, J. Wind load estimation on an open-grown European oak tree. For. Int. J. For. Res. 2019, 92, 381–392. [Google Scholar] [CrossRef]
  26. Vojáčková, B.; Tippner, J.; Dlouhá, J. Force Distribution Along Tree Branch–Static Analysis. In Proceedings of the World Congress in Computational Mechanics and ECCOMAS2020, Online, 11–15 January 2021; p. 900. [Google Scholar] [CrossRef]
  27. Sellier, D.; Fourcaud, T.; Lac, P. A finite element model for investigating effects of aerial architecture on tree oscillations. Tree Physiol. 2006, 26, 799–806. [Google Scholar] [CrossRef]
  28. Tsugawa, S.; Teratsuji, K.; Okura, F.; Noshita, K.; Tateno, M.; Zhang, J.; Demura, T. Exploring the mechanical and morphological rationality of tree branch structure based on 3D point cloud analysis and the finite element method. Sci. Rep. 2022, 12, 4054. [Google Scholar] [CrossRef]
  29. Pistellato, M.; Bergamasco, F.; Albarelli, A.; Torsello, A. Robust Cylinder Estimation in Point Clouds from Pairwise Axes Similarities. In Proceedings of the 8th International Conference on Pattern Recognition Applications and Methods, Prague, Czech Republic, 19–21 February 2019; SciTePress: Setúbal, Portugal, 2019; pp. 640–647, ISBN 978-989-758-351-3. [Google Scholar] [CrossRef]
  30. Middleton, W.; Erdal, H.I.; Detter, A.; D’Acunto, P.; Ludwig, F. Comparing structural models of linear elastic responses to bending in inosculated joints. Trees 2023. [Google Scholar] [CrossRef]
  31. Kazhdan, M.; Matthew, B.; Hoppe, H.; Soatto, S. Robust Poisson Surface Reconstruction. In Proceedings of the Eurographics Symposium on Geometry Processing, Cagliari Sardinia, Italy, 26–28 June 2006; The Eurographics Association: Eindhoven, The Netherlands, 2006; p. 10. [Google Scholar]
  32. Tippner, J.; Vojáčková, B.; Zlámal, J.; Kolařík, J.; Paulic, V.; Group, F. The role of geometry precision in frequency-resonance method for non-destructive wood assessment–Numerical case study on sugar maple. Wood Mater. Sci. Eng. 2022, 1–9. [Google Scholar] [CrossRef]
  33. Kazhdan, M.; Hoppe, H. Screened Poisson surface reconstruction. ACM Trans. Graph. 2013, 32, 1–13. [Google Scholar] [CrossRef]
  34. Divós, F.; Tanaka, T. Relation between static and dynamic modulus of elasticity of wood. Acta Silv. Lign. Hung 2005, 1, 105–110. [Google Scholar]
  35. Bučar, D.G.; Bučar, B. Strength grading of structural timber using the single mode transverse damped vibration method. Wood Res. 2011, 56, 67–76. [Google Scholar]
  36. Chauhan, S.; Sethy, A. Differences in dynamic modulus of elasticity determined by three vibration methods and their relationship with static modulus of elasticity. Maderas Cienc. Tecnol. 2016, 18, 373–382. [Google Scholar] [CrossRef]
  37. Madhoushi, M.; Boskabadi, Z. Relationship between the dynamic and static modulus of elasticity in standing trees and sawn lumbers of Paulownia fortune planted in Iran. Maderas Cienc. Tecnol. 2019, 21, 35–44. [Google Scholar] [CrossRef]
  38. Niklas, K.J.; Spatz, H.C.H. Plant Physics; University of Chicago Press: Chicago, IL, USA, 2012; p. 425. ISBN 10:0-226-58632-4. [Google Scholar]
  39. Hu, M.; Pitkänen, T.P.; Minunno, F.; Tian, X.; Lehtonen, A.; Mäkelä, A. A new method to estimate branch biomass from terrestrial laser scanning data by bridging tree structure models. Ann. Bot. 2021, XX, 1–15. [Google Scholar] [CrossRef] [PubMed]
  40. Kidombo, S.D.; Dean, T.J. Growth of tree diameter and stem taper as affected by reduced leaf area on selected branch whorls. Can. J. For. Res. 2018, 48, 317–323. [Google Scholar] [CrossRef]
  41. Karlik, J.F.; Winer, A.M. Comparison of calculated and measured leaf masses of urban trees. Ecol. Appl. 1999, 9, 1168–1176. [Google Scholar] [CrossRef]
  42. Nowak, D.J. Estimating leaf area and leaf biomass of open-grown deciduous urban trees. For. Sci. 1996, 42, 504–507. [Google Scholar]
  43. Sun, J.; Wang, M.; Lyu, M.; Niklas, K.J.; Zhong, Q.; Li, M.; Cheng, D. Stem diameter (and not length) limits twig leaf biomass. Front. Plant Sci. 2019, 10, 185. [Google Scholar] [CrossRef]
  44. Gross, P.D.; Hauger, W.; Schröder, J.; Wall, A.W.; Bonet, J. Engineering Mechanics 2: Mechanics of Materials; Springer: Berlin/Heidelberg, Germany, 2011; ISBN 9783642128851. [Google Scholar]
  45. Larjavaara, M.; Muller-Landau, H.C. Rethinking the value of high wood density. Funct. Ecol. 2010, 24, 701–705. [Google Scholar] [CrossRef]
  46. Ross, R.J. Wood Handbook; U.S. Department of Agriculture, Forest Service, Forest Products Laboratory: Madison, WI, USA, 2021; 543p.
  47. Aydin, Y.T.; Ozveren, A. Effects of moisture content on elastic constants of fir wood. Eur. J. Wood Wood Prod. 2019, 77, 63–70. [Google Scholar] [CrossRef]
  48. Schreier, H.; Orteu, J.-J.; Sutton, M.A. Image Correlation for Shape, Motion and Deformation Measurements; Springer: Boston, MA, USA, 2009; ISBN 978-0-387-78746-6. [Google Scholar]
  49. Dahle, G.A.; Grabosky, J.C. Variation in modulus of elasticity (E) along Acer platanoides L. (Aceraceae) branches. Urban For. Urban Green 2010, 9, 227–233. [Google Scholar] [CrossRef]
  50. Jungnikl, K.; Goebbels, J.; Burgert, I.; Fratzl, P. The role of material properties for the mechanical adaptation at branch junctions. Trees 2009, 23, 605–610. [Google Scholar] [CrossRef]
  51. Vojáčková, B.B.; Tippner, J.; Horáček, P.; Praus, L.; Sebera, V.; Brabec, M. Numerical analysis of branch mechanical response to loading. Arboric. Urban For. 2019, 45, 120–131. [Google Scholar] [CrossRef]
  52. EN 1991-1-4; Eurocode 1: Actions on Structures—Part 1–4: General Actions-Wind Actions. European Committee For Standardization: Brussels, Belgium, 2010.
  53. Szoradova, A.; Praus, L.; Kolarik, J. Evaluation of the root system resistance against failure of urban trees using principal component analysis. Biosyst. Eng. 2013, 115, 244–249. [Google Scholar] [CrossRef]
  54. Krišāns, O.; Čakša, L.; Matisons, R.; Rust, S.; Elferts, D.; Seipulis, A.; Jansons, Ā. A static pulling test is a suitable method for comparison of the loading resistance of silver birch (Betula pendula Roth.) between urban and peri-urban forests. Forests 2022, 13, 127. [Google Scholar] [CrossRef]
  55. Tziaferidis, S.R.; Spyroglou, G.; Fotelli, M.N.; Radoglou, K. Allometric models for the estimation of foliage area and biomass from stem metrics in black locust. IForest 2022, 15, 281–288. [Google Scholar] [CrossRef]
  56. Spyroglou, G.; Zianis, D.; Radoglou, K. Leaf area and foliar weight to sapwood cross sectional area models for Quercus frainetto (Ten.) in Greece. Silva Balc. 2021, 1, 5–20. [Google Scholar] [CrossRef]
Figure 1. Experimental setup of branch no. 2 with observed markers. (a) shows horizontal loading; and (b) shows vertical loading.
Forests 14 00930 g001
Figure 2. Branch no. 2. (a) shows the main axis with markers positions (red tape) after pruning of side (lateral) branches; and (b) shows an example of the measured frontal area of the pruned part (Asj); (c) shows schema of measured parameters; lg distance to the center of gravity, α angle of branch anchorage, αmi angles at points of main axis curvature change, lmsj distance of side branch base from the marker, αsj angle of anchorage to the main axis, lsj length of side branches, dsj base diameter of side branches, dvi, and dhi vertical and horizontal diameters at the position of each marker, pj orientation of side branches along circumference, Fv and Fh vertical and horizontal pulling force.
Forests 14 00930 g002
Figure 3. FEMs of branch no. 2 with the schema of the result coordinate system (RSYS), bending moment components, and boundary conditions of horizontal loading. (a) shows the beam model with schema of end points (EP) and key points (KP) used for force distribution; and (b) shows the scan-based solid model with schema of end points (EP).
Forests 14 00930 g003
Figure 4. Weighting ratios for diameter, mass, and leaf area of side branches for force distribution along the length of the branch.
Forests 14 00930 g004
Figure 5. Branch no. 1 with assigned cylindrical LCSYSs and material properties in segments (segments are shown by a different colors).
Forests 14 00930 g005
Figure 6. Overview of the diameters obtained from the experiment and the scan-based solid model.
Forests 14 00930 g006
Figure 7. Experimental validation of beam and scan-based solid FEMs for horizontal loading. Relative error (RE) refers to the relative error of the sum of horizontal displacements. The presented relative errors are for comparison of beam (REbeam) and scan (REscan) with experiment, and also for comparison of beam and scan-based solid geometry (REbeam vs. scan).
Forests 14 00930 g007
Figure 8. Experimental validation of beam and scan-based solid FEMs for vertical loading. RE is the relative error of the sum of vertical displacements. The presented relative errors are for comparison of beam (REbeam) and scan (REscan) with experiment, and also for comparison of beam and scan-based solid geometry (REbeam vs. scan).
Forests 14 00930 g008
Figure 9. Deflection of FEMs (sum of nodal displacement, Usum) in the case of single-point loading and loading to the endpoints of side branches by force distributed according to leaf area. (a) is the scan-based solid model; and (b) is the beam model.
Forests 14 00930 g009
Figure 10. REs of displacements along the branches for different loading scenarios of the scan-based solid models. Red arrows mark the position of the center of gravity. EP area means force is applied on the endpoints of side branches and distributed by areas of the pruned parts (reference scenario), Single-point means force is applied in the center of gravity, EP diameter means force is distributed according to side branches’ diameters, EP mass means distribution according to side branches’ mass, EP diametersc means distribution according to diameters extracted automatically from the scan, ACEL means whole body loaded by acceleration distributed by mass of elements, and ACEL and EP diametersc indicates a combination of the previous two scenarios.
Forests 14 00930 g010
Figure 11. Relative errors along the branches for different loading scenarios of the beam model. Red arrows mark the position of the center of gravity. EP area means force is applied on the endpoints of side branches and distributed by leaf areas (reference scenario), Single-point means force is applied at the center of gravity, EP diameter means force is distributed according to side branches’ diameters, EP mass means distribution according to side branches’ mass, KP area means force is applied on all KPs and distributed by stem and leaf areas, ACEL means whole body loaded by acceleration distributed by mass of elements, and ACEL and EP area indicates a combination of the ACEL and EP area scenarios.
Forests 14 00930 g011
Figure 12. Bending moments in three directions (MX, MY, MZ) for different loading scenarios of the beam model and the scan-based solid model. EP area means force is applied on the endpoints of side branches and distributed by leaf areas (reference scenario), Single-point means force is applied at the center of gravity, EP diameter means force is distributed according to side branches’ diameters, EP mass means distribution according to side branches’ mass, EP diametersc means distribution according to diameters extracted automatically from the scan, KP area means force is applied on all KPs and distributed by stem and leaf areas, ACEL means whole body loaded by acceleration distributed by mass of elements, ACEL and EP diametersc indicates the combination of ACEL and EP diametersc, and ACEL and EP area indicates the combination of ACEL and EP area.
Forests 14 00930 g012
Table 1. Main parameters of the investigated branches used in finite-element models (FEMs). α is angle of branch anchorage (same as the position in the crown), lg is center of gravity, la is length of the main axis, dv1/dh1 is diameter at branch base in vertical/horizontal direction, m is overall mass, Fv is force applied in the vertical direction, Fh is force applied in the horizontal direction, ELd/SD is dynamic longitudinal elastic modulus/standard deviation, and ρ is green wood density.
Branch No.Speciesαlgladv1dh1mFvFhELd/SDρ
(°)(m)(m)(mm)(mm)(kg)(N)(N)(MPa)(kg/m3)
1Birch451.562.9036.637.63.951919.64819/46916
2Birch571.713.6240.441.15.2047498008/27840
3Horse Chestnut491.352.6835.2372.6533.533.54985/569846
4Horse Chestnut791.432.734340.53.2348.548.54658/812890
Table 2. Elastic constants in the material model of the FEM. ELd is measured dynamic longitudinal elastic modulus; ELb is static longitudinal elastic modulus used for the beam model; ELs is static longitudinal elastic modulus used for the solid scan-based model; EX, EY, and EZ are elastic moduli in the direction of local coordinate systems (LCSYSs, corresponding to longitudinal, radial, and tangential anatomical directions); GXY, GYZ, and GXZ are shear elastic moduli; and NUXY, NUYZ, and NUXZ are minor Poisson ratios.
ELb = EXELs = EZEYEXGXYGYZGXZNUXYNUYZNUXZ
BirchELd×0.9ELd×0.60.050.0780.0170.0680.0740.4260.0240.043
Horse ChestnutELd×0.9ELd×0.60.0270.0660.020.0460.0560.3460.0220.034
Table 3. Overview of loading scenarios. KPs are key points of the beam model.
Scenario No.BeamScanDescription
1EP areaEP areaLoad applied to top nodes of side branches, distributed according to area.
2single-pointsingle-pointLoad applied to the center of gravity.
3EP diameterEP diameterLoad applied to top nodes of side branches, distributed according to diameter.
4EP massEP massLoad applied to top nodes of side branches, distributed according to mass.
5KP areaEP diameterscBeam model: load applied to all KPs, distributed according to area of structural branch and areas of pruned parts.
Scan-based solid model: load applied to top of side branches, distributed according to diameters extracted from FEM.
6ACELACELLoad applied to whole object, distributed by the elements’ mass.
7ACEL and EP diameterACEL and EP diameterLoad applied to whole object and to the top nodes of side branches.
Disclaimer/Publisher’s Note: The statements, opinions and data contained in all publications are solely those of the individual author(s) and contributor(s) and not of MDPI and/or the editor(s). MDPI and/or the editor(s) disclaim responsibility for any injury to people or property resulting from any ideas, methods, instructions or products referred to in the content.

