Article

Resilience of Pyrenean Forests after Recurrent Historical Deforestations

by
Valentí Rull
1,* and
Teresa Vegas-Vilarrúbia
2
1
Spanish National Research Council (CSIC), Botanic Institute of Barcelona, 08038 Barcelona, Spain
2
Department of Evolutionary Biology, Ecology and Environmental Sciences, University of Barcelona, 08028 Barcelona, Spain
*
Author to whom correspondence should be addressed.
Forests 2023, 14(3), 567; https://doi.org/10.3390/f14030567
Submission received: 7 February 2023 / Revised: 6 March 2023 / Accepted: 12 March 2023 / Published: 13 March 2023

Abstract

:
The long-term resilience of Pyrenean forests in the face of historical anthropogenic clearing remains largely unknown. In this paper, a high-resolution (decadal to subdecadal) paleoecological study of mid-elevation Pyrenean forests is presented that encompasses the last two millennia. This long-term record was obtained after sediment coring, dating (varve counting) and pollen analysis of annually laminated (varved) sediments from Lake Montcortès, situated at 1027 m elevation, in the transition between the Mediterranean and montane forest belts. This allowed the definition of three major deforestation/recovery cycles during the Roman, Medieval and Modern times. Each DR cycle is characterized considering three different levels: overall forest trends, forest type and individual taxa. Overall, the studied forests exhibited high resilience, as they recovered almost completely after each deforestation event (bulk resilience). The critical point of no return (tipping point) beyond which forests would have irreversibly disappeared from the region was never reached, even after deforestation magnitudes above 60%. The different forest types identified (conifer, sclerophyll and deciduous) persisted over time, showing similar heterogeneous patterns with minor spatial reorganizations (mosaic resilience). Individually, the main forest taxa underwent minor variations in their relative abundances, always within the same attraction domains (community resilience). The high levels of resilience documented in these Pyrenean forests are attributed to the action of metapopulation and metacommunity processes and mechanisms in a highly dynamic patchy environment. Conservation actions should be focused on the maintenance of these spatial patterns and the associated ecological dynamics.

1. Introduction

Resilience has been defined as the capacity of ecosystems to return to their initial state, or reference state, after temporal external disturbances [1,2]. This concept was introduced by Holling [3], who noted that ecosystems hardly remain unchanged after external disturbances, but once the disturbances cease, they may be able to return to a state of similar structure, function and composition, thus maintaining their identity. The intensity and duration of the disturbance also play a key role in the process by affecting the return time (t), the recovery rates (r) and the ecosystem state after recovery (Figure 1). Each ecosystem has its own attraction domain, which is the set of potential states that the community may adopt without losing its identity [3]. The combination of disturbance magnitude and ecosystem resilience determines whether community composition remains within the same attraction domain or crosses a threshold toward a different attraction domain, that is, the attraction domain of a different ecosystem. This change is known as regime shift and can also be triggered by the accumulation of minor but persistent disturbances or by amplification feedbacks causing nonlinear responses, i.e., responses of disproportionate magnitude in comparison with the intensity of the disturbance [4,5].
In the case of forests, resilience has been divided into three different components, namely, persistence, recovery and reorganization [7]. Persistence (no apparent change) and recovery (return to the initial state) occur within the same attraction domain, whereas reorganization implies deeper compositional variations that may be transient (i.e., occurring within the same attraction domain) or persistent if the threshold between two attraction domains is crossed (regime shifts). Changes in composition within the same attraction domain imply variations in the relative abundances of the already existing species or individual species replacements. A regime shift involves complete species turnover, which means replacement by a different forest or by a nonforested community (deforestation), and has been called community replacement [8,9] or vegetation type conversion [7].
As a long-term ecological process, the study of forest succession may benefit from high-resolution paleoecological studies that are capable of providing detailed records of community dynamics over timescales beyond the reach of modern ecological surveys [10]. Within the scope of the present work, paleoecological records of ecosystem dynamics have shown that (i) successional trends at the community level are largely shaped by individualistic species’ responses to external and internal ecosystem drivers; (ii) community assembly is influenced by both idiosyncratic niche features of the involved species (niche compatibility) and random processes linked to dispersal and population dynamics (neutral theory of biodiversity); and (iii) communities are in constant adjustment with changing environments across spatiotemporal scales (nonequilibrium dynamics) [8,11,12,13,14,15].
In the Pyrenees, most paleoecological studies on forests are of low resolution (centennial to millennial), which is insufficient to unravel successional trends, and use palynological (pollen) evidence as an indicator (proxy) for environmental change and human pressure, which prevents inference on the response of forests to these forces (review in [16]). High-resolution (annual to decadal) studies aimed at reconstructing in detail successional patterns in terms of disturbance agents, compositional changes, attraction domains, resilience, response thresholds and regime shifts are lacking. This represents a serious drawback not only to knowing how Pyrenean forests have been assembled but also to informing their conservation and management.
In the last decade, the sediments of Lake Montcortès, which contain a unique continuous annually laminated (varved) record of the last three millennia, have been intensively studied from a paleoecological point of view at a decadal/subcentennial resolution [17,18,19,20]. To date, these studies have focused on the response of montane forests as a whole to natural and anthropogenic drivers of ecological change, notably climate, fire, extraction activities, cultivation and grazing. This has allowed the identification of three regional anthropogenic deforestation events during the historical period (the last two millennia): Roman deforestation (1st–6th centuries), Medieval deforestation (7th–15th centuries) and Modern deforestation (16th–19th centuries) [20]. A study on the individual responses of dominant forest tree species to the above drivers is available for the Modern Age [16], but detailed studies during the three historical deforestation–recovery cycles and comparisons among them are unavailable.
This paper is aimed at reconstructing in detail the historical deforestation/recovery cycles of the Montocortès forests during the last two millennia and characterizing their long-term resilience in the face of predominant anthropogenic clearing. This study is conducted using three different approaches, namely, the overall forest trends, the shifts in the different forest types and the individual behavior of the main forest taxa. The results obtained are compared with the pollen records available for the central Iberian Pyrenees for a more regional picture. Finally, the potential applications of this study to forest conservation are discussed.

2. Study Area

Lake Montcortès is situated in the NE Iberian Peninsula on the southern flank of the central Pyrenees at 42°19′50″ N–0°59′41″ E and 1027 m elevation (Figure 2). The lake is kidney-shaped and small, with a diameter of 400–500 m, a total surface area of 0.14 km2 and a maximum depth of 32 m. The watershed is also small (1.4 km2), with a few intermittent small creeks and scattered springs, and the lake is fed primarily by groundwater. Geologically, the lake is part of an ellipsoidal evaporitic collapse area resulting from the coalescence of several collapse sinkholes developed on Triassic evaporitic sediments (Facies Keuper) overlain by limestones (Facies Muscheskalk) [21]. The climate is montane with a Mediterranean influence. The maximum average temperatures (~19 °C) correspond to July and August, and the minima (2–2.5 °C) correspond to January and February. Precipitation peaks in May–June (~110 mm), and after a July drop to ~70 mm, it recovers to values above 90 mm between August and November. The lowest values correspond to January–March, with February as the driest month (~60 mm) [22].
Lake Montcortès lies near the altitudinal boundary corresponding to the Submontane belt, which in the Pyrenees is situated at approximately 800–1000 m elevation, depending on local conditions [23]. Three major forest formations occur in the lake region, reflecting this boundary condition: conifer forests (Cf), Mediterranean sclerophyll oak forests (Msf) and Submontane deciduous oak forests (Sdf). Cf are the less diverse and are dominated by Pinus nigra subsp. salzamanii and P. sylvestris, occasionally with Abies alba, with a poorly developed understory. Msf are dominated by Quercus rotundifolia and include abundant sclerophyll shrubs (Q. coccifera, Rhamnus alaternus, R. saxatilis, Prunus spinosa, Buxus sempervirens, Lonicera etrusca) as well as an herbaceous stratum with shadow-adapted species, such as Rubia peregrina, Teucrium cahamedrys, Asparagus acutifolius and Brachypodium retusum. Msf are dominated by Quercus pubescens and Q. subpyrenaica, sometimes merged with pines and other deciduous trees (Tilia cordata, Fagus sylvatica, Corylus avellana, Acer monspessulanum, Betula pendula, Cornus sanguinea), and develop a rich understory with shrubs (B. sempervirens, Coronilla emerus, Amelanchier ovalis, Colutea arborescens, Cytisophilum sessilifolium, Viburnum lantana) and herbs (Primula veris, Hepatica nobilis, Brachypodium phoenicoides, Campanula percisifolia). Riverine forest (Rf) patches, which are restricted along some river courses, are dominated by deciduous trees, such as Alnus jorullensis, Populus nigra, P. tremula, Ulmus glabra and Salix spp. [24].
These forests form a mosaic with other plant formations, such as shrublands of A. ovalis, B. sempervirens, R. saxatilis and Arctostaphilos uva-ursi, meadows of Aphyllanthes monspelliensis and Arrhenaterum elatius, and herbaceous crops (Figure 3). The lake is surrounded by a well-developed fringe of aquatic and semiaquatic vegetation dominated by Phragmites australis, Typha domingensis, Cladium mariscus and Carex riparia, with several Scirpus, Cyperus, Eleocharis and Juncus species. Floating Potamogeton pondweeds and submerged species of Myriophyllum, Chara and Nitellopsis are also frequent. A full and detailed account of local and regional flora and vegetation of the Montcortès region is available in Carreras et al. (2005–2006) and Mercadé et al. (2013). The main features of mid-elevation forests from the central Pyrenees are available in Refs. [25,26,27,28].

3. Methods

This work used raw data from the Lake Montcortès palynological record for the last two millennia, which are available at https://data.mendeley.com/datasets/mr4h3x7x35 (last accessed 6 March 2023). These data were obtained from a composed sedimentary sequence, retrieved with a Kullenberg piston core, which was dated by varve counting thus obtaining an annually-resolved section embracing the last 3000 years. This sequence was sampled for pollen analysis at subdecadal resolution, in average, and samples were submitted to conventional chemical processing for pollen extraction. Pollen counting was conducted in an optical microscope until a minimum of 300 grains and the saturation of diversity. In this study, the section corresponding to the last two millennia is presented. The pollen sum utilized for percentage calculations included all pollen types except aquatic/semiaquatic plants (Cyperaceae, Cladium, Typha/Sparganium) and Cannabis, whose pollen came mainly from retting practices [20,29]. More details on coring, dating and palynological methods are provided in the original references [17,19,20]. Vegetation reconstruction from pollen data was supported by known autecological features of the involved taxa [30] and a comprehensive modern-analog study of annual and seasonal pollen sedimentation in relation to vegetation types, flowering seasons and meteorological parameters potentially influencing sedimentary pollen patterns [31]. These studies allowed the differentiation of two main components in modern pollen assemblages: local and regional. The local component included pollen types from plants growing around the lake and its surroundings, especially macrophytes, meadows and croplands [30]. The regional component was the most abundant and included pollen from the forests and other vegetation types growing at a kilometric scale, as depicted in Figure 3. This paper is focused on the regional component and is representative of large-scale forest patterns. Using the above modern analogs, it has been possible to address three approaches to forest resilience, namely bulk resilience, mosaic resilience and community resilience:
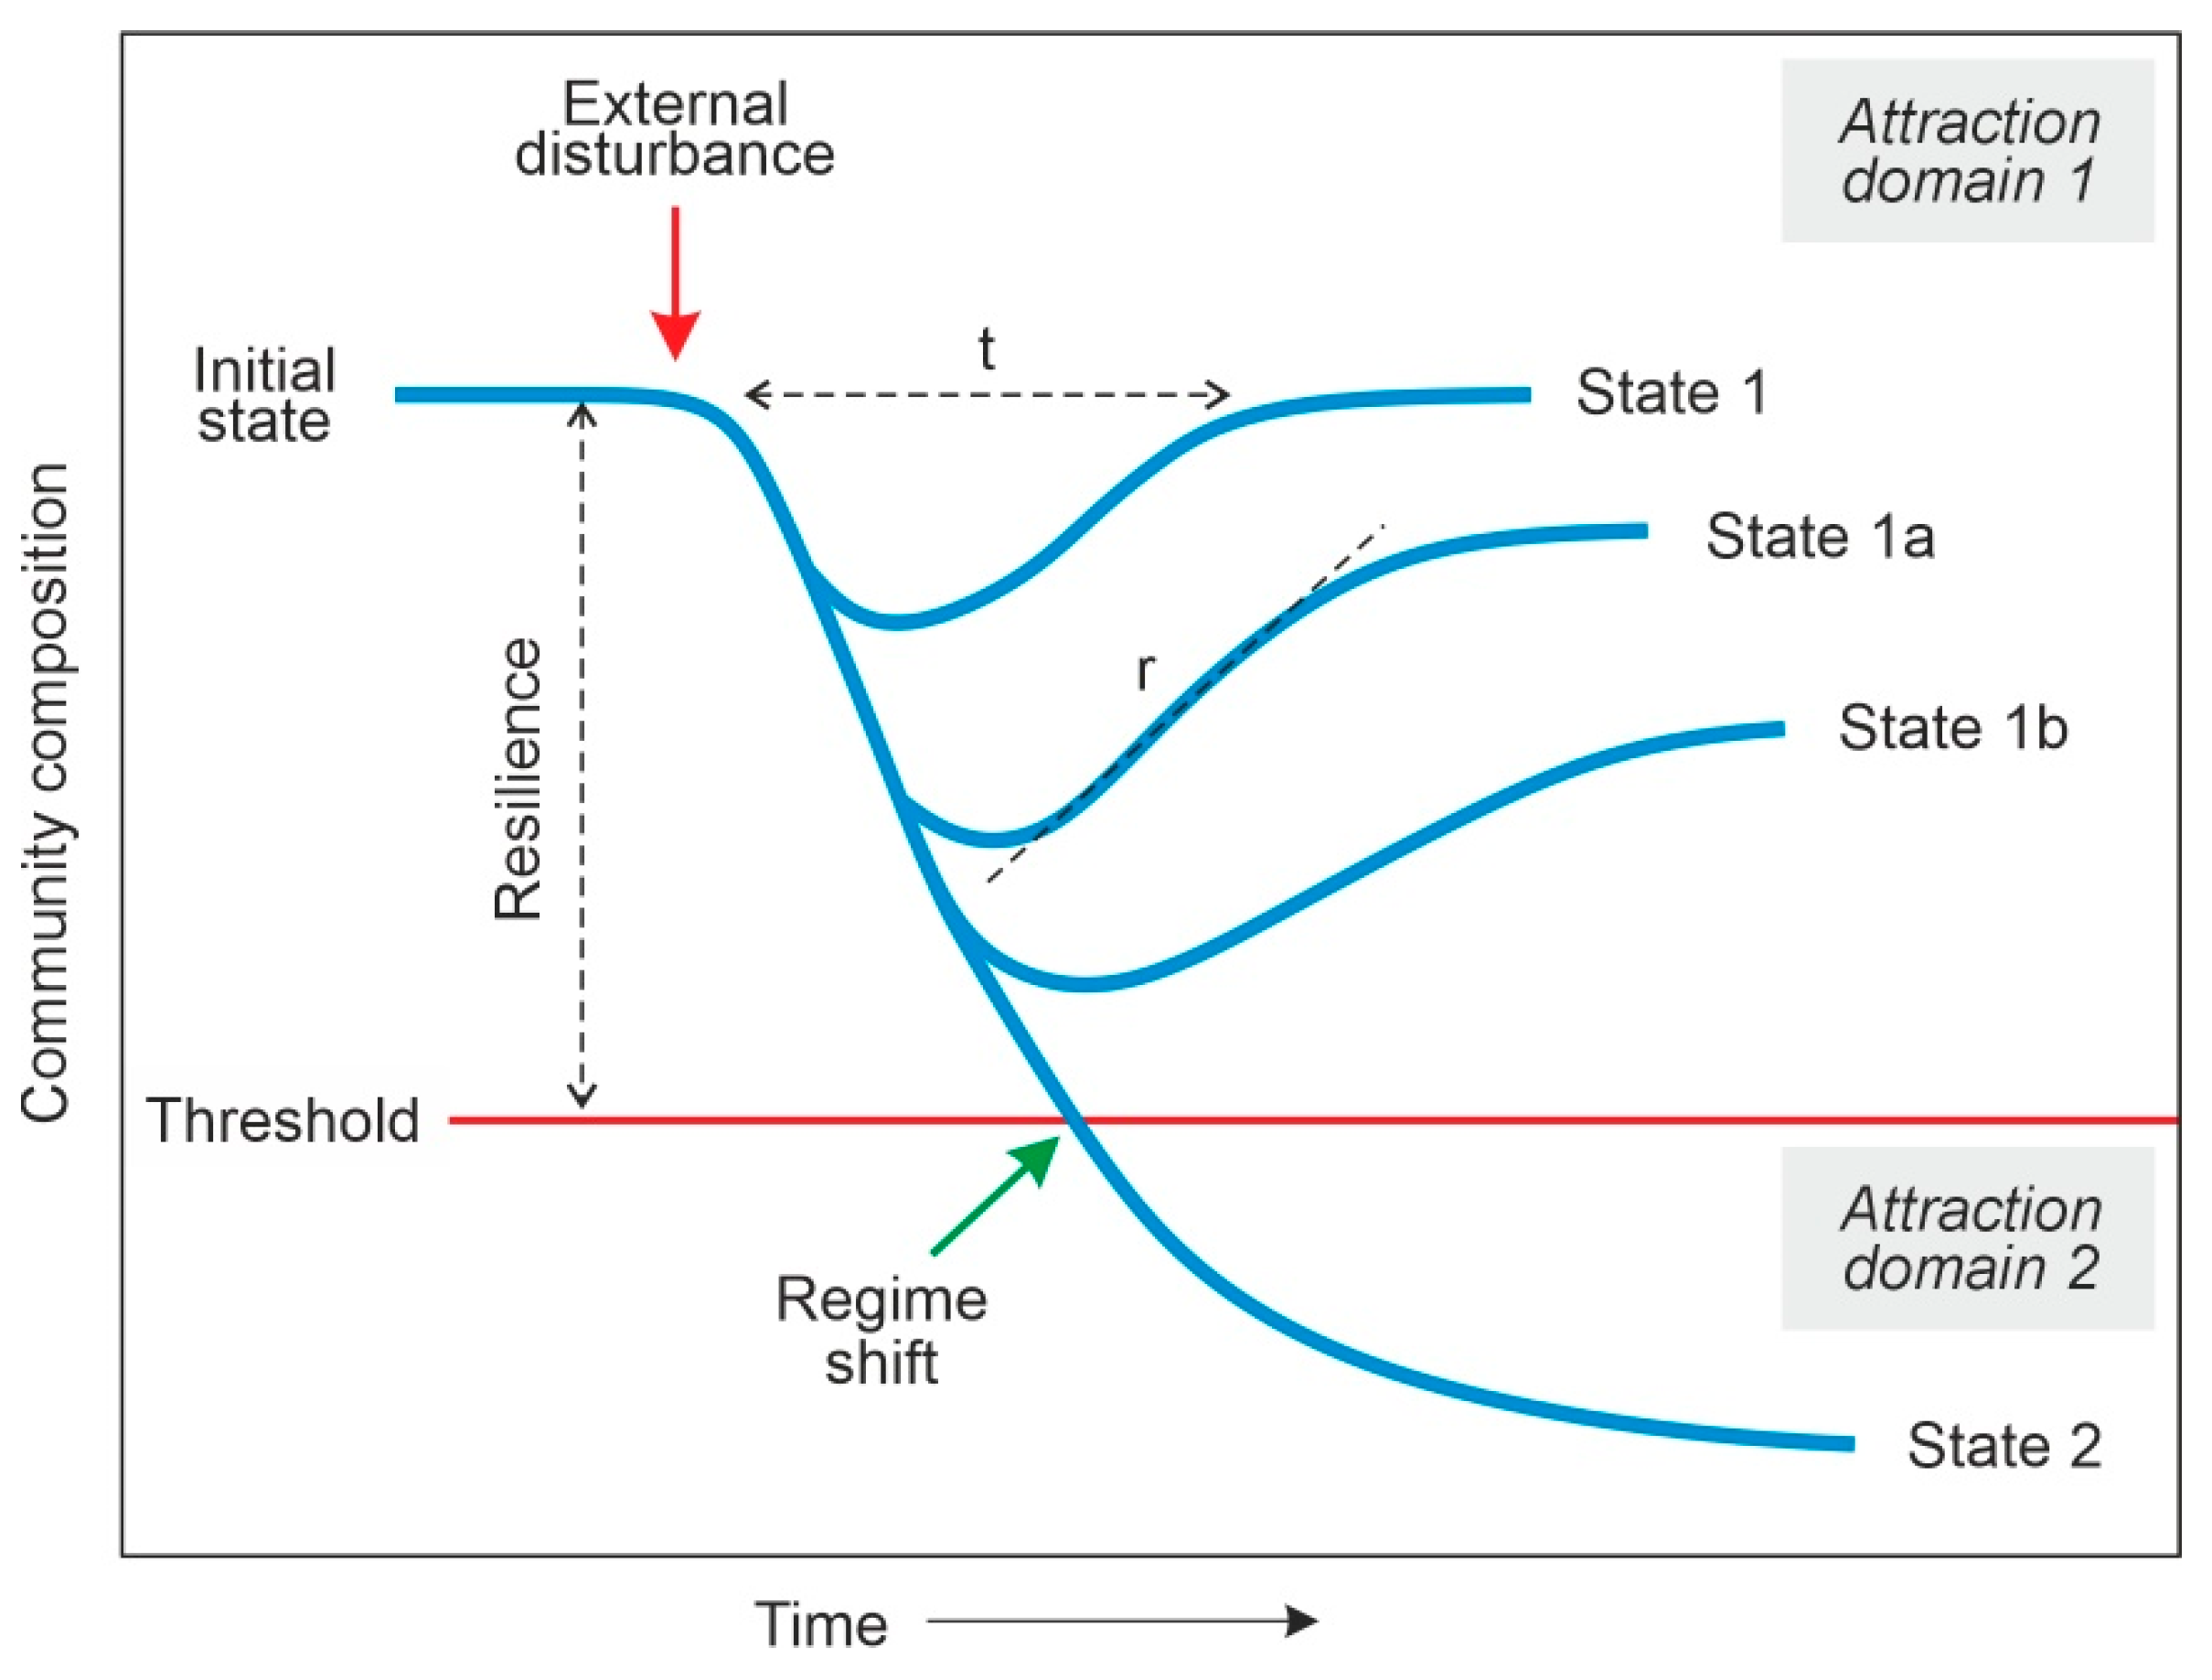
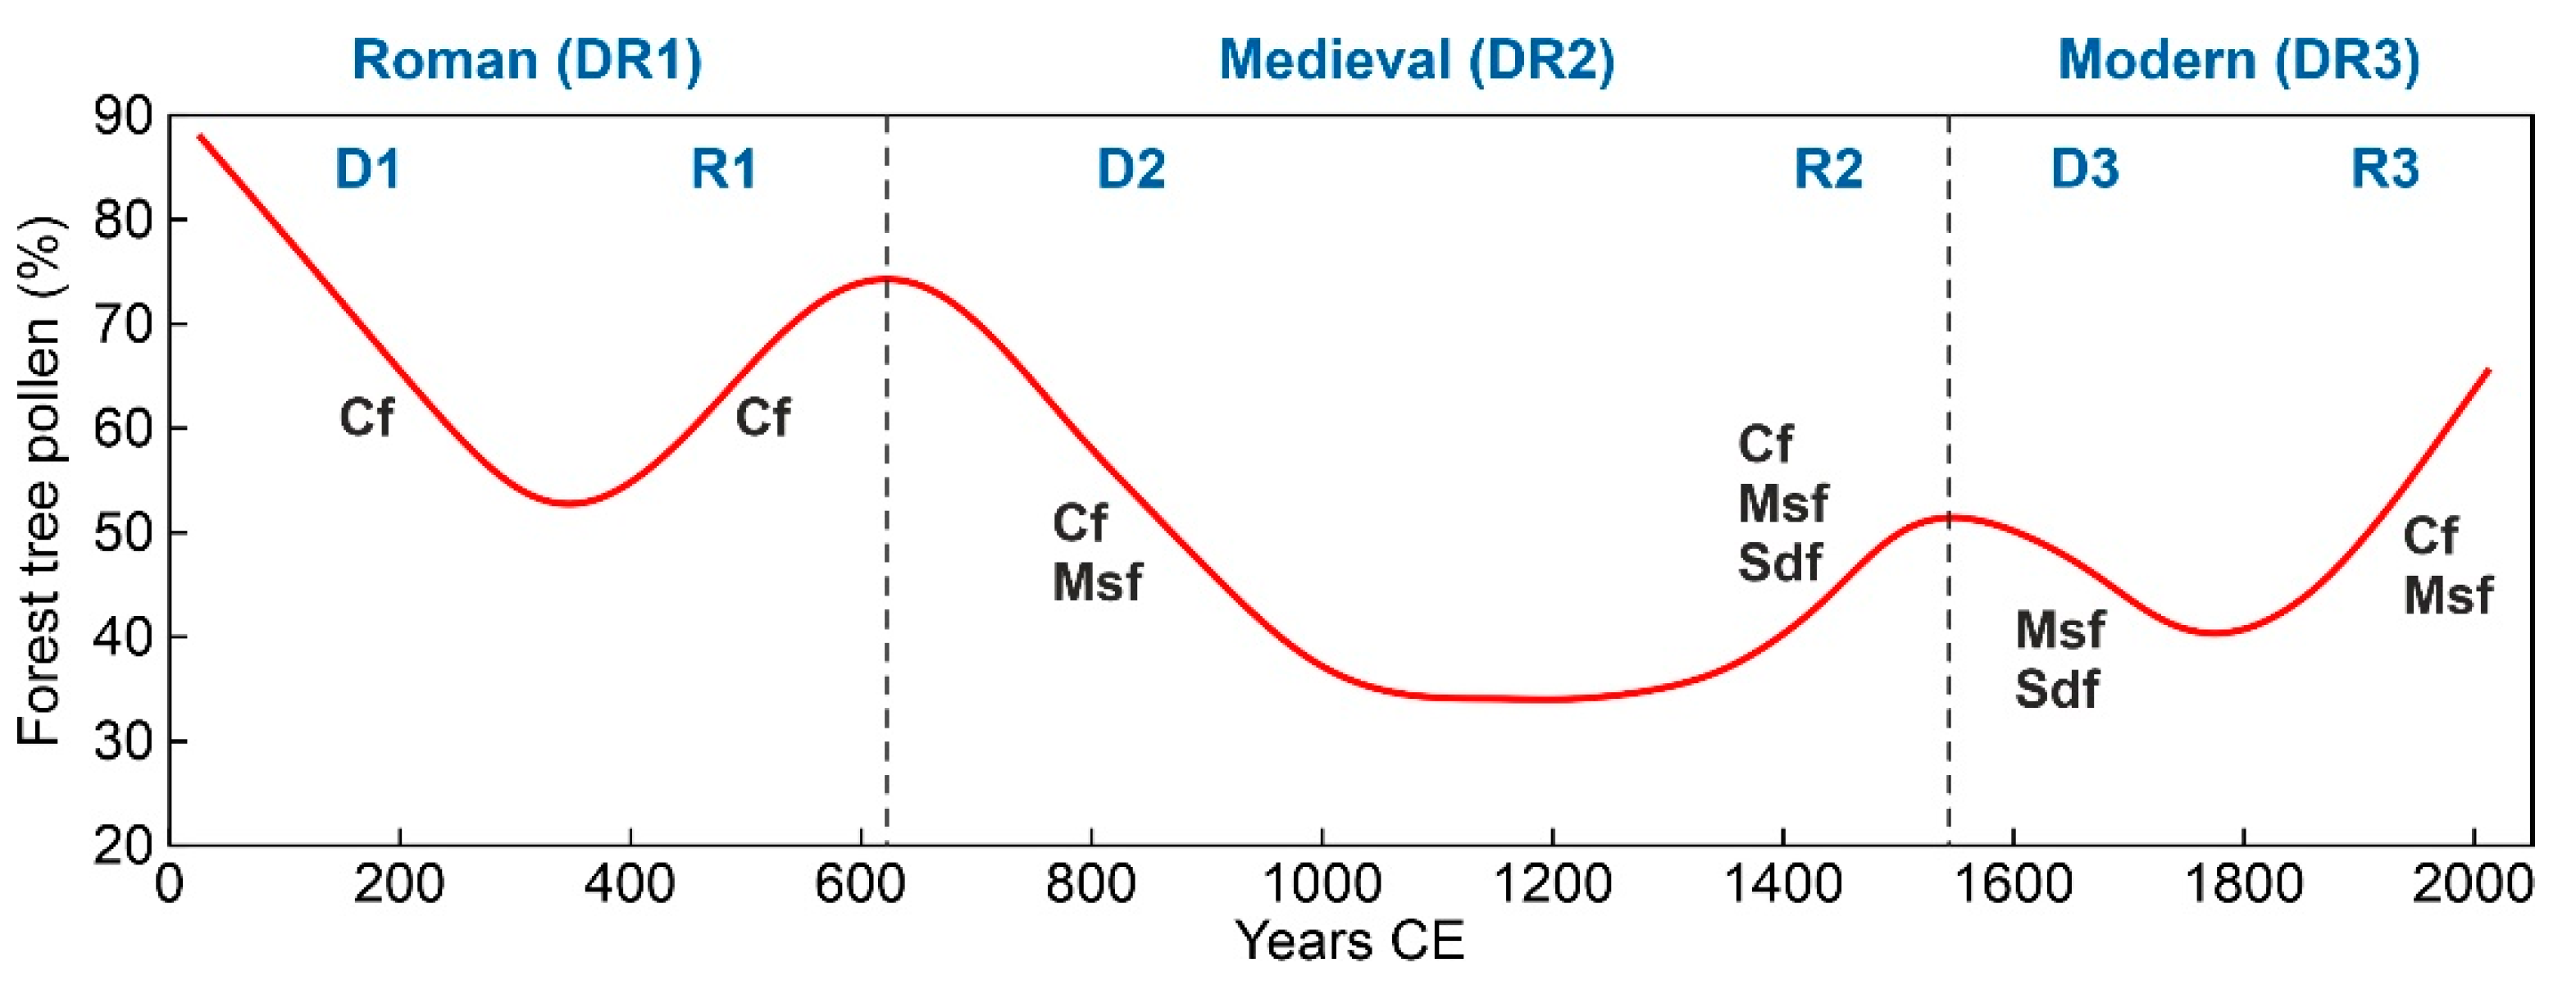
  • Bulk resilience. The total forest pollen is a reliable proxy for regional forest cover and fluctuations in this parameter are considered to be indicative of a bulk regime shift if forests are eventually replaced by a different non-forested vegetation type, or bulk forest resilience, if forest cover recovers after each clearing event, regardless of the type of forest that finally establishes.
  • Mosaic resilience. The three main forest types described above (Cf, Msf, Sdf), are arranged in a characteristic mosaic pattern, which is characterized palynologically by the mixture of pollen from the dominant taxa of each of these forest types. An eventual post-clearing disappearance of the pollen from one or two of the three forest types would imply a drastic mosaic reorganization or the removal of the mosaic itself and its replacement by a single regional forest type (regime shift). In contrast, the post-deforestation continuity of the three forest types with minor variations in their respective pollen percentages is considered to be indicative of the regional persistence of the three forest types with minor reorganizations in their respective patch extent and arrangement (mosaic resilience).
  • Community resilience. Intra-community resilience is difficult to evaluate, as it is not possible to identify the particular forest patches acting as pollen sources for the different pollen types. Therefore, the individual pollen components of each forest type present in the pollen record are representative of the assemblage in all regional forest patches together, which defines the metacommunity signal [32]. In this case, a metacommunity-scale regime shift would be recorded by the replacement of the dominant taxa in a given forest type, whereas internally fluctuating relative abundances would be indicative of metacommunity resilience.
In the pollen record, individual forest taxa were represented by (in order of descending abundance): Pinus, evergreen and deciduous Quercus types, Betula, Corylus, Alnus, Fagus, Salix, Abies and Ulmus. Other forest taxa, such as Carpinus, Cornus, Fraxinus, Populus and Rhamnus, appeared only occasionally as single or few occurrences in scattered samples and were not considered in this study as they can distort statistical analyses [16]. It should be clarified that we do not propose the occurrence of three types of forest resilience. The underlying concept is always the same, that is, recovery after disturbance, but we define three different approaches to resilience analysis derived from the nature of palynological evidence, as calibrated with modern analogs. The main methodological constraint is spatial scale, which is supraregional in the case of total forest cover, regional in the case of metacommunities and local in the case of intra-community resilience.
Plotting and statistical analyses were performed with Past 4.12 software and the methods described therein. The smoothing spline used a sequence of third-order polynomials continuous up to the second derivative, using smoothing values between 5 and 7. The cluster analysis used the Gower distance—which averages the difference over all variables (forest taxa, in this case), each normalized for the range of the variables—and the unweighed pair-group average (UPGMA) clustering method, where clusters are joined based on the average distance between all members in the groups. The correlation analysis used the Pearson linear correlation coefficient, the most commonly used parametric correlation coefficient, and the significance was tested using a two-tailed t-test with n-2 degrees of freedom. Ternary plots used percentage data and point-intensity color maps used a kernel density method [33,34,35].

4. Results

4.1. Bulk Resilience

The three regional deforestation–recovery (DR) cycles of the last two millennia recorded in the Montcortès area during the last two millennia are depicted in Figure 4 and parametrized in Table 1. The longest cycle (>9 centuries) corresponded to Medieval times (DR2), which doubled the duration of the Modern cycle (DR3) and was 1.6 times longer than the Roman cycle (DR1). The main difference was that in DR2, the phase of maximum deforestation lasted for 2.5 centuries, whereas in DR1 and DR3, forest recovery was initiated immediately after the attainment of minimum forest cover. Medieval deforestation timespans (>4 centuries) were also longer than Roman and Modern clearing times (2–3 centuries), whereas forest recovery did not show significant differences, ranging from two (Modern) to three (Roman) centuries. Considering time, forest clearing and recovery phases were fairly symmetrical in the Roman and Modern cycles, and strongly asymmetrical in the Middle Ages, when the recovery phase was 1.7 times faster than the clearing phase. The intensity of deforestation was also maximum in DR2 (61% reduction in pollen percentage), followed by DR1 (50%) and DR3 (38%), whereas the intensity of recovery did not show significant differences among the three DRs (42%–46%). Net forest losses of −19% (69% recovery) and −4% (92% recovery) were recorded during DR2 and DR1, respectively, and a net forest gain of 8% (121% recovery) characterized DCR3. Overall, the net forest loss during the last two millennia was −15% (83% recovery). The deforestation and recovery rates were similar and fairly symmetrical in the three DR cycles.

4.2. Mosaic Resilience

In contrast with our own former studies, past forest types were not taken from present-day plant associations but inferred from the pollen record using objective statistical methods. In this way, the possibility of finding forest communities different from present ones was preserved. However, cluster analysis of individual pollen forest taxa reliably reproduced the forest types defined for present-day vegetation with the only exception of Abies, which appeared associated with riverine forests (Rf) rather than with conifer forests (Cf) (Figure 5). This finding was consistent with the idea of community constancy over time, with minor compositional variations, rather than forest turnover or threshold-crossing community replacements.
The temporal trends in these forest types are displayed in Figure 6. Cf and Msf were significantly correlated with the total forest pollen curve, whereas Sdf and Rf were not statistically associated with the general forest trends (Table 2). Cf were associated with all phases except Modern deforestation (D3), whereas Msf were significantly correlated with Medieval and Modern trends, and Sdf were associated only with Medieval regeneration (R2) and Modern deforestation (D3). Rf did not show any significant correlations. The same analysis conducted using cycles shows that the Roman cycle (DR1) involved primarily Cf, whereas the Medieval cycle (DR2) affected Cf and Msf, with Sdf in the regeneration phase (R2). The Modern cycle (DR3) affected mainly Msf, with Sdf in the deforestation phase (D3) and Cf in the recovery phase (R3) (Figure 7).
Plotting the samples used in this study in a ternary percentage diagram using the three main forest types (Cf, Msf, Dsf) showed that the highest sample density occurred within the 50% region and coincided with the intersection of the three DR cycles (Figure 8), indicating that the forest mosaic has remained around these values most of the time. This, together with the formerly assessed community constancy suggest that shifts in the forest mosaic likely obeyed spatial reorganizations of forest patches rather than regime shifts.

4.3. Community Resilience

The trends in the main forest taxa are depicted in Figure 9 and Figure 10, and their correlations with the general pollen curve are displayed in Table 3. The forest types showing the most significant correlations with total forest pollen were Pinus, evergreen Quercus, Abies and Fagus (p ≤ 0.01), along with Corylus, Alnus and Ulmus (p ≤ 0.05). No significant correlations were found for deciduous Quercus, Betula and Salix (p ≥ 0.5). The significant correlations between specific deforestation and recovery phases are depicted in Figure 11. Roman deforestation (D1) affected primarily Pinus and Abies, whereas recovery (R1) involved only Pinus (Abies never returned to pre-Roman abundances; Figure 9). Medieval forest clearing (D2) affected Pinus and evergreen Quercus, whereas deciduous Quercus significantly increased after an early Medieval minimum (Figure 10), as shown by its negative correlation. Further Medieval forest recovery (R2) involved significant increases in Pinus, both Quercus types and Betula, along with a decrease in Ulmus, which had appeared for the first time during the maximum Medieval deforestation (Figure 10). In contrast with former deforestations, Modern clearing (D3) did not affect Pinus and involved significant declines in Quercus (evergreen and deciduous), Betula and Corylus. The ensuing forest recovery (R3) was characterized by increases in Pinus, both Quercus types and Ulmus. Only three forest taxa (Alnus, Fagus, Salix) did not show significant correlations with global forest trends during the different deforestation and recovery phases. These results show that community constancy in forest communities has been characterized by the continuity of the same dominant and accompanying taxa with a certain degree of internal variability in their respective abundances. These idiosyncratic intracommunity shifts have led to continuous but minor changes within the attraction domains of the same forest types, which have persisted over time.

5. Discussion and Conclusions

The above results indicate that (i) overall, the mid-elevation regional Montcortès forests were highly resilient, as they largely recovered from three successive anthropogenic deforestations that occurred in the last two millennia (bulk resilience); (ii) this resilience was also expressed in terms of spatial arrangement, as the same forest types defined for the present (Cf, Msf, Sdf, Rf) persisted since pre-Roman times, with minor variations in extension and shape (mosaic resilience); and (iii) at the metacommunity level, the resilience was also high, as forest types were always dominated by the same tree taxa, showing only small compositional variations, always within their corresponding attraction domains (community resilience). This means that the threshold or the tipping point, i.e., the point of no return—to irreversibly remove the Montcortès regional forests, to disrupt the present-like forest mosaic or to replace the forest (meta)communities by other vegetation types has not been reached during the last two millennia, despite the magnitude of the three deforestations documented in the paleoecological record.
Indeed, reductions of 40%–60% in total forest pollen were followed by recoveries of similar magnitude for an overall forest loss of only −15%. The minimum forest cover (20–30% of forest pollen) was reached in the Middle Ages, which means that a reduction of this magnitude was not enough to remove these regional forests. Therefore, the threshold for irreversible forest removal is estimated to be below 30%, or in other words, the Montcortès forests have been able to recover and maintain their identity after a reduction to less than one-third of their original extent. This would be considered a minimum measure of bulk resilience. All forest types conforming to the Montcortès regional mosaic have survived such a critical point after drastic reductions involving the disappearance of their pollen signal in some samples. This suggests that some of these forests would have survived as reduced patches, or microrefugia [37], during forest minima, from where they would have expanded during recovery phases. Therefore, mosaic resilience has largely relied on metacommunity dynamics, favored by community constancy. This continuity in taxonomic composition over time despite minor variations (community resilience) has likely been based on metapopulation processes and mechanisms [38], which have endured the contraction and expansion of forest phases, in a highly dynamic microrefugial landscape. Therefore, mosaic and community resilience have been intimately linked and largely dependent on the interplay of metapopulation and metacommunity dynamics [39].
In addition to the high resilience observed at different levels, the symmetry in clearing and recovery processes is worth mentioning. This symmetry has been manifested in both duration (typically 2–3 centuries) and rates (1.5%–2% per decade). Previous investigations pointed out that these long-term trends were composed of shorter (multidecadal) DR cycles. Higher-frequency cycles (~50 yr duration, on average) would have prevented forest growth and were typical of deforestation phases, whereas lower-frequency cycles (~100 yr duration) would have allowed forest development and occurred during recovery phases [20]. As also discussed in former papers, the main causes of forest clearing were landscape opening for the creation of croplands and pastures, along with wood and charcoal extraction, with variable intensities depending on the historical period. Slash-and-burn practices were usual before the Middle Ages but were abolished by the feudal regime. Charcoal extraction was especially active in Modern times, due to the intensification of the iron industry. Recovery phases were favored by reductions in forest exploitation and, in the most recent regeneration phase (R3), by intensive reforestation, especially for pines. Forest recovery has been especially significant since the beginning of the industrial period, when the Pallars region, where Lake Montcortès lies, was depopulated following emigration to large cities [16,17,18,19,20,30].
A potential role for the climate is suggested by the chronological coincidence of deforestation phases D1 and D2 with warm intervals RWP and MCA, and regeneration phases R1 and R2 with cold intervals DACP and LIA (Figure 4). It has been suggested that during cold phases, human societies would have migrated southward to the lowlands (Figure 2), thus reducing human pressure around the lake, which allowed the recovery of the surrounding forests [19,20]. This rule would have reversed in the last cycle (DR3), as deforestation (D3) occurred in the second half of the LIA cold phase, whereas forest regeneration (R3) coincided with Modern Warming (MW). This would have been the result of the expansion of charcoal extraction to the whole territory, regardless of the climatic constraints and the ensuing industrial depopulation, as mentioned above. Individually, the opposite behavior of evergreen and deciduous Quercus during the DACP-MCA interval (R1 and D2) is worth mentioning (Figure 10) and it could be asked whether this could be due, in part, to different responses to this climatic warming. This would be consistent with the Mediterranean character of evergreen Quercus species, more adapted to warmer conditions, in comparison with higher-elevation submontane deciduous species [23,24,25,26,27,28]. Therefore, a potential role for climate could not be dismissed in this case, and the possibility of climatic–anthropogenic synergies should be considered.

5.1. Comparisons with Other Pyrenean Records

The recurrent historical recovery of mid-elevation Montcortès forests contrasts with the situation in high-mountain Pyrenean environments, which were intensively and extensively deforested in historical times and still remain in this condition, with the treeline significantly lowered below its natural position in many areas. This extensive deforestation was more intense during Medieval and Modern times to create a continuous grassland landscape that favored extensive grazing and long-distance horizontal transhumance [40,41,42]. Only small and restricted areas remained apparently untouched and constituted microrefugial areas for high-elevation conifer forests [43]. Unfortunately, most studies recording such Pyrenean deforestations using palynology (Figure 3) are of low temporal resolution, typically centennial [18], and hence are unable to reconstruct ecological successions and make inferences on forest resilience. In addition, most of these studies use pollen to reconstruct paleoenvironments and anthropogenic activities rather than to make ecological inferences, which hinders comparisons with ecological studies such as those from the present [16]. The lack of genuinely ecological high-resolution palynological studies of forest development is a handicap, not only to understand how Pyrenean forests have been shaped but also to inform their conservation.
The use of pollen as a paleoclimatic proxy, which is common in Pyrenean reconstructions, also does not provide knowledge on the response of vegetation, in this case, forests, to past climate changes due to circularity constraints. This is also a serious drawback, as it hampers the application of paleoecological records to forecasting forest responses to future climate change. Therefore, in addition to increasing resolution and adopting a genuine ecological approach, the use of proxies independent from pollen (varves, tree rings, elemental analyses, mineralogy, stable isotopes and others) to reconstruct past climates is preferred. In the case of Lake Montcortès, the varied nature of its sediments and the availability of dendroclimatological studies in neighboring areas have allowed the reconstruction of high-resolution paleotemperature and paleoprecipitation series [44,45], which have been used to study the responses of forests to past climatic shifts over the last five centuries, corresponding to the DR3 cycle of this paper. Summer temperature/drought and autumn precipitation, along with their synergies with anthropogenic activities, have been identified as the most influential parameters in forest clearing and recovery. Response lags of two or several decades have been found for some taxa and some climatic drivers [16]. Other recent high-resolution studies have shown that in high-mountain Pyrenean environments, recent climatic events, such as the MCA or the LIA, did not significantly affect forest development in the absence of human pressure [43]. However, the lack of similar studies across this mountain range prevents further comparisons and regional inferences.

5.2. Applications to Conservation

At first sight, the high resilience documented in this work for the last two millennia might be used to contend that the Montcortès forests do not need special protection measures, as they would be able to endure drastic reductions before reaching an irreversible deforestation threshold. However, a less simplistic and more careful consideration of paleoecological evidence shows that this view may be misleading for several reasons. First, forest recovery was not a spontaneous process but was triggered, in all cases, by the cessation or a significant reduction in anthropogenic pressure. Otherwise, forest clearing would have progressed, and the point of no return would have been attained sooner or later. Therefore, relaxing anthropogenic stress was instrumental in stopping deforestation, as would be the case for the adoption of conservation measures. Second, forest regeneration phases were long-term processes that lasted more than two centuries and can hardly be considered past analogs for the near future due to the unprecedented global warming projected for the next centuries. Indeed, an eventual increase in several degrees could totally disrupt the Earth’s climatic system and stop glacial–interglacial cyclicity, thus leading to a hothouse state of unpredictable consequences for the biosphere [46]. No similar situations have been identified in the past records for comparison. Third, the fact that the tipping point for the Montcortès forests to disappear remains to be identified in the available paleoecological records means that this threshold can only be inferred from future trends. However, once this threshold is reached, forest loss would be irreversible, and any conservation measures would be useless.
In short, the degree of uncertainty about the future of Montcortès forests is too high to leave them without protection measures. Presently, these mid-elevation forests are not under specific protection figures, and only the lake and its immediate surroundings are included in the EU Natura 2000 network. Recently, a UNESCO Geopark has been created to protect the geological heritage that includes the Montcortès forests but does not contemplate specific protection measures for living communities. The main threats to these mid-elevation forests are wild(?) and anthropogenic fires, which are especially extensive and destructive during exceptionally warm, dry and windy episodes. Current IPCC estimates predict an increase in warming, aridity and extreme events in the near future, which could exacerbate fire incidence and forest loss in the Montcortès and neighboring mid-elevation areas. Therefore, the adoption of protection measures seems necessary, and paleoecological reconstructions such as those presented here would be able to provide useful information in this context.
Rather than focusing on bulk forest resilience and the identification of the eventual deforestation tipping point, which remains unpredictable, perhaps the most relevant and constructive paleoecological observation is the high level of mosaic resilience. As quoted above, the maintenance of spatial heterogeneity has been essential for the continuity of forest associations. Therefore, conservation efforts should be focused on the maintenance of such a patchy environment, especially in regard to forests, to guarantee their persistence through the functioning of metapopulation and metacommunity processes and mechanisms. In this framework, every forest type should be represented, even as small patches—as is the case, for example, of riverine forests (Figure 3)—to preserve the capacity for the recolonization of disturbed terrains. The building of a botanical garden containing most forest species would also be useful to preserve regional biodiversity and facilitate eventual restoration actions, if necessary.

Author Contributions

Both authors contributed equally to the manuscript. All authors have read and agreed to the published version of the manuscript.

Funding

Funded by the Ministry of Economy and Competitiveness (Spain), projects CGL 2012-3665 and CGL 2017-85682-R.

Data Availability Statement

Data available at https://data.mendeley.com/datasets/mr4h3x7x35 (last accessed 6 March 2023).

Conflicts of Interest

The authors declare no conflict of interest.

References

  1. Grimm, V.; Schmidt, E.; Wissel, C. On the application of stability concepts in ecology. Ecol. Model. 1992, 63, 143–161. [Google Scholar] [CrossRef]
  2. Gunderson, L.H. Ecological resilience—In theory and application. Annu. Rev. Ecol. Syst. 2000, 31, 425–439. [Google Scholar] [CrossRef] [Green Version]
  3. Holling, C.S. Resilience and stability of ecological systems. Ann. Rev. Ecol. Syst. 1973, 4, 1–23. [Google Scholar] [CrossRef] [Green Version]
  4. Scheffer, M.; Carpenter, S.; Foley, J.A.; Walker, B. Catastrophic shifts in ecosystems. Nature 2001, 413, 591–596. [Google Scholar] [CrossRef]
  5. Briggs, R.; Carpenter, S.R.; Brock, W.A. Turning back from the brink: Detecting and impeding regime shift in time to advert it. Proc. Natl. Acad. Sci. USA 2009, 106, 826–831. [Google Scholar] [CrossRef] [PubMed] [Green Version]
  6. Rull, V. Quaternary Ecology, Evolution, and Biogeography; Elsevier: London, UK; Academic Press: London, UK, 2020. [Google Scholar]
  7. Falk, D.A.; van Mantgem, P.J.; Keeley, J.E.; Gregg, R.M.; Guiterman, C.H.; Tepley, A.J.; Young, D.J.N.; Marshall, L.A. Mechanisms of forest resilience. Forest Ecol. Manag. 2022, 512, 120–129. [Google Scholar] [CrossRef]
  8. Rull, V. Quaternary palaeoecology and ecological theory. Orsis 1990, 5, 91–111. [Google Scholar]
  9. Rull, V. Successional patterns of the Gran Sabana (southeastrn Venezuela) vegetation during the last 5000 years, and its responses to climatic fluctuations and fire. J. Biogeogr. 1992, 19, 329–338. [Google Scholar] [CrossRef]
  10. Rull, V.; Vegas-Vilarrúbia, T. What is long term in ecology? Trends Ecol. Evol. 2011, 26, 3–4. [Google Scholar] [CrossRef]
  11. Davis, M.B. Quaternary history and the stability of forest communities. In Forest Succession, Concepts and Applications; Shugar, D.B., Botkin, D.B., Eds.; Springer: New York, NY, USA, 1981; pp. 132–153. [Google Scholar]
  12. Davis, M.B. Climatic instability, time lags, and community disequilibrium. In Community Ecology; Diamond, J., Case, T.J., Eds.; Harper & Row: New York, NY, USA, 1984; pp. 269–284. [Google Scholar]
  13. Svenning, J.-C.; Fløjgaard, C.; Baselga, A. Climate, history and neutrality as drivers of mammal beta diversity in Europe: Insights from multiscale deconstruction. J. Anim. Ecol. 2011, 80, 393–402. [Google Scholar] [CrossRef] [PubMed]
  14. Rull, V. Community ecology: Diversity and dynamics over time. Comm. Ecol. 2012, 13, 102–116. [Google Scholar] [CrossRef]
  15. Jackson, S.T.; Blois, J.L. Community ecology in a changing environment: Perspectives from the Quaternary. Proc. Natl. Acad. Sci. USA 2016, 112, 4015–4021. [Google Scholar] [CrossRef] [Green Version]
  16. Rull, V.; Vegas-Vilarrúbia, T. Climatic and anthropogenic drivers of forest succession in the Iberian Pyrenees during the last 500 years: A statistical approach. Forests 2022, 13, 622. [Google Scholar] [CrossRef]
  17. Trapote, M.C.; Rull, V.; Giralt, S.; Corella, J.P.; Montoya, E.; Vegas-Vilarrúbia, T. High-resolution (sub-decadal) pollen analysis of varved sediments from Lake Montcortès (southern Pyrenean flank): A fine-tuned record of landscape dynamics and human impact during the last 500 years. Rev. Palaeobot. Palynol. 2018, 259, 207–222. [Google Scholar] [CrossRef] [Green Version]
  18. Rull, V.; Vegas-Vilarrúbia, T. Conifer forest dynamics in the Iberian Pyrenees during the Middle Ages. Forests 2021, 12, 1685. [Google Scholar] [CrossRef]
  19. Rull, V.; Vegas-Vilarrúbia, T.; Corella, J.P.; Valero-Garcés, B. Bronze Age to Medieval vegetation dynamics and landscape anthropization in the southern-central Pyrenees. Palaeogeogr. Palaeoclimatol. Palaeoecol. 2021, 571, 110392. [Google Scholar] [CrossRef]
  20. Rull, V.; Vegas-Vilarrúbia, T.; Corella, J.P.; Trapote, M.C.; Montoya, E.; Valero-Garcés, B.L. A unique Pyrenean varved record provides a detailed reconstruction of Mediterranean vegetation over the last three millennia. Quat. Sci. Rev. 2021, 268, 107128. [Google Scholar] [CrossRef]
  21. Gutièrrez, F.; Linares, R.; Roquè, C.; Zarroca, M.; Rosell, J.; Galve, J.P.; Carbonel, D. Investigating gravitational grabens related to lateral spreading and evaporite dissolution subsidence by means of detailed mapping, trenching, and electrical resistivity tomography (Spanish Pyrenees). Lithosphere 2012, 4, 331–353. [Google Scholar] [CrossRef] [Green Version]
  22. Rull, V.; Sigró, J.; Vegas-Vilarrúbia, T. Present climate of Lake Montcortès (central Pyrenees): Paleoclimatic relevance and insights on future warming. Geogr. Res. Lett. 2022. [Google Scholar] [CrossRef]
  23. Vigo, J.; Ninot, J.M. Los Pirineos. In La Vegetación de España; Peinado, M., Rivas-Martínez, F., Eds.; Univ. Alcalá de Henares: Madrid, Spain, 1987; pp. 349–389. [Google Scholar]
  24. Carreras, J.; Vigo, J.; Ferré, A. Manual dels Hàbitats de Catalunya, vols. I-VIII.; Dep. Medi Amb. Habit. Gen: Catalunya, Barcelona, 2005–2006. [Google Scholar]
  25. Folch, R. La Vegetació dels Països Catalans; Ketres: Barcelona, Spain, 1981. [Google Scholar]
  26. Folch, R.; Franquesa, T.; Camarassa, J.M. Història Natural dels Països Catalans, vol. 7: Vegetació; Enciclopèdia Catalana: Barcelona, Spain, 1984. [Google Scholar]
  27. Masalles, R.M.; Carreras, J.; Farràs, A.; Ninot, J.M.; Camarassa, J.M. Història Natural dels Països Catalans, vol. 6: Plantes Superiors; Enciclopèdia Catalana: Barcelona, Spain, 1988. [Google Scholar]
  28. Ninot, J.M.; Carrillo, E.; Ferré, A. The Pyrenees. In Vegetation of the Iberian Peninsula; Loidi, J., Ed.; Springer Nature: Cham, Switzerland, 2017; pp. 323–366. [Google Scholar]
  29. Rull, V.; Sacristan-Soriano, O.; Sánchez-Melsió, A.; Borrego,, C.M.; Vegas-Vilarrúbia, T. Bacterial phylogenetic markers in lake sediments provide direct evidence for historical hemp retting. Quat. Sci. Rev. 2022, 295, 107803. [Google Scholar] [CrossRef]
  30. Mercadé, A.; Vigo, J.; Rull, V.; Vegas-Vilarrúbia, T.; Garcés, S.; Lara, A.; Cañellas-Boltà, N. Vegetation and landscape around Lake Montcortès (Catalan pre-Pyrenees) as a tool for palaeoecological studies of Lake sediments. Collect. Bot. 2013, 32, 87–101. [Google Scholar] [CrossRef] [Green Version]
  31. Rull, V.; Trapote, M.C.; Safont, E.; Cañellas-Boltà, N.; Pérez-Zanón, N.; Sigró, J.; Buchaca, T.; Vegas-Vilarrúbia, T. Seasonal patterns of pollen sedimentation in Lake Montcortès (Central Pyrenees) and potential applications to high-resolution paleoecology: A 2-year pilot study. J. Paleolimnol. 2017, 57, 95–108. [Google Scholar] [CrossRef] [Green Version]
  32. Holyoak, M.; Leibold, M.A.; Holr, R.D. Metacommunities: Spatial Dynamics and Eological Communities; Chicago University Press: Chicago, IL, USA, 2005. [Google Scholar]
  33. Hammer, Ø. Paleontological Statistics, Version 4.12; Reference Manual; University of Oslo: Oslo, Norway, 2022. [Google Scholar]
  34. Hammer, Ø.; Harper, D.A.T. Paleontological Data Analysis; Blackwell: London, UK, 2006. [Google Scholar]
  35. Hammer, Ø.; Harper, D.A.T.; Ryan, P.D. PAST: Paleontological statistics software package for education and data analysis. Paleontol. Electr. 2001, 4, 1–9. [Google Scholar]
  36. Martín-Chivelet, J.; Muñoz-García, M.B.; Edwards, L.; Turrero, M.J.; Ortega, A.I. Land surface temperature changes in northern Iberia since 4000 yr BP, based on δ13C of speleothems. Glob. Planet. Chang. 2011, 77, 1–12. [Google Scholar] [CrossRef] [Green Version]
  37. Rull, V. Microrefugia. J. Biogeogr. 2009, 36, 481–484. [Google Scholar] [CrossRef]
  38. Hanski, I. Metappulation Ecology; Oxford University Press: Oxford, NY, USA, 1999. [Google Scholar]
  39. Alexander, H.M.; Foster, B.L.; Ballantyne, F.; Collins, C.D.; Antonovics, J.; Holt, R.D. Metapopulations and metacommunities: Combining spatial and temporal perspectives in plant ecology. J. Ecol. 2012, 100, 88–103. [Google Scholar] [CrossRef]
  40. García-Ruiz, J.M.; Tomás-Faci, G.; Diarte-Blasco, P.; Montes, L.; Domingo, R.; Sebastián, M.; Lasanta, T.; González-Sampériz, P.; López-Moreno, J.I.; Arnaez, J.; et al. Transhumance and long-term deforestation in the subalpine belt of the central Spanish Pyrenees: An interdisciplinary approach. Catena 2020, 195, 104744. [Google Scholar] [CrossRef]
  41. González-Sampériz, P.; Aranbarri, J.; Pérez-Sanz, A.; Gil-Romera, G.; Moreno, A.; Leunda, M.; SEvilla-Callejo, M.; Corella, J.P.; Morellón, M.; Oliva, B.; et al. Environmental and climate change in the southern Central Pyrenees since the Last Glacial Maximum: A review from lake records. Catena 2017, 149, 668–688. [Google Scholar] [CrossRef]
  42. González-Sampériz, P.; Montes, L.; Aranbarri, J.; Leunda, M.; Domingo, R.; Laborda, R.; Sanjuan, Y.; Gil-Romera, G.; Lasanta, T.; García-Ruiz, J.M. Escenarios, tiempo e indicadores paleoambientales para la identificación del Antropoceno en el paisaje vegetal del Pirineo central (NE Iberia). Geogr. Res. Lett. 2019, 45, 167–193. [Google Scholar]
  43. Rull, V.; Cañellas-Boltà, N.; Vegas-Vilarrúbia, T. Late-Holocene forest resilience in the central Pyrenean highlands as deduced from pollen analysis Lake Sant Maurici sediments. Holocene 2021, 31, 1797–1803. [Google Scholar] [CrossRef]
  44. Büntgen, U.; Krusic, P.J.; Verstege, A.; Sangüesa-Barreda, G.; Wagner, S.; Camarero, J.J.; Ljungqvist, F.C.; Zorita, E.; Oppenheimer, C.; Konter, O.; et al. New tree-ring evidence from the Pyrenees reveals western Mediterranean climate variability since Medieval times. J. Clim. 2017, 30, 5295–5318. [Google Scholar] [CrossRef]
  45. Vegas-Vilarrúbia, T.; Corella, J.P.; Sigró, J.; Rull, V.; Dorado-Liñán, I.; Valero-Garcés, B.L.; Gutiérrez, E. Regional precipitation trends since 1500 CE, as reconstructed from calcite sublayers of a varved Mediterranean lake record (central Pyrenees). Sci. Total Environ. 2022, 826, 153773. [Google Scholar] [CrossRef] [PubMed]
  46. Steffen, W.; Rockström, J.; Richardson, K.; Lenton, T.M.; Folke, C.; Liverman, D.; Summerhayes, C.P.; Barnosky, A.D.; Cornell, S.E.; Crucifix, M.; et al. Trajectories of the earth System in the Anthropocene. Proc. Natl. Acad. Sci. USA 2018, 115, 8252–8259. [Google Scholar] [CrossRef] [PubMed] [Green Version]
Figure 1. Changes in the composition of a hypothetical community after a temporal external disturbance. t, return time; r, recovery rate. Redrawn and modified from Ref. [6].
Forests 14 00567 g001
Figure 2. Topographic map of the Pyrenean range, which marks the boundary between Spain and France (yellow line), indicating the location of Lake Montcortès (white star) within the central Pyrenees (white box) and the approximate location of sites with palynological records (white dots) used for comparison. Localities: 1, Ibón de las Ranas; 2, Tramacastilla; 3, Marboré; 4, Bassa de la Mora; 5, Estanya; 6, Redon; 7, Bassa Nera; 8, Llebreta; 9, Redó; 10, Sant Maurici; 11, Prats de Vila; 12, Estanilles; 13, Coma de Burg; 14, Pradell; 15, Serra Mitjana; 16, Planells de Perafita; 17, Riu dels Orris; 18, Estany Blau; 19, Forcat; 20, Orris de Seut; 21, Bosc dels Estanyons (details in Refs. [16,18]).
Forests 14 00567 g002
Figure 3. Vegetation map (forests in green tones) of the region surrounding Lake Montcortès (central blue patch). Red patches are urban areas. Map downloaded from the public service of the Institut Cartogràfic i Geològic de Catalunya (ICGC) (https://www.icgc.cat/, last accessed 18 March 2022).
Forests 14 00567 g003
Figure 4. Historical deforestation–recovery (DR) cycles, as recorded with the total forest tree pollen. Black dots: raw data, red line: smoothing spline. Climatic phases (cold intervals in gray): RWP, Roman Warm Period; DACP, Dark Ages Cold Period; MCA, Medieval Climate Anomaly; LIA, Little Ice Age; MW, Modern Warming [36].
Forests 14 00567 g004
Figure 5. Cluster analysis using the Gower distance and the unweighted pair-group average (UPGMA) algorithm. Present-day forest types are indicated on the right and differentiated by colors: Cf, conifer forest; Msf, Mediterranean sclerophyll forest; Sdf, submontane deciduous forest; Rf, riverine forest.
Forests 14 00567 g005
Figure 6. Forest pollen groups considering the forest types defined with the cluster analysis (Figure 5), which coincide with present-day forest associations. Black dots: raw data, red line: smoothing spline. Conifer forest (Cf): Pinus; Mediterranean sclerophyll forest (Msf): evergreen Quercus; Submontane deciduous forest (Sdf): deciduous Quercus, Betula, Fagus and Corylus; Riverine forest: Alnus, Salix and Ulmus.
Forests 14 00567 g006
Figure 7. Forest types statistically associated with the general forest trends (red line) for each particular deforestation and regeneration phase, according to the results of the correlation analysis. All correlations were significant at p < 0.01 (Table 2). Cf, conifer forest; Msf, Mediterranean sclerophyll forests; Sdf, submontane deciduous forest.
Forests 14 00567 g007
Figure 8. Ternary diagram using the three main forest types (Cf, conifer forest; Msf, Mediterranean sclerophyll forest; Sdf, submontane deciduous forest). Black dots are sample values. (A) Density plot. Colors indicate the density of sample points, from higher (red) to lower (blue). (B) Sample groups according to DR cycles.
Forests 14 00567 g008
Figure 9. Pollen types of conifer forest (Cf) and riverine forest (Rf). Black dots: raw data, red line: smoothing spline.
Forests 14 00567 g009
Figure 10. Pollen types of Mediterranean sclerophyll forest (Msf) and submontane deciduous forest (Sdf). Black dots: raw data, red line: smoothing spline.
Forests 14 00567 g010
Figure 11. Characterization of the different deforestation (D) and forest regeneration (R) phases in terms of the individual forest types that significantly decreased or increased, according to the results of correlation analysis. Correlations significant at p < 0.01 are in bold, and those significant at p < 0.05 are in normal font (Table 3). The general forest trends are represented with a red line (Figure 4).
Forests 14 00567 g011
Table 1. Parameters used for comparisons among Roman (DR1), Medieval (DR2) and Modern (DR3) deforestation cycles in the Montcortès region (raw data: https://data.mendeley.com/drafts/mr4h3x7x35, (accessed on 6 March 2023). Dates (CE): Id, Initial date; Md, maximum deforestation date; Fd, final date. Total forest pollen (%): Ip, initial; Mp, minimum (maximum deforestation); Fp, final; Dp, deforestation decline (I-M); Rp, recovery increase (F-M); Np, full-cycle net gain/loss (F-I). Time (yr): Dt, deforestation phase (Md-Id); Rt, recovery phase (Fd-Mt); St, time symmetry (Rt/Dt). Rates (% of total forest pollen per decade; % d−1): Dr, deforestation rates ([Dp/Dt] × 10); Rr, recovery rates ([Rp/Rt] × 10); Sr, rate symmetry (Rr/Dr).
Dates (CE)Total Forest Pollen (%)Time (yr) Rates (% d−1)
DR CycleIdMdFdIpMpFpDpRpNpDtRtStDrRrSr
DR1303206208838845046−42903001.01.71.50.9
DR26201050–130015508423656142−194302500.61.41.71.2
DR3155017802000652773384682302201.01.72.11.3
Table 2. Correlations of forest types (Figure 5) with total forest pollen for the total data set (overall) and for each specific deforestation and recovery phase (Figure 4). Forest types: Cf, conifer forest; Msf, Mediterranean sclerophyll forest; Sdf, submontane deciduous forest; Rf, riverine forest. Correlation significance: ** p < 0.01.
RomanMedievalModern
Forest typeOverallD1R1D2R2D3R3
Cf0.823 **0.862 **0.798 **0.890 **0.749 **0.3380.759 **
Msf0.479 **0.0560.6510.540 **0.723 **0.748 **0.670 **
Sdf0.0830.4240.449−0.3210.716 **0.771 **0.218
Rf0.101−0.0080.4550.127−0.3770.2040.058
Table 3. Correlations of individual forest pollen types with total forest pollen for the total data set (overall) and for each specific deforestation and recovery phase (Figure 4). Forest types: Cf, conifer forest; Msf, Mediterranean sclerophyll forest; Sdf, submontane deciduous forest; Rf, riverine forest. Correlation significance: * p < 0.05; ** p < 0.01.
RomanMedievalModern
Tree TaxaOverallD1R1D2R2D3R3
Pinus0.824 **0.856 **0.803 *0.889 **0.748 **0.3280.759 **
Abies0.456 **0.728 *−0.3060.2920.2230.1780.000
Quercus (e)0.479 **0.0560.6510.541 **0.723 **0.748 **0.670 **
Quercus (d)0.0300.3030.280−0.570 **0.726 **0.500 **0.339 *
Betula−0.0310.4250.6910.2060.536 **0.489 **−0.211
Corylus0.213 **0.5280.3600.0330.3040.392 *0.193
Fagus0.211 **0.165−0.3080.1740.1930.1790.095
Alnus0.172 *0.1420.447−0.048−0.1330.0500.179
Salix0.047−0.2460.3290.2500.0620.190−0.288
Ulmus0.170 *0.0000.0000.000−0.628 **0.1790.309 *
Disclaimer/Publisher’s Note: The statements, opinions and data contained in all publications are solely those of the individual author(s) and contributor(s) and not of MDPI and/or the editor(s). MDPI and/or the editor(s) disclaim responsibility for any injury to people or property resulting from any ideas, methods, instructions or products referred to in the content.

