Article

Pyrenean Silver Fir Forests Retain Legacies of Past Disturbances and Climate Change in Their Growth, Structure and Composition

by
Antonio Gazol
1,
Ester González de Andrés
1,
Michele Colangelo
1,2,
Cristina Valeriano
1 and
Jesús Julio Camarero
1,*
1
Instituto Pirenaico de Ecología (IPE-CSIC), Avda. Montañana 1005, 50059 Zaragoza, Spain
2
Scuola di Scienze Agrarie, Forestali, Alimentari e Ambientali, Università della Basilicata, Viale dell’Ateneo Lucano 10, 85100 Potenza, Italy
*
Author to whom correspondence should be addressed.
Forests 2023, 14(4), 713; https://doi.org/10.3390/f14040713
Submission received: 28 February 2023 / Revised: 24 March 2023 / Accepted: 26 March 2023 / Published: 30 March 2023

Abstract

:
Recent drought-induced dieback alters forest dynamics, which are also shaped by past management. In western Pyrenean silver fir (Abies alba) stands, dieback concurs in space and time with the legacies of past management, but the impacts on forest growth, structure and composition are unknown. We aim to disentangle how dieback interacts with the legacies of past human use and modulates the recent dynamics of silver fir forests. To this end, we sampled eleven silver fir forests across wide climatic gradients and included declining and non-declining sites. We measured radial growth, structure, composition, understory cover and type and amount of deadwood. Silver fir growth declines in response to late-summer drought. In declining sites, most defoliated stands showed the lowest silver fir density and were those where growth depended more on water availability. Tree death enhanced the cover of dominant understory plants such as Buxus sempervirens. Past management activities leave an imprint in the growth of silver fir, such as releases due to past logging, but also affect the number of stumps and snags and the current tree density. A more extensive monitoring will be required to fully disentangle the multiple influences of past management legacies and current climate change on forest dynamics.

1. Introduction

Forests cover 35% of the European land area and provide a wide variety of ecosystem services, including carbon sequestration, biomass production, biodiversity maintenance, recreation and aesthetic experiences [1]. However, the condition of some European forests is deteriorating due to the increase in canopy defoliation and basal mortality rates and to the occurrence of widespread dieback episodes as a result of climate change [2,3,4,5]. Climate variability (e.g., climate extremes such as droughts) [6] and climate change [7] are important factors driving the increase in tree mortality rates and forest dieback episodes across Europe. The simultaneous occurrence of warm and dry summers has increased over the past decades [8], triggering the occurrence of forest mortality events in drier regions [9]. For instance, in northeastern Spain, where many economically and culturally valuable tree species such as European beech (Fagus sylvatica L), Scots pine (Pinus sylvestris L.) and silver fir (Abies alba Mill.) reach their southern distribution limits [10,11], the increase in aridity during the last years has triggered forest dieback and mortality in some locations [12,13,14].
Of particular interest is the situation of silver fir, an ecologically and economically relevant tree species widely distributed in moist areas in central and eastern Europe [14,15,16,17,18,19,20,21,22,23,24,25,26]. Silver fir growth trajectories and responses to climate strongly differ along its distribution range [27], and the capacity of this species to thrive under warmer and drier conditions has been a matter of debate among scientists and foresters [28,29,30,31]. Silver fir radial growth is sensitive to water shortage during the growing season [20,24,32], particularly in lowland sites [19,30]. This species reaches its southwestern distribution limit in the Spanish Pyrenees, where it is restricted to montane and subalpine habitats, where it forms pure and mixed stands with other species such as beech, Scots pine and mountain pine (Pinus uncinata Ram.) [23]. In this region, silver fir radial growth is strongly limited by the occurrence of elevated temperatures during the late summer in the year prior to growth [22,33]. Enhanced aridity has been also found to limit silver fir recruitment and growth, particularly in low elevated montane forests [23]. Thus, these studies point to the sensitivity of silver fir to drought and heat, particularly in regions close to the southern limit of its distribution range [31], which has led to vitality losses, lack of recruitment and mortality events since the late 1980s [15,16,17,18,19,20,21,22,23].
The occurrence of drought-induced silver fir dieback episodes in regions close to the southern limit of the distribution of the species, such as Croatia [34], Slovenia [35,36], Spain [15] and France [37], have been reported over the past years. This contrasts with the capacity of the species to recover after drought in wetter-cooler sites from central Europe [28,29] and Italy [30]. These contrasting results suggest that rear-edge (southern) silver fir forests, particularly those located at lower altitudes [23], are more vulnerable to drought than those forests close to the center of the species distribution range [19,27], increasing the interest in understanding the structure and dynamics of these forests as a tool to better understand the persistence of silver fir with regard to climate change [38].
In the past, silver fir forests were heavily exploited for timber [25,26]. The cessation of management practices modulated silver fir drought sensitivity and led to different successional trajectories, depending on the region under consideration [39]. For instance, in the Italian Apennines, silver fir forests have been replaced by mixed beech–fir multilayer forests after management abandonment [40]. In the Spanish Pyrenees, past management practices have been detected as a potential factor enhancing stand competition, predisposing silver fir forests to pathogen attacks and drought-induced dieback [15,21,23,41]. It is thus valuable to compare how managed and unmanaged forests differ in their structural and ecological characteristics [42]. However, old-growth, well-preserved forests are scarce in Europe [43], and this situation is also evident in the Pyrenees [42]. Old-growth forests represent remnants of past forest conditions and can be used as models guiding conservation and management strategies for preserving multifunctional forests [44]. For example, unmanaged and old-growth forests are structurally and compositionally more diverse than managed ones [45], despite the fact that both types of forests can have similar amounts of living biomass [46,47]. Several studies suggest that species mixing can mitigate drought impacts [48,49], although these benefits can be site and species specific [23,50,51,52]. It is also expected that mixed forests can help to maintain biodiversity at different trophic levels by creating microhabitats [53] and that the presence of deadwood can enhance species richness and the diversity of saprophytic fauna [54,55]. The question remains: how do legacies of past management interact with dieback and affect the growth, structure and composition of Pyrenean silver fir forests?
The lack of management and the occurrence of dieback in silver fir forests can enhance replacement by more drought-tolerant species such as beech and Scots pine [23,40,56]. Inappropriate management practices such as diameter limit cutting reduce structural diversity, prevent silver fir regeneration and can enhance drought-induced dieback by favoring the persistence of less vigorous trees [15,17,26] Additionally, the death of individual trees together with the lack of management can enhance the abundance of deadwood on the forest floor, which might help to preserve biodiversity [57]. However, the state of these forests suffering from drought-induced dieback in the Spanish Pyrenees remains unclear, as does how they differ from both managed and unmanaged healthy stands [47]. With this in mind, we studied the structure, composition and growth of silver fir forests in the Spanish Pyrenees, including both declining and non-declining forests. Our aims were: (i) to understand if tree growth in declining forests is more constrained by drought than in non-declining forests; (ii) to discern if legacies of past management practices are more evident in declining stands; and (iii) to determine if declining and non-declining stands differ in terms of species composition, structure and deadwood. According to previous results [15,19], we hypothesize that silver fir dieback and growth decline is stronger in those sites in which tree growth is more limited by drought and where stands were more heavily exploited in the past, which are in turn composed of smaller more vulnerable trees [23]. We also expect that silver fir dieback will induce changes in deadwood and forest composition, enhancing the coverage of woody shrubs and increasing the amount of lying deadwood due to the death of trees and the subsequent increase in understory light availability.

2. Materials and Methods
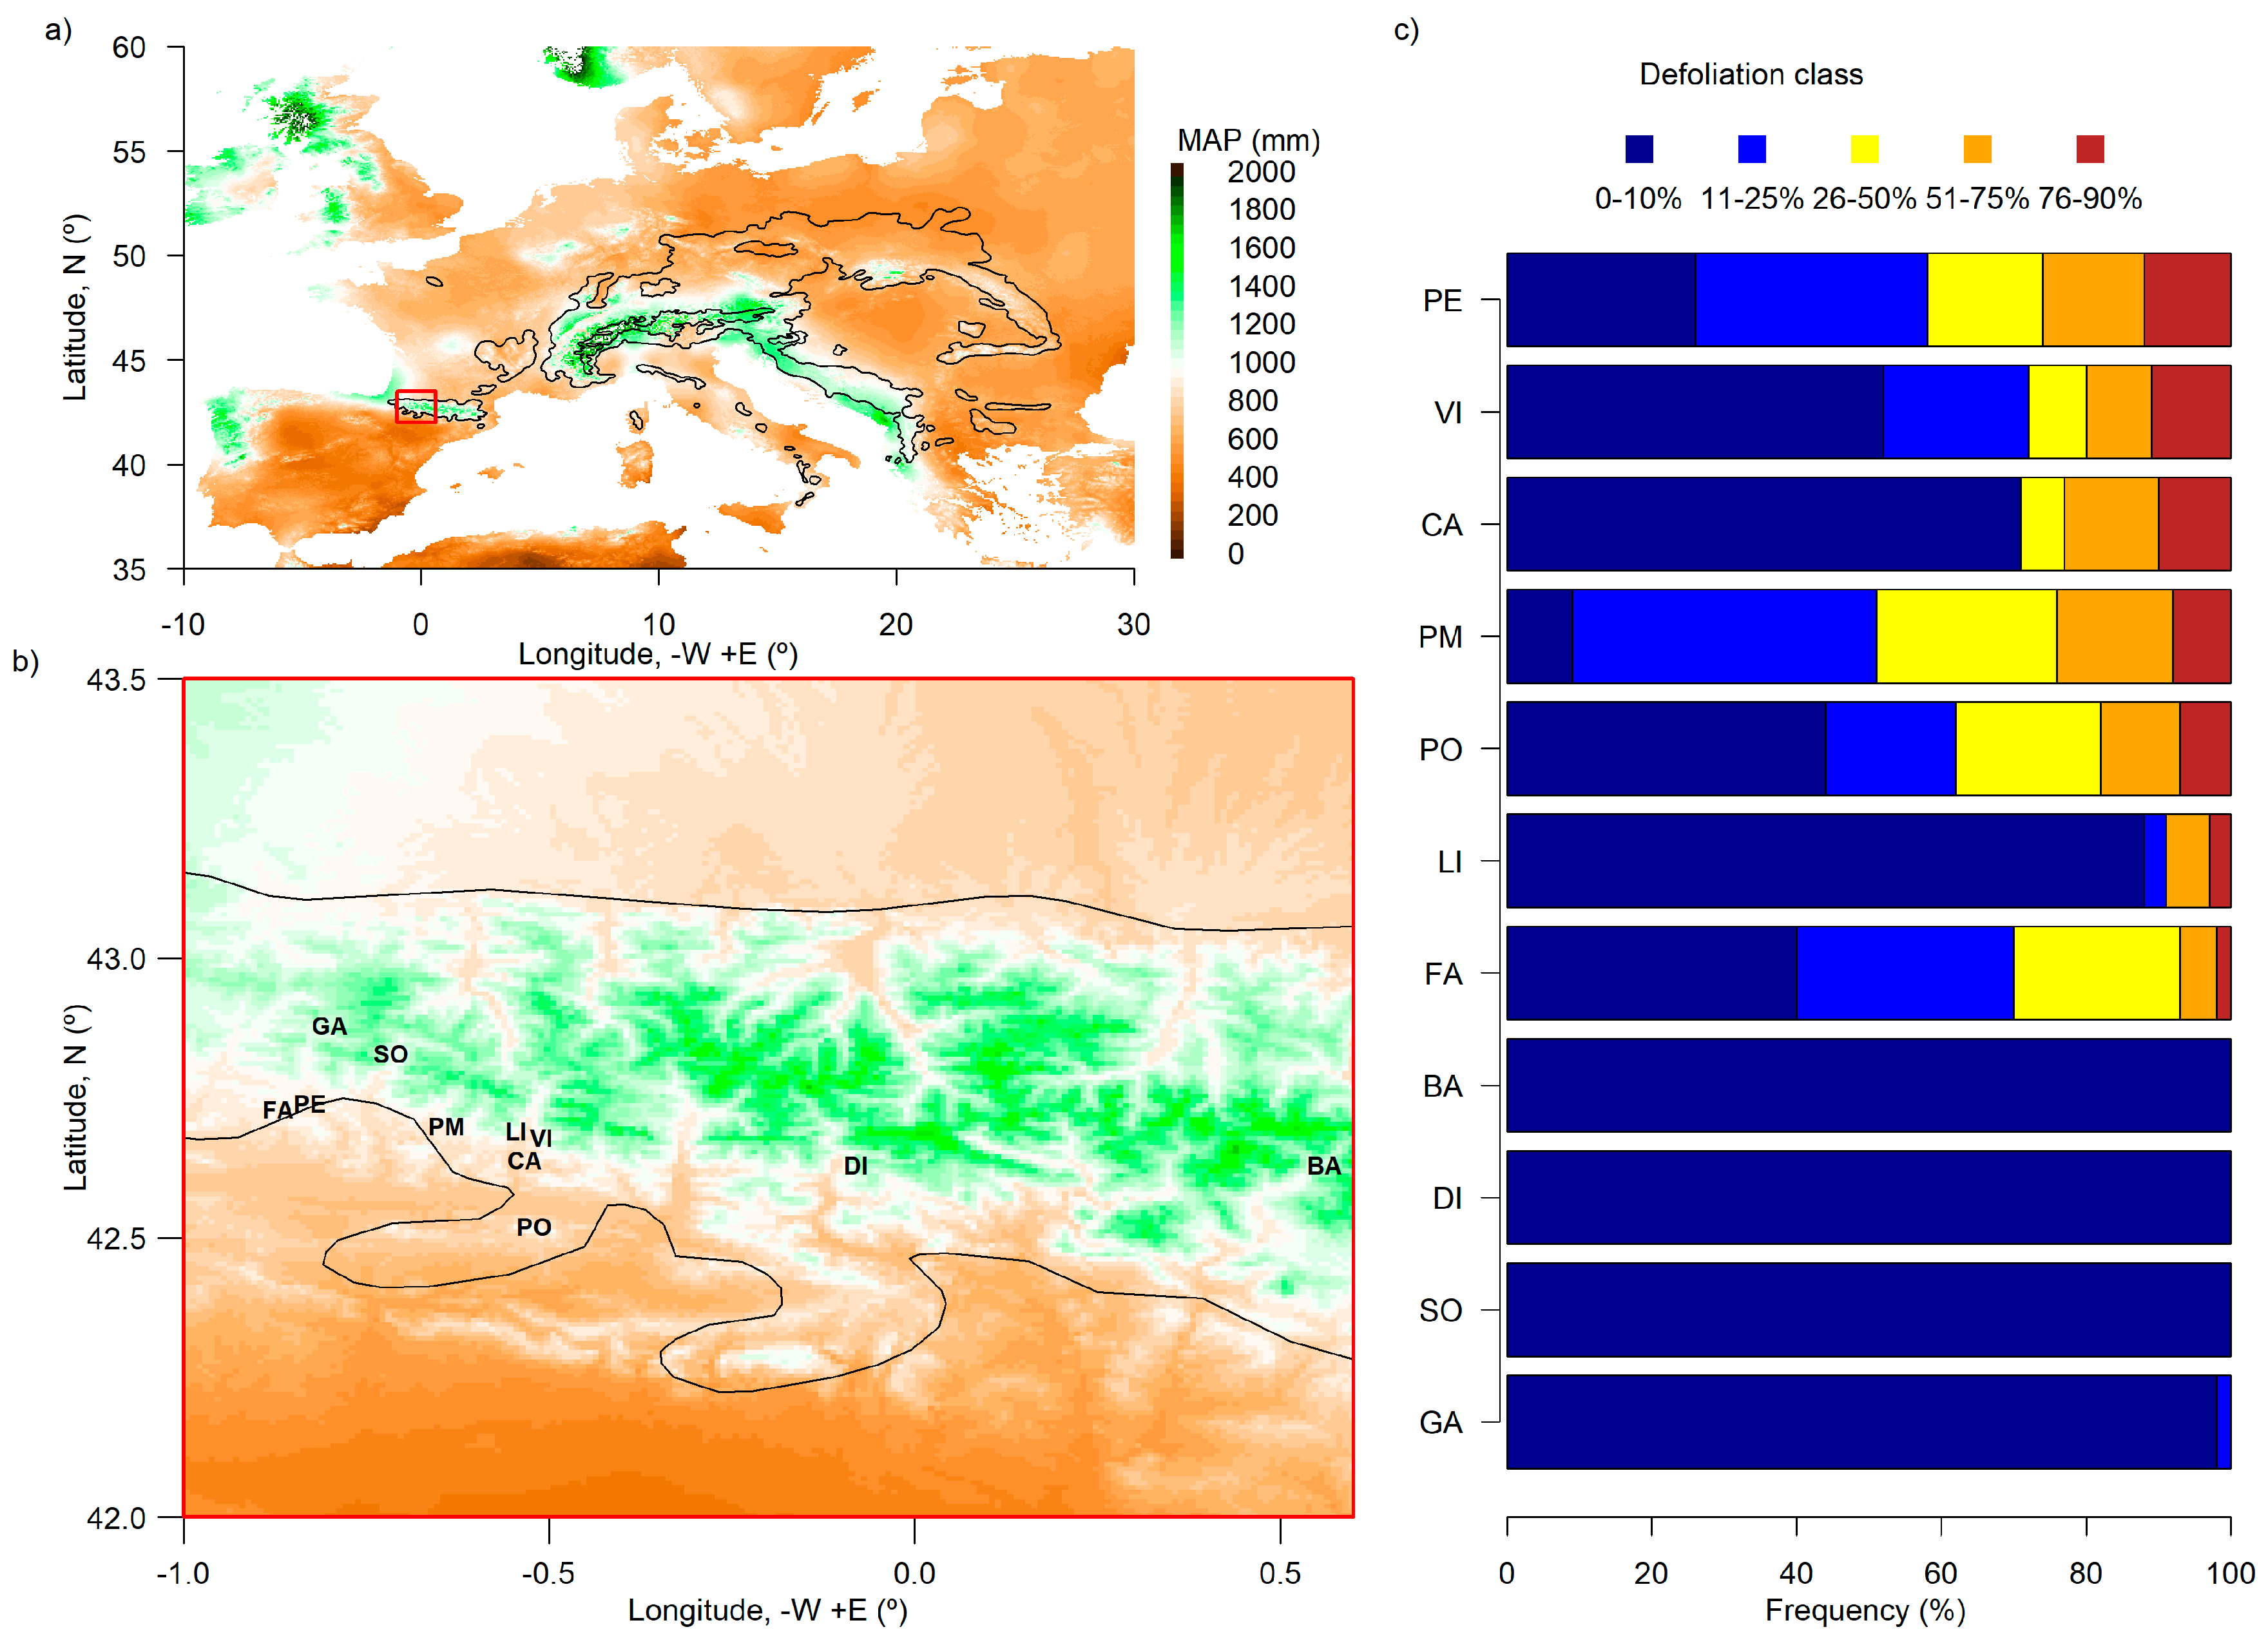
2.1. Study Area

The study area is located in the central and western Spanish Pyrenees and includes mature silver fir forests that form the southwestern limit of distribution of the species in Europe (Figure 1).
This type of montane, often mixed forest is dominant in the more mesic temperate and cool sites of the Spanish Pyrenees, such as valley bottoms and north and north-west-facing slopes [58]. We selected 11 silver fir forests encompassing a gradient of environmental conditions, tree vigor and mortality rates [15,16,17,18,59]. Most of these forests were sampled 20 years ago to document the status of silver fir dieback in the western Spanish Pyrenees [15]. The selection of the forests was done according to the distribution of silver fir in the Pyrenees (see Camarero et al. 2002 [17] for details) In general, we chose forests in which silver fir dieback is well documented and ongoing, as well as mature, well-preserved forests where dieback has not yet been clearly observed (Figure 1c).

2.2. Field Sampling and Climate Data

For each one of the studied sites, we measured and recorded its latitude, longitude and altitude. Additionally, the average slope and orientation of the sampled stand was annotated. We also described the dominant vegetation, the type of lithology and soil, and the presence of disturbances or related signs (stumps, remains of chains or trails related to old felling, logging, old tracks, etc.).
To quantify the relationships between radial growth and climate, monthly climatic data (average maximum temperature, total precipitation) were obtained for the period 1963–2016 (Appendix A, Figure A1). These data were extracted from grids that included some of the sampled fir forests corresponding to the 1.1 km2 gridded homogenized database developed for Spain [60]. This database also contains estimated evapotranspiration data, which made it possible to calculate the Standardized Precipitation-Evapotranspiration Index (SPEI), which allows estimating the severity and duration of droughts at different temporal resolutions [61]. We obtained SPEI values at the scale of 3 months to reflect how growth responded to drought. Negative and positive SPEI values indicate dry and humid conditions, respectively (Figure A1).
In each of the studied forests we located at least one transect of 100 m in length, which was placed diagonally in front of the maximum slope; we located the position of the points at 0 and 100 m using GPS with a resolution of ± 5 m. Every 10 m along the transect the distance and diameters at breast height of 1.3 m of the four closest neighboring trees located in four different quadrants were measured, annotating also the species identity. In total, 44 trees were considered per transect. With these data, we estimated the basal area and the density of silver fir and accompanying tree species in accordance with [62].
In addition, we also characterized the tree vigor status by quantifying crown defoliation [63]. We used a semi-quantitative scale of five levels of defoliation [64]: class 0, defoliation 0–10%; class 1, defoliation 11–25%; class 2, defoliation 26–50%; class 3, defoliation 51–75%; class 4, defoliation 76–90% (Figure 1c). Recently dead trees were considered those with defoliation greater than 91% (class 5) and that were not forming the last ring corresponding to the sampling years (2019 or 2020). Crown defoliation has been shown to be a reliable indicator of tree vigor in other studies and species [65,66].
In each transect, we sampled two mature and dominant or co-dominant firs of the four selected trees, which were separated by at least 10 m. For each tree, two radial cores were taken at 1.3 m and perpendicular to the maximum slope using 5 mm diameter Pressler borers (Haglöf, Sweden). Cores were dried at room temperature, glued on grooved wooden guides prepared for study, and sanded with different sandpapers until the annual growth rings were perfectly distinguished.

2.3. Measuring Lying Deadwood, Stumps and Snags

To estimate the volume of lying deadwood, we used an intercept method [67]. We noted the cutoff points of intersection and the length of any pieces of deadwood greater than 15 cm that intersected the vertical projection of the 100 m long transect. The pieces of deadwood were classified according to their degree of decomposition into five categories or degrees: grade 1, intact bark and attached to wood that does not appear decomposed, with twigs persisting; 2, bark is shed but wood is intact, though it may show incipient decay, with twigs absent; 3, there is hardly any bark, the wood separates like chips, especially the sapwood, and its surface is elastic or spongy, with twigs and bark absent; 4, the wood is broken into large pieces in the form of splinters or sawdust, twigs and bark are absent, and little remains of sapwood; and 5, the wood breaks down as dust, leaving few intact pieces, mostly heartwood [68].
The stumps and standing dead trees (snags) located 2.5 m from each side of the transect, that is, in an area of 500 m2, were located, and their basal diameter was measured at 1.3 m. Their relative position along the 100 m transect, the distance to the center line of the transect and their degree of decomposition were noted. In the case of standing dead trees, their height was also measured. This allowed us to quantify the stand density and basal area of stumps and snags as well as the total volume of deadwood in the transect. When possible, due to the decomposition of wood, stumps and snags were classified according to their species.

2.4. Processing Tree Ring Data

The processed samples were visually cross-dated [69], and growth rings were measured with 0.01 mm resolution using a Lintab-TSAP semi-automatic device. Visual dating was verified using the COFECHA program [70], which calculates correlations between the individual series and the average series of each fir forest. Once the rings were measured and their dating verified, their widths were converted into basal area increment (BAI), assuming that the rings were concentric and that the wood sample contained the pith or internal rings close to the pith.
We detrended tree ring series to eliminate the influence of changes in tree size and age or disturbances using a cubic smoothing spline with a length of 30 years and a 0.5 response cutoff. Note that the same spline length was used for all samples in order to facilitate the comparison of the chronologies [71]. After that, bi-weight robust averages were determined to obtain residual chronologies or mean site series after removing temporal autocorrelation of ring-width indices (pre-whitening).
To detect potential growth releases related to natural (e.g., windstorm) or anthropogenic (e.g., logging) disturbances, we used the percentage growth change method [72] based on comparing running 10-year ring-width means of individual tree ring width series. We focused on major releases as proxies of past logging, which were defined as growth changes higher than 50% of the average growth in the previous 10 years. For each stand, we quantified the frequency of trees showing major releases per year as well as the total frequency of releases in the period 1900–2016.

2.5. Statistical Analyses

To quantify the relationships between climate and growth, we calculated Pearson correlation coefficients between monthly maximum temperatures and the SPEI drought index calculated at a 3-month resolution (Figure A1) against the radial growth indices (mean site series). In the correlations between growth (RWI) and climate, the common period of 1963–2016 was considered. Correlations were calculated from the previous September to October of the year of formation of the ring. To estimate the significance of the correlations, we used the bootstrapping method [73].
Correlation analyses based on the Spearman rank correlation coefficient were done to test for the relationship between number of releases, responses of growth to climate, stand structure, deadwood volume and characteristics between sites. In particular, we considered the following variables: percentage of severely defoliated and dead trees, silver fir basal area, stand density, average percentage of releases, stump density, stump basal area, correlation between growth and previous September maximum temperature, correlation between growth and 3-month SPEI in July, deadwood volume, deadwood cover, and the cover of Buxus sempervirens L., the most abundant shrub, in the understory.
Statistical analyses were performed in the statistical environment of R 4.2.0 [74]. The dplR package [75,76,77] was used to manage tree ring width files, transform them to basal area increment series and to obtain site chronologies. The TRADER package [78] was used to quantify the number of releases per site; the package treeclim [79] was used to estimate the relationship between climate and growth; the corrplot package was used to create correlation plots [80]; the raster package [81] was used to manage spatial files and create maps.

3. Results

3.1. Silver Fir Stand Characteristics

The degree of defoliation, structure of the forests and silver fir growth varied considerably between sites (Figure 1, Table 1). The declining stands with a higher percentage of severely defoliated and dead trees were Paco Ezpela (PE), Castiello de Jaca (CA), Paco Mayor (PM) and Paco de Villanúa (VI), whilst no defoliation was observed in Ballibierna (BA), Diazas (DI), Selva de Oza (SO) and Gamueta (GA). The diameter of silver fir trees was two times as large in GA than in DI. Two sites showing dieback, PE and PM, showed the lowest density and basal area of silver fir, which was five times lower than that found in non-declining sites such as Lierde (LI) (Table 1). In contrast, the cover of B. sempervirens in the understory was higher in Peña Oroel (PO) and in declining sites showing more defoliation (PE, CA, PM and VI) than in GA and SO non-declining sites, among others.

3.2. Legacies of Past Management: Major Growth Releases

The number of major growth releases and their frequency varied among sites (Figure 2). Generally, releases were more frequent in declining stands such as PE and PM, but they were also detected in mature well-preserved stands such as GA. It is important to note that the distribution of these releases and their intensity varied over time, with some sites showing a very high frequency of releases sparsely distributed in the study period (e.g., PM), while in other cases releases were concentrated in some particular periods (e.g., the 1940s and 1950s in FA, the 1970s in DI).

3.3. Tree Growth and Response to Climate

The mean age at 1.3 m of sampled trees was 179 years, with a wide range from 98 (LI) to 462 years (GA). The mean ± SD of RW and BAI were 1.93 ± 0.92 mm and 15.67 ± 0.62 cm2, respectively. The growth trend of GA, SO and DI (non-declining sites) was positive and significant (p-value < 0.001) (Table 2). We found that the growth of silver fir trees positively responded to April temperature and precipitation from June to August (Figure 3). Conversely, high temperatures during the previous September had a negative impact on silver fir growth. The extreme 1986 drought, which was preceded by high temperatures during September 1985, resulted in a very low silver fir growth (Figure A1 and Figure 3).

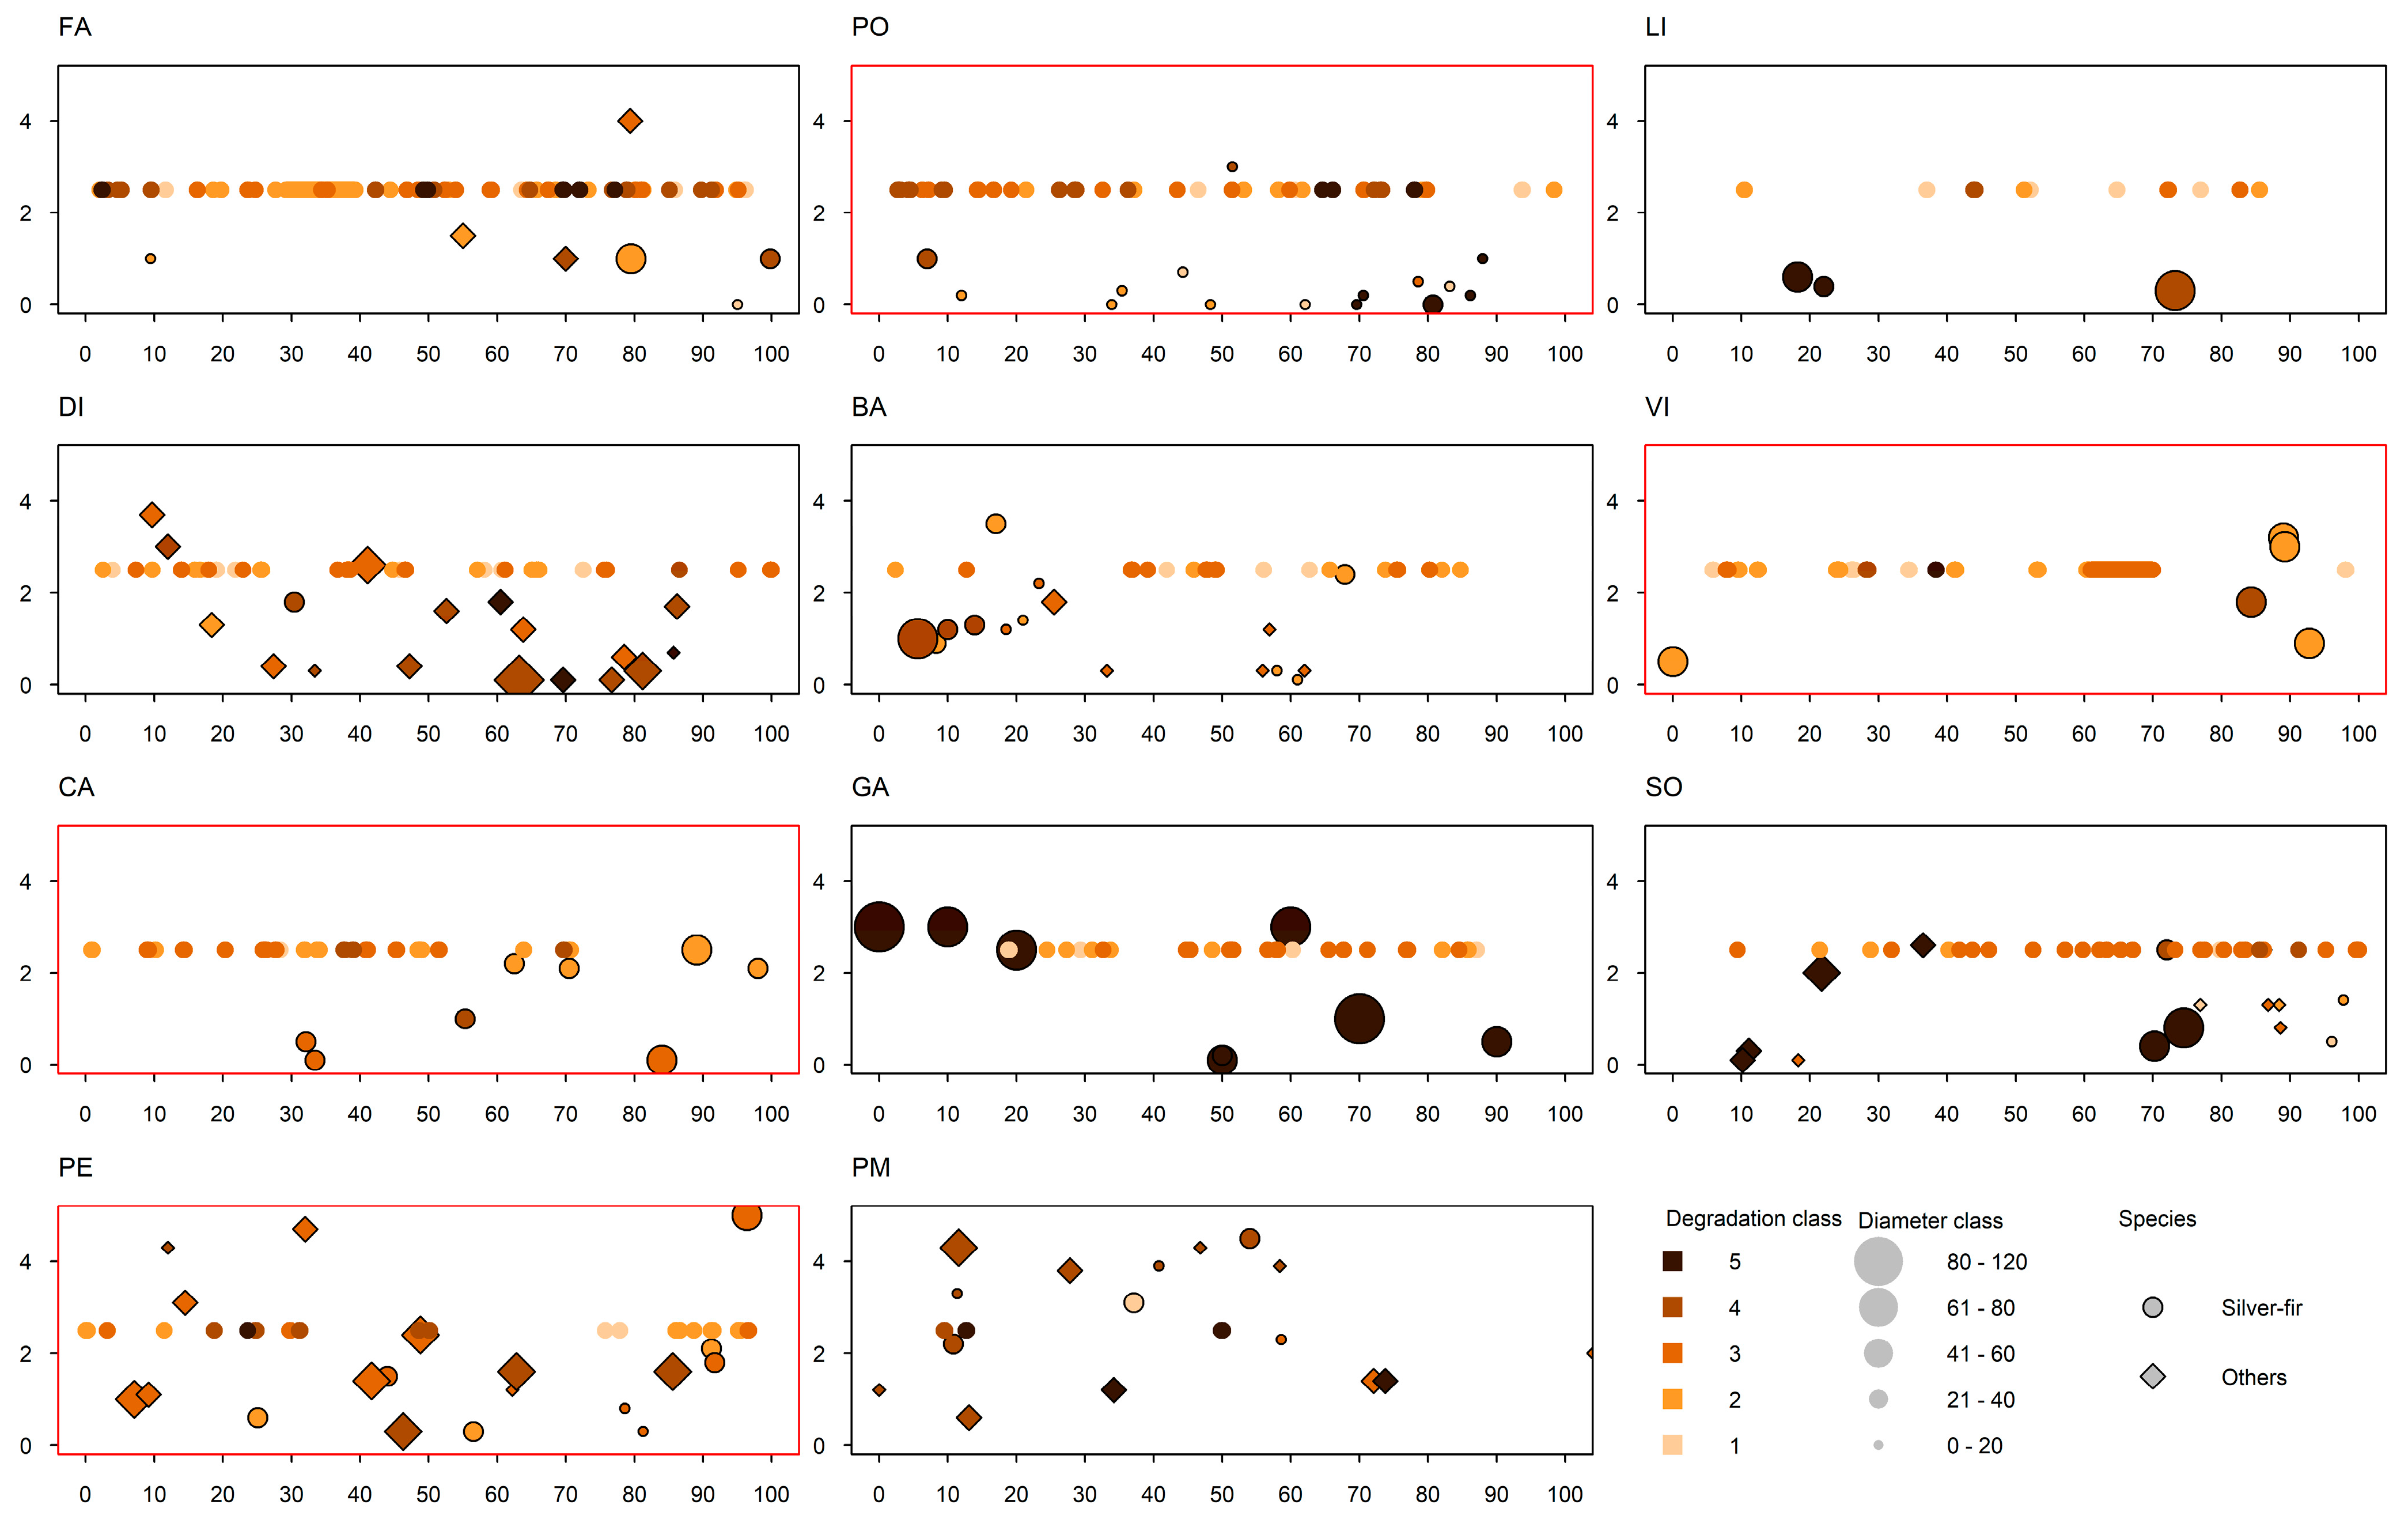
3.4. Deadwood Type, Volume and Coverage

The quantity and type of lying deadwood also varied between sites (Figure 4 and Figure A2, Table 3). The volume of deadwood was the highest in site VI, and the deadwood cover peaked in site PE. Lower values of the two variables were found in sites LI, GA and FA (Figure 4). Snags were present in all forests, excluding LI and BA (Table 3). The decomposition grade was around 2–3 in all sites, excluding PM, where it was the highest (4) and LI where it was the lowest (1). In half of the sites, only stumps of silver fir were found, while in the rest of sites stumps of European beech and Scots pine were also found.

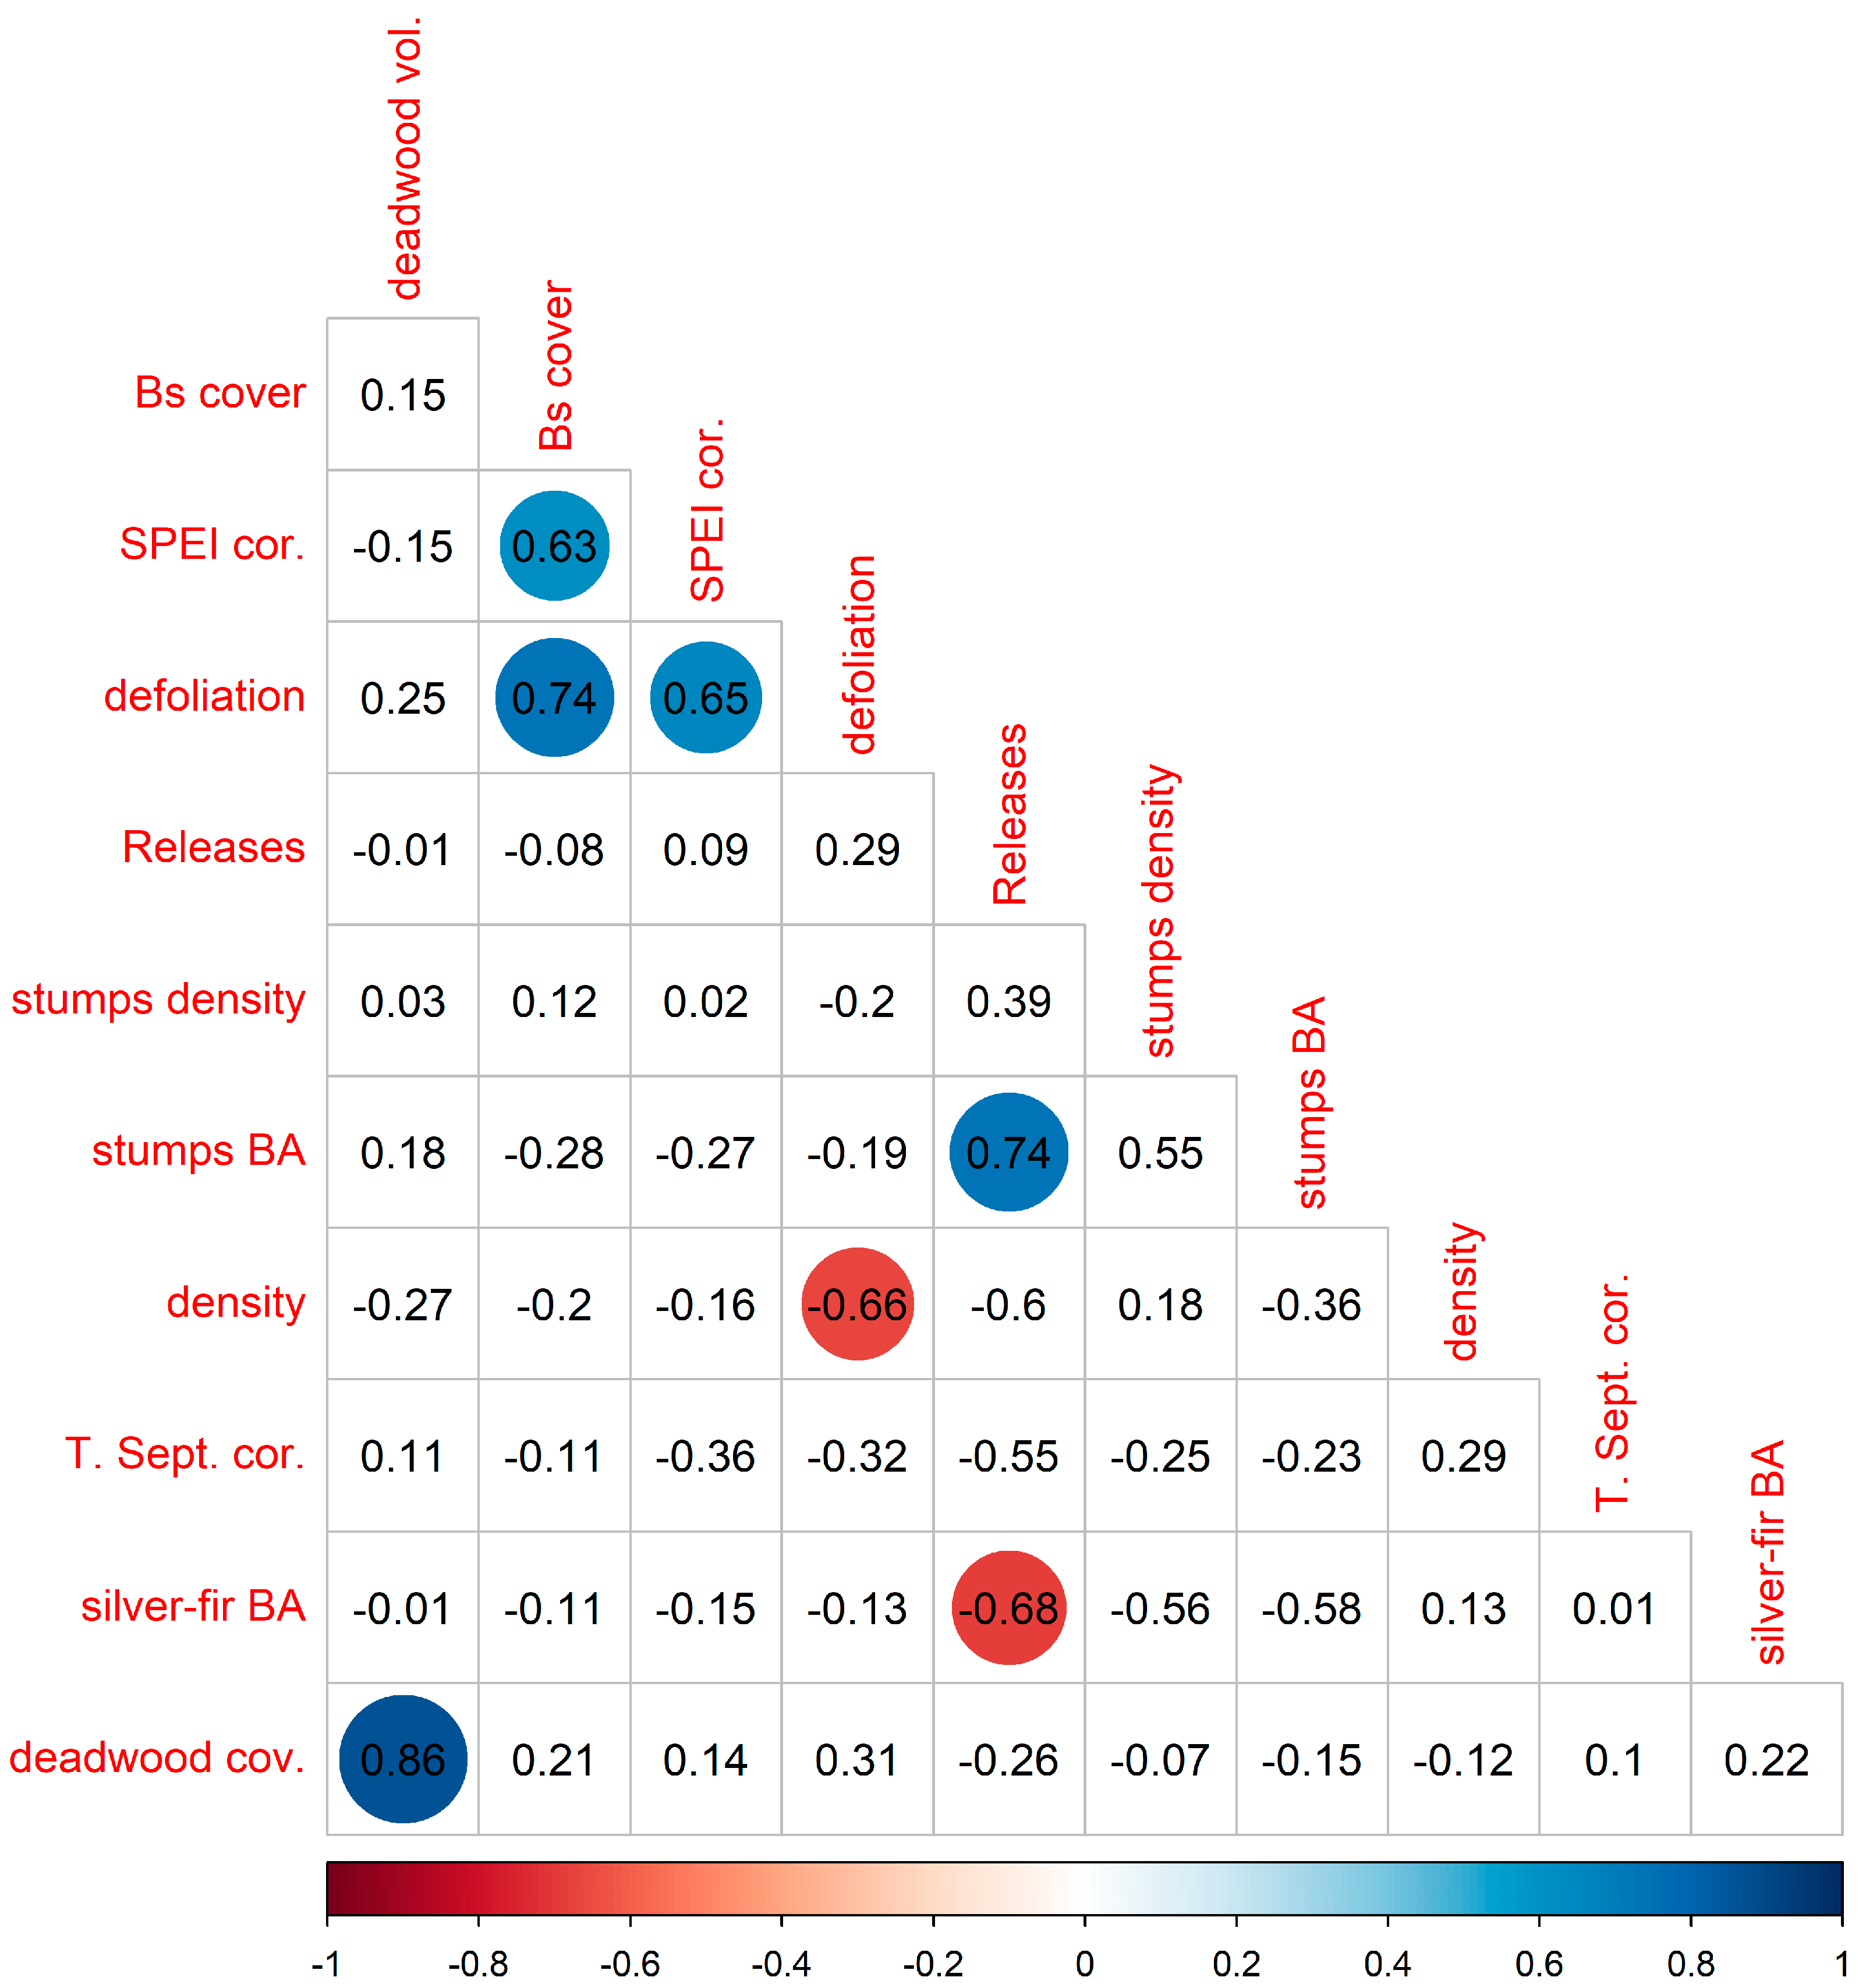
3.5. Relationship between Variables across Stands

We found that in those stands showing a high correlation between growth and the 3-month July SPEI, the proportion of severely defoliated and dead firs was higher, and the cover of understory shrubs (mainly B. sempervirens) was also high (Figure 5). As expected, the stands with a higher proportion of defoliated and dead trees presented lower density of living trees. The basal area of stumps and snags was higher in sites that displayed a greater proportion of releases, which in turn also had a lower density and basal area of living silver fir trees (Figure 5). These results suggest that those sites more heavily exploited in the past present a structure different from less managed stands and are also more vulnerable to defoliation and mortality due to climate change. Finally, the volume of deadwood and the cover of deadwood were positively related.

4. Discussion

The results of this study support the hypothesis that silver fir dieback in the western Spanish Pyrenees is caused by climate change, as we found higher growth sensitivity to drought in stands with a higher proportion of dead and defoliated trees. We also found that legacies of past human activities, identified as growth releases, leave an imprint on forest structure and composition, inducing changes in understory vegetation and the type and quantity of lying deadwood. That is, those forests more heavily exploited in the past were dominated by smaller silver fir trees, which were more prone to defoliation and mortality. In contrast, we failed to connect legacies of past management activities with silver fir growth responses to drought and current vigor status. These results can be a consequence of the reduced number of stands considered, pointing to the importance of monitoring silver fir forests in the Pyrenees as a tool to understand how these rear-edge forests respond to climate change and historical use.
Our results confirm that silver fir growth is sensitive to summer drought but also to the occurrence of elevated temperatures in September in the year prior to tree ring formation [22,33]. Further, we show that the relationship between silver fir growth and the SPEI drought index is stronger in stands showing a higher degree of defoliation, pointing to stronger growth decline in more arid stands [19]. The dependency of silver fir growth on previous September temperature also varied between sites, but without a clear pattern. The concomitant occurrence of high temperatures during the previous summer and a summer drought in the year 1986 (Figure 3) are assumed to be the trigger of the observed dieback processes of silver fir in the Spanish Pyrenees [16,17,18,19,20]. Overall, our results point to the vulnerability of silver fir to climate change in the study area, i.e., in the species rear edge [12,15,23,26,31,38], in contrast with what is observed in other forests from the Pyrenees [23] as well as in other sites from central Europe [28,29,30]. If compound climate events such as heat waves and droughts become more frequent, as has been suggested [8,9], the persistence of silver fir in low-elevation montane forests from the western Pyrenees will be compromised [31].
We found a strong variation in the number and the occurrence of releases between sites (Figure 2). The elevated number of releases found during the past century, particularly during periods of strong timber extraction such as the 1950s, suggests that these forests were heavily exploited in the past [15,16,21]. This is not surprising, given that silver fir is an economically profitable species in Europe [25,26]. Those stands that presented a higher number of releases also had a lower basal area of silver fir (Figure 5), but we could not detect significant relationships between the number of releases and the number of defoliated trees or the response of growth to drought, as was expected [39,41]. The number of releases can be indicative of both human-induced but also natural disturbances, and the reduced number of stands, this makes difficult to find differences between them. In any case, the links between the number of releases, stand attributes and deadwood evidence that past management leaves an imprint on forest structure and composition [44,45,46]. In terms of structure, more heavily exploited stands, primarily by the removal of large trees, reduces structural diversity and predisposes stands to drought-induced dieback [15]. In terms of composition, the lack of management in the last years has enhanced the increase of understory shrubs and the dominance of other species, such as beech, in declining stands [56].
We found evidence suggesting that the quantity and type of deadwood vary between sites and that this variation partially depends on past management. By contrast, we did not find an increase in the cover or volume of lying deadwood in forests showing dieback (Figure 4 and Figure 5). Silver fir is an economically important species [26], and several studies have evaluated the variation in stand characteristics and deadwood between forests subjected to different management intensities [40,42,45,46]. The higher density of stumps and snags in sites that were more intensively managed in the past (i.e., with a higher number of releases) points to the importance of past management in determining deadwood type [55]. We could have also expected a higher deadwood volume and cover in well-preserved and less managed forests [40]. However, it is important to note that the studied forests are not managed nowadays [15] and that current stand vigor is an important factor determining the accumulation of deadwood in the understory [82]. It is expected that large trees are more prone to offer suitable microhabitats for biodiversity maintenance [44]; thus, further studies should deepen knowledge of the differences in deadwood quantity and quality between silver fir forests with different management histories and levels of vigor.
It is also important to note that the death of trees can create canopy gaps, modulating tree species composition and diversity in the understory [83,84]. In the short term, reductions in canopy closure enhance the establishment of light-demanding species [83], but species composition changes when tall shrubs and saplings become dominant [84]. However, the effect of canopy openings on understory attributes depends on the functional group considered, e.g., bryophytes or vascular plants [85,86], and it is contingent on human activities and site conditions [40,85,86,87]. In this study, we did not consider understory diversity directly, but we observed a higher presence of B. sempervirens in the understory of forests showing dieback (Table 1, Figure 5). We interpret this as a response of the understory layer to the increase in light availability due to increased canopy defoliation and the death of dominant trees. This contrasts with the lack of plants in the understory of well-preserved, old-growth silver fir forests, such as GA and SO sites (Table 1). Local conditions strongly determine understory composition [82], and thus understory composition and diversity will vary considerably between sites. However, monitoring the dynamic of the understory of silver fir forests showing dieback will be of great utility to determine its potential trajectories, given the low silver fir recruitment in these forests in comparison to other species, such as European beech [23,40,56].

5. Conclusions

Dieback processes affecting silver fir stands in the western Spanish Pyrenees started in the late 1980s and left an imprint in the growth, structure and composition of these forests. The decline and subsequent death of individual trees concur in time with the legacies of prolonged management practices during the past century, creating novel, human-shaped forest ecosystems as a consequence of warmer and drier conditions and past timber extraction. Here we studied the structure, composition and tree growth of silver fir forests that were previously assessed two decades ago. We found that low elevation, montane forests, particularly those located in the western Pyrenees and heavily exploited in the past, show evident signs of drought-induced dieback. These forests are composed of trees with smaller diameter, likely as a consequence of the removal of large trees in the past, and are suffering a process of understory encroachment and canopy colonization by other species such as European beech. We advocate for the monitoring of these forests, as they are dynamic ecosystems that can help us to understand how climate change can affect human-shaped forests in the future and to assess how management legacies influence post-drought resilience. Questions that remain open are how deadwood differs between well-preserved, old-growth forests and forests showing dieback, and how this deadwood contributes to maintain biodiversity.

Author Contributions

Conceptualization, A.G. and J.J.C.; methodology, A.G., C.V. and J.J.C.; software, A.G. and C.V.; validation, A.G., C.V., E.G.d.A., M.C. and J.J.C.; formal analysis, A.G. and J.J.C.; writing—original draft preparation, A.G.; writing—review and editing, A.G., C.V., E.G.d.A., M.C. and J.J.C.; project administration, J.J.C.; funding acquisition, J.J.C. All authors have read and agreed to the published version of the manuscript.

Funding

AG is supported by the “Ramón y Cajal” Program of the Spanish MICINN under Grant RyC2020-030647-I and by CSIC under grant PIE-20223AT003. This research was funded by the Science and Innovation Ministry and the AEI, under projects PID2021-123675OB-C43 and TED2021-129770B-C21, and by the Aragón Government project “Diversidad funcional de suelos en ecosistemas forestales cambiantes”.

Data Availability Statement

Data are available on reasonable request to the corresponding author.

Acknowledgments

We thank Aragón Govt. forest guards and technicians for their support in the field.

Conflicts of Interest

The authors declare no conflict of interest.

Appendix A

Figure A1. Mean maximum temperature and 3-month July SPEI in the 1963–2016 period in the studied silver fir stands. The black solid line indicates the average value, and the shaded area the 95% confidence interval. The vertical line in the upper plot indicates the 1985 warm year.
Forests 14 00713 g0a1
Figure A2. Presence and type of deadwood in the studied stands. The line-intercept method was used to quantify the cover and volume of deadwood in each site. The symbols located along the straight line represent deadwood with different degradation class (color scale). In addition, the position of stumps and snags was recorded up to 2.5 m away from the 100 m long transects. The symbols of varying size and form represent the position of snags and stumps with respect to transects. Colors indicate the deadwood degree of decomposition (1–5), and the size is proportional to the diameter of the stump or snag. The symbol type indicates the tree species of deadwood (circle, silver fir; diamond, other species).
Forests 14 00713 g0a2

References

  1. FOREST EUROPE, 2020: State of Europe’s Forests 2020; Liaison Unit Bratislava: Bratislava, Slovakia, 2020.
  2. Senf, C.; Pflugmacher, D.; Zhiqiang, Y.; Sebald, J.; Knorn, J.; Neumann, M.; Hostert, P.; Seidl, R. Canopy mortality has doubled in Europe’s temperate forests over the last three decades. Nat. Commun. 2018, 9, 4978. [Google Scholar] [CrossRef] [PubMed] [Green Version]
  3. Senf, C.; Buras, A.; Zang, C.S.; Rammig, A.; Seidl, R. Excess forest mortality is consistently linked to drought across Europe. Nat. Commun. 2020, 11, 6200. [Google Scholar] [CrossRef] [PubMed]
  4. Senf, C.; Sebald, J.; Seidl, R. Increasing canopy mortality affects the future demographic structure of Europe’s forests. One Earth 2021, 4, 749–755. [Google Scholar] [CrossRef]
  5. Potočić, N.; Timmermann, V.; Ognjenović, M.; Kirchner, T.; Prescher, A.-K.; Ferretti, M. Tree Health Is Deteriorating in the European Forests (ICP Forests Brief No. 5); Programme Co-ordinating Centre of ICP Forests, Thünen Institute of Forest Ecosystems: Brunswick, Germany, 2021. [Google Scholar] [CrossRef]
  6. Neumann, M.; Mues, V.; Moreno, A.; Hasenauer, H.; Seidl, R. Climate variability drives recent tree mortality in Europe. Glob. Change Biol. 2017, 23, 4788–4797. [Google Scholar] [CrossRef] [PubMed]
  7. Taccoen, A.; Piedallu, C.; Seynave, I.; Perez, V.; Gégout-Petit, A.; Nageleisen, L.M.; Gégout, J.C. Background mortality drivers of European tree species: Climate change matters. Proc. Royal Soc. B 2019, 286, 20190386. [Google Scholar] [CrossRef] [PubMed] [Green Version]
  8. Manning, C.; Widmann, M.; Bevacqua, E.; Van Loon, A.F.; Maraun, D.; Vrac, M. Increased probability of compound long-duration dry and hot events in Europe during summer (1950–2013). Env. Res. Lett. 2019, 14, 094006. [Google Scholar] [CrossRef] [Green Version]
  9. Gazol, A.; Camarero, J.J. Compound climate events increase tree drought mortality across European forests. Sci. Tot. Env. 2022, 816, 151604. [Google Scholar] [CrossRef] [PubMed]
  10. Brus, D.J.; Hengeveld, G.M.; Walvoort, D.J.J.; Goedhart, P.W.; Heidema, A.H.; Nabuurs, G.J.; Gunia, K. Statistical mapping of tree species over Europe. Eur. J. For. Res. 2011, 131, 145–157. [Google Scholar] [CrossRef]
  11. Caudullo, G.; Welk, E.; San-Miguel-Ayanz, J. Chorological maps for the main European woody species. Data Brief 2017, 12, 662–666. [Google Scholar] [CrossRef]
  12. Camarero, J.J.; Gazol, A.; Sangüesa-Barreda, G.; Oliva, J.; Vicente-Serrano, S.M. To die or not to die: Early warnings of tree dieback in response to a severe drought. J. Ecol. 2015, 103, 44–57. [Google Scholar] [CrossRef] [Green Version]
  13. Anderegg, W.R.L.; Anderegg, L.D.L.; Kerr, K.L.; Trugman, A.T. Widespread drought-induced tree mortality at dry range edges indicates that climate stress exceeds species’ compensating mechanisms. Glob. Change Biol. 2019, 25, 3793–3802. [Google Scholar] [CrossRef] [PubMed]
  14. Caudullo, G.; Barredo, J.I. A georeferenced dataset of drought and heat-induced tree mortality in Europe. One Ecosyst. 2019, 4, e37753. [Google Scholar] [CrossRef]
  15. Camarero, J.J.; Bigler, C.; Linares, J.C.; Gil-Pelegrín, E. Synergistic effects of past historical logging and drought on the decline of Pyrenean silver fir forests. For. Ecol. Manage. 2011, 262, 759–769. [Google Scholar] [CrossRef]
  16. Cabrera, M. Evolución de abetales del Pirineo aragonés. Cuad. De La Soc. Española De Cienc. For. 2001, 11, 43–52. [Google Scholar]
  17. Camarero, J.J.; Padró, A.; Martín-Bernal, E.; Gil-Pelegrín, E. Aproximación dendroecológica al decaimiento del abeto (Abies alba Mill.) en el Pirineo aragonés. Montes 2002, 70, 26–33. [Google Scholar]
  18. Camarero, J.J.; Martín-Bernal, E.; Gil-Pelegrín, E. The impact of a needleminer (Epinotia subsequana) outbreak on radial growth of silver fir (Abies alba) in the Aragón Pyrenees: A dendrochronological assessment. Dendrochronologia 2003, 21, 3–12. [Google Scholar] [CrossRef]
  19. Macias, M.; Andreu, L.; Bosch, O.; Camarero, J.J.; Gutiérrez, E. Increasing aridity is enhancing silver fir (Abies alba Mill.) water stress in its south-western distribution limit. Clim. Change 2006, 79, 289–313. [Google Scholar] [CrossRef]
  20. Peguero-Pina, J.J.; Camarero, J.J.; Abadía, A.; Martín, E.; González-Cascón, R.; Morales, F.; Gil-Pelegrín, E. Physiological performance of silver-fir (Abies alba Mill.) populations under contrasting climates near the south-western distribution limit of the species. Flora 2007, 202, 226–236. [Google Scholar] [CrossRef]
  21. Oliva, J.; Colinas, C. Decline of silver fir (Abies alba Mill.) stands in the Spanish Pyrenees: Role of management, historic dynamics and pathogens. For. Ecol. Manage. 2007, 252, 84–97. [Google Scholar] [CrossRef]
  22. Linares, J.C.; Camarero, J.J. From pattern to process: Linking intrinsic water-use efficiency to drought-induced forest decline. Glob. Change Biol. 2012, 18, 1000–1015. [Google Scholar] [CrossRef]
  23. Hernández, L.; Camarero, J.J.; Gil-Peregrín, E.; Sánchez, M.Á.S.; Cañellas, I.; Montes, F. Biotic factors and increasing aridity shape the altitudinal shifts of marginal Pyrenean silver fir populations in Europe. For. Ecol. Manage. 2019, 432, 558–567. [Google Scholar] [CrossRef]
  24. Rolland, C.; Michalet, R.; Desplanque, C.; Petetin, A.; Aime, S. Ecological requirements of Abies alba in the French Alps derived from dendro-ecological analysis. J. Veg. Sci. 1999, 10, 297–306. [Google Scholar] [CrossRef]
  25. Mauri, A.; de Rigo, D.; Caudullo, G. Abies alba in Europe: Distribution, habitat, usage and threats. In European Atlas of Forest Tree Species; San-Miguel-Ayanz, J., de Rigo, D., Caudullo, G., Houston Durrant, T., Mauri, A., Eds.; Publications Office of the EU: Luxembourg, 2016; p. e01493b+. [Google Scholar]
  26. Dobrowolska, D.; Bončina, A.; Klumpp, R. Ecology and silviculture of silver fir (Abies alba Mill.): A review. J. For. Res. 2017, 22, 326–335. [Google Scholar] [CrossRef]
  27. Gazol, A.; Camarero, J.J.; Gutiérrez, E.; Popa, I.; Andreu-Hayles, L.; Motta, R.; Nola, P.; Ribas, M.; Sangüesa-Barreda, G.; Urbinati, C.; et al. Distinct effects of climate warming on populations of silver fir (Abies alba) across Europe. J. Biogeogr. 2015, 42, 1150–1162. [Google Scholar] [CrossRef] [Green Version]
  28. Bottero, A.; Forrester, D.I.; Cailleret, M.; Kohnle, U.; Gessler, A.; Michel, D.; Bose, A.K.; Bauhus, J.; Bugmann, H.; Cuntz, M.; et al. Growth resistance and resilience of mixed silver fir and Norway spruce forests in central Europe: Contrasting responses to mild and severe droughts. Glob. Change Biol. 2021, 27, 4403–4419. [Google Scholar] [CrossRef]
  29. Vitasse, Y.; Bottero, A.; Rebetez, M.; Conedera, M.; Augustin, S.; Brang, P.; Tinner, W. What is the potential of silver fir to thrive under warmer and drier climate? Eur. J. For. Res. 2019, 138, 547–560. [Google Scholar] [CrossRef]
  30. Walder, D.; Krebs, P.; Bugmann, H.; Manetti, M.C.; Pollastrini, M.; Anzillotti, S.; Conedera, M. Silver fir (Abies alba Mill.) is able to thrive and prosper under meso-Mediterranean conditions. For. Ecol. Manage. 2021, 498, 119537. [Google Scholar] [CrossRef]
  31. Camarero, J.J.; Gazol, A. Will silver fir be under higher risk due to drought? A comment on Walder et al. (2021). For. Ecol. Manage. 2022, 503, 119826. [Google Scholar] [CrossRef]
  32. Aussenac, G. Ecology and ecophysiology of circum-Mediterranean firs in the context of climate change. Ann. For. Sci. 2002, 59, 823–832. [Google Scholar] [CrossRef]
  33. Tardif, J.; Camarero, J.J.; Ribas, M.; Gutiérrez, E. Spatiotemporal variability in tree ring growth in the Central Pyrenees: Climatic and site influences. Ecol. Monogr. 2003, 73, 241–257. [Google Scholar] [CrossRef] [Green Version]
  34. Tikvić, I.; Seletković, Z.; Ugarković, D.; Posavec, S.; Španjol, Ž. Dieback of Silver Fir (Abies alba Mill.) on Northern Velebit (Croatia). Period. Biol. 2008, 110, 137–143. [Google Scholar]
  35. Ficko, A.; Poljanec, A.; Bončina, A. Do changes in spatial distribution, structure and abundance of silver fir (Abies alba Mill.) indicate its decline? For. Ecol. Manag. 2001, 261, 844–854. [Google Scholar] [CrossRef]
  36. Čavlović, J.; Bončina, A.; Božić, M.; Goršić, E.; Simončič, T.; Teslak, K. Depression and growth recovery of silver fir in uneven-aged Dinaric forests in Croatia from 1901 to 2001. Forestry 2015, 88, 586–598. [Google Scholar] [CrossRef] [Green Version]
  37. Piedallu, C.; Dallery, D.; Bresson, C.; Legay, M.; Gégout, J.C.; Pierrat, R. Spatial vulnerability assessment of silver fir and Norway spruce dieback driven by climate warming. Landsc. Ecol. 2022, 38, 341–361. [Google Scholar] [CrossRef]
  38. Gazol, A.; Sangüesa-Barreda, G.; Camarero, J.J. Forecasting forest vulnerability to drought in Pyrenean silver fir forests showing dieback. Front. For. Glob. Change 2020, 3, 36. [Google Scholar] [CrossRef] [Green Version]
  39. Hereş, A.M.; Petritan, I.C.; Bigler, C.; Curtu, A.L.; Petrea, Ş.; Petritan, A.M.; Yuste, J.C. Legacies of past forest management determine current responses to severe drought events of conifer species in the Romanian Carpathians. Sci. Tot. Environ. 2021, 751, 141851. [Google Scholar] [CrossRef] [PubMed]
  40. Sitzia, T.; Trentanovi, G.; Dainese, M.; Gobbo, G.; Lingua, E.; Sommacal, M. Stand structure and plant species diversity in managed and abandoned silver fir mature woodlands. For. Ecol. Manag. 2012, 270, 232–238. [Google Scholar] [CrossRef]
  41. Sangüesa-Barreda, G.; Camarero, J.J.; Oliva, J.; Montes, F.; Gazol, A. Past logging, drought and pathogens interact and contribute to forest dieback. Agric. For. Meteorol. 2015, 208, 85–94. [Google Scholar] [CrossRef] [Green Version]
  42. Martin-Benito, D.; Molina-Valero, J.A.; Pérez-Cruzado, C.; Bigler, C.; Bugmann, H. Development and long-term dynamics of old-growth beech-fir forests in the Pyrenees: Evidence from dendroecology and dynamic vegetation modelling. For. Ecol. Manag. 2022, 524, 120541. [Google Scholar] [CrossRef]
  43. Sabatini, F.M.; Burrascano, S.; Keeton, W.S.; Levers, C.; Lindner, M.; Pötzschner, F.; Kuemmerle, T. Where are Europe’s last primary forests? Div. Distrib. 2018, 24, 1426–1439. [Google Scholar] [CrossRef] [Green Version]
  44. Santopuoli, G.; Vizzarri, M.; Spina, P.; Maesano, M.; Mugnozza, G.S.; Lasserre, B. How individual tree characteristics and forest management influence occurrence and richness of tree-related microhabitats in Mediterranean mountain forests. For. Ecol. Manag. 2022, 503, 119780. [Google Scholar] [CrossRef]
  45. Petritan, I.C.; Commarmot, B.; Hobi, M.L.; Petritan, A.M.; Bigler, C.; Abrudan, I.V.; Rigling, A. Structural patterns of beech and silver fir suggest stability and resilience of the virgin forest Sinca in the Southern Carpathians, Romania. For. Ecol. Manag. 2015, 356, 184–195. [Google Scholar] [CrossRef]
  46. Horvat, V.; García De Vicuña, J.; Biurrun, I.; García-Mijangos, I. Managed and unmanaged silver fir-beech forests show similar structural features in the western Pyrenees. iForest-Biogeosci. For. 2018, 11, 698. [Google Scholar] [CrossRef] [Green Version]
  47. Molina-Valero, J.A.; Camarero, J.J.; Alvarez-Gonzalez, J.G.; Cerioni, M.; Hevia, A.; Sanchez-Salguero, R.; Pérez-Cruzado, C. Mature forests hold maximum live biomass stocks. For. Ecol. Manag. 2021, 480, 118635. [Google Scholar] [CrossRef]
  48. Gazol, A.; Camarero, J.J. Functional diversity enhances silver fir growth resilience to an extreme drought. J. Ecol. 2016, 104, 1063–1075. [Google Scholar] [CrossRef]
  49. Pardos, M.; Del Río, M.; Pretzsch, H.; Jactel, H.; Bielak, K.; Bravo, F.; Brazaitis, G.; Defossez, E.; Engel, M.; Godvod, K.; et al. The greater resilience of mixed forests to drought mainly depends on their composition: Analysis along a climate gradient across Europe. For. Ecol. Manag. 2021, 481, 118687. [Google Scholar] [CrossRef]
  50. Grossiord, C. Having the right neighbors: How tree species diversity modulates drought impacts on forests. New Phytol. 2020, 228, 42–49. [Google Scholar] [CrossRef] [PubMed] [Green Version]
  51. Gillerot, L.; Forrester, D.I.; Bottero, A.; Rigling, A.; Lévesque, M. Tree neighbourhood diversity has negligible effects on drought resilience of European beech, silver fir and Norway spruce. Ecosystems 2021, 24, 20–36. [Google Scholar] [CrossRef]
  52. Jourdan, M.; Kunstler, G.; Morin, X. How neighbourhood interactions control the temporal stability and resilience to drought of trees in mountain forests. J. Ecol. 2020, 108, 666–677. [Google Scholar] [CrossRef]
  53. Asbeck, T.; Großmann, J.; Paillet, Y.; Winiger, N.; Bauhus, J. The use of tree-related microhabitats as forest biodiversity indicators and to guide integrated forest management. Curr. For. Rep. 2021, 7, 59–68. [Google Scholar] [CrossRef]
  54. Lassauce, A.; Paillet, Y.; Jactel, H.; Bouget, C. Deadwood as a surrogate for forest biodiversity: Meta-analysis of correlations between deadwood volume and species richness of saproxylic organisms. Ecol. Indic. 2011, 11, 1027–1039. [Google Scholar] [CrossRef]
  55. Vítková, L.; Bače, R.; Kjučukov, P.; Svoboda, M. Deadwood management in Central European forests: Key considerations for practical implementation. For. Ecol. Manag. 2018, 429, 394–405. [Google Scholar] [CrossRef]
  56. Gazol, A.; Camarero, J.J.; Sangüesa-Barreda, G.; Vicente-Serrano, S.M. Post-drought resilience after forest die-off: Shifts in regeneration, composition, growth and productivity. Front. Plant Sci. 2018, 9, 1546. [Google Scholar] [CrossRef] [PubMed]
  57. Mayer, M.; Rosinger, C.; Gorfer, M.; Berger, H.; Deltedesco, E.; Bässler, C.; Müller, J.; Seifert, L.; Rewald, B.; Godbold, D.L. Surviving trees and deadwood moderate changes in soil fungal communities and associated functioning after natural forest disturbance and salvage logging. Soil Biol. Biochem. 2022, 166, 108558. [Google Scholar] [CrossRef]
  58. Vigo, J.; Ninot, J.M. Los Pirineos; Peinado Lorca, M., Rivas-Martínez, S., Eds.; La vegetación de España; Publicaciones de la Universidad de Alcalá de Henares: Alcalá de Henares, Spain, 1987; pp. 351–384. [Google Scholar]
  59. Martín, E.; Cobos, J.M. Graves ataques de perforadores en los abetales de Ansó (Huesca). Boletín Sanid. Veg. Y Plagas 1986, 12, 297–298. [Google Scholar]
  60. Vicente-Serrano, S.M.; Tomas-Burguera, M.; Beguería, S.; Reig, F.; Latorre, B.; Peña-Gallardo, M.; Luna, M.Y.; Morata, A.; González-Hidalgo, J.C. A high resolution dataset of drought indices for Spain. Data 2017, 2, 22. [Google Scholar] [CrossRef] [Green Version]
  61. Vicente-Serrano, S.M.; Beguería, S.; López-Moreno, J.I. A multiscalar drought index sensitive to global warming: The standardized precipitation evapotranspiration index. J. Clim. 2010, 23, 1696–1718. [Google Scholar] [CrossRef] [Green Version]
  62. Cottam, G.; Curtis, J.T. The use of distance measure in phytosociological sampling. Ecology 1956, 37, 451–460. [Google Scholar] [CrossRef]
  63. Dobbertin, M. Tree growth as indicator of tree vitality and of tree reaction to environmental stress: A review. Eur. J. For. Res. 2005, 124, 319–333. [Google Scholar] [CrossRef]
  64. Müller, E.H.R.; Stierlin, H.R. Sanasilva Tree Crown Photos with Percentages of Foliage Loss; WSL-Swiss Federal Institute for Forest, Snow and Landscape Research: Birmensdorf, Switzerland, 1990. [Google Scholar]
  65. Redfern, D.B.; Boswell, R.C. Assessment of crown condition in forest trees: Comparison of methods, sources of variation and observer bias. For. Ecol. Manag. 2004, 188, 149–160. [Google Scholar] [CrossRef]
  66. Solberg, S. Summer drought: A driver for crown condition and mortality of Norway spruce in Norway. For. Pathol. 2004, 34, 93–104. [Google Scholar] [CrossRef]
  67. Van Wagner, C.E. The line intersect method for forest fuel sampling. For. Sci. 1968, 14, 20–26. [Google Scholar]
  68. De Long, S.C.; Sutherland, G.D.; Daniels, L.D.; Heemskerk, B.H.; Storaunet, K.O. Temporal dynamics of snags and development of snag habitats in wet spruce-fir stands in east-central British Columbia. For. Ecol. Manag. 2008, 255, 3613–3620. [Google Scholar] [CrossRef]
  69. Fritts, H.C. Tree Rings and Climate; Academic Press: London, UK, 1976. [Google Scholar]
  70. Holmes, R.L. Computer-assisted quality control in tree-ring dating and measurement. Tree Ring Bull. 1983, 43, 69–78. [Google Scholar]
  71. Klesse, S. Critical note on the application of the “two-third” spline. Dendrochronologia 2021, 65, 125786. [Google Scholar] [CrossRef]
  72. Nowacki, G.J.; Abrams, M.D. Radial-growth averaging criteria for reconstructing disturbance histories from presettlement-origin oaks. Ecol. Monogr. 1997, 67, 225–249. [Google Scholar] [CrossRef]
  73. Guiot, J. The boostrapped response function. Tree-Ring Bull. 1991, 51, 39–41. [Google Scholar]
  74. R Core Team. R: A Language and Environment for Statistical Computing. R Foundation for Statistical Computing, Vienna, Austria. 2022. Available online: https://www.R-project.org/ (accessed on 10 January 2023).
  75. Bunn, A.G. A dendrochronology program library in R (dplR). Dendrochronologia 2008, 26, 115–124. [Google Scholar] [CrossRef]
  76. Bunn, A.G. Statistical and visual crossdating in R using the dplR library. Dendrochronologia 2010, 28, 251–258. [Google Scholar] [CrossRef]
  77. Bunn, A.; Korpela, M.; Biondi, F.; Campelo, F.; Mérian, P.; Qeadan, F.; Zang, C. dplR: Dendrochronology Program Library in R. 2022, R Package Version 1.7.4. Available online: https://CRAN.R-project.org/package=dplR (accessed on 10 January 2023).
  78. Altman, J.; Fibich, P.; Dolezal, J.; Aakala, T. TRADER: A package for Tree Ring Analysis of Disturbance Events in R. Dendrochonologia 2014, 32, 107–112. [Google Scholar] [CrossRef]
  79. Zang, C.; Biondi, F. treeclim: An R package for the numerical calibration of proxy-climate relationships. Ecography 2015, 38, 431–436. [Google Scholar] [CrossRef]
  80. Wei, T.; Simko, V. R Package ‘Corrplot’: Visualization of a Correlation Matrix. 2021, R Package Version 0.92. Available online: https://github.com/taiyun/corrplot (accessed on 10 January 2023).
  81. Hijmans, R. Raster: Geographic Data Analysis and Modeling. 2022, R Package Version 3.5-29. Available online: https://CRAN.R-project.org/package=raster (accessed on 10 January 2023).
  82. Bujoczek, L.; Bujoczek, M.; Zięba, S. How much, why and where? Deadwood in forest ecosystems: The case of Poland. Ecol. Indic. 2021, 121, 107027. [Google Scholar] [CrossRef]
  83. Kermavnar, J.; Marinšek, A.; Eler, K.; Kutnar, L. Evaluating short-term impacts of forest management and microsite conditions on understory vegetation in temperate fir-beech forests: Floristic, ecological, and trait-based perspective. Forests 2019, 10, 909. [Google Scholar] [CrossRef] [Green Version]
  84. Valerio, M.; Ibáñez, R.; Gazol, A. The role of canopy cover dynamics over a decade of changes in the understory of an Atlantic beech-oak forest. Forests 2021, 12, 938. [Google Scholar] [CrossRef]
  85. Horvat, V.; Heras, P.; García-Mijangos, I.; Biurrun, I. Intensive forest management affects bryophyte diversity in the western Pyrenean silver fir-beech forests. Biol. Conserv. 2017, 215, 81–91. [Google Scholar] [CrossRef]
  86. Chevaux, L.; Mårell, A.; Baltzinger, C.; Boulanger, V.; Cadet, S.; Chevalier, R.; Debaive, N.; Dumas, Y.; Gosselin, M.; Gosselin, F.; et al. of stand structure and ungulates on understory vegetation in managed and unmanaged forests. Ecol. Appl. 2022, 32, e2531. [Google Scholar] [CrossRef]
  87. Horvat, V.; Biurrun, I.; García-Mijangos, I. Herb layer in silver fir–beech forests in the western Pyrenees: Does management affect species diversity? For. Ecol. Manag. 2017, 385, 87–96. [Google Scholar] [CrossRef]
Figure 1. Location of the studied silver fir forests in Europe (a) and the Spanish Pyrenees (b) and defoliation degree (c) for each stand. The location of the studied site in Europe is highlighted by a red box in (a). The background map in (a,b) represents spatial variations in mean annual precipitation (MAP). Each stand is indicated with its code in (b). The black lines in (a,b) indicate the limits of the distribution range of silver fir. See site codes in Table 1.
Forests 14 00713 g001
Figure 2. Number of major growth releases per site during the period 1900–2016 (ak) and average number of releases per year in each site (l). The colors in the last chart are proportional to the average percentage of releases. See site codes in Table 1.
Forests 14 00713 g002
Figure 3. Growth and responses to climate of silver fir trees. The correlations between growth and maximum temperature (a) and the 3-month long SPEI (b) are shown as grey lines (red symbols indicate significant correlations). The panel in (c) shows how the average growth (BAI, basal area increment; symbol size is directly proportional to BAI) of trees in each stand depends on year (color scale), 3-month July SPEI (x axis) and previous September maximum temperature (y axis). Note that the 1986 year, with an extremely hot drought, resulted in the formation or extremely narrow rings (orange circles in the upper left corner).
Forests 14 00713 g003
Figure 4. Distribution of deadwood volume (black bars) and the density of stumps and snags (brown bars) per site.
Forests 14 00713 g004
Figure 5. Correlation between the studied variables. Abbreviations are as follows: defoliation, percentage of severely defoliated and dead trees; silver-fir BA, silver fir basal area; density, stand density; Releases, average percentage of releases; stumps BA, stumps basal area; T. Sept. cor., correlation between growth and previous September maximum temperature; SPEI cor, correlation between growth and 3-month July SPEI; deadwood vol., deadwood volume; deadwood cov., deadwood cover; and Bs cover, cover of B. sempervirens in the understory. The color scale indicates the value of Spearman correlation coefficients with circle values corresponding to significant correlations (p < 0.05).
Forests 14 00713 g005
Table 1. Studied stands, and their location and main characteristics. For each stand, the latitude, longitude and elevation is shown together with the average diameter of silver fir trees, the basal area and tree density. In addition, the percentage of trees severely defoliated (defoliation classes 3–5) and dead, as well as the cover of the main understory plant species present in the transect, is shown.
Site (Code)Latitude (N)Longitude (−W, +E)Elevation (m a.s.l.)Diameter at 1.3 m (cm)Basal Area of Silver
Fir/Other Species 1 (m2 ha−1)
Density of Silver Fir/Other Species 1 (inds. ha−1)Percentage of
Severely Defoliated (Dead) Trees
Understory Plant Cover 1 (%)
Fago (FA)42.730−0.87091833.79 ± 15.6868.7/1.6 (Ps)1273/20 (Fs, Ps)7.7 (0.0)2.30 (Bs), 0.90 (Hn)
Paco Ezpela (PE)42.741−0.827123227.84 ± 10.2321.7/17.3 (Fs)/16.8 (Ps)659/119 (Fs, Ps, Qs)26.3 (10.6)9.20 (Bs), 1.80 (Ia)
Gamueta (GA)42.880−0.800140062.07 ± 17.1737.6/18.1 (Fs)775/1867 (Fs)0.0 (0.0)---
Selva de Oza (SO)42.830−0.716119535.67 ± 9.3134.0/9.1 (Fs)1939/470 (Fs)0.0 (0.0)---
Paco Mayor (PM)42.700−0.640135323.48 ± 9.7722.0/14.4 (Ps)/4.2 (Fs)454/20 (Ps, Fs, Qs)24.1 (17.2)8.00 (Bs), 0.50 (Ia)
Lierde (LI)42.691−0.545122243.18 ± 21.23109.2/16.5 (Ps)910/68 (Ps)9.1 (0.0)6.60 (Bs), 0.50 (Ia)
Castiello de Jaca (CA)42.639−0.534117539.35 ± 9.7171.6/1.3 (QSf)564/47 (Ps, Qs)23.7 (21.1)8.40 (Bs), 0.60 (Ia)
Peña Oroel (PO)42.520−0.520160429.05 ± 8.5947.9/9.2 (Ps)1948/9 (Ps)18.2 (9.1)33.10 (Bs), 1.48 (Hn)
Paco de Villanúa (VI)42.680−0.510127033.48 ± 9.4368.0/2.1 (Ps)578/50 (Ps)18.2 (15.9)4.20 (Ia), 2.10 (Bs)
Diazas (DI)42.630−0.080152831.41 ± 12.5353.4/7.3 (Ps)917/35 (Ps, Sa)0.0 (0.0)4.20 (Bs), 0.30 (Dl)
Ballibierna (BA)42.6300.560160036.42 ± 14.4188.19270.0 (0.0)1.45 (Bs)
1 Species abbreviations: Ps, Pinus sylvestris; Fs, Fagus sylvatica; Qs, Quercus subpyrenaica; Sa, Sorbus aria; Bs, Buxus sempervirens; Ia, Ilex aquifolium; Hn, Hepatica nobilis; Dl, Daphne laureola.
Table 2. Tree ring width data of the sampled silver fir sites. Abbreviations: AR1, first-order autocorrelation; BAI, basal area increment; SD, standard deviation, TRW, tree ring width.
SiteNo. TreesNo. RadiiAge at 1.3 m (y)TRW (mm)SD (mm)BAI (cm2)SD (cm2)Trend BAI (cm2 y−1)AR1
FA25501372.501.0117.380.84−0.350.75
PE39701881.350.748.810.550.050.81
GA29594621.520.7621.160.650.130.86
SO20402012.381.1021.260.430.040.84
PM38741701.530.9312.940.55−0.570.81
LI3467953.111.3631.590.55−0.050.71
CA17342251.140.687.510.37−0.140.83
PO12241501.450.588.870.20−0.030.79
VI33551401.820.8512.220.71−0.310.84
DI16271122.881.2219.500.970.330.83
BA32541732.361.0524.330.53−0.150.81
Table 3. Characteristics of deadwood according to the degree of decomposition and basal area, and density of stumps. The site codes are as in Table 1. The presence of snags was recorded in each site, and the lying deadwood was classified according to the degree of decomposition, into five categories (see Methods). In addition, the lying deadwood volume and cover were calculated using the line intercept method, and we also quantified the density and basal area of stumps, considering both silver fir as well as other species. The density and basal area and stumps were classified to the species level when possible due to the decomposition grade.
SitePresence of SnagsAverage Decomposition Grade (1–5)Deadwood Volume (m3 ha−1)Deadwood Cover (%)Stump Basal Area of All Species–Silver Fir/Other Tree Species 1 (m2 ha−1)Stump Density of All Species–Silver Fir/Other Tree Species 1 (No. ha−1)
FAYes251.23.89.9–5.2/3.7 (Ps)140–80/40 (Ps)
PEYes293.83.240.1–12.8/27.2 (Ps)400–180/200 (Ps)
GAYes383.52.570.9160
SZYes329.91.727.2–14.7/1.29 (Fs)320–180/120 (Fs)
PMYes421.00.721.7–7.8/1.9 (Ps)300–120/20 (Ps)
LINo123.11.210.460
CAYes2.5175.54.618.8160
POYes2.581.13.05.6300
VIYes2214.14.414.4100
DIYes385.43.137.55–2.0/26.4 (Ps)360–20/200 (Ps)
BANo341.22.716.9–14.8/2.1 (Ps)320–220/100 (Ps)
1 Species abbreviations: Ps, Pinus sylvestris; Fs, Fagus sylvatica.
Disclaimer/Publisher’s Note: The statements, opinions and data contained in all publications are solely those of the individual author(s) and contributor(s) and not of MDPI and/or the editor(s). MDPI and/or the editor(s) disclaim responsibility for any injury to people or property resulting from any ideas, methods, instructions or products referred to in the content.

