Article

The Effects of Monthly Rainfall and Temperature on Flowering and Fruiting Intensities Vary within and among Selected Woody Species in Northwestern Ethiopia

1
Ethiopian Biodiversity Institute, Addis Ababa P.O. Box 30726, Ethiopia
2
Department of Range and Forest Resources, Botswana University of Agriculture and Natural Resources, Private Bag 0027, Gaborone P.O. Box 47204, Botswana
3
Department of Plant Biology and Biodiversity Management, Addis Ababa University, Addis Ababa P.O. Box 3434, Ethiopia
*
Author to whom correspondence should be addressed.
Forests 2023, 14(3), 541; https://doi.org/10.3390/f14030541
Submission received: 17 January 2023 / Revised: 27 February 2023 / Accepted: 6 March 2023 / Published: 9 March 2023
(This article belongs to the Special Issue Biodiversity and Conservation of Forests)

Abstract

:
The phenological responses of plants to climatic variables are critical for conservation planning; however, it is less understood in an Afrotropical context. Here, we observed how flowering and fruiting phenophases of seven indigenous plant species are related to monthly rainfall and temperature for 24 months in Ethiopia. We employed linear and non-linear models to test the effects on flowering and fruiting intensity. The results of the linear model showed that flowering intensity decreased with increasing monthly temperature for Maytenus arbutifolia, Prunus africana, and Solanecio gigas, but increased for Bersama abyssinica, and decreased with increasing monthly rainfall for Maytenus arbutifolia. The results of the non-linear model indicated that the flowering intensity of Brucea antidysenterica, Dombeya torrida and Rosa abyssinica decreased, leveled off and increased with increasing monthly temperature. Moreover, the fruiting intensity of Brucea antidysenterica and Rosa abyssinica decreased with increasing monthly rainfall, but increased for Bersama abyssinica; The fruiting intensity increased with increasing monthly temperature for Brucea antidysenterica and Rosa abyssinica. Altogether, the effects of climatic variables not only vary among the species, but also among the phenophases of a plant species. Hence, considering these varied effects in forest conservation schemes is critical, especially during the epoch of this continuing climate change.

1. Introduction

Phenology is the study of the periodicity or timing of biological events such as the timing of plant flowering or bird migration, triggered by environmental cues taking place during the year [1,2]. The causes of their timing are affected by biotic and abiotic forces and the interrelation among phases of the same or different species [3]. The climate is the main factor controlling and regulating phenological events in plants, and global warming has affected species distributions and the timing of leaf change and reproduction [4]. How plants respond to changing patterns of temperature and precipitation has major implications for agriculture, forestry, growing season dynamics and ecosystem processes [5].
Plant phenology variations have long been used as indicators of ongoing climate change conditions [6]. Phenology has become important in the context of understanding climate change impacts on ecosystems [7]. Phenology closely tracks climate and also drives many ecological interactions, making the study of phenology essential for predicting how species will respond to climate change [8,9,10].
Plant phenology is typically quantified by observing the date of onset and the duration of particular phenophases [4]. In general, the study of phenological aspects of plants involves the observation, recording and interpretation of the timing of biological events, such as seed dispersal, germination, vegetative growth, flowering, fruiting and leaf flushing all affected by seasonal changes [8]. Tree phenology observations involve bud growth, leaf emergence, flowering, fruiting and leaf fall activities in seasons with variations in environmental and climatic factors, such as temperature and precipitation [11]. Plant phenology could offer much information on the conditional changes of global climate and the consequent shifts in plant life events, as their recorded dates provide a high-temporal resolution of ongoing changes [4]. Understanding the genetic and physiological mechanisms that plants use for the timing of seasonal responses allows for predicting phenological responses to anthropogenic climate change [12].
A better understanding of plant phenology will assist land managers, seed collectors and other stakeholders to make more informed decisions relating to the management of these species. Plant species phenology is used to realize the vegetative and reproductive potential of the species and in developing viable local conservation strategies [13]. Understanding the phenology of invasive plant species can also help to design control mechanisms [14].
Phenological patterns in plants are influenced by a combination of biotic and abiotic factors that determine the occurrence and inhibition of physiological events [15]. The abiotic and biotic factors are not mutually exclusive, and several are likely to interact to regulate the expression of each phenological phase [3]. Phenology is used to assess the consequences of global warming on plant distributions [16]. However, plant phenology responses to invariant cues, such as photoperiods, may be important in defining the timing, periodicity and particularly the synchrony of plant reproduction, especially in tropical environments where climatic seasonality is low [17].
In tropical ecosystems, phenology might be less sensitive to temperature and photoperiod and more tuned to seasonal shifts in precipitation, as seasons are often marked by differences in rainfall and life-history events occurring in response to water availability [3]. Periodic changes in rainfall, which are caused by movements of the Inter-Tropical Convergence Zone often, play an important role [18]. In forests with a marked dry season, flowering may be more sensitive to seasonal rainfall, changes in water availability and soil moisture, and their fruits ripen towards the end of the dry season or at the beginning of the rainy season [19].
Tropical phenology is characterized by its high diversity due to small annual changes in day length and temperature and the absence of a cool season that hampers growth [20]. Within a tropical forest, species differ in phenological patterns and community-wide phenological patterns differ among regions that differ in climate patterns [21]. Even within a community, phenological cycles vary from species that reproduce multiple times per year to those that reproduce only once in several years [22]. At higher latitudes, since these habitats may be under snow or ice, almost all phenology is tied to a single highly variable event, the timing of snowmelt [23].
Scientific knowledge of the phenology of plant species is basic for the understanding of biological processes and the functioning of the forest ecosystem [24]. Serious effects on biodiversity can result from altered phenologies due to enhanced asynchrony in ecological interactions such as plant–insect and predator–prey interactions, leading to reduced fitness and ultimately extinctions [25]. Moreover, phenology is the major determinant of the plant species range, so it can be used to assess the consequences of global warming on plant distributions [16].
Regarding the phenology of Ethiopian plant species, few studies have been carried out in different floristic regions of Ethiopia. To name a few, the phenology of seven indigenous trees in the dry Afromontane of Munessa-Shashemene Forest, South Ethiopia [24], phenological events in Commiphora myrrha and Boswellia neglecta in Southeastern Ethiopia [13], phenology of the alien invasive plant species Prosopis juliflora in arid and semi-arid [14] and flowering and fruiting phenology of some forest plant species in Western Ethiopia Combretum-Terminalia Woodlands [26]. However, no research findings have been found in the Gojjam floristic region. The present study is the first detailed study on the phenology of flowering and fruiting of seven indigenous tree species categorized under six families of the dry tropical montane forest of this region in Ethiopia for two years from December 2018 to November 2020.
The specific questions addressed in this study were (1) what are the frequency, timing and duration of flowering and fruiting of selected tree species at the study site and (2) which environmental factors (temperature and rainfall) have the greatest influence on triggering these phenological events?

2. Materials and Methods

2.1. Study Area

The study area is located in Machakel woreda, East-Gojjam Zone, Amahara National regional State (ANRS) of Ethiopia (Figure 1) between 10°19′75″–10°41′00″ N and 37°16′46″–37°45′42″ E l. The vegetation of the study area belongs to the dry evergreen Afromontane forest [27]. The maximum monthly temperature is 28.5 °C and the minimum monthly temperature is 9.8 °C. The average monthly temperature is 18 °C and the area receives the mean annual rainfall of 1397 mm with a unimodal pattern that peaks between June to October.

2.2. Study Species

A reconnaissance survey was conducted to select the forest and the study species. Three vegetation patches with similar physiological characteristics and agroecological zones were selected during the reconnaissance survey. To select the study species, from each patch, we used the criteria of (1) dominant woody species in the patches and assumed to play key roles in shaping the ecological system of the patches; (2) species which provide substantial provisional and cultural ecosystem services of wood products, food, medicinal and fodder values; and (3) species whose population are currently declining due to overexploitation for the mentioned services [28,29,30,31,32,33]. Consequently, seven indigenous tree species, namely Bersama abyssinca Fresen., Brucea antidysenterica J.F. Mill., Solanecio gigas (Vatke) C. Jeffrey, from the Embuli forest patch Dombeya torrida (J. F. Gmel.) P. Bamps, Maytenus arbutifolia (A. Rich.) Wilczek, Rosa abyssinica Lindley from Zhingder and Prunus africana (Hook. f.) Kalkm from Woynagbar were selected for the study. Plant spcies such as Acacia abyssinica, Buddleja polystachya, Embelia schimperi, Phytolacca dodecandra, Vernonia amygdalina, Carissa spinarum, Rubus spp. and Maesa lanceolata were also observed during the survey.

2.3. Data Collection

A total of 112 reproductive, healthy individual trees/plant species having similar crown sizes (visual estimation) were selected for the study. For each tree species, 16 individuals with their diameter at breast height (DBH) ranging from 10 to 60 cm, were randomly selected 100 m far apart from each other, tagged with plastic ribbon and the locations also recorded using GPS. The data of flowering and fruiting phenophases were collected every month for two years (December 2018–November 2020). During each visit, flowering and fruiting phenophases were recorded through careful observation of the canopy.
The whole crown of each tree was examined and binocular was also used to observe the crowns of tall trees. The intensity of flowering (the number of flower buds and open flowers) and fruiting (the number of unripe and ripe fruits) in each tree crown was assigned to four different classes: 0 (0%), 1 (1%–25%), 2 (26%–50%), 3 (51%–75%) and 4 (>75%) with the percentage values referring to the estimated proportions of each phenophase in the crown by adopting the method used by Tesfaye et al. [24]. The data on monthly rainfall and average monthly temperature of the area were obtained from the National Meteorological Agency of Ethiopia.

2.4. Data Analyses

The data on flowering and fruiting intensity and the effects of monthly rainfall and temperature were analyzed using descriptive, linear and non-linear models. The rainfall data were standardized or scaled to bring the values to a comparable level with the temperature data before running the models and in data visualizations. Before we ran the actual test, we first checked for the multicollinearity between the mean monthly rainfall and temperature explanatory variables. From the scatter plots, we visualized how the relationships between either flowering or fruiting and rainfall/temperature of most species varied not only between species but also among phenophases of the same species. Accordingly, we used the linear model when the relationship between explanatory and response variables is linear, but for non-linear relationships, we used a quadratic polynomial or non-linear regression model to test the effects of monthly temperature and rainfall on flowering and fruiting intensity of Bersama abyssinica, Brucea antidysenterica, Dombeya torrida, Prunus africana, Maytenus arbutifolia, Rosa abyssinica and Solanecio gigas. Moreover, we employed the non-linear regression model to test the effects of temperature and rainfall on the flowering intensity of Brucea antidysenterica, Dombeya torrida and Rosa abyssinica, and on the fruiting intensity of Dombeya torrida, Maytenus arbutifolia, Prunus africana and Solanecio gigas. For all of the analyses, we used the R program [34].

3. Results

3.1. Flowering Phenology

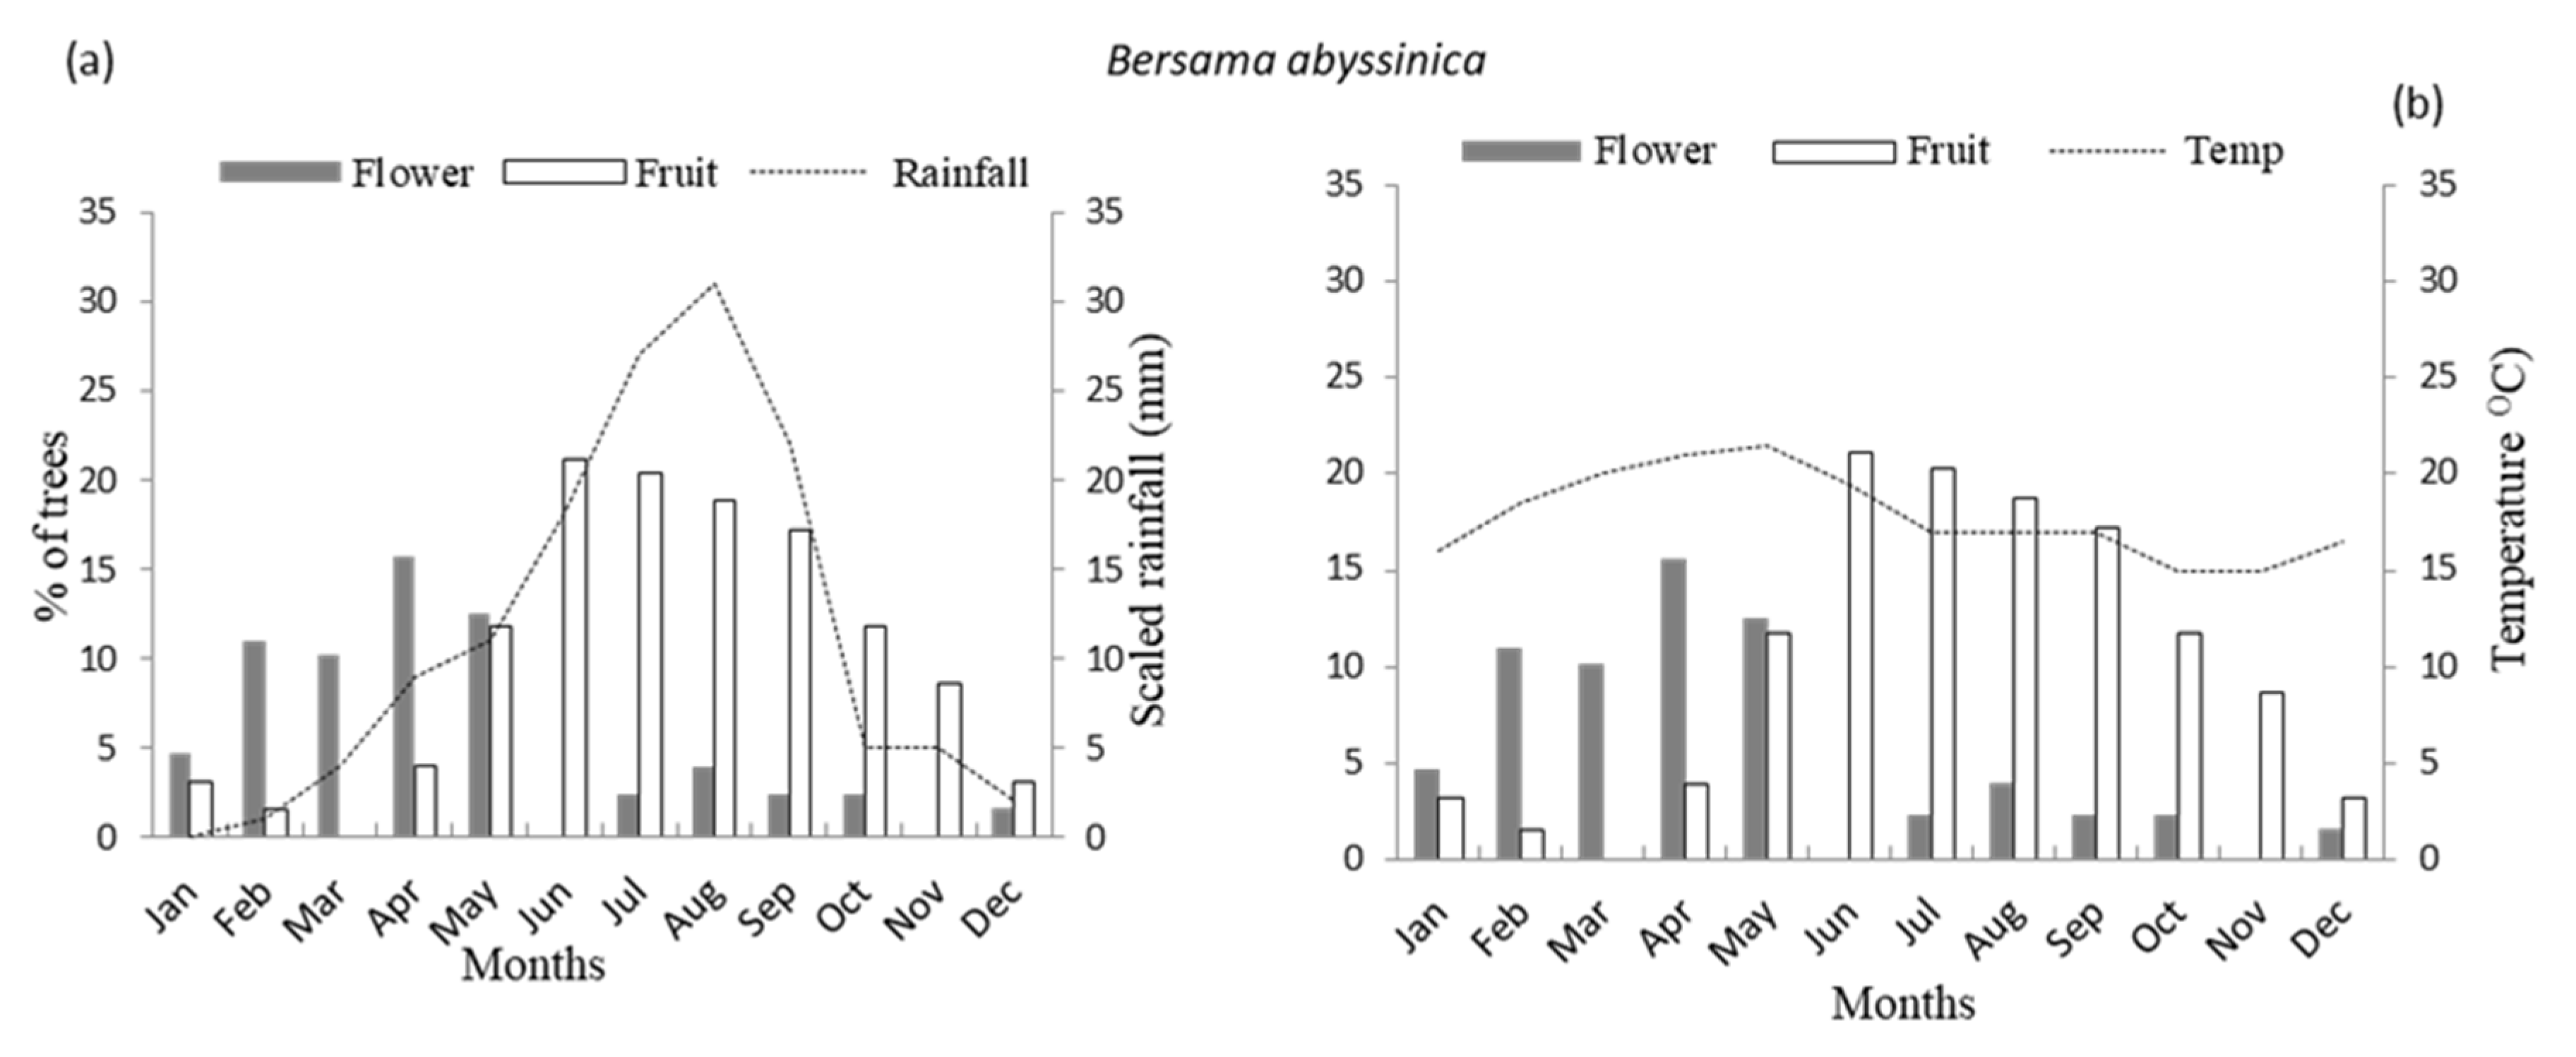
All species flowered annually during the two-year study period where flowers were observed every year with a unimodal pattern. Observation of flowering periodicity showed both strongly seasonal and continuous flowering patterns throughout the months of the years, ranging from three to twelve months (Figure 2, Figure 3, Figure 4, Figure 5, Figure 6, Figure 7 and Figure 8).
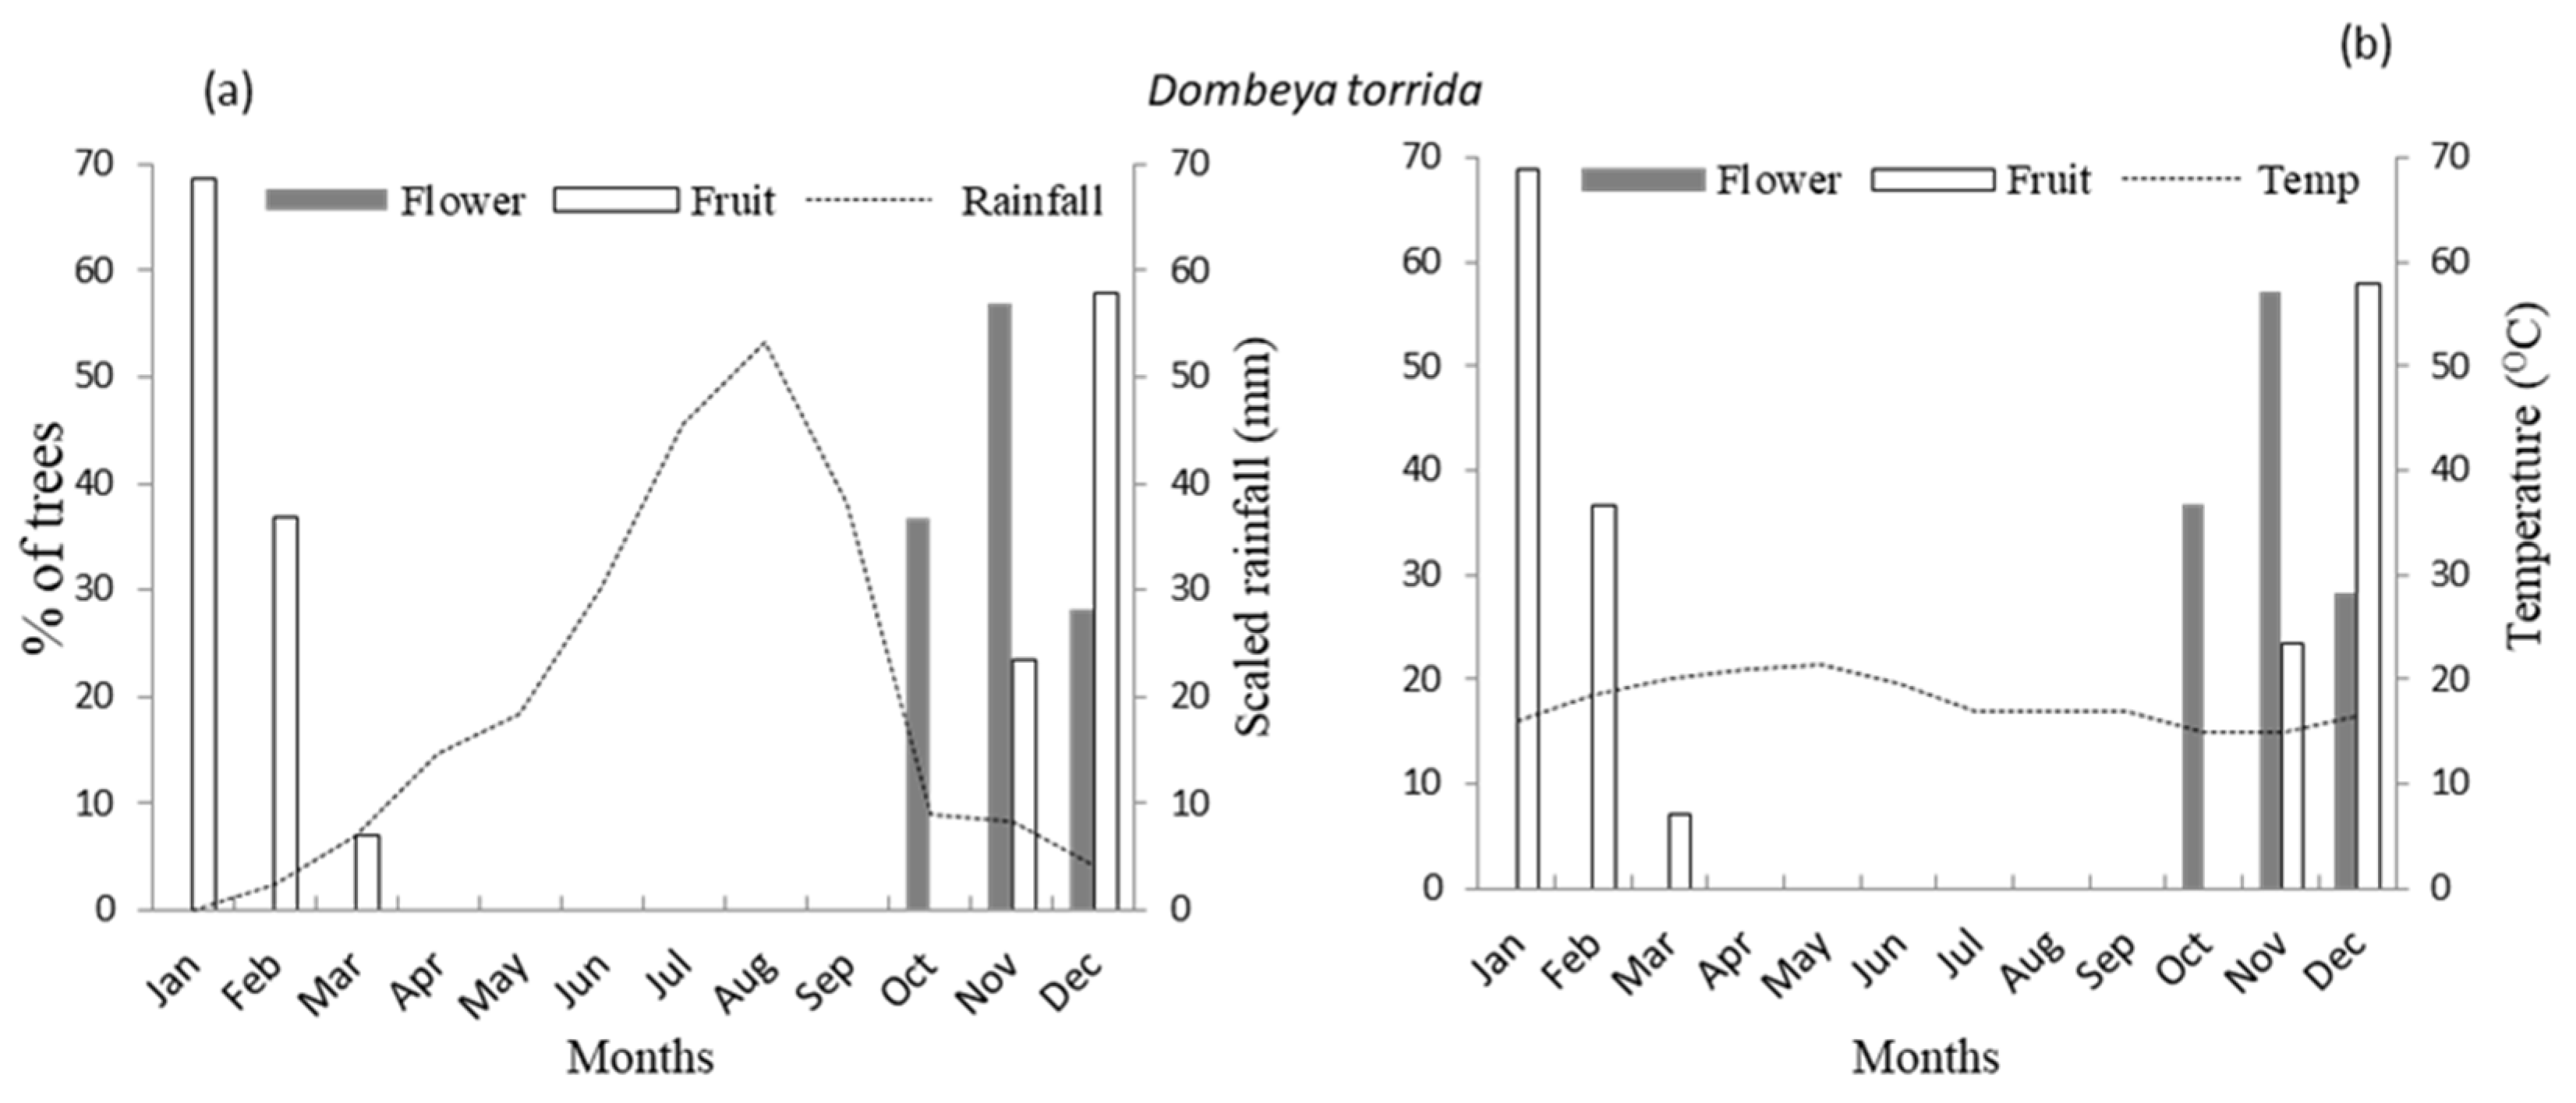
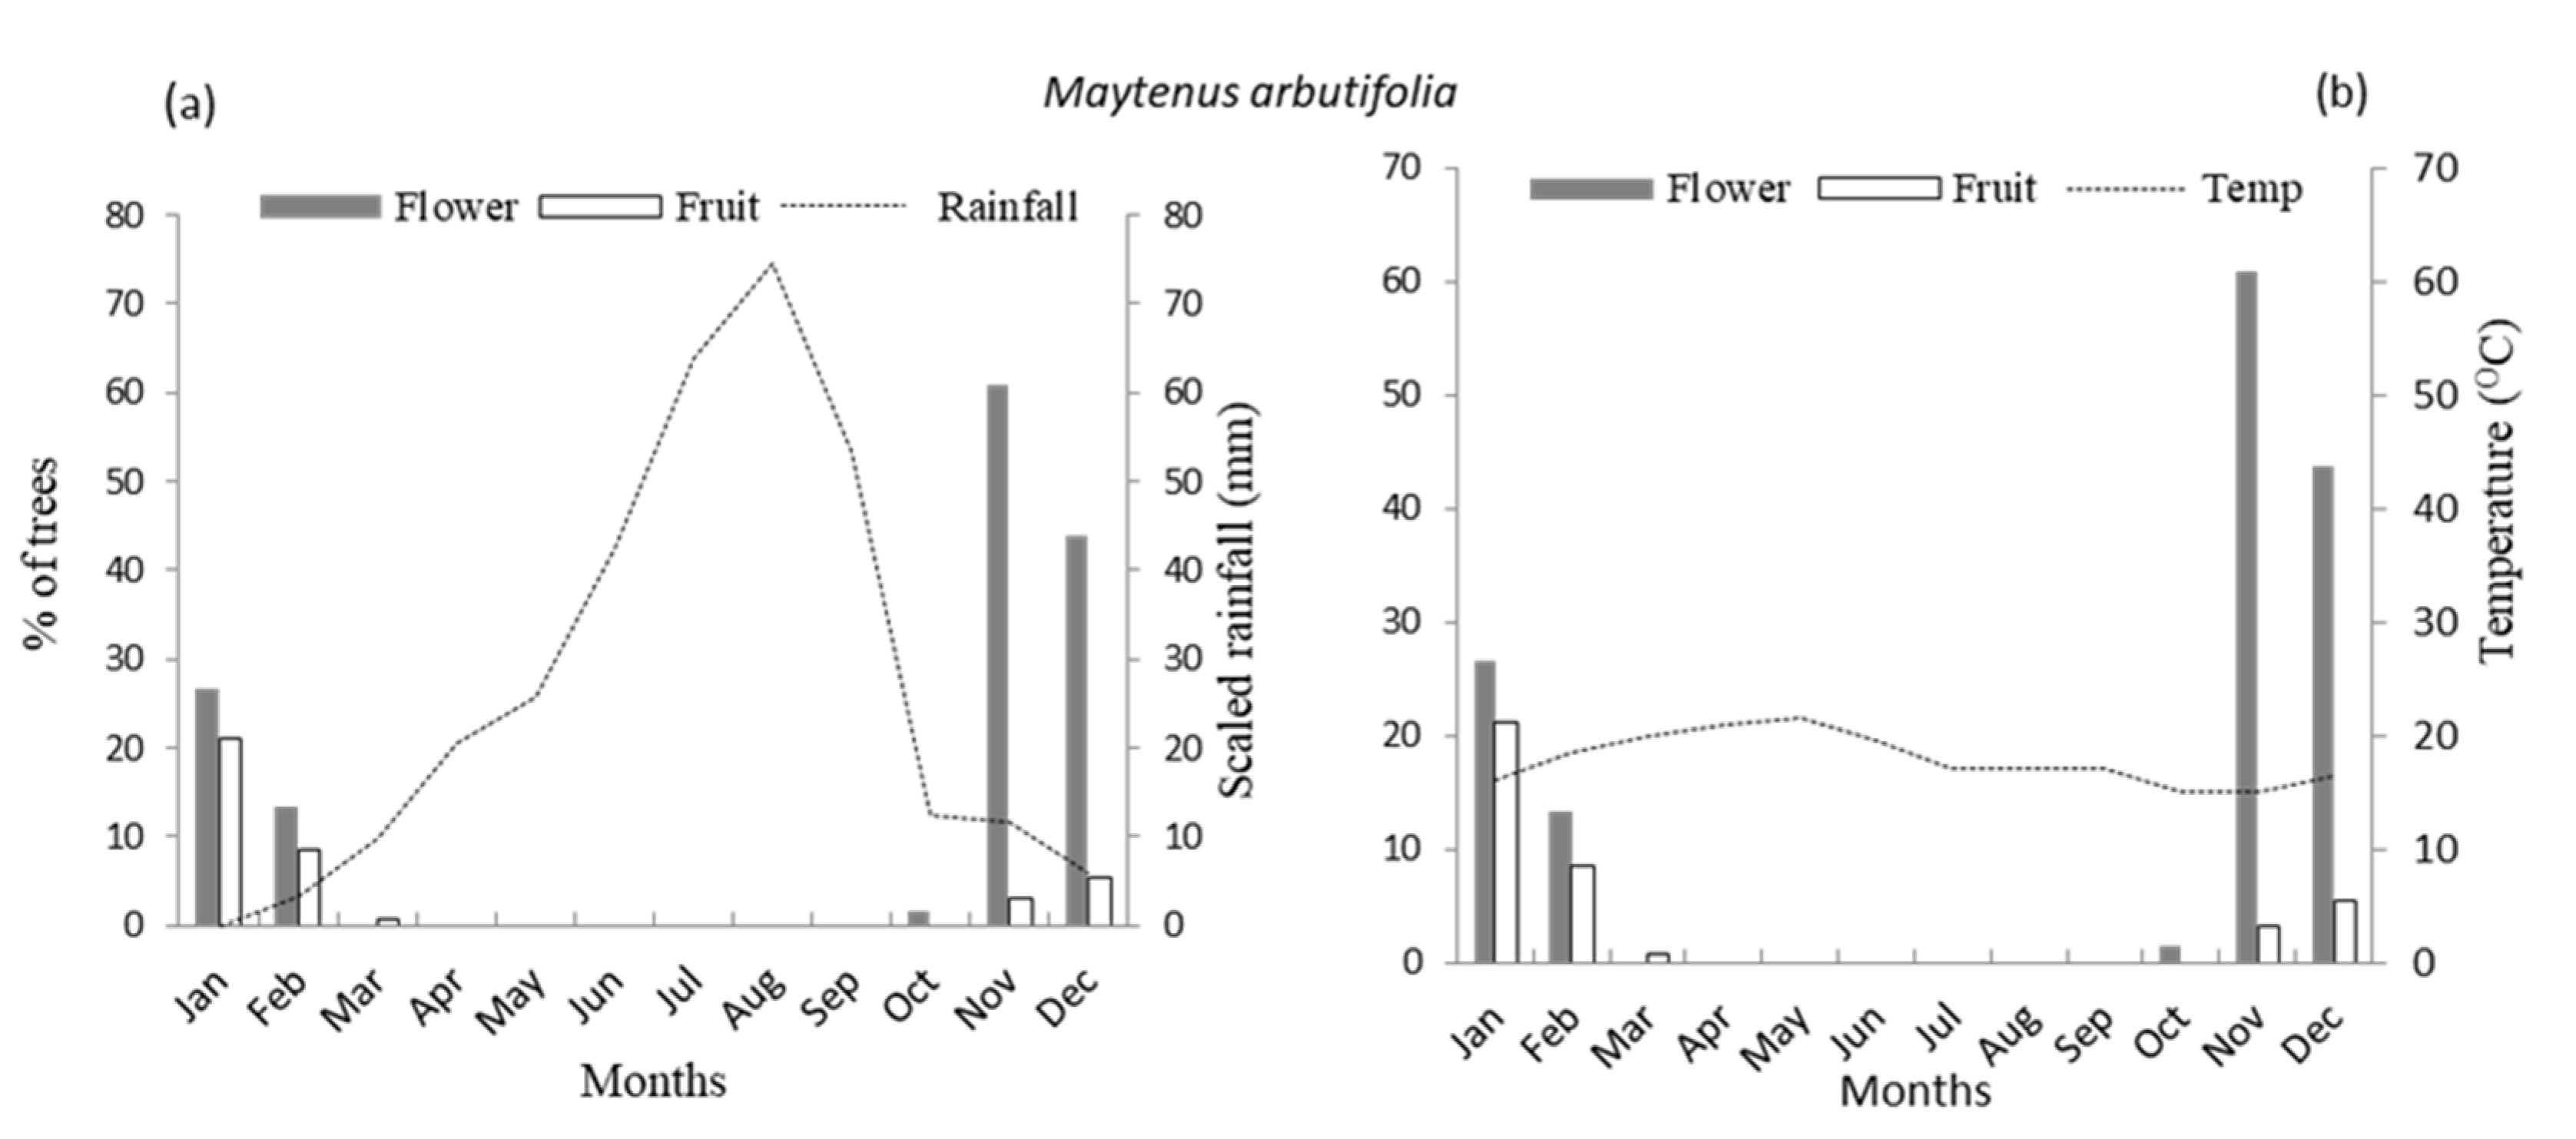
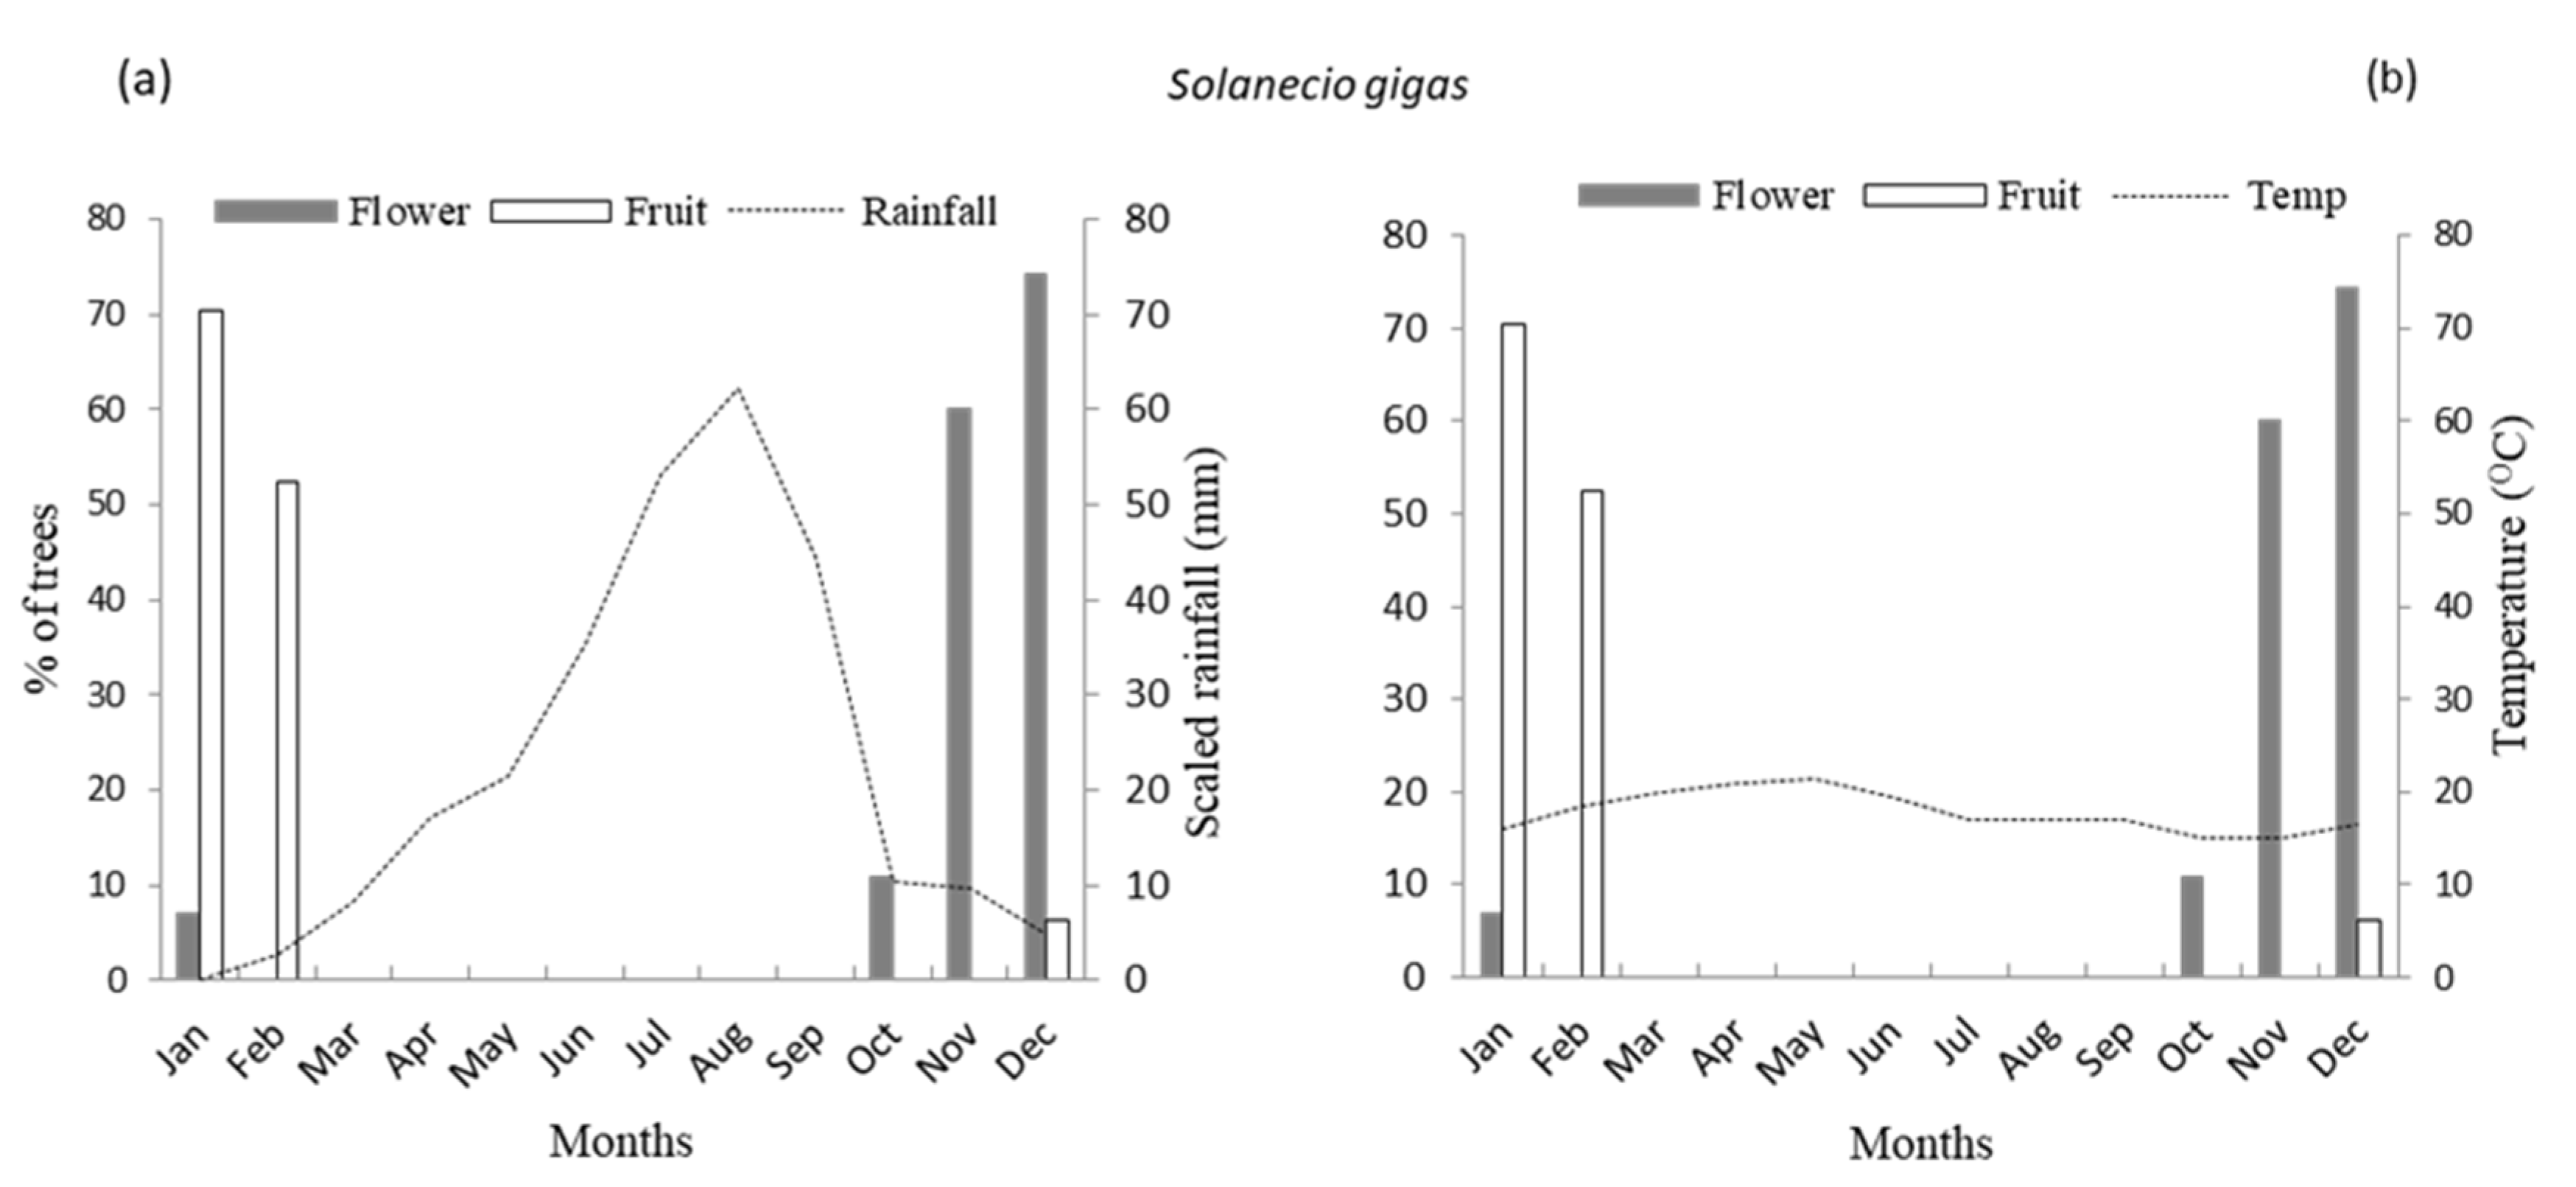
Seasonality in the flowering pattern was exhibited by four species: Dombeya torrida, Maytenus arbutifolia, Prunus africana and Solanecio gigas where flowering lasted for three to five months with a unimodal pattern (Figure 4, Figure 5 and Figure 8). A relatively shorter flowering period was observed for Dombeya torrida and Prunus africana as flowering lasted for only three months and, generally, began in early October and continued into late December (Figure 4 and Figure 6). The duration of flowering months for Maytenus arbutifolia and Solanecio gigas were four and five months, respectively (Figure 2, Figure 5 and Figure 8). The results showed that Bersama abyssinica, Brucea antidysenterica, and Rosa abyssinica exhibited continuous flowering (Figure 2, Figure 3 and Figure 7).
The onset and peak flowering periods of most study species coincided with the end of the rainy season or the beginning of the long dry season (Figure 2, Figure 3, Figure 4, Figure 5, Figure 6, Figure 7 and Figure 8). The onset of flowering of most seasonal flowering species was October and peak flowering was November (Figure 2, Figure 3, Figure 4, Figure 5, Figure 6, Figure 7 and Figure 8). However, for Bersama abyssinica, even though the flowering is not seasonal, the highest number of individuals flowering was observed at the beginning of the rainy season (Figure 2a). On the contrary, Brucea antidysenterica flowering was observed throughout the seasons, but significantly peaked at the end of the rainy season or the beginning of the dry season (Figure 3a).
A linear regression model test showed that the flowering intensity of Bersama abyssinica increases with increasing temperature (p = 0.01, Table 1, Figure 9a). However, the flowering intensity decreases with increasing temperature for Maytenus arbutifolia (p < 0.01), Prunus africana (p = 0.04), and Solanecio gigas (p = 0.036, Table 1, Figure 9b–d). On the other hand, flowering intensity decreases with increasing rainfall for Maytenus arbutifolia (p = 0.011, Table 1, Figure 9e).
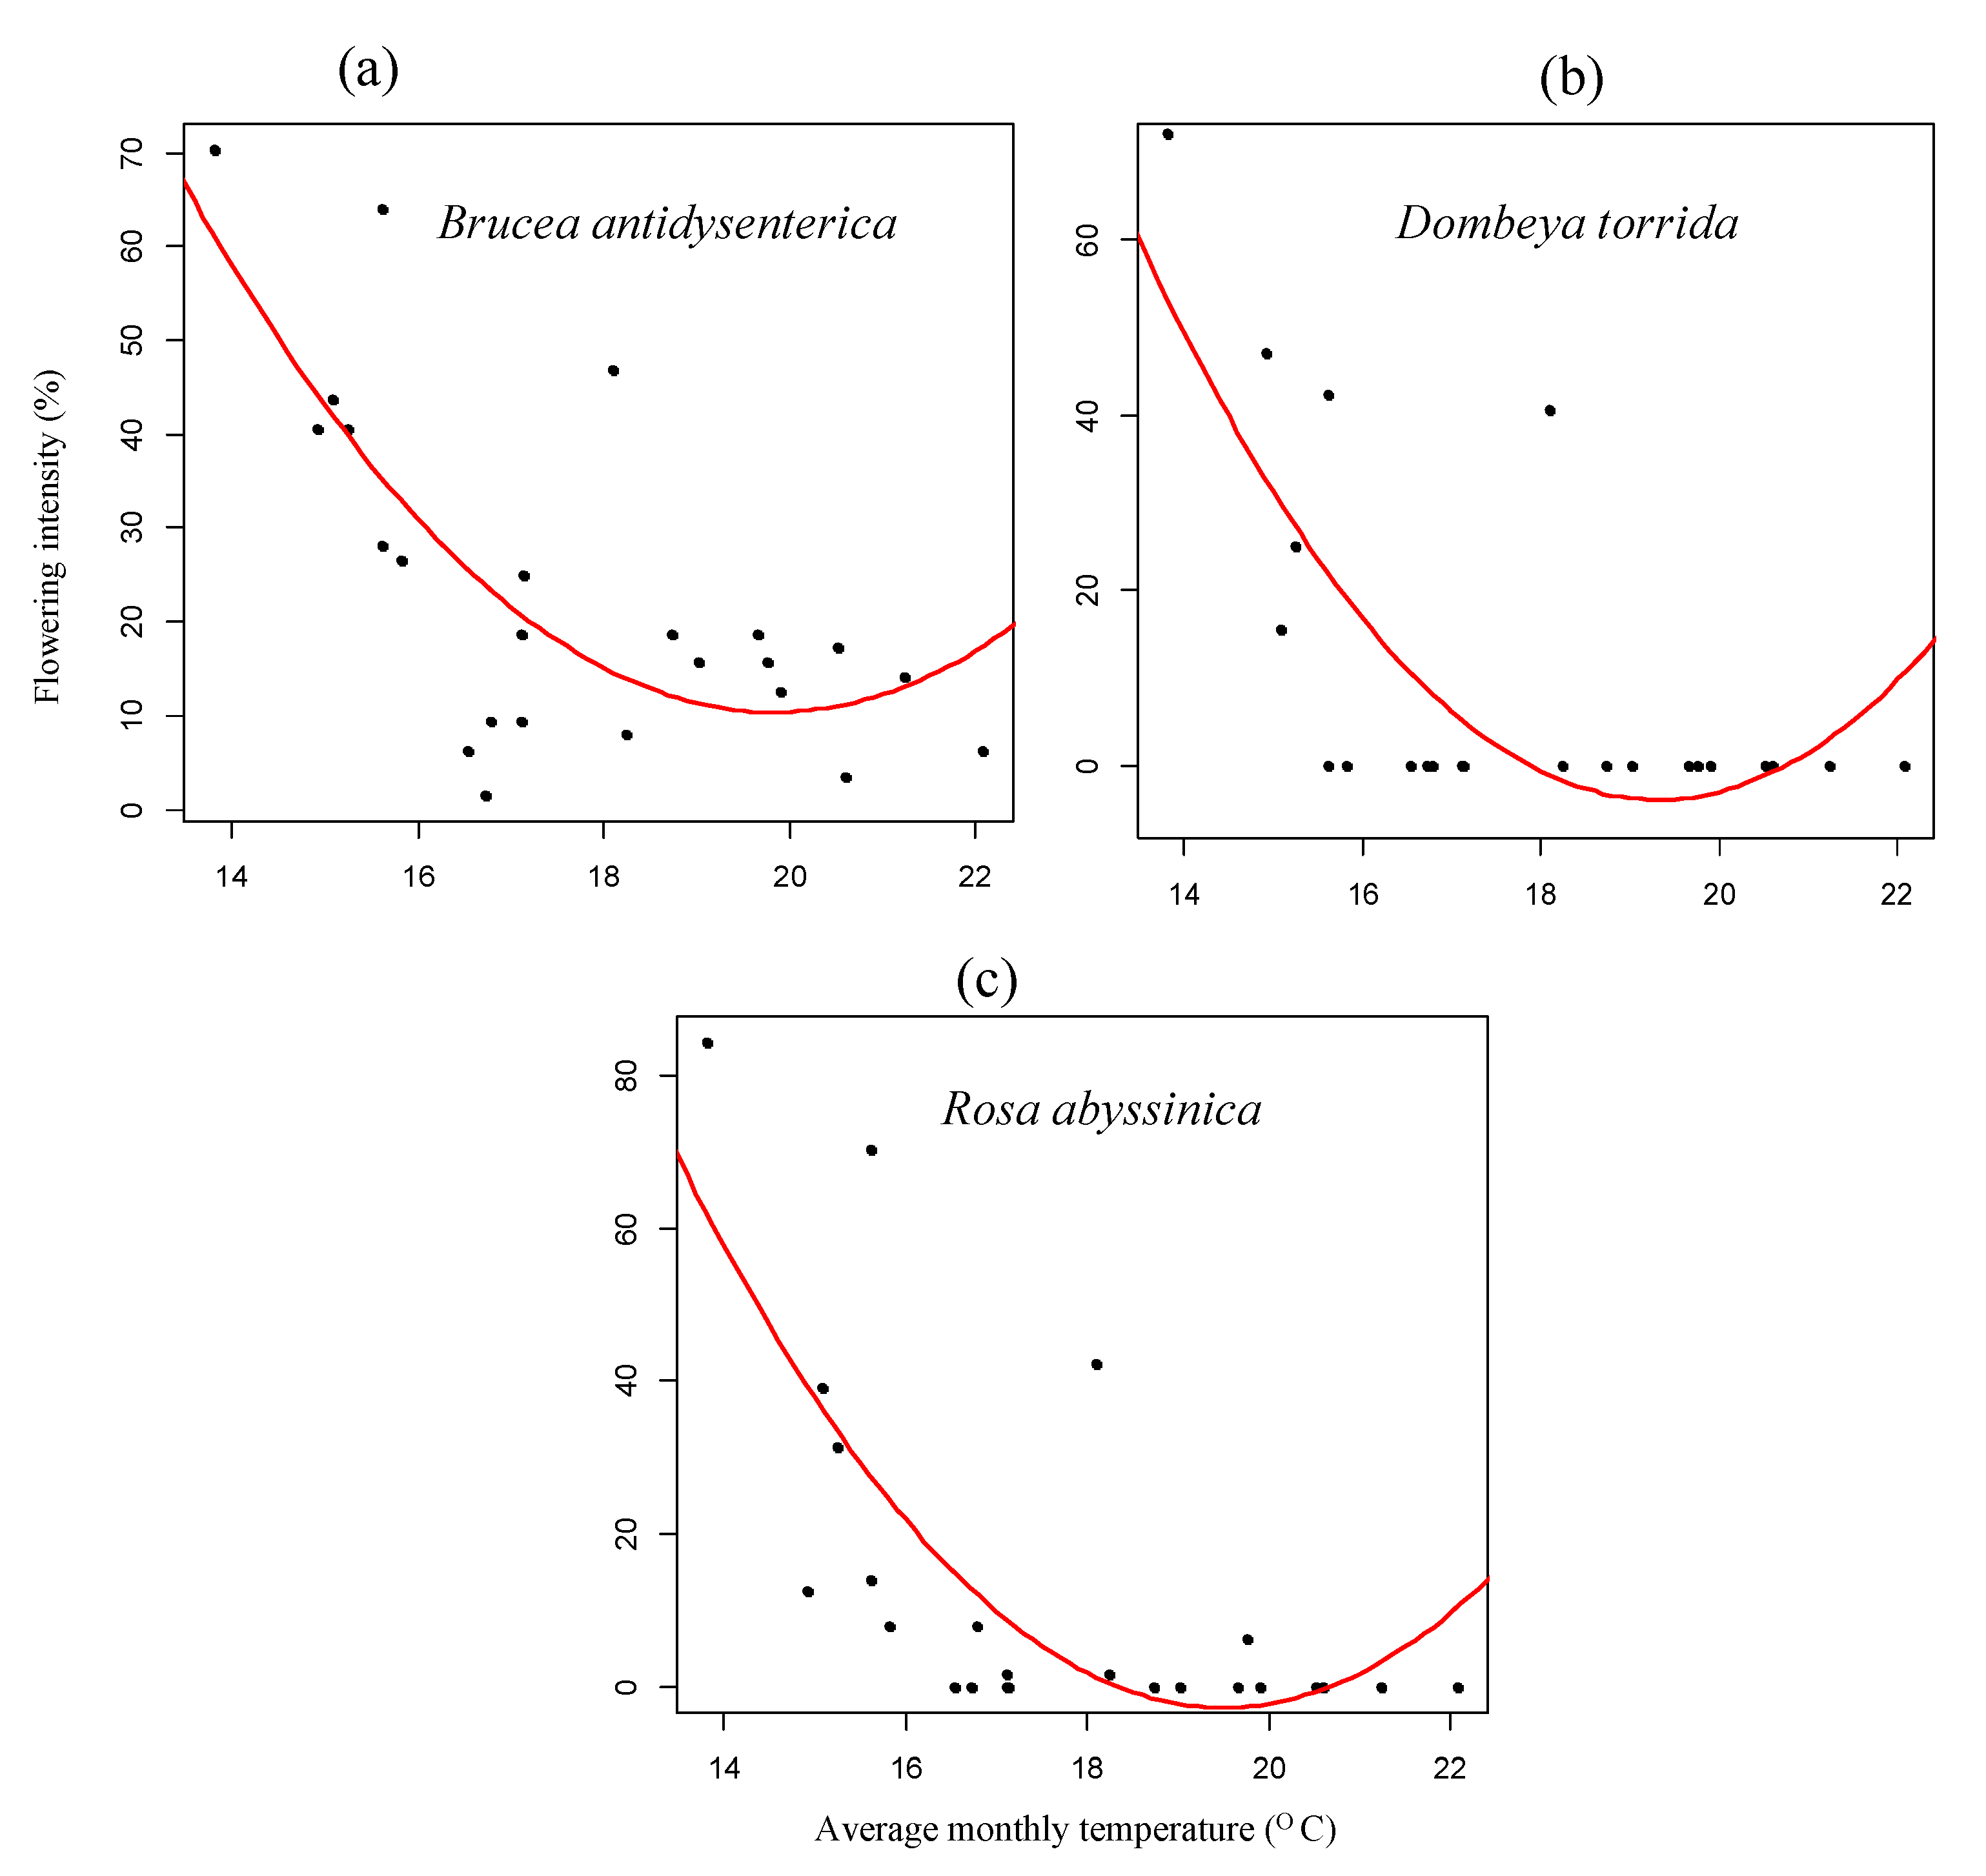
Similarly, the result of the non-linear quadratic polynomial regression model analysis indicated that temperature has both significant decreasing and increasing effects on the flowering percent of the study species (Figure 10). The results of the non-linear models showed that the flowering intensity was decreased, flattened and dropped, and indicated a slightly increasing trend with increasing monthly rainfall for Dombeya torrida and Rosa abyssinica (p < 0.01, Table 2, Figure 10). There was no flowering recorded between the range of temperature around 16 °C and 20 °C (Figure 4 and Figure 7, Figure 10b,c). The temperature shows a significant effect on the flowering of Brucea antidysentrica where flowering intensity decreases with increasing temperature (p = 0.01, Table 2, Figure 10a). However, the flowering of Brucea antidysentrica was observed all over the months of the year (Figure 3).

3.2. Fruiting Phenology

In most species, fruiting observed extended over several months of the year compared to flowering (Figure 2, Figure 3, Figure 4, Figure 5, Figure 6, Figure 7 and Figure 8). For most species, the fruiting intensity has been observed to decline towards the beginning of the rainy season (Figure 4, Figure 5, Figure 6, Figure 7 and Figure 8). Fruits were seen almost year-round in the case of Bersama abyssinica and Brucea antidysenterica. However, peak fruiting was observed in the middle of the rainy season and at the beginning of the rainy season, respectively (Figure 2 and Figure 3).
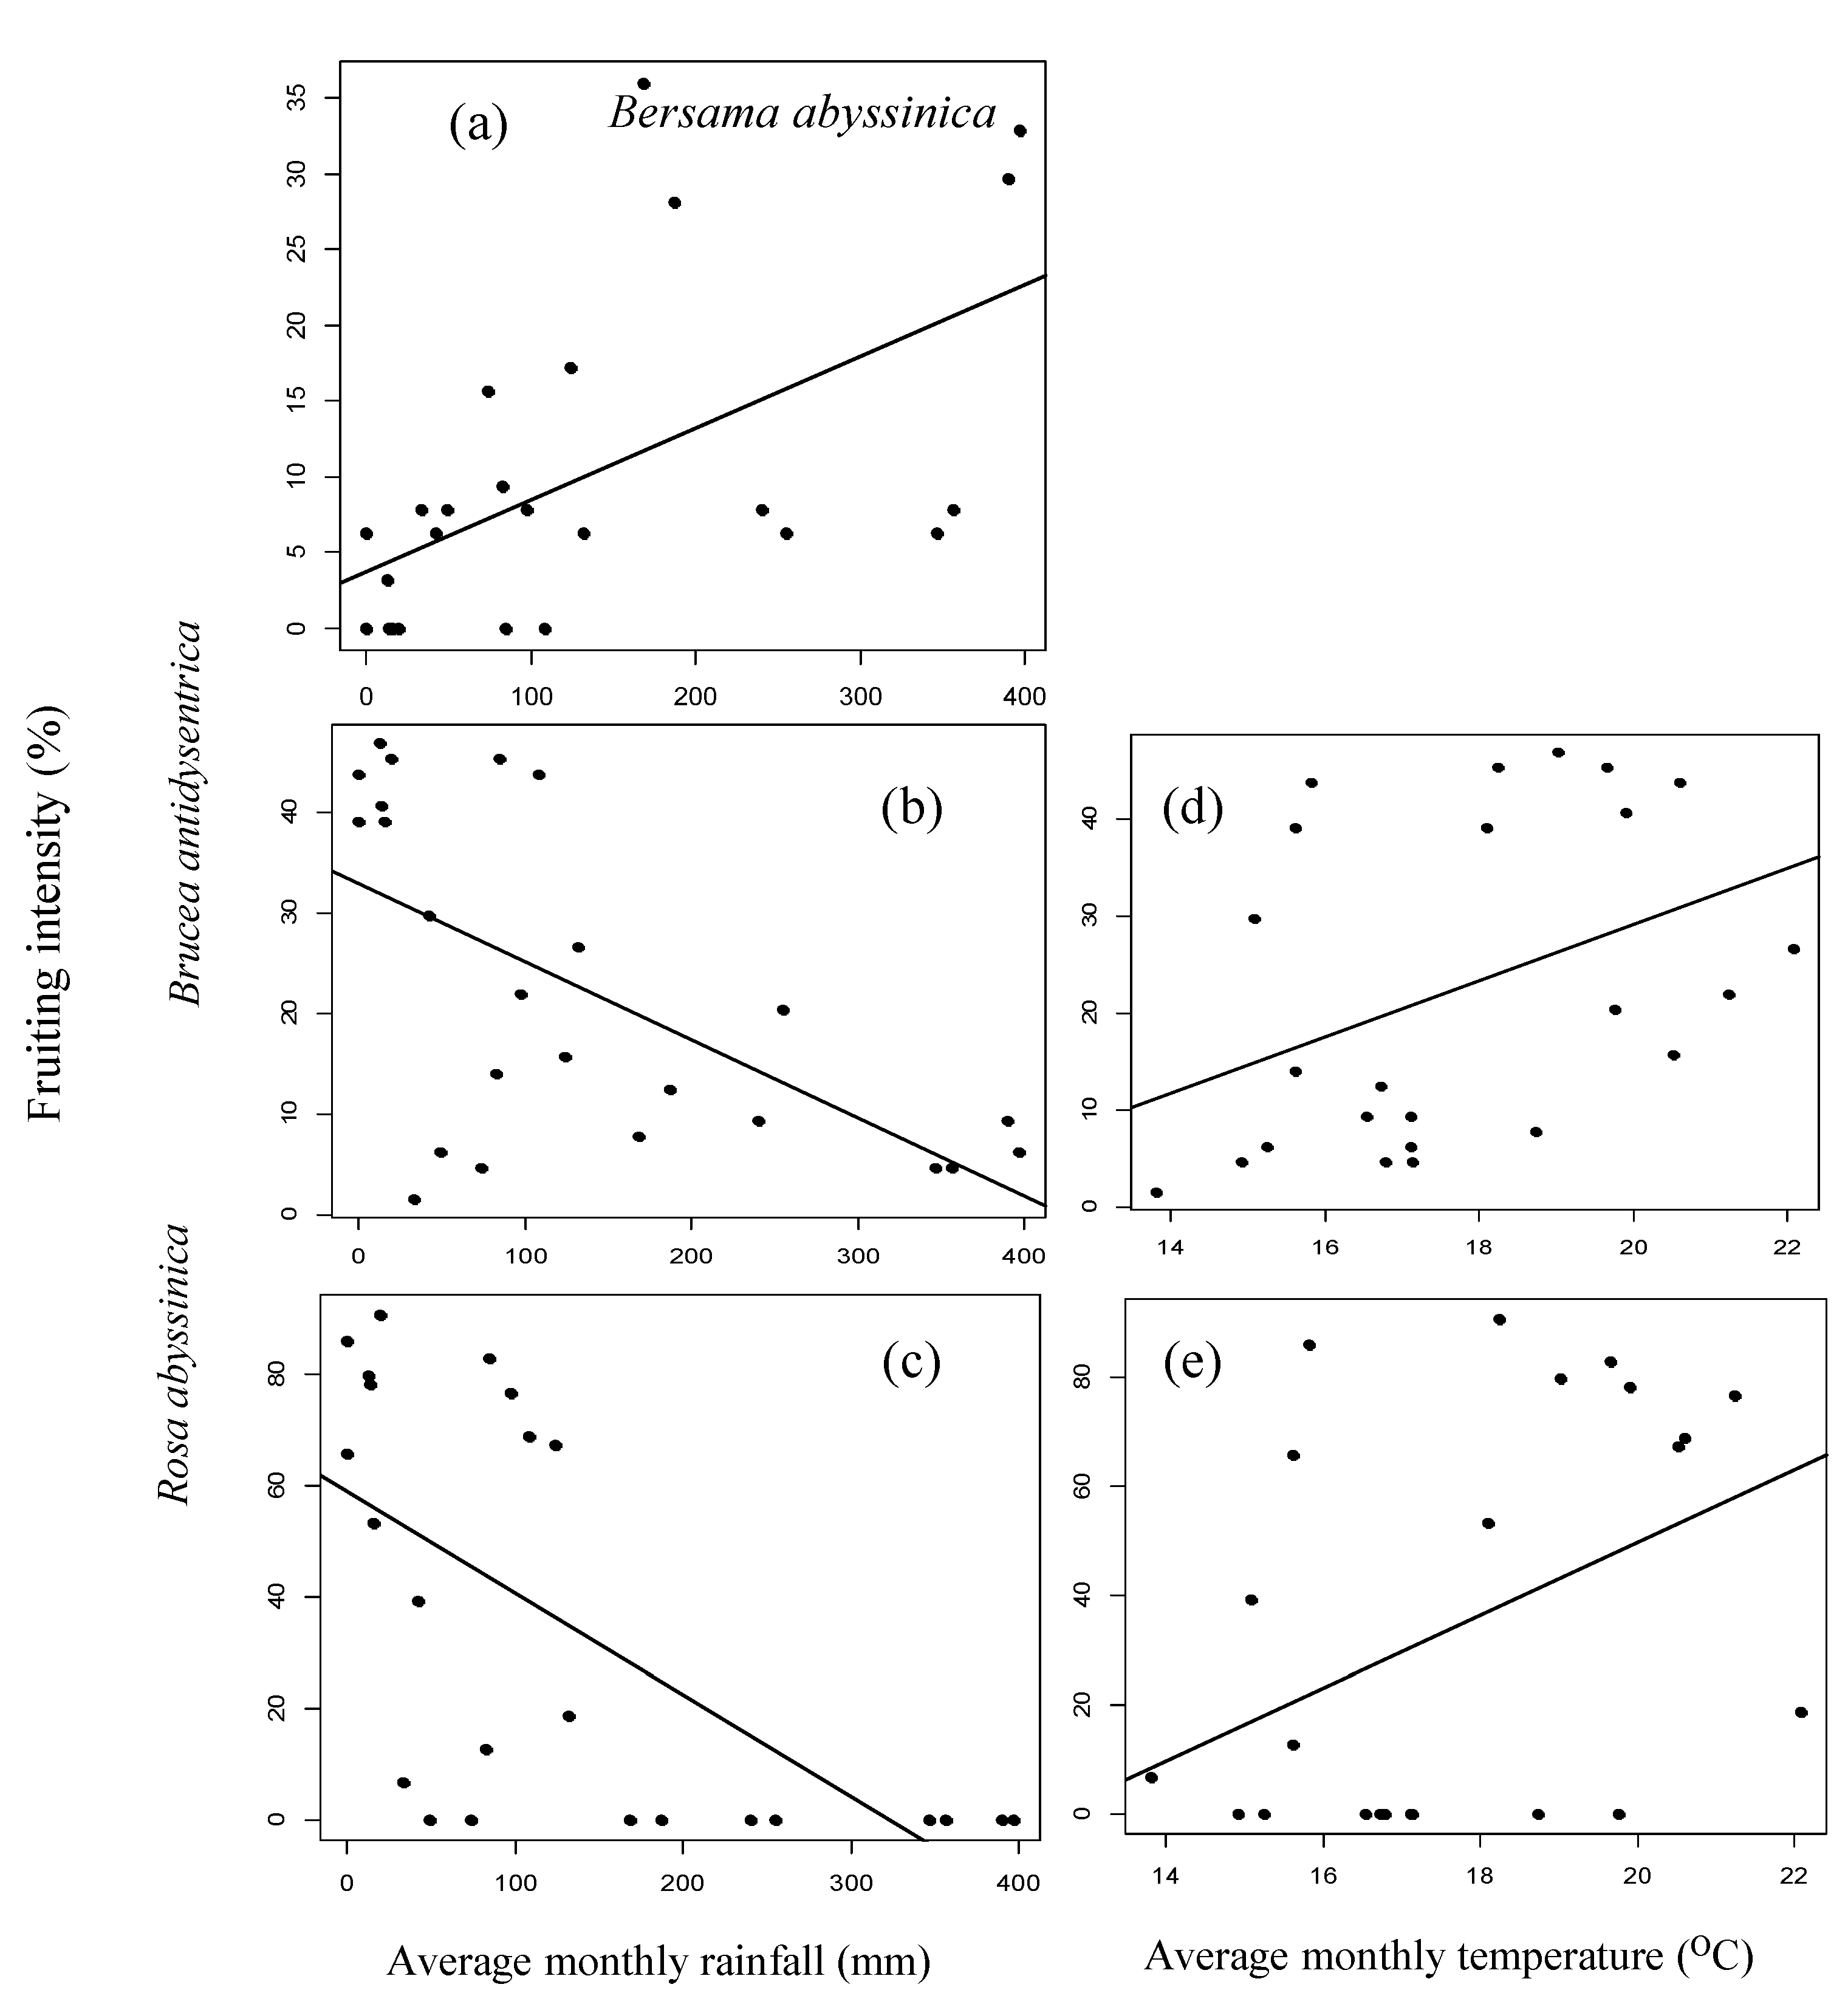
The general linear model analysis showed that fruiting was significantly decreased with increasing monthly rainfall for Brucea antidysenterica (p < 0.01) and Rosa abyssinica (p < 0.01) (Table 3, Figure 11b,c); whereas, it increased with increasing average monthly temperature (p < 0.01, Table 3, Figure 11d,e). The fruiting intensity of Bersama abyssinica increased with increasing monthly rainfall (p < 0.01, Table 3, Figure 11a).
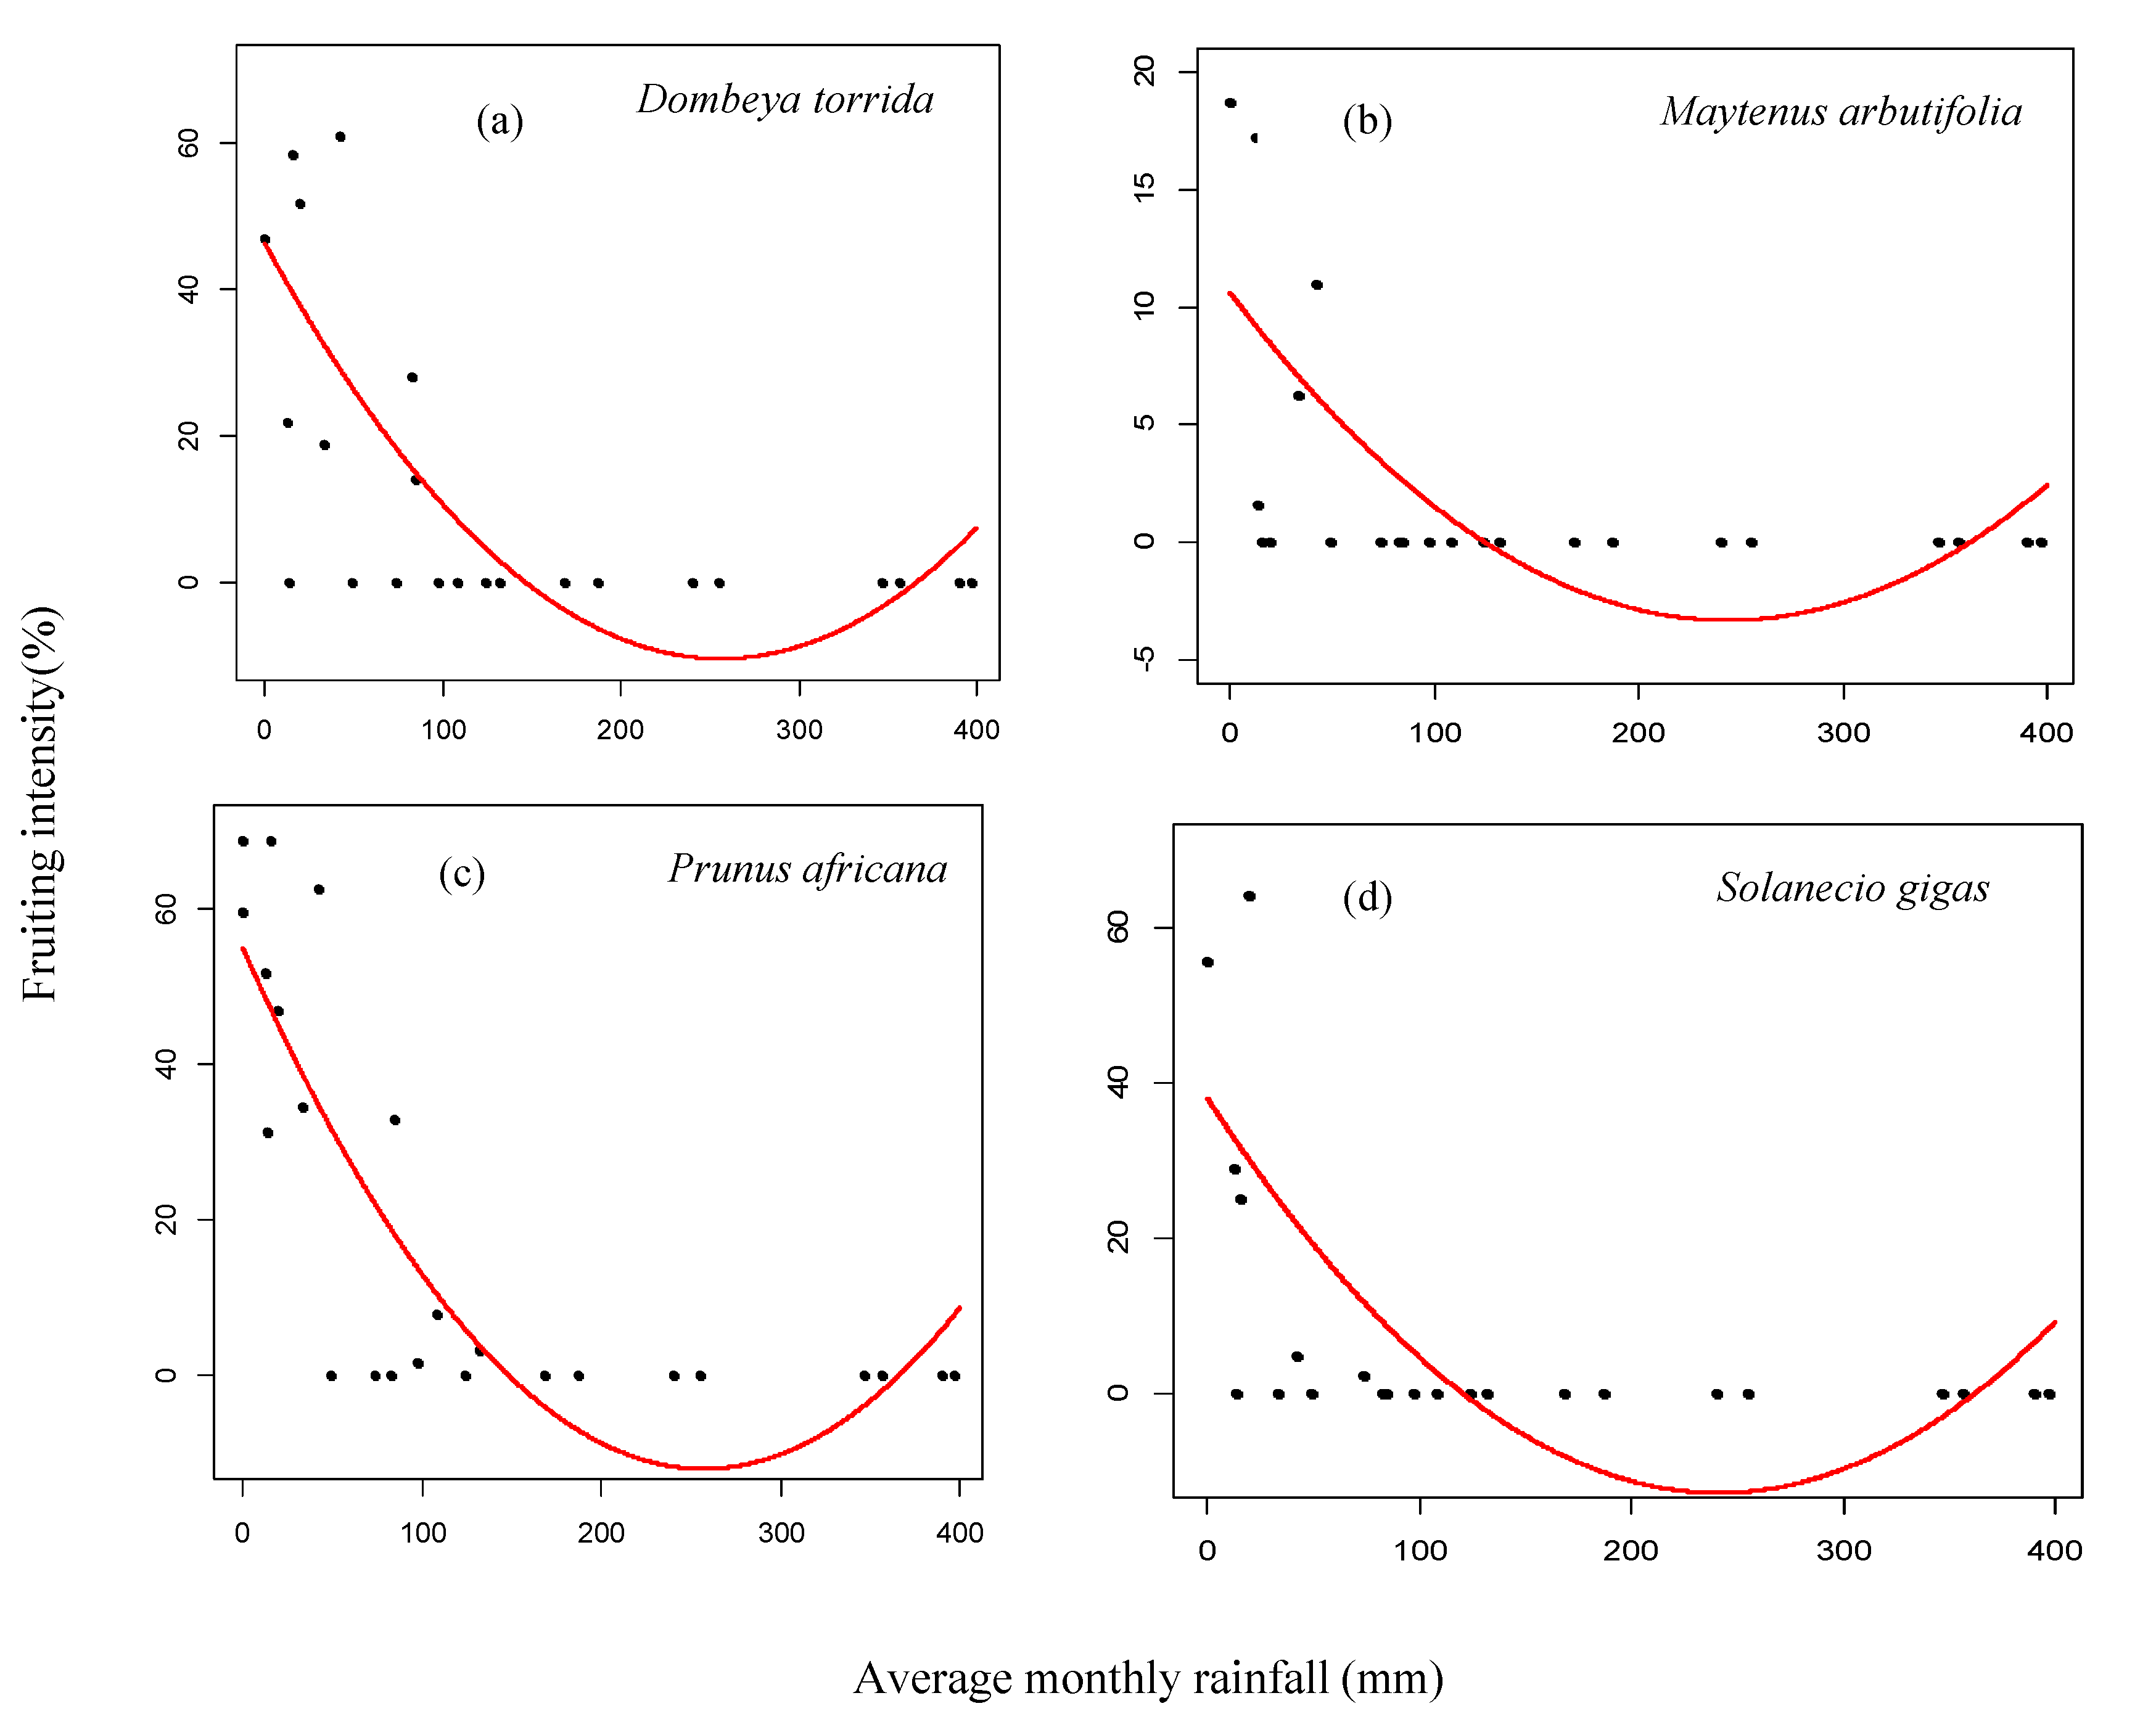
The results of the non-linear quadratic polynomial regression model analyses indicated that the average monthly rainfall has significant positive and negative effects on the fruiting percent of Dombeya torrida, Maytenus arbutifolia, Prunus africana and Solanecio gigas (p < 0.01, Table 4, Figure 12a–d). The analyses showed that a high percentage of fruiting was observed at the beginning of the rain, and fruiting percent decreased, leveled off below zero, and slowly increased with increasing monthly rainfall (Figure 12).

4. Discussion

4.1. Patterns of Monthly Rainfall and Temperature on Flowering Phenology of Woody Species

Flowering patterns are vital to understanding the dynamics of plant reproduction. The timing of flowering is the result of natural selection mediated by a combination of biotic and abiotic factors, such as temperature and the availability of water, nutrients and light [35]. In tropical ecosystems, seasonal changes in rainfall, temperature and day length are the primary flowering constraints [36,37]. Additionally, flowering patterns are also shaped by biotic factors, mainly plant-pollinator interactions [38]. Therefore, documenting the different flowering responses to plant traits and environmental factors will be important for understanding the strategies of different species to survive and coexist [24,38].
In the present study, the flowering patterns of most study species were predominately annual, unimodal and seasonal in most examined species. However, few species showed continuous flowering patterns throughout the months of the year. The finding is in consistent with the report in our herbarium-based study of the flowering and fruiting phenology of twelve indigenous plant species from Ethiopia [33]. Four species, namely, Dombeya torrida, Maytenus arbutifolia, Prunus africana and Solanecio gigas showed seasonal patterns while Bersama abyssinica, Brucea antidysenterica and Rosa abyssinica exhibited continuous flowering. In all cases, the peak flowering periods coincided with the end of the rainy season or the long dry season except Bersama abyssinica, which showed peak flowering at the beginning of the rainy season. Several studies have also reported strong seasonality and annual flowering patterns for trees in other dry tropical forests [39,40,41,42]. It is also indicated that flower peaks were concentrated in the dry season [24,41,43].
Although both rainfall and temperature affect flowering, the present results showed that the average monthly temperature has more significant effects on the flowering percentage of most study species than rainfall. Tesfaye et al. [24] also reported that flowering significantly correlated to mean monthly temperature. However, the initiation of flowering was observed at the end of the rainy season, which indicates that moisture triggers flowering. Other authors also explained that the flowering phenology of tropical tree species was triggered by moisture [19,21].
For all seasonal flowering, and, even, in most continuous flowering species, flowering peaks at the beginning of the dry season (Figure 3). This may be because the dry season flowering in tropical forests may be enhanced by the higher temperatures and solar irradiance [24]. Berlin [43] also reported that, flowering peaks for most of their study species corresponded to the period of greatest solar irradiance at higher temperatures. According to Janzen [44], tree species in the dry tropical forest flower in the dry season because the wet season is the major period for vegetative growth for species. Therefore, reproduction in the dry season can provide temporal separation of reproductive activity and vegetative growth [44,45]. Since the dry season is characterized by a lack of vegetative competition, this should cause the flowering and fruiting period to shift toward the dry season. The timing of flowering may also be influenced by interactions with other organisms, such as pollinators, seed predators, and herbivores [35]. During the dry season, dry season weather conditions and leaflessness of plants probably favored pollinators (selective force in keeping dry season flowering) and dispersal agents in their pollination activities [44].
Moreover, for seasonal flowering species, the results provided evidence that no flowering individuals of tree species were recorded in the rainy season. This finding is also supported by the fact that flowering during the dry season can benefit a plant by avoiding pollen damage by rain [44]. According to Justiniano and Fredericksen [41], sub-canopy species are less seasonal in their fruiting and flowering. This is possible because of reduced variability in solar radiation, soil moisture and relative humidity in the forest understory [19]. With their lower stature and exposure to lower wind velocities, wind dispersal is not likely to be an effective strategy for sub-canopy species. Hence, seeds of all sub-canopy species are dispersed by animals or gravity [41]. In this study, Brucea antidysenterica, which contributes to the sub-canopy stratum in our study site, showed continuous flowering and fruiting.

4.2. Patterns of Monthly Rainfall and Temperature on Fruiting Phenology of Woody Species

Most species exhibited extended fruiting over several months of the year. According to Janzen [44], fruiting extends for several more months because the fruits develop slowly to mature at the possible maximum rates through physiological processes. It has also ecosystem functioning implications in that extended fruiting can ensure the availability of fruit resources for frugivore animals for most parts of the year [41,43]. Extended fruiting was observed, even for species that showed a short period of flowering such as Dombya torrida and Prunus africana. However, for Maytenus arbutifolia, fruiting tends to occur at the same time as flowering. The exact overlapping of flowering and fruiting of specimens has been shown from a herbarium-based study of flowering and fruiting for Maytenus arbutifolia [33].
In the seasonal flowering and fruiting species, the peak fruiting was observed through 2–3 months following the peak flowering towards the end of the dry season and/or the beginning of the long rainy season (Figure 3). Such marked dry season fruiting peaks have been reported from dry tropical forests such as Ethiopia [24], Bolivia [41] and Cote d’Ivoire [46].
Fruiting phenology is closely correlated with the seed dispersal mechanism. Most canopy trees had small, wind-dispersed seeds or fruits that matured during the latter part of the dry season. Canopy tree species and species with small seeds may be able to more effectively disperse seeds via wind because they are exposed to stronger dry-season winds at the canopy level [40]. In the current study, Dobmeya torrida and Solanecio gigas fruiting peaked clearly during the dry season of the study area (January and February). In a study of soil seed banks in dry Afromontane forests, Teketay [47] reported that in the litter layer samples collected at the end of the dry season (March) and in the middle of the rainy period (July) within the same year at Gara Ades, southeastern Ethiopia, there was a marginal difference in the quantity of seeds, but there was a marked difference in species composition. This was attributed to the difference of species in their timing of flowering, fruit maturation and dispersal. Several climax species disperse their seeds on the onset of or during the long rainy period and germinate to form seedling banks on the forest floor while many species disperse their seeds during the dry period [47,48].
It has been shown that rainfall has a significant impact on the fruiting intensity of Bersama abyssinica, Brucea antidysenterica, Prunus africana and Rosa abyssinica where the percentage of fruiting intensity dropped towards the beginning of the rainy season. This indicated seeds mature and are dispersed during or at the beginning of the rainy season. These observations of the current study strongly support the idea that fruiting towards the end of the dry season or during the rainy season in tropical forests may ensure the dispersal of seeds when soil moisture conditions are favorable for seed germination, seedling growth, and survival [19,44]. According to Teketay [47] and Tesfaye et al. [49], seedling recruitment in Prunus africana was higher in the major rainy season than in the dry season.

5. Conclusions

The results of this study suggest that there is a strong seasonality in the phenological pattern of tree species. The results showed environmental factors, such as rainfall and temperature could influence the reproductive phenology of plants. For Dombeya torrida, Maytenus arbutifolia, Prunus africana and Solanecio gigas, flowering was seasonal and observed for a few months. The timing of flowering was concentrated at the beginning of the dry season or at the end of the rainy season while most species produce fruits during the long dry season. However, Bersama abyssinica, Brucea antidysenterica and Rosa abyssinica flowered or fruited continuously all year round. In most species, flowering was significantly correlated with temperature whereas fruiting was significantly correlated with rainfall. Observations on the phenology of a tree provide basic information since phenological events have many practical implications, such as planning seed collections. It is understood that seed shading/dispersal will take place immediately after peak fruiting; therefore, seed collection before dispersal can be planned based on the results of this study, which could be between January and March for most of the study species.

Author Contributions

S.D. (Sinework Dagnachew) designed the study method, collected data and prepared the manuscript. D.L.: analysed data and contributed to the write-up of the manuscript, S.D. (Sebsebe Demissew) and T.A. contributed to the write-up of the manuscript, and D.T. contributed to the designing of the study method as well as the write up and proof-reading of the manuscript. All authors have read and agreed to the published version of the manuscript.

Funding

The study was supported by “Ethiopian Endemic Plants Project” of the Ethiopian Biodiversity Institute and Addis Ababa University. The research received no external funding. The APC is funded by Demel Teketay.

Data Availability Statement

The datasets generated during the fieldwork and/or analyzed data are available from the corresponding author on reasonable request.

Acknowledgments

The authors are thankful to Ethiopian Biodiversity Institute and Addis Ababa University for financing the project. The authors would like to thank Machakel Wereda Agricultural Development office for the support during field data collection. The first author also thanks National Meteorological Agency of Ethiopia for the provision of all required climate data of the study area.

Conflicts of Interest

The authors declare no conflict of interest.

References

  1. Schwartz, M.D. Introduction. In Phenology: An Integrative Environmental Science; Schwartz, M.D., Ed.; Kluwer Academic Publishers: Alphen aan den Rijn, The Netherlands, 2003; pp. 3–7. [Google Scholar]
  2. Denny, E.G.; Gers, K.L.; Miller-Rushing, A.J.; Tierney, G.L.; Crimmins, T.M.; Enquist, C.A.F.; Guertin, P.; Rosemartin, A.H.; Schwartz, M.D.; Thomas, K.A.; et al. Standardized phenology monitoring methods to track plant and animal activity for science and resource management applications. Int. J. Biometeorol. 2014, 58, 591–601. [Google Scholar] [CrossRef] [Green Version]
  3. Sanchez-Azofeifa, A.; Kalacska, M.E.; Quesada, M.; Stoner, K.E.; Jorge, A.; Lob, J.A.; Arroyo-Mora, P. Tropical Dry Climates. In Phenology: An Integrative Environmental Science; Schwartz, M.D., Ed.; Kluwer Academic Publishers: Alphen aan den Rijn, The Netherlands, 2003; pp. 121–138. [Google Scholar]
  4. Menzel, A.; Sparks, T.H.; Estrella, N.; Koch, E.; Aasa, A.; Ahas, R.; Alm-Kuebler, K.; Bissolli, P.; Braslavska, O.G.; Briede, A.; et al. European phenological response to climate change matches the warming pattern. Glob. Chang. Biol. 2006, 12, 1969–1976. [Google Scholar] [CrossRef]
  5. Tang, J.; Körner, C.; Muraoka, H.; Piao, S.; Shen, M.; Thackeray, S.J.; Yang, X. Emerging opportunities and challenges in phenology: A review. Ecosphere 2016, 7, e01436. [Google Scholar] [CrossRef] [Green Version]
  6. Zhao, M.; Peng, C.; Xiang, W.; Deng, X.; Tian, D.; Zhou, X.; Yu, G.; He, H.; Zhao, Z. Plant phenological modeling and its application in global climate change research: Overview and future challenges. Environ. Rev. 2012, 21, 1–14. [Google Scholar] [CrossRef]
  7. IPCC. Climate Change: Impacts, Adaptation, and Vulnerability. Part A: Global and Sectoral Aspects. Contribution of Working Group II to the Fifth Assessment Report of the Intergovernmental Panel on Climate Change; Cambridge University Press: Cambridge, UK; New York, NY, USA, 2014. [Google Scholar]
  8. Fenner, M. The phenology of growth and reproduction in plants. Perspect. Plant Ecol. Evol. Syst. 1998, 1, 78–91. [Google Scholar] [CrossRef] [Green Version]
  9. Willis, C.G.; Ellwood, E.R.; Primack, R.B.; Davis, C.C.; Pearson, K.D.; Gallinat, A.S.; Yost, J.M.; Nelson, G.; Mazer, S.J.; Rossington, N.L.; et al. Old Plants, New Tricks: Phenological Research Using Herbarium Specimens. Trends Ecol. Evol. 2017, 32, 531–546. [Google Scholar] [CrossRef] [Green Version]
  10. Walther, G.R.; Post, E.; Convey, P.; Menzel, A.; Parmesan, C.; Beebee, T.J.C.; Fromentin, J.M.; Hoegh-Guldberg, O.; Bairlein, F. Ecological responses to recent climate change. Nature 2002, 416, 389–395. [Google Scholar] [CrossRef]
  11. Moza, M.K.; Bhatnagar, A.K. Phenology and climate change. Curr. Sci. 2005, 9, 243–244. [Google Scholar]
  12. Williams, J.W.; Jackson, S.T.; Kutzbacht, J.E. Projected distributions of novel and disappearing climates by 2100 AD. Proc. Natl. Acad. Sci. USA 2007, 104, 5738–5742. [Google Scholar] [CrossRef] [PubMed] [Green Version]
  13. Dejene, T.; Mohamed, O.; Yilma, Z.; Eshete, A. Phenology of leaf, flower and fruits of Boswellia neglecta and Commiphora myrrha in Borena Zone, Southeastern Ethiopia. Hort Flora Res. Spectr. 2016, 5, 269–274. [Google Scholar]
  14. Shiferaw, W.; Bekele, T.; Demissew, S.; Aynekulu, E. Phenology of the alien invasive plant species Prosopis juliflora in arid and semi-arid areas in response to climate variability and some perspectives for its control in Ethiopia. Pol. J. Ecol. 2020, 68, 37–46. [Google Scholar] [CrossRef]
  15. Lobo, J.; Quesada, M.; Stoner, K.E.; Fuchs, E.J.; Herrerias-Diego, Y.; Rojas, J.; Saborio, G. Factors affecting phenological patterns of Bombaceaous trees in seasonal forests in Costa Rica and Mexico. Am. J. Bot. 2003, 90, 1054–1063. [Google Scholar] [CrossRef]
  16. Chuine, I.; Beaubien, E.G. Phenology is a major determinant of tree species range. Ecol. Lett. 2001, 4, 500–510. [Google Scholar] [CrossRef] [Green Version]
  17. Borchert, R.; Robertson, K.; Schwartz, M.D.; Williams-Linera, G. Phenology of temperate trees in tropical climates. Int. J. Biometeorol. 2005, 50, 57–65. [Google Scholar] [CrossRef] [PubMed]
  18. Igboabuchi, N.A.; Echereme, C.B.; Ekwealor, K.U. Phenology in plants: Concepts and uses. Int. J. Sci. Res. Methodol. 2018, 11, 8–24. [Google Scholar]
  19. Van Schaik, C.; Terborgh, W.J.; Wright, J.S. The phenology of tropical forests: Adaptive significance and consequences for primary consumers. Annu. Rev. Ecol. Syst. 1993, 24, 353–377. [Google Scholar] [CrossRef]
  20. Newstrom, L.E.; Frankie, G.W.; Baker, H.G. A new classification for plant phenology based on flowering patterns in lowland tropical rainforest trees at La Selva, Costa Rica. Biotropica 1994, 26, 141–159. [Google Scholar] [CrossRef]
  21. Sakai, S. Phenological diversity in tropical forests. Popul. Ecol. 2001, 43, 77–86. [Google Scholar] [CrossRef]
  22. Sakai, S.; Kitajima, K. Tropical phenology: Recent advances and perspectives. Ecol. Res. 2019, 34, 50–54. [Google Scholar] [CrossRef]
  23. Inouye, D.W.; Wielgolaski, F.E. High altitude climates. In Phenology: An Integrative Environmental Science; Schwartz, M.D., Ed.; Kluwer Academic Publishers: Alphen aan den Rijn, The Netherlands, 2003; pp. 75–92. [Google Scholar]
  24. Tesfaye, G.; Teketay, D.; Fetene, M.; Beck, E. Phenology of seven indigenous tree species in a dry Afromontane forest, southern Ethiopia. Trop. Ecol. 2011, 52, 229–241. [Google Scholar]
  25. Parmesan, C. Influences of species, latitudes and methodologies on estimates of phenological response to global warming. Glob. Chang. Biol. 2007, 13, 1860–1872. [Google Scholar] [CrossRef]
  26. Mosissa, D. Flowering and Fruiting Phenology of Some Forest Plant Species in the Remnants of Combretum—Terminalia Woodlands of Western Ethiopia. Acta Sci. Agric. 2019, 3, 126–132. [Google Scholar] [CrossRef]
  27. Friis, I.; Demissew, S.; Breugel, P.V. Atlas of potential vegetation of Ethiopia. In Biologiske Skrifter; The Royal Danish Academy of Sciences and Letters: Copenhagen, Denmark, 2010; Volume 58, p. 315. [Google Scholar]
  28. Wube, A.A.; Franz Bucar, F.; Asres, K.; Gibbons, S.; Rattray, L.; Croft, S.L. Antimalarial Compounds from Kniphofia foliosa roots. Phytother. Res. 2005, 19, 472–476. [Google Scholar] [CrossRef] [PubMed]
  29. Teketay, D.; Senbeta, F.; Maclachlan, M.; Bekele, M.; Barklund, P. Edible Wild Plants in Ethiopia; Teketay, D., Ed.; Addis Ababa University Press: Addis Ababa, Ethiopia, 2010. [Google Scholar]
  30. Lulekal, E.; Asfaw, A.; Kelbessa, K.; Van Damme, P. Linking Ethnobotany, Herbaria and Flora to Conservation: The Case of Four Angiosperm Families at the National Herbarium of Ethiopia. J. East Afr. Nat. Hist. 2012, 101, 99–125. [Google Scholar] [CrossRef]
  31. Anza, M.; Worku, F.; Libsu, S.; Mamo, F.; Endale, M. Phytochemical Screening and Antibacterial Activity of Leaves Extract of Bersama abyssinica. J. Adv. Bot. Zool. 2015, 3, 2348–7313. [Google Scholar]
  32. Meragiaw, M.; Asfaw, Z.; Argaw, M. The Status of Ethnobotanical Knowledge of Medicinal Plants and the Impacts of Resettlement in Delanta, Northwestern Wello, Northern Ethiopia. Hindawi 2016, 2016, 5060247. [Google Scholar] [CrossRef] [PubMed] [Green Version]
  33. Dagnachew, S.; Teketay, D.; Demissew, S.; Hawas, T.; Kindu, M. Herbarium-based study of phenology of twelve indigenous 563 and endemic species from Ethiopia. S. Afr. J. Bot. 2022, 150, 260–274. [Google Scholar] [CrossRef]
  34. R Core Team. R: A Language and Environment for Statistical Computing. R Foundation for Statistical Computing. Available online: http://www.R-project.org/ (accessed on 14 July 2022).
  35. Ehrlén, J. Selection on flowering time in a life-cycle context. Oikos 2015, 124, 92–101. [Google Scholar] [CrossRef]
  36. Morellato, L.P.C.; Talora, D.C.; Takahasi, A.; Bencke, C.C.; Romera, E.C.; Zipparro, V.B. Phenology of Atlantic rain forest trees: A comparative study. Biotropica 2000, 32, 811–823. [Google Scholar] [CrossRef]
  37. Abrahamczyk, S.; Kluge, J.; Gareca, Y.; Reichle, S.; Kessler, M. The Influence of Climatic Seasonality on the Diversity of Different Tropical Pollinator Groups. PLoS ONE 2011, 6, e27115. [Google Scholar] [CrossRef] [Green Version]
  38. Cortés-Flores, J.; Hernández-Esquivel, K.; González-Rodríguez, A.; Ibarra-Manríquez, G. Flowering phenology, growth forms, and pollination syndromes in tropical dry forest species: Influence of phylogeny and abiotic factors. Am. J. Bot. 2017, 104, 39–49. [Google Scholar] [CrossRef] [PubMed] [Green Version]
  39. Bendix, J.; Homeier, J.; Ortiz, E.C.; Emck, P.; Breckle, S.W.; Beck, E. Seasonality of weather and tree phenology in a tropical evergreen mountain rainforest. Int. J. Biometeorol. 2006, 50, 370–384. [Google Scholar] [CrossRef] [PubMed]
  40. Frankie, W.G.; Baker, G.H.; Opler, A.P. Comparative phenological studies of trees in tropical wet and dry forests in the lowlands of Costa Rica. J. Ecol. 1974, 62, 881–919. [Google Scholar] [CrossRef]
  41. Justiniano, M.J.; Fredericksen, T.S. Phenology of tree species in Bolivian dry forests. Biotropica 2000, 32, 276–281. [Google Scholar] [CrossRef]
  42. Malizia, L.R. Seasonal fluctuations of birds, fruits, and flowers in a subtropical forest of Argentina. Condor 2001, 103, 45–61. [Google Scholar] [CrossRef]
  43. Berlin, E.K.; Pratt, K.T.; Simon, C.J.; Kowalsky, R.J. Plant phenology in a Cloud Forest on the Island of Maui, Hawaii. Biotropica 2000, 32, 90–99. [Google Scholar] [CrossRef]
  44. Janzen, D.H. Synchronization of sexual reproduction of trees within the dry season in Central America. Evolution 1967, 21, 620–637. [Google Scholar] [CrossRef]
  45. Bawa, K.S.; Kang, H.; Grayum, M.H. Relationship among time, frequency and duration of flowering in tropical rain forest trees. Am. J. Bot. 2003, 90, 877–887. [Google Scholar] [CrossRef] [Green Version]
  46. Anderson, D.P.; Nordheim, V.E.; Moermond, C.T.; Bi, Z.B.G.; Boesch, C. Factors influencing tree phenology in Tai National Park, Cote d’Ivoire. Biotropica 2005, 37, 631–641. [Google Scholar] [CrossRef]
  47. Teketay, D. Seed Ecology and Regeneration in Dry Afromontane Forests of Ethiopia. Ph.D. Thesis, Swedish University of Agricultural Sciences, Umeå, Sweden, 1996. [Google Scholar]
  48. Burger, W.C. Flowering periodicity at four levels in eastern Ethiopia. Biotropica 1974, 6, 38–42. [Google Scholar] [CrossRef]
  49. Tesfaye, G.; Teketay, D.; Fetene, M.; Beck, E. Regeneration of seven indigenous tree species in a dry Afromontane forest, southern Ethiopia. Flora 2010, 205, 135–143. [Google Scholar] [CrossRef]
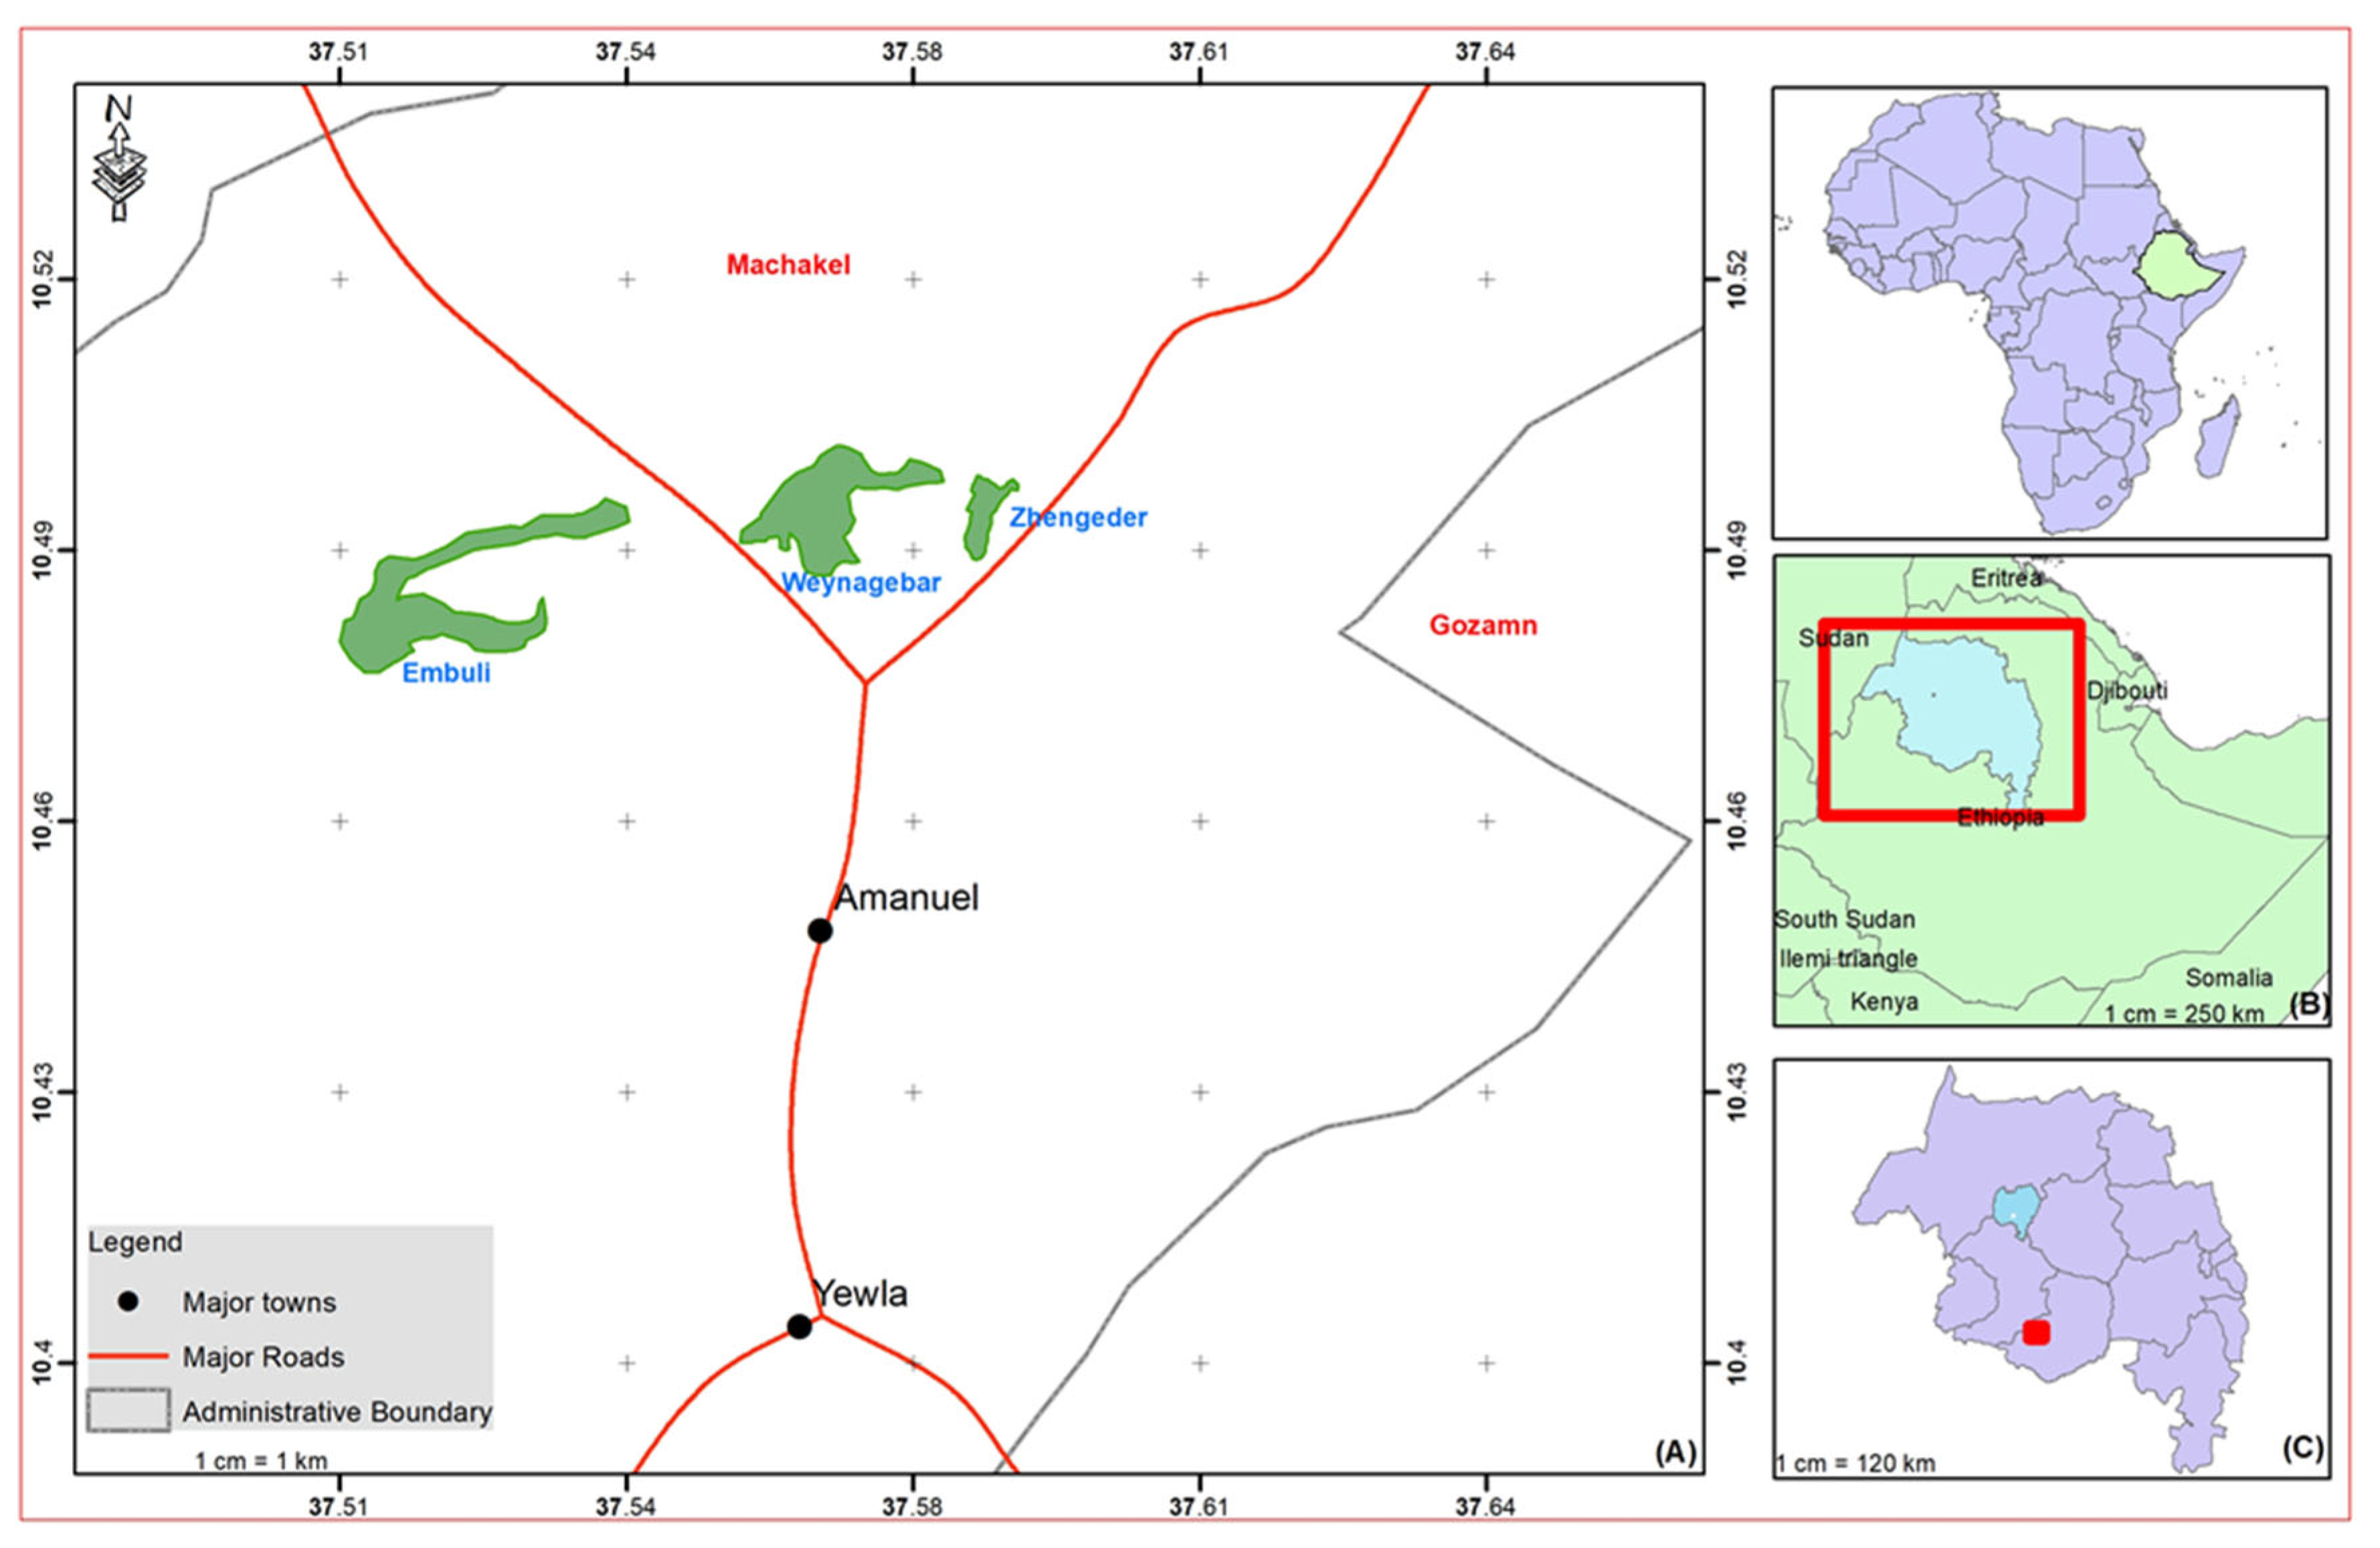
Figure 1. The locations of the three forest study patches in East Gojjam zone, Amhara National Regional State (ANRS) in relation to the map of Ethiopia, (A) map of three forest patches, (B) map of Ethiopia, (C) map of ANRS.
Forests 14 00541 g001
Figure 2. Percentage of flowering and fruiting of Bersama abyssinica in relation to: (a) monthly precipitation (b) average temperature. In which Jan = January, Feb = February, Mar = March, Apr = April, May = May, Jun = June, Jul = July, Aug = August, Sep = September, Oct = October, Nov = November, Dec = December.
Forests 14 00541 g002
Figure 3. Percentage of flowering and fruiting of Brucea antidysenterica in relation to: (a) monthly precipitation (b) average temperature. In which Jan = January, Feb = February, Mar = March, Apr = April, May = May, Jun = June, Jul = July, Aug = August, Sep = September, Oct = October, Nov = November, Dec = December.
Forests 14 00541 g003
Figure 4. Percentage of flowering and fruiting of Dombeya torrida in relation to: (a) monthly precipitation and (b) average temperature. In which Jan = January, Feb = February, Mar = March, Apr = April, May = May, Jun = June, Jul = July, Aug = August, Sep = September, Oct = October, Nov = November, Dec = December.
Forests 14 00541 g004
Figure 5. Percentage of flowering and fruiting of Maytenus arbutifolia, in relation to: (a) monthly precipitation and (b) average temperature. In which Jan = January, Feb = February, Mar = March, Apr = April, May = May, Jun = June, Jul = July, Aug = August, Sep = September, Oct = October, Nov = November, Dec = December.
Forests 14 00541 g005
Figure 6. Percentage of flowering and fruiting of Prunus africana in relation: (a) to monthly precipitation and (b) temperature. In which Jan = January, Feb = February, Mar = March, Apr = April, May = May, Jun = June, Jul = July, Aug = August, Sep = September, Oct = October, Nov = November, Dec = December.
Forests 14 00541 g006
Figure 7. Percentage of flowering and fruiting of Rosa abyssinica in relation to: (a) monthly precipitation and (b) average temperature. In which Jan = January, Feb = February, Mar = March, Apr = April, May = May, Jun = June, Jul = July, Aug = August, Sep = September, Oct = October, Nov = November, Dec = December.
Forests 14 00541 g007
Figure 8. Percentage of flowering of Solanecio gigas and fruiting in relation to: (a) monthly precipitation and (b) average temperature. In which Jan = January, Feb = February, Mar = March, Apr = April, May = May, Jun = June, Jul = July, Aug = August, Sep = September, Oct = October, Nov = November, Dec = December.
Forests 14 00541 g008
Figure 9. The patterns of the flowering intensity in relation to mean monthly temperature: (a) Bersama abyssina, (b) Maytenus arbutifolia, (c) Prunus africana and (d) Solanecio gigas, and in relation to monthly rainfall: (e) Maytenus arbutifolia.
Forests 14 00541 g009
Figure 10. The patterns of flowering intensity in relation to the monthly temperature: (a) Brucea antidysenterica, (b) Dombeya torrida, (c) Rosa abyssinica.
Forests 14 00541 g010
Figure 11. The line graph showing the fruiting intensity in relation to mean monthly temperature and monthly rainfall: (a) Bersama abyssinica, (b,d) Brucea antidysenterica, (c,e) Rosa abyssinica.
Forests 14 00541 g011
Figure 12. Patterns of the fruiting intensity in relation to monthly rainfall: (a) Dombeya torrida, (b) Maytenus arbutifolai, (c) Prunus africana and (d) Solanecio gigas.
Forests 14 00541 g012
Table 1. The linear regression model showing the effect of mean monthly temperature (°C) and rainfall (mm) on the flowering percent of species.
NoSpeciesVariableEstimateStandard ErrorF-ValueAdjusted R2p-Value
1Bersama abyssinicaTemp1.5510.5886.9580.210.015
RF−0.01270.0104.3680.230.22
2Maytenus arbutifoliaTemp−4.9421.5189.4140.4230.004
RF−0.0730.0269.4140.4230.011
3Prunus africanaTemp−4.3301.9834.7680.140.04
RF−0.0310.0342.7630.130.38
4SolaneciogigasTemp−4.712.123.4130.170.036
RF−0.0650.0344.5540.2360.07
Table 2. The non-linear quadratic polynomial regression model fits showing the effect of average monthly temperature (T) and rainfall (RF) on the flowering percent of tree species.
SpeciesFactorEstimatesStandard ErrorF-ValuesAdjusted R2p-Values
Brucea antidysentricaT−55.5720.4512.090.490.01
T21.40.57 0.02
RF−0.11770.112.410.110.278
RF20.000150.0002 0.576
Dombeya torridaT−72.7522.0312.030.480.003
T21.880.61 0.006
RF−0.0080.121.4610.030.498
RF20.0000740.0003 0.807
Rosa abyssinicaT−77.9726.111.510.470.007
T21.9980.73 0.01
RF0.1310.13721.6490.050.350
RF20.00010.00035 0.617
Table 3. The linear regression model showing the effect of mean monthly temperature (°C) and rainfall on the fruiting percent of species.
No SpeciesVariableEstimateStandard ErrorF-ValuesAdjusted R2p-Values
1Bersama abyssinicaTemp−0.8090.8585.5340.280.356
RF0.0470.01510.230.290.004
2Brucea antidysentericaTemp3.0191.0712.780.510.010
RF−0.0790.01912.780.51<0.001
3Rosa abyssinicaTemp6.972.2515.850.560.005
RF−0.1850.03915.850.56<0.001
Table 4. The non-linear quadratic polynomial regression model fits showing the effect of monthly rainfall (RF) and average monthly temperature (T) on the fruiting percentage of tree species.
SpeciesFactorsEstimatesStandard ErrorF-ValuesAdjusted R2p-Values
Dombeya torridaRF−0.440.1111.370.47<0.001
RF20.00080.0003 0.007
T8.114339.38151.450.040.839
T2−0.33651.0942 0.761
Maytenus arbutifoliaRF−0.14440.032858.00.380.002
RF20.000240.000083 0.01
T−4.4223410.570801.200.020.680
T20.096190.29371 0.747
Prunus africanaRF−0.520.08826.640.69<0.001
RF20.0010.0002 <0.001
T7.006641.48990.45−0.050.868
T2−0.25891.1528 0.824
Solanecio gigasRF−0.420.118.730.400.001
RF20.00090.0003 0.006
T31.06838.170.74−0.020.425
T2−0.91981.0605 0.396
Disclaimer/Publisher’s Note: The statements, opinions and data contained in all publications are solely those of the individual author(s) and contributor(s) and not of MDPI and/or the editor(s). MDPI and/or the editor(s) disclaim responsibility for any injury to people or property resulting from any ideas, methods, instructions or products referred to in the content.