3.2.1. Time Variation
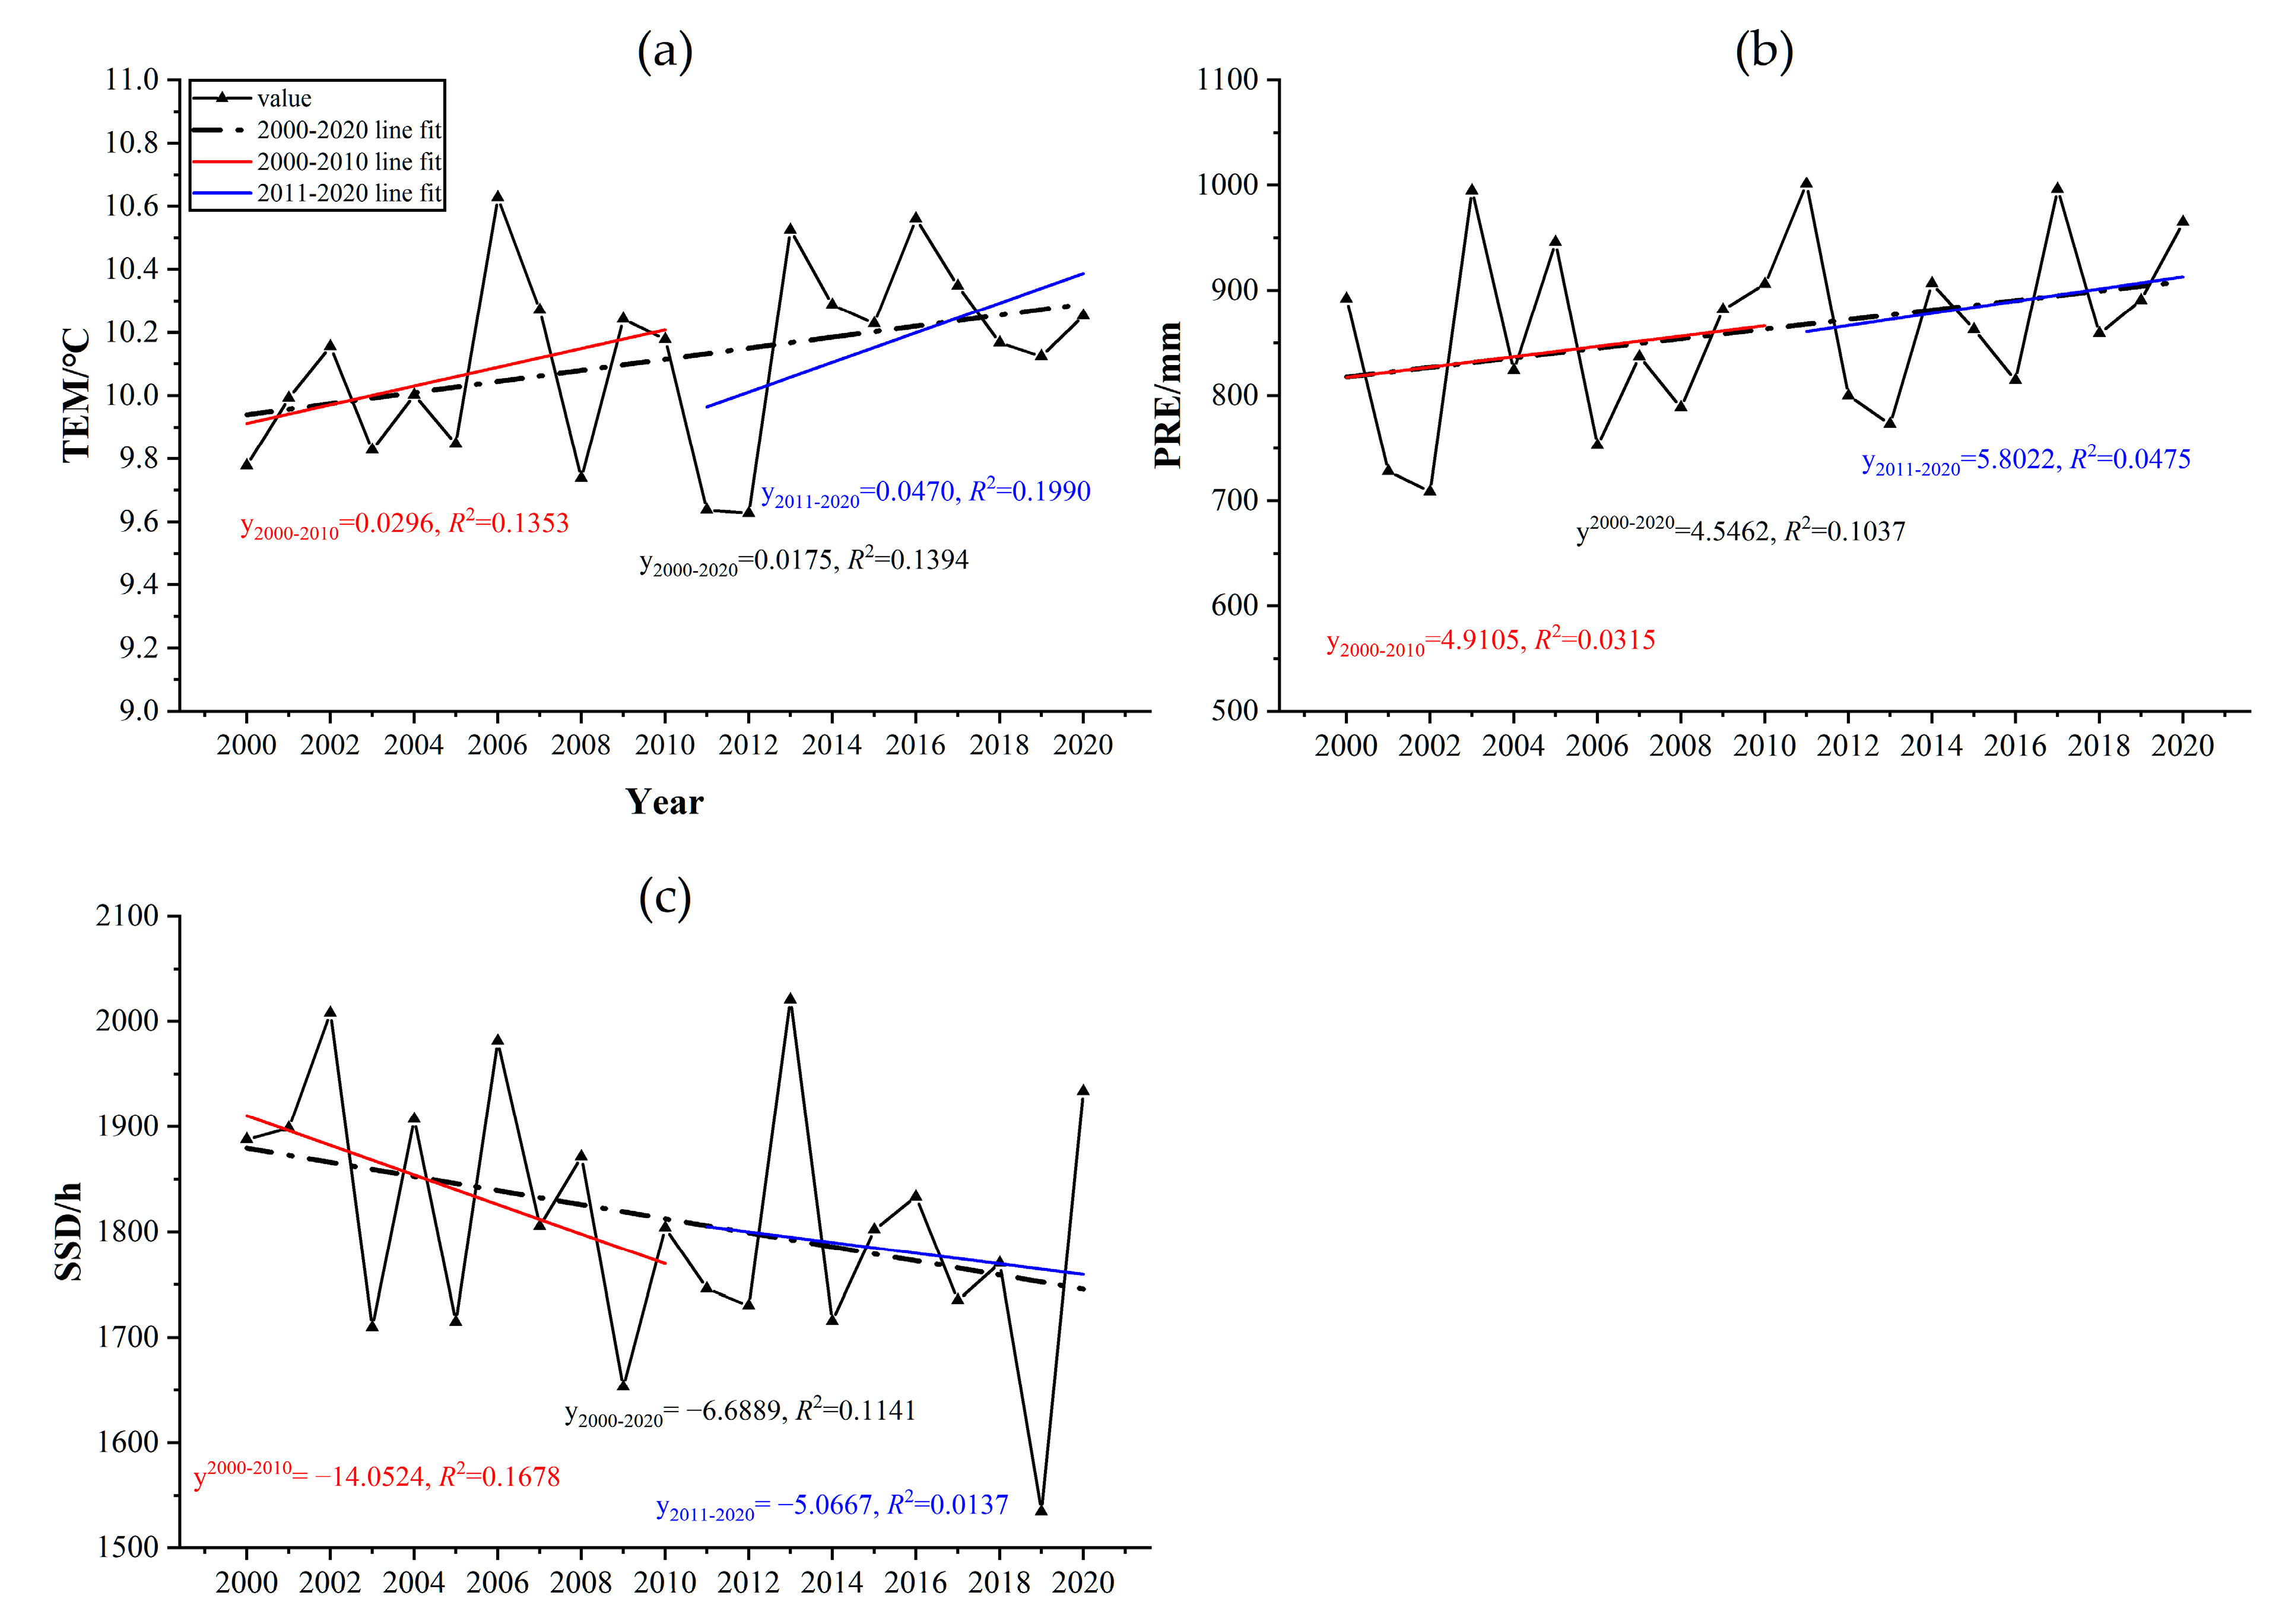
In the last 21 years, the annual average
TEM in the QBM has been 10.12 °C, rising at a rate of 0.175 °C/10a (
Figure 6a). However, since 2016, the average annual
TEM has decreased by approximately 0.3 °C. This indicates that during the study period, the QBM also experienced a “warming” trend, especially in the past 10 years, when the
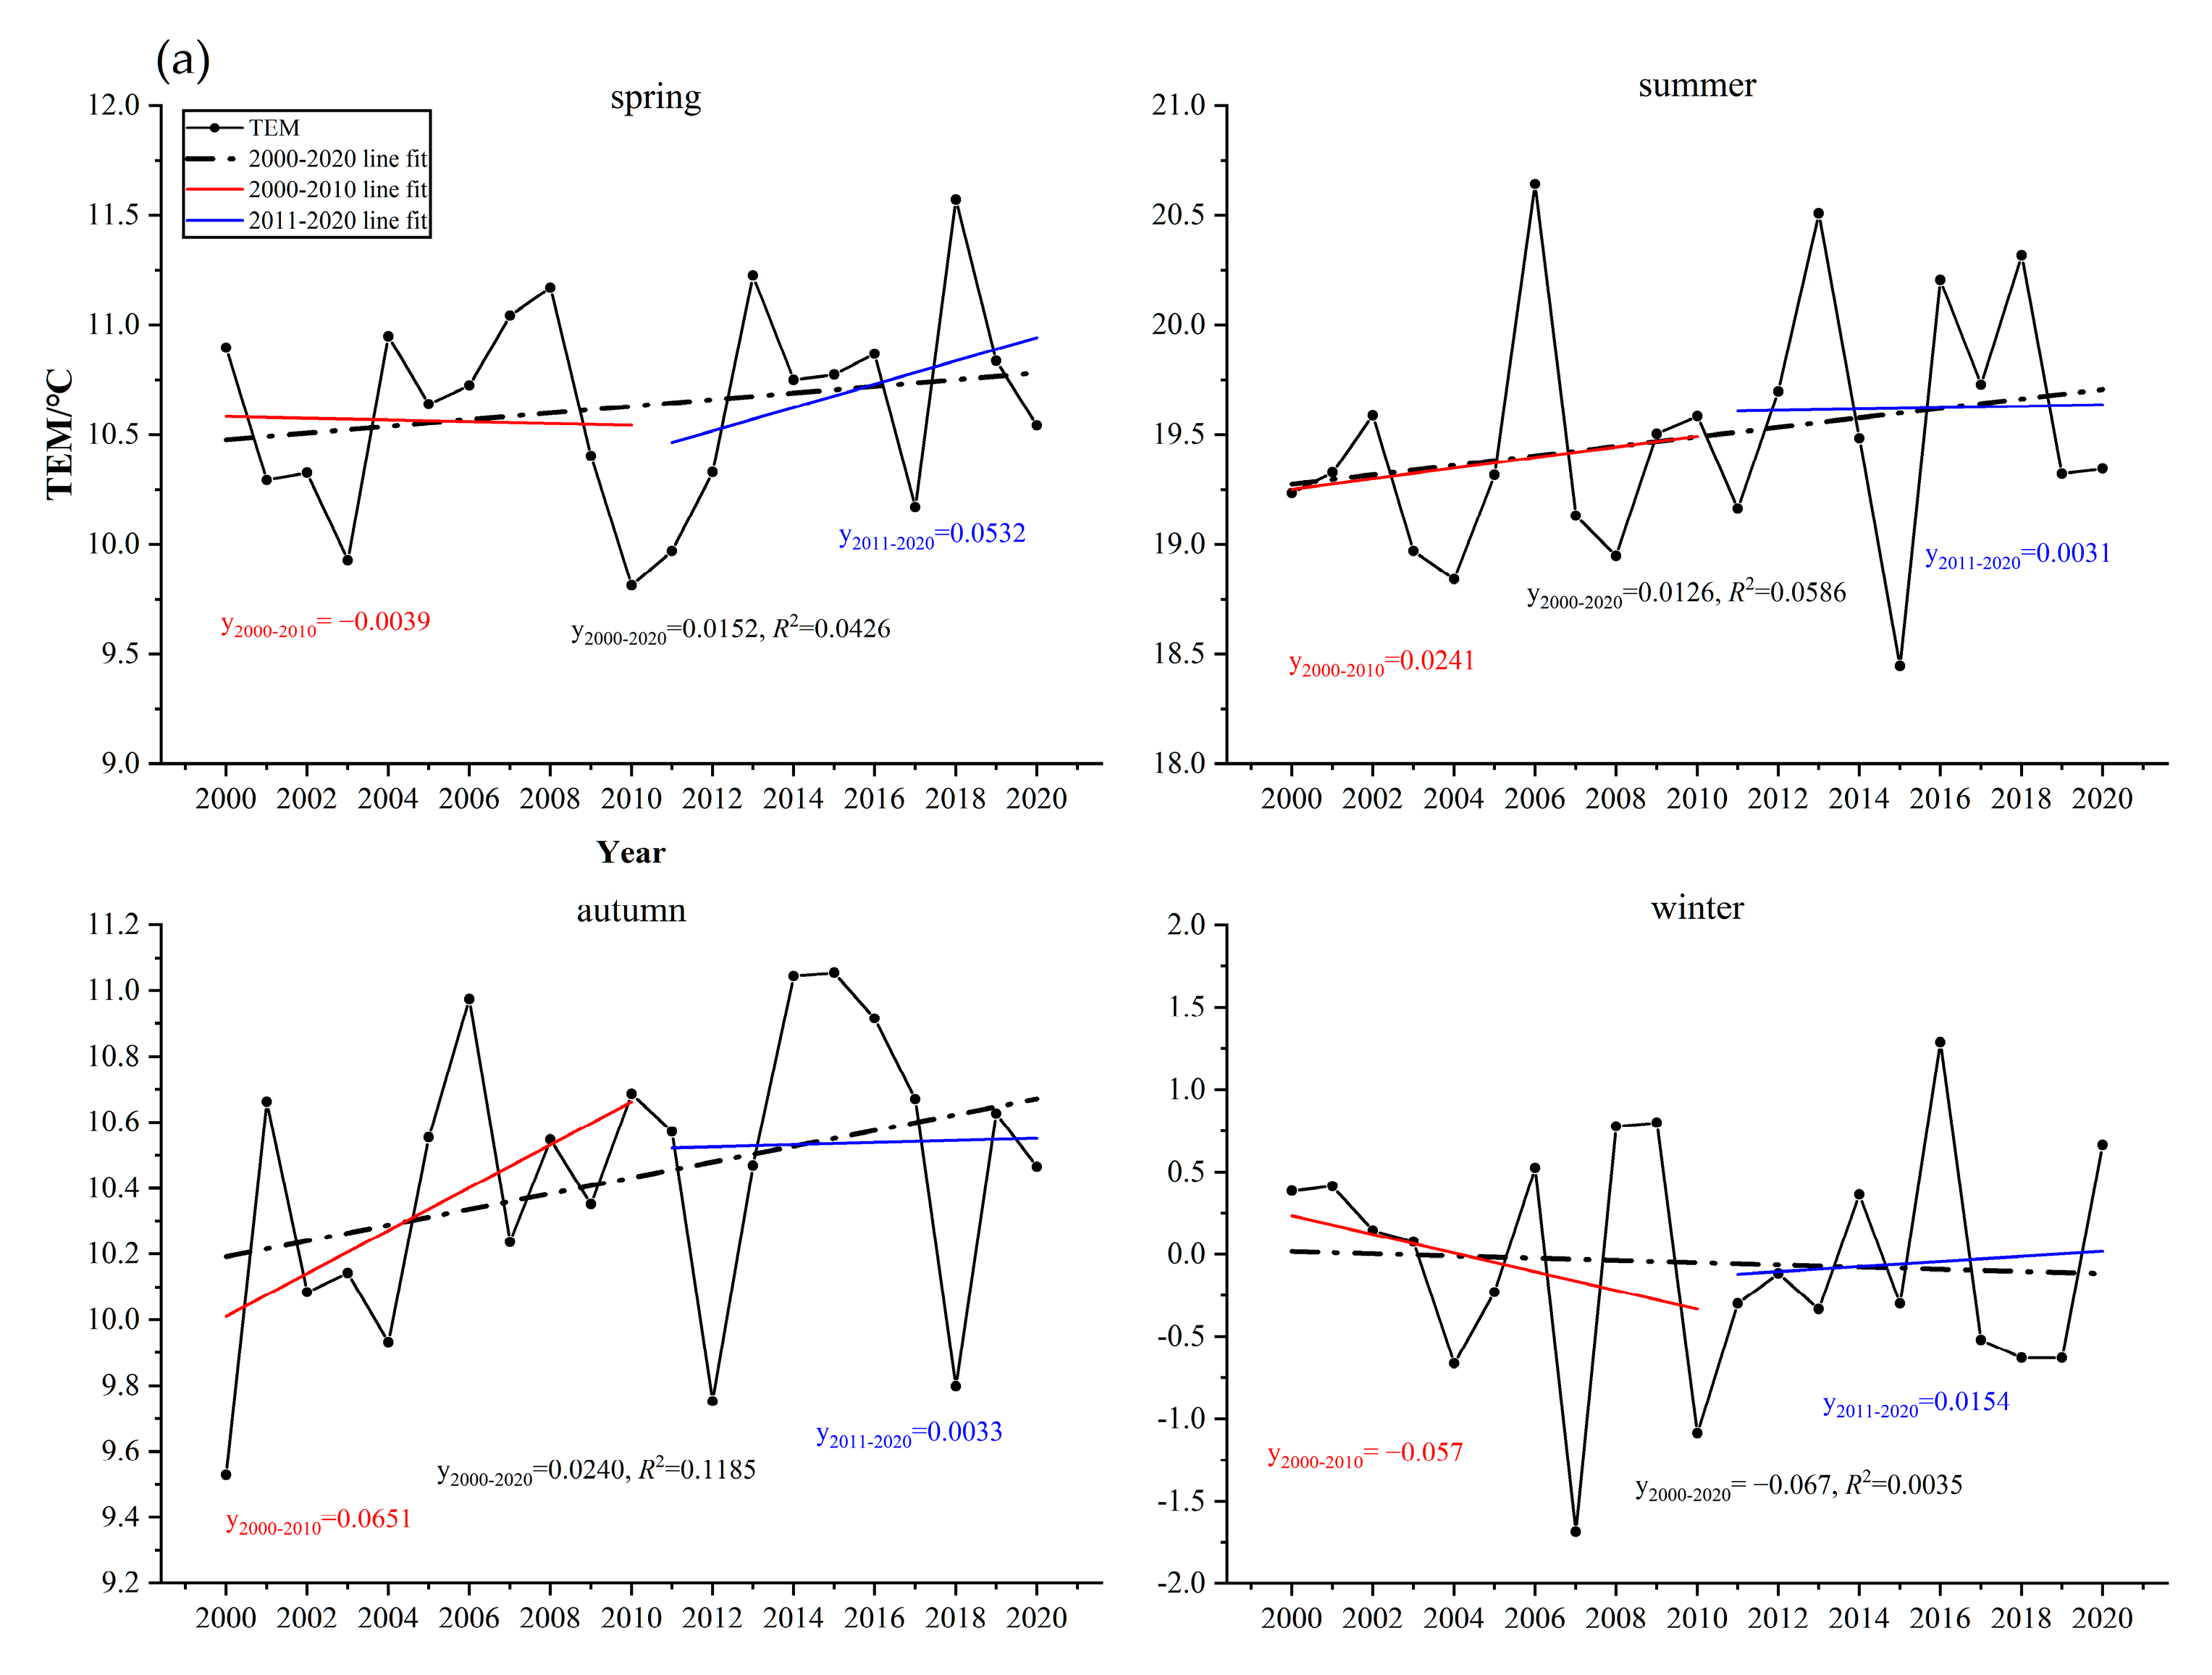
TEM increased significantly; but in the past five years, “cooling” was observed. The growth rate of the average
TEM in summer and autumn was higher, whereas that in winter was the slowest and showed a weak downward trend. The growth rate/deceleration was fastest in autumn/winter before 2010, and faster in winter and spring after 2010 (
Figure 7a).
Figure 6b shows that the annual
PRE has increased at a rate of 45.46 mm/10a in the past 21 years. Similar to the annual average
TEM, the average value and increase rate of annual
PRE before 2010 were smaller than those after 2010. The
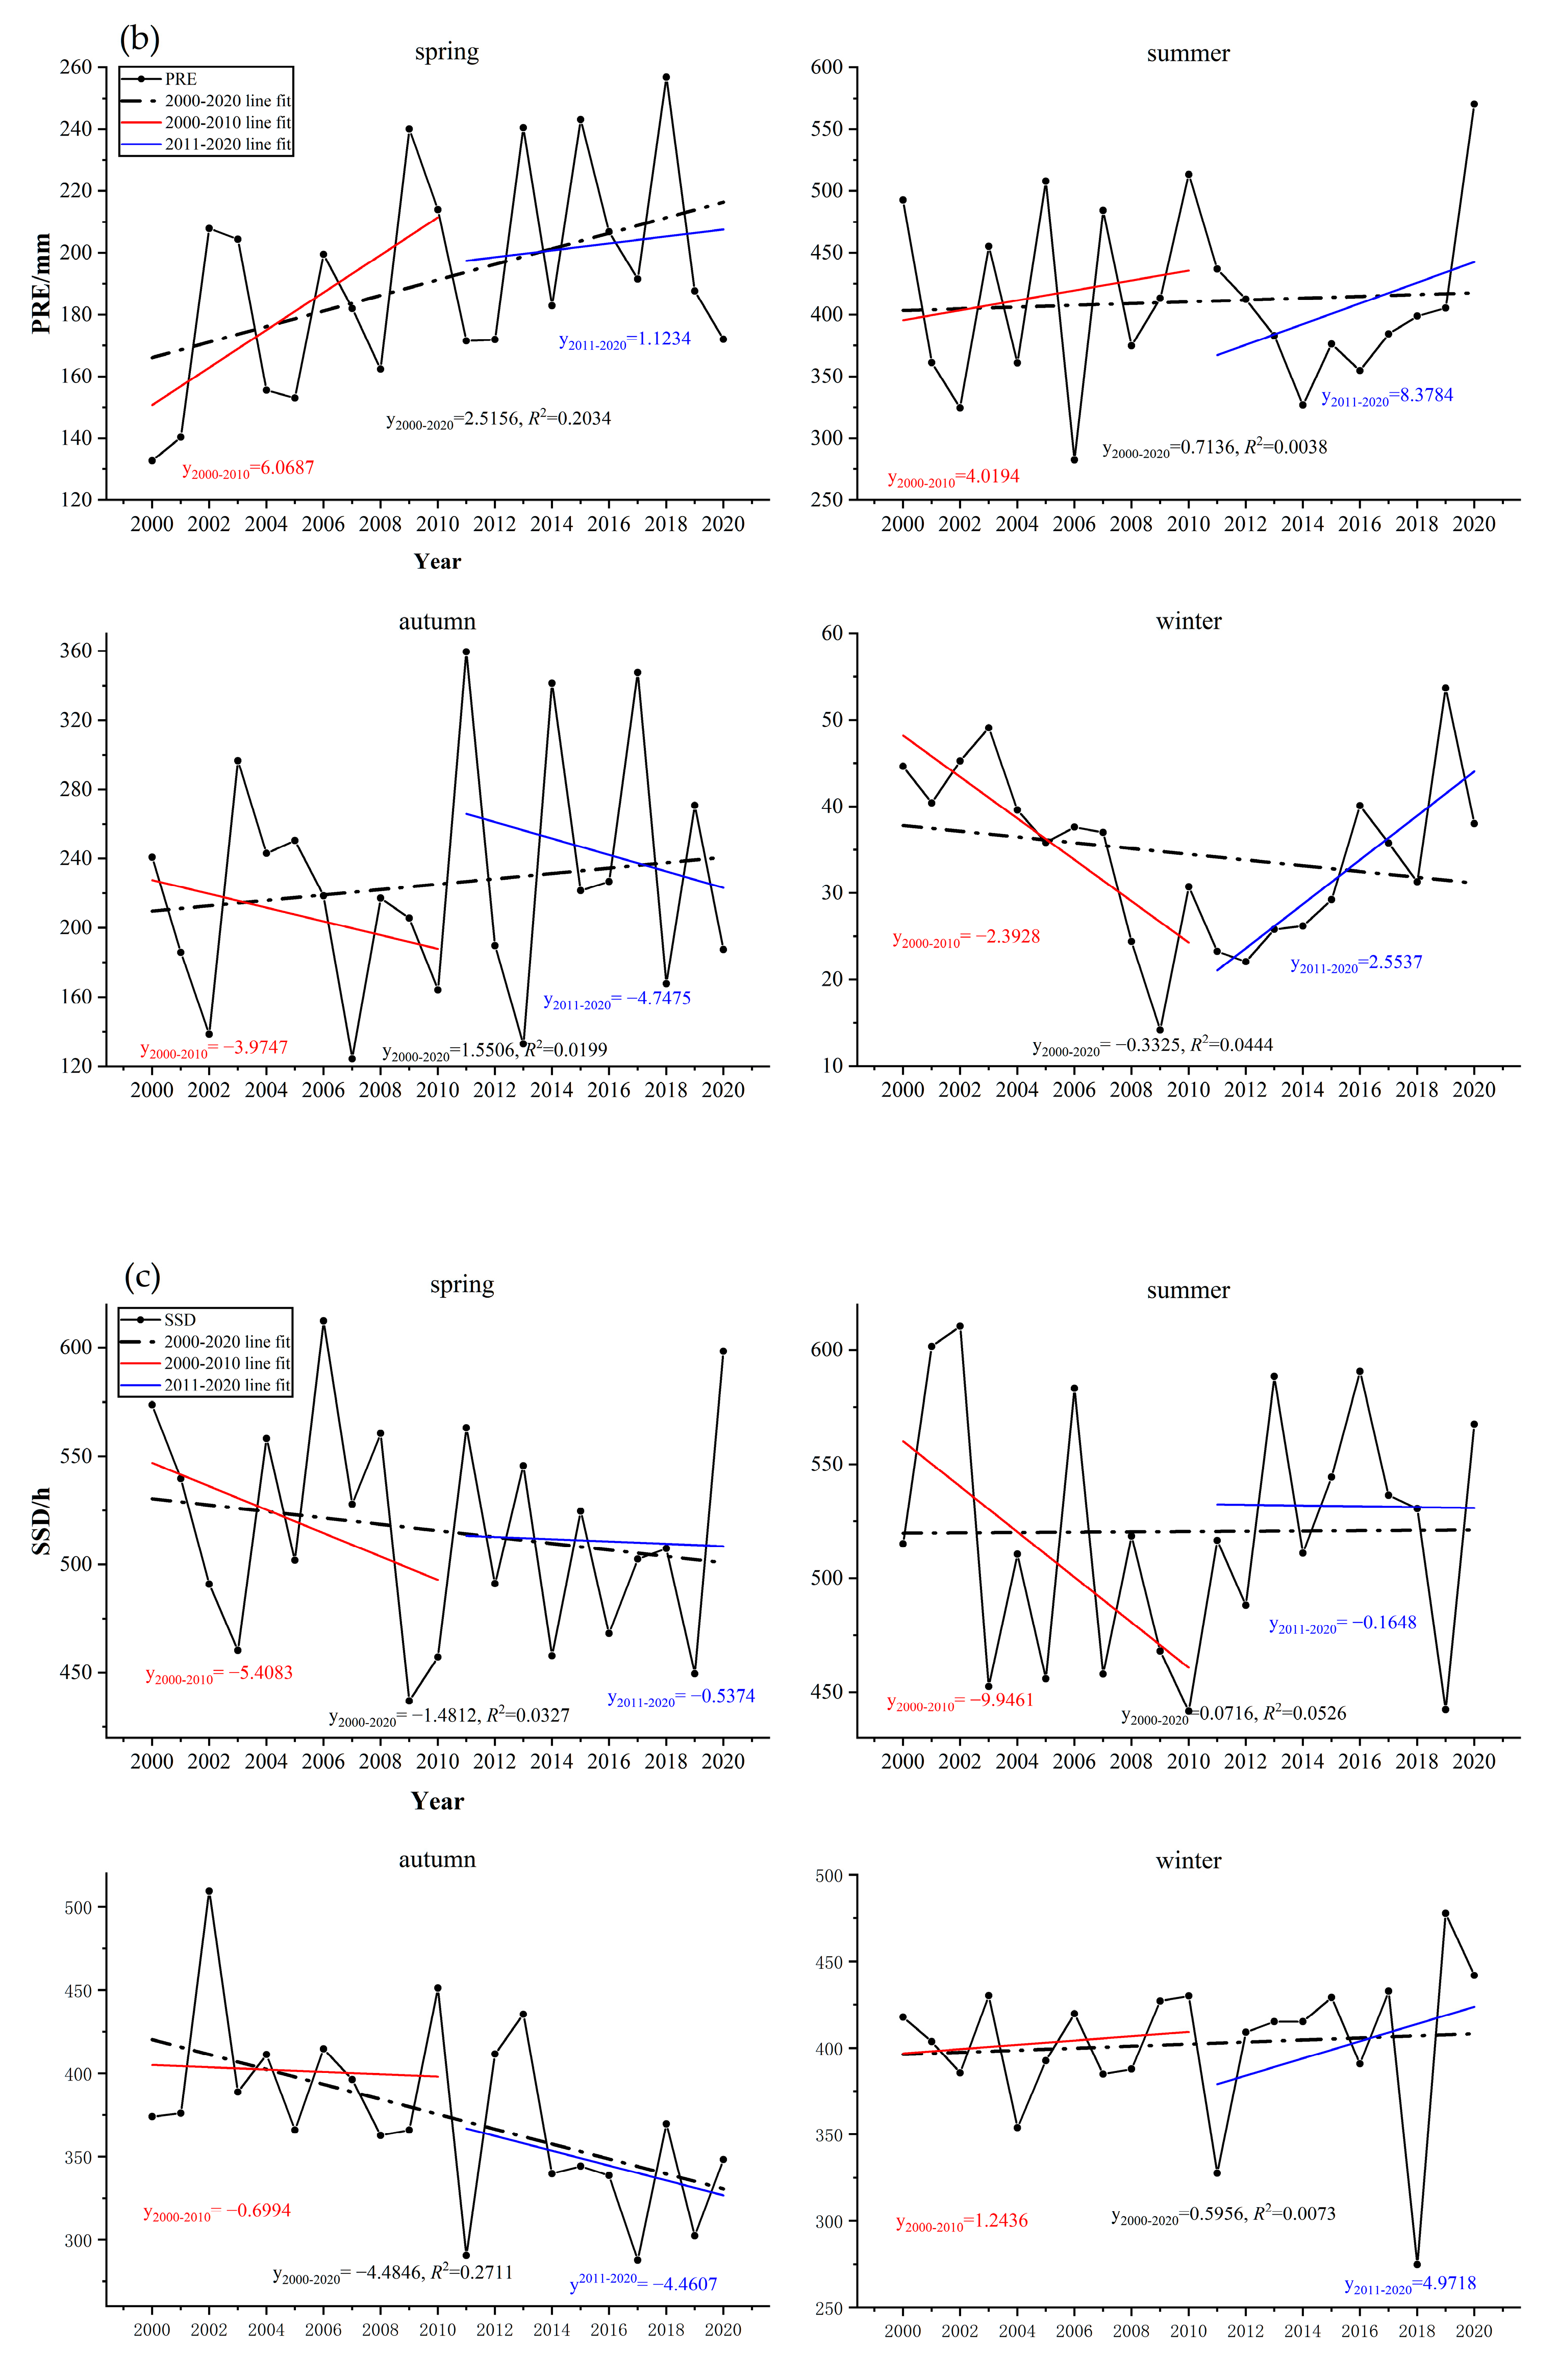
PRE in summer was the largest, slightly lower in spring than in autumn, and the lowest in winter (
Figure 7b). In all four seasons, the growth rate was fastest in spring, particularly before 2010; the next was autumn and summer, and their rate of change was faster after 2010. Generally, there was a slight downward trend in winter.
In contrast to the
TEM and
PRE, the annual
SSD showed a gradual downward trend at a rate of 66.89 h/10a during the study period (
Figure 6c), and the decline rate in the first 11 years was 2.8 times that in the next 10 years. According to the seasonal average, the
SSD in summer and spring was longer, followed by winter and autumn. Seasonally, spring and autumn showed a decreasing trend, summer and winter showed an increasing trend, and the fall/rise speed was faster in autumn/winter. However, it was found that the rate of decline in spring and summer was faster in 2000–2010, being fastest in autumn, whereas it was the fastest in winter in 2011–2020.
3.2.2. Spatial Pattern Change
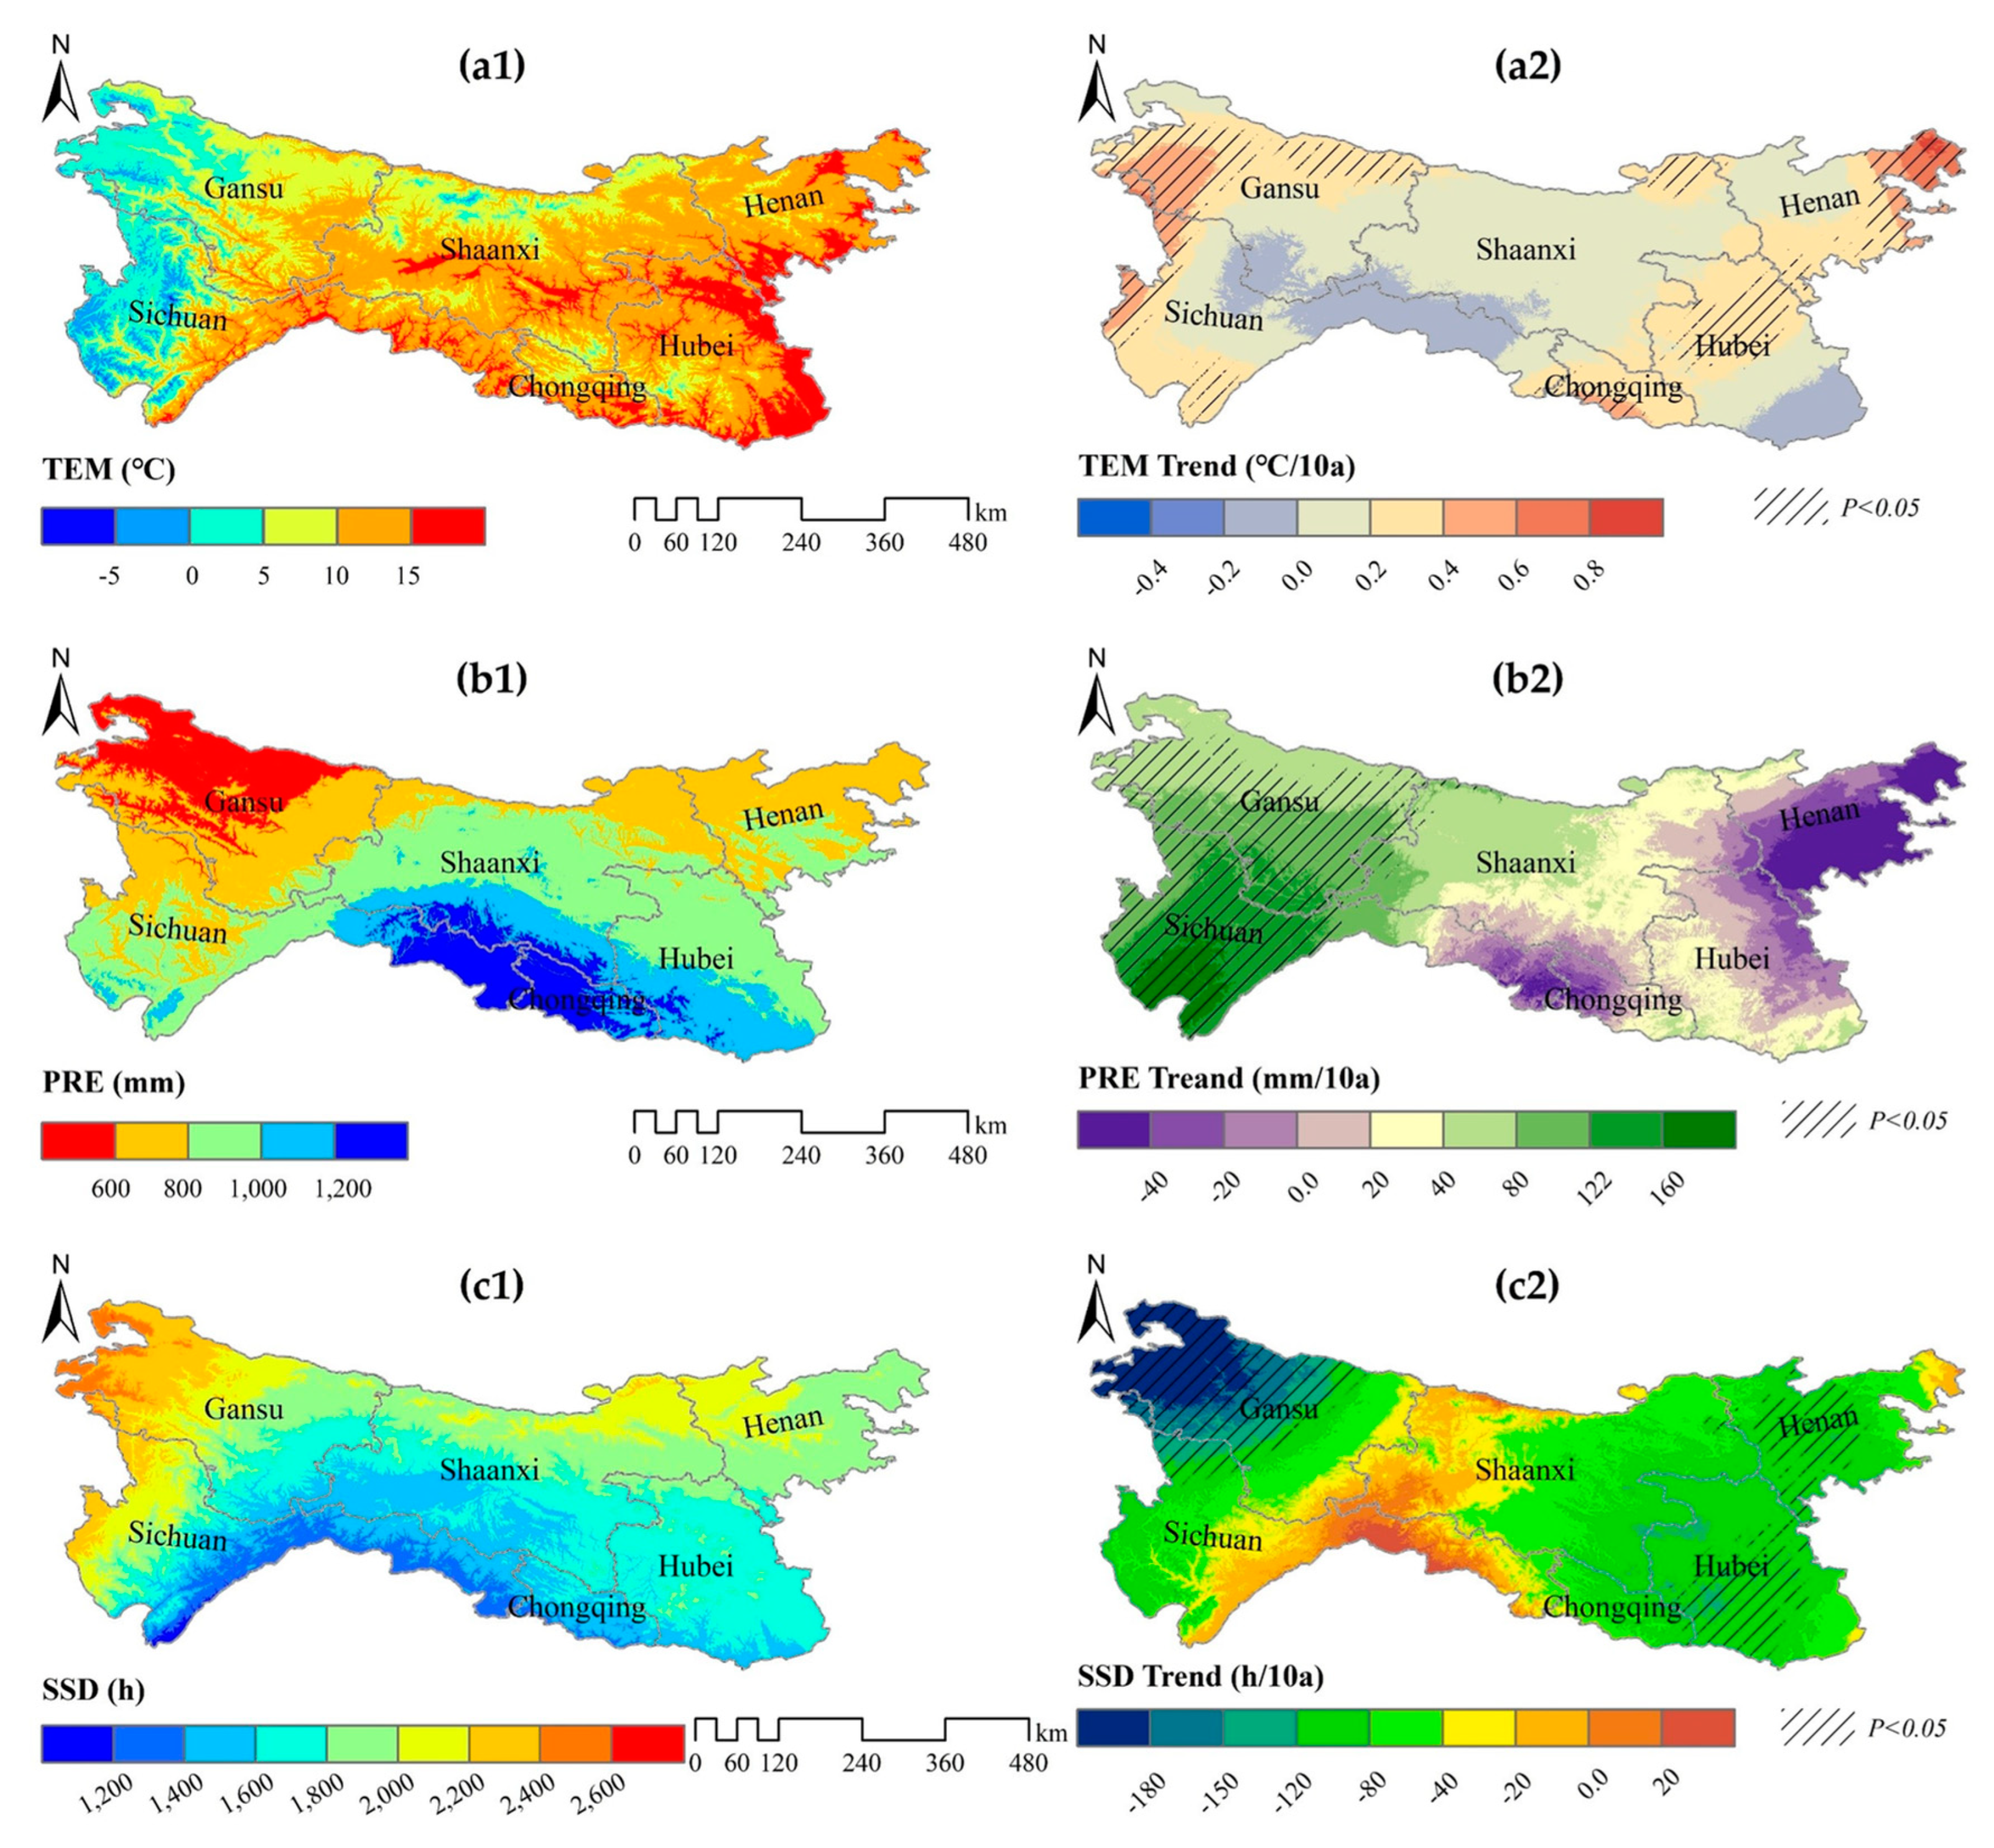
From 2000–2020, the annual average
TEM of the QBM was generally distributed in the zonal direction, that is, the spatial distribution characteristics of gradual increase from northwest to southeast (
Figure 8(a1)). The low-value was concentrated in the western Songpan Plateau, whereas the high-value was mainly distributed in the eastern plain. Among them, Hubei and Henan had the highest, Gansu had the lowest (
Table 5). Spatially, the heating rate generally increased from the central regions to both sides (
Figure 8(a2)). The cooling areas were mainly distributed in the south, Guangyuan and Yichang, but the significance was weak. The regions that warmed faster (>0.60 °C/10a) and passes the significance level test were located mainly in Gannan, Luoyang, and Zhengzhou. In all regions, the fastest average warming rate was in Henan, and the slowest was in Shaanxi.
Figure 8(b1) shows that the annual
PRE was generally characterized by a gradual decrease in spatial distribution from southeast to northwest. The average annual
PRE in Chongqing was the largest, whereas that in Gansu was the smallest. The annual
PRE change rate of increase is generally characterized by its distribution increasing from east to west (
Figure 8(b2)). In the past 21 years, the regions with reduced
PRE were concentrated around the mountains of western Henan and Daba Mountains but did not pass the significance test. The faster (>160 mm/10a) increase trend rate was mainly distributed in the southwest, such as in Maoxian, Sichuan. The regional average annual
PRE growth rate was the largest in Sichuan and the smallest in Henan.
The spatial distribution of annual
SSD generally increases with increasing latitude, that is, it is low in the south and high in the north. High values of annual
SSD are mainly distributed in the northwest, whereas the low-value area was concentrated in the northern edge of Sichuan Basin. Gansu and Henan have the largest value, and Chongqing has the smallest value.
Figure 8(c1) shows that the annual
SSD in most regions is decreasing. The increasing trend was concentrated in the northern edge of Sichuan Basin, while the decreasing trend was in the northwest, including Dingxi, Gannan and Linxia.
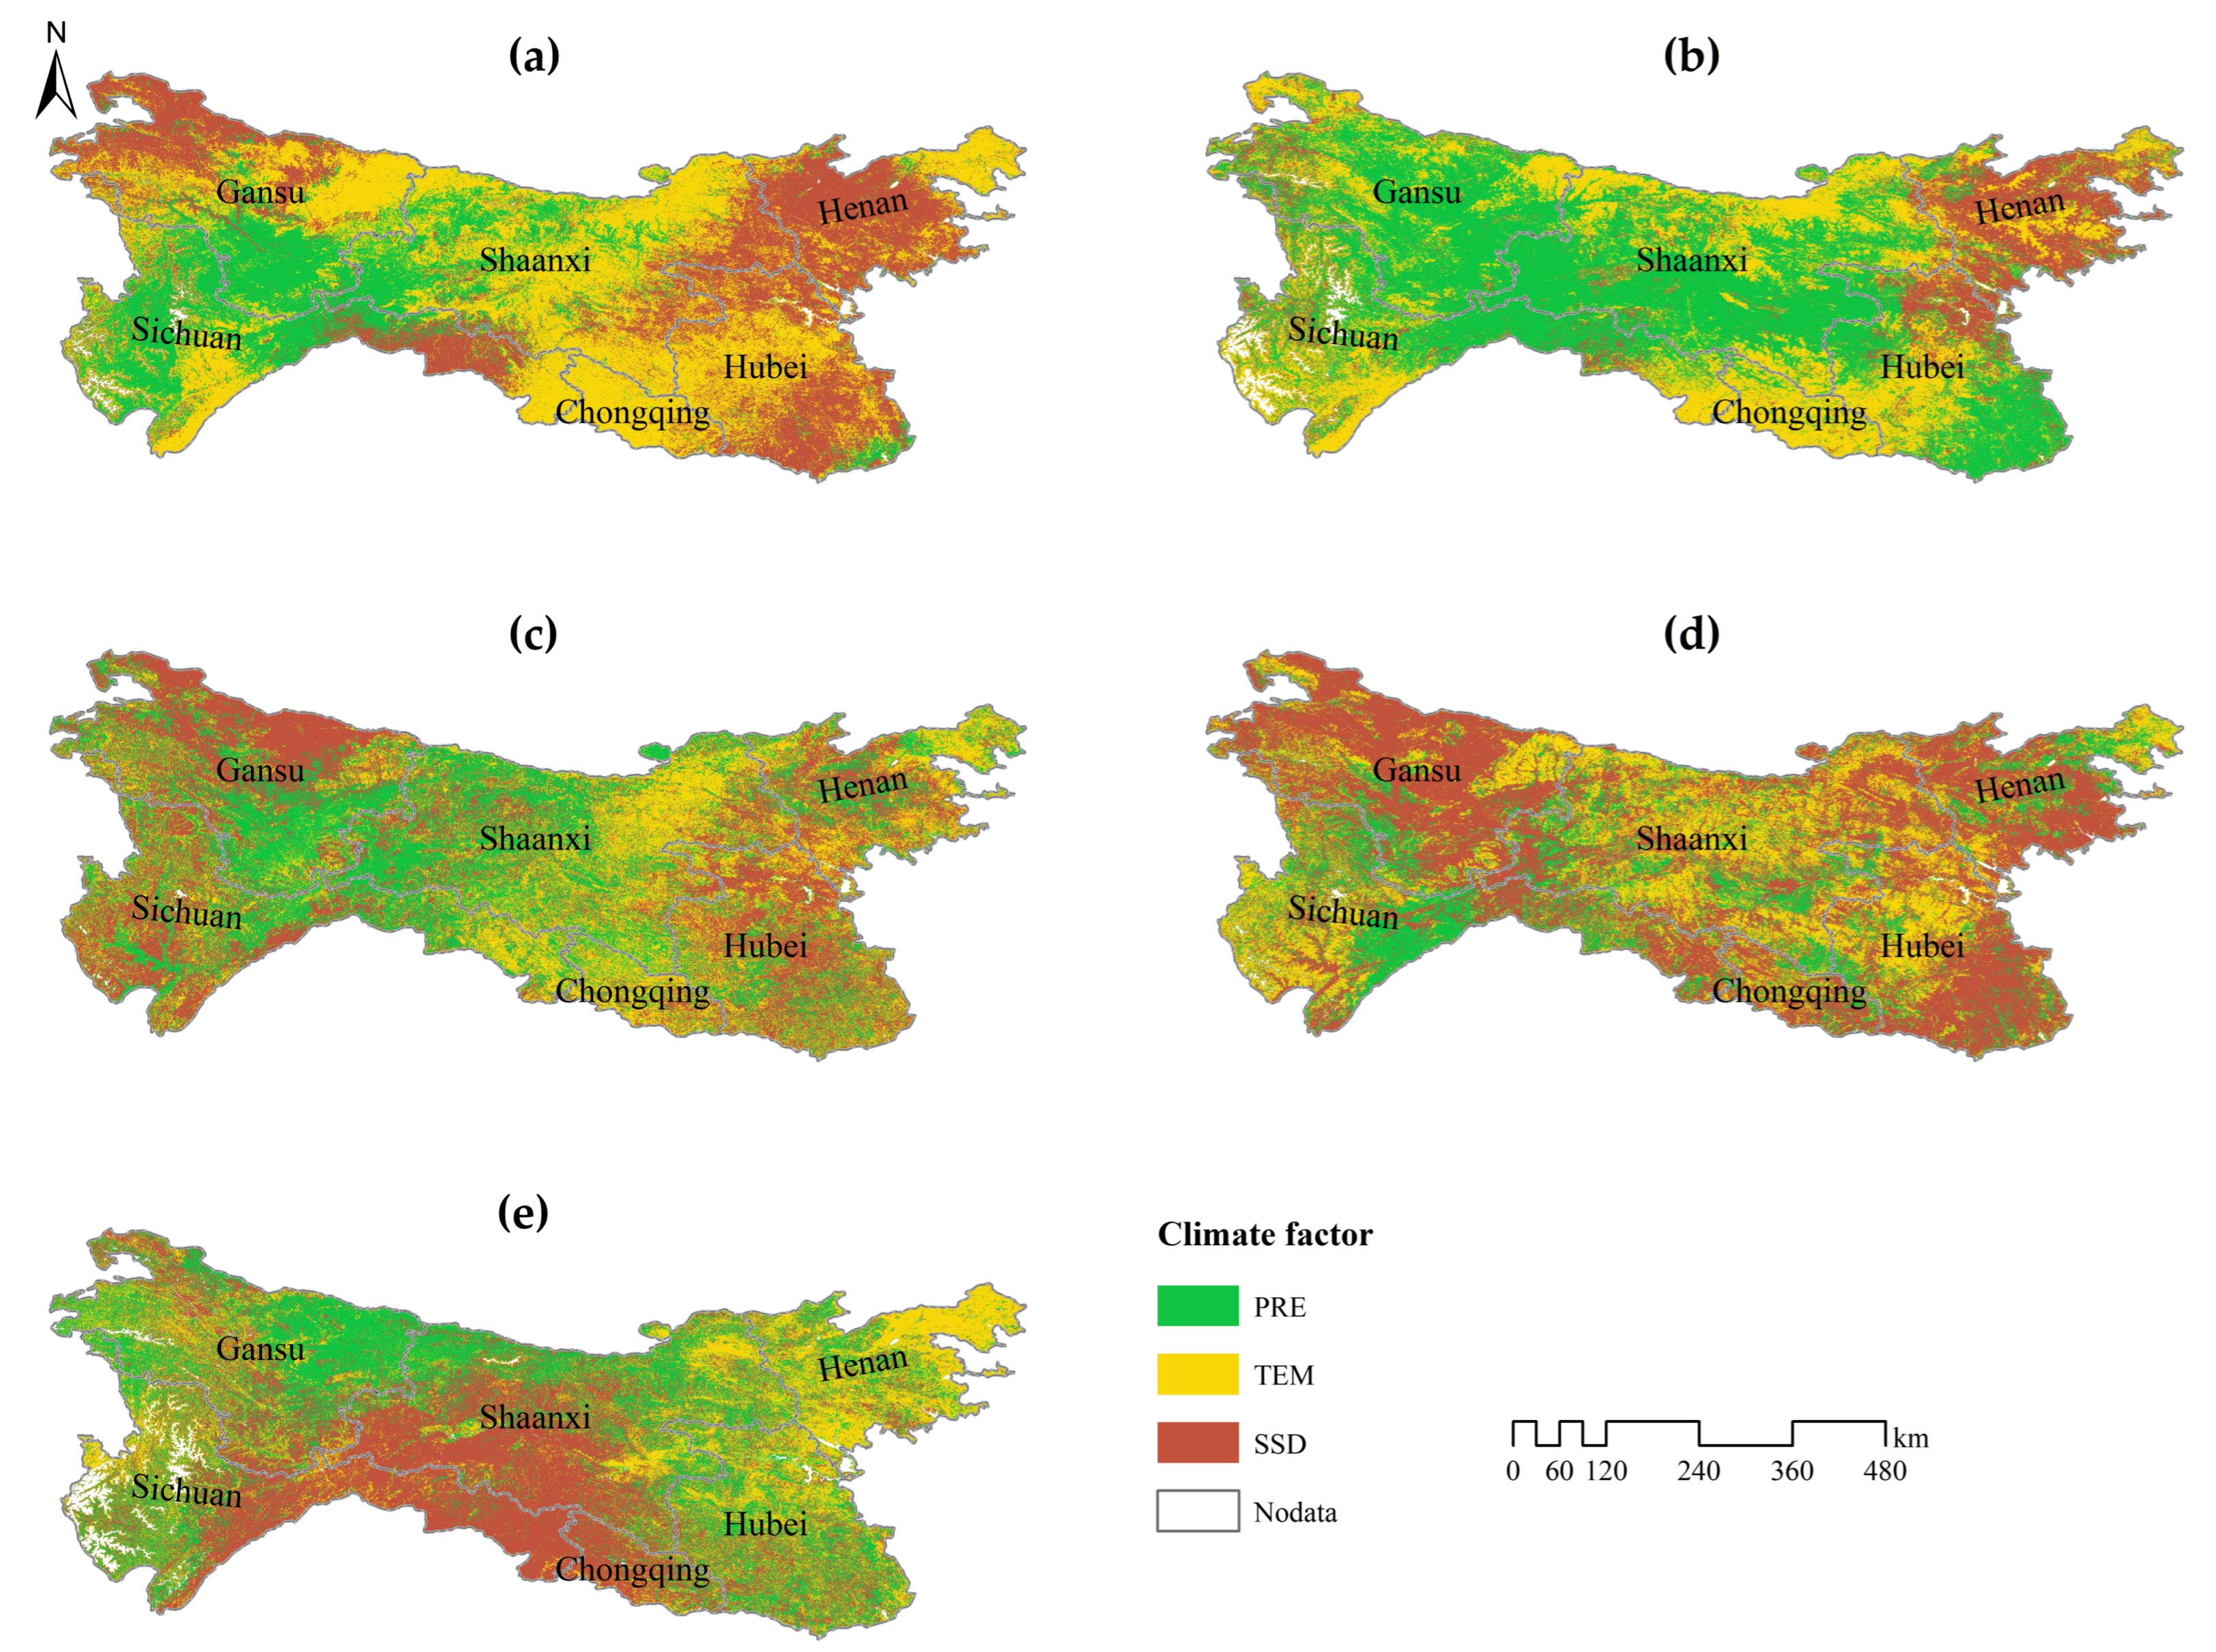
In summary, the west of the QBM was cold and dry with ample sunshine. The south was warm and humid, but the SSD was short. Most areas in the north were warm and dry with long SSD. However, these characteristics have changed over the past 21 years. The western region is gradually warming and humidifying, whereas the SSD is significantly reduced. In the southern region, TEM and humidity have decreased, but SSD has begun to increase. TEM, PRE, and SSD in the north show a weak increase/decrease trend.
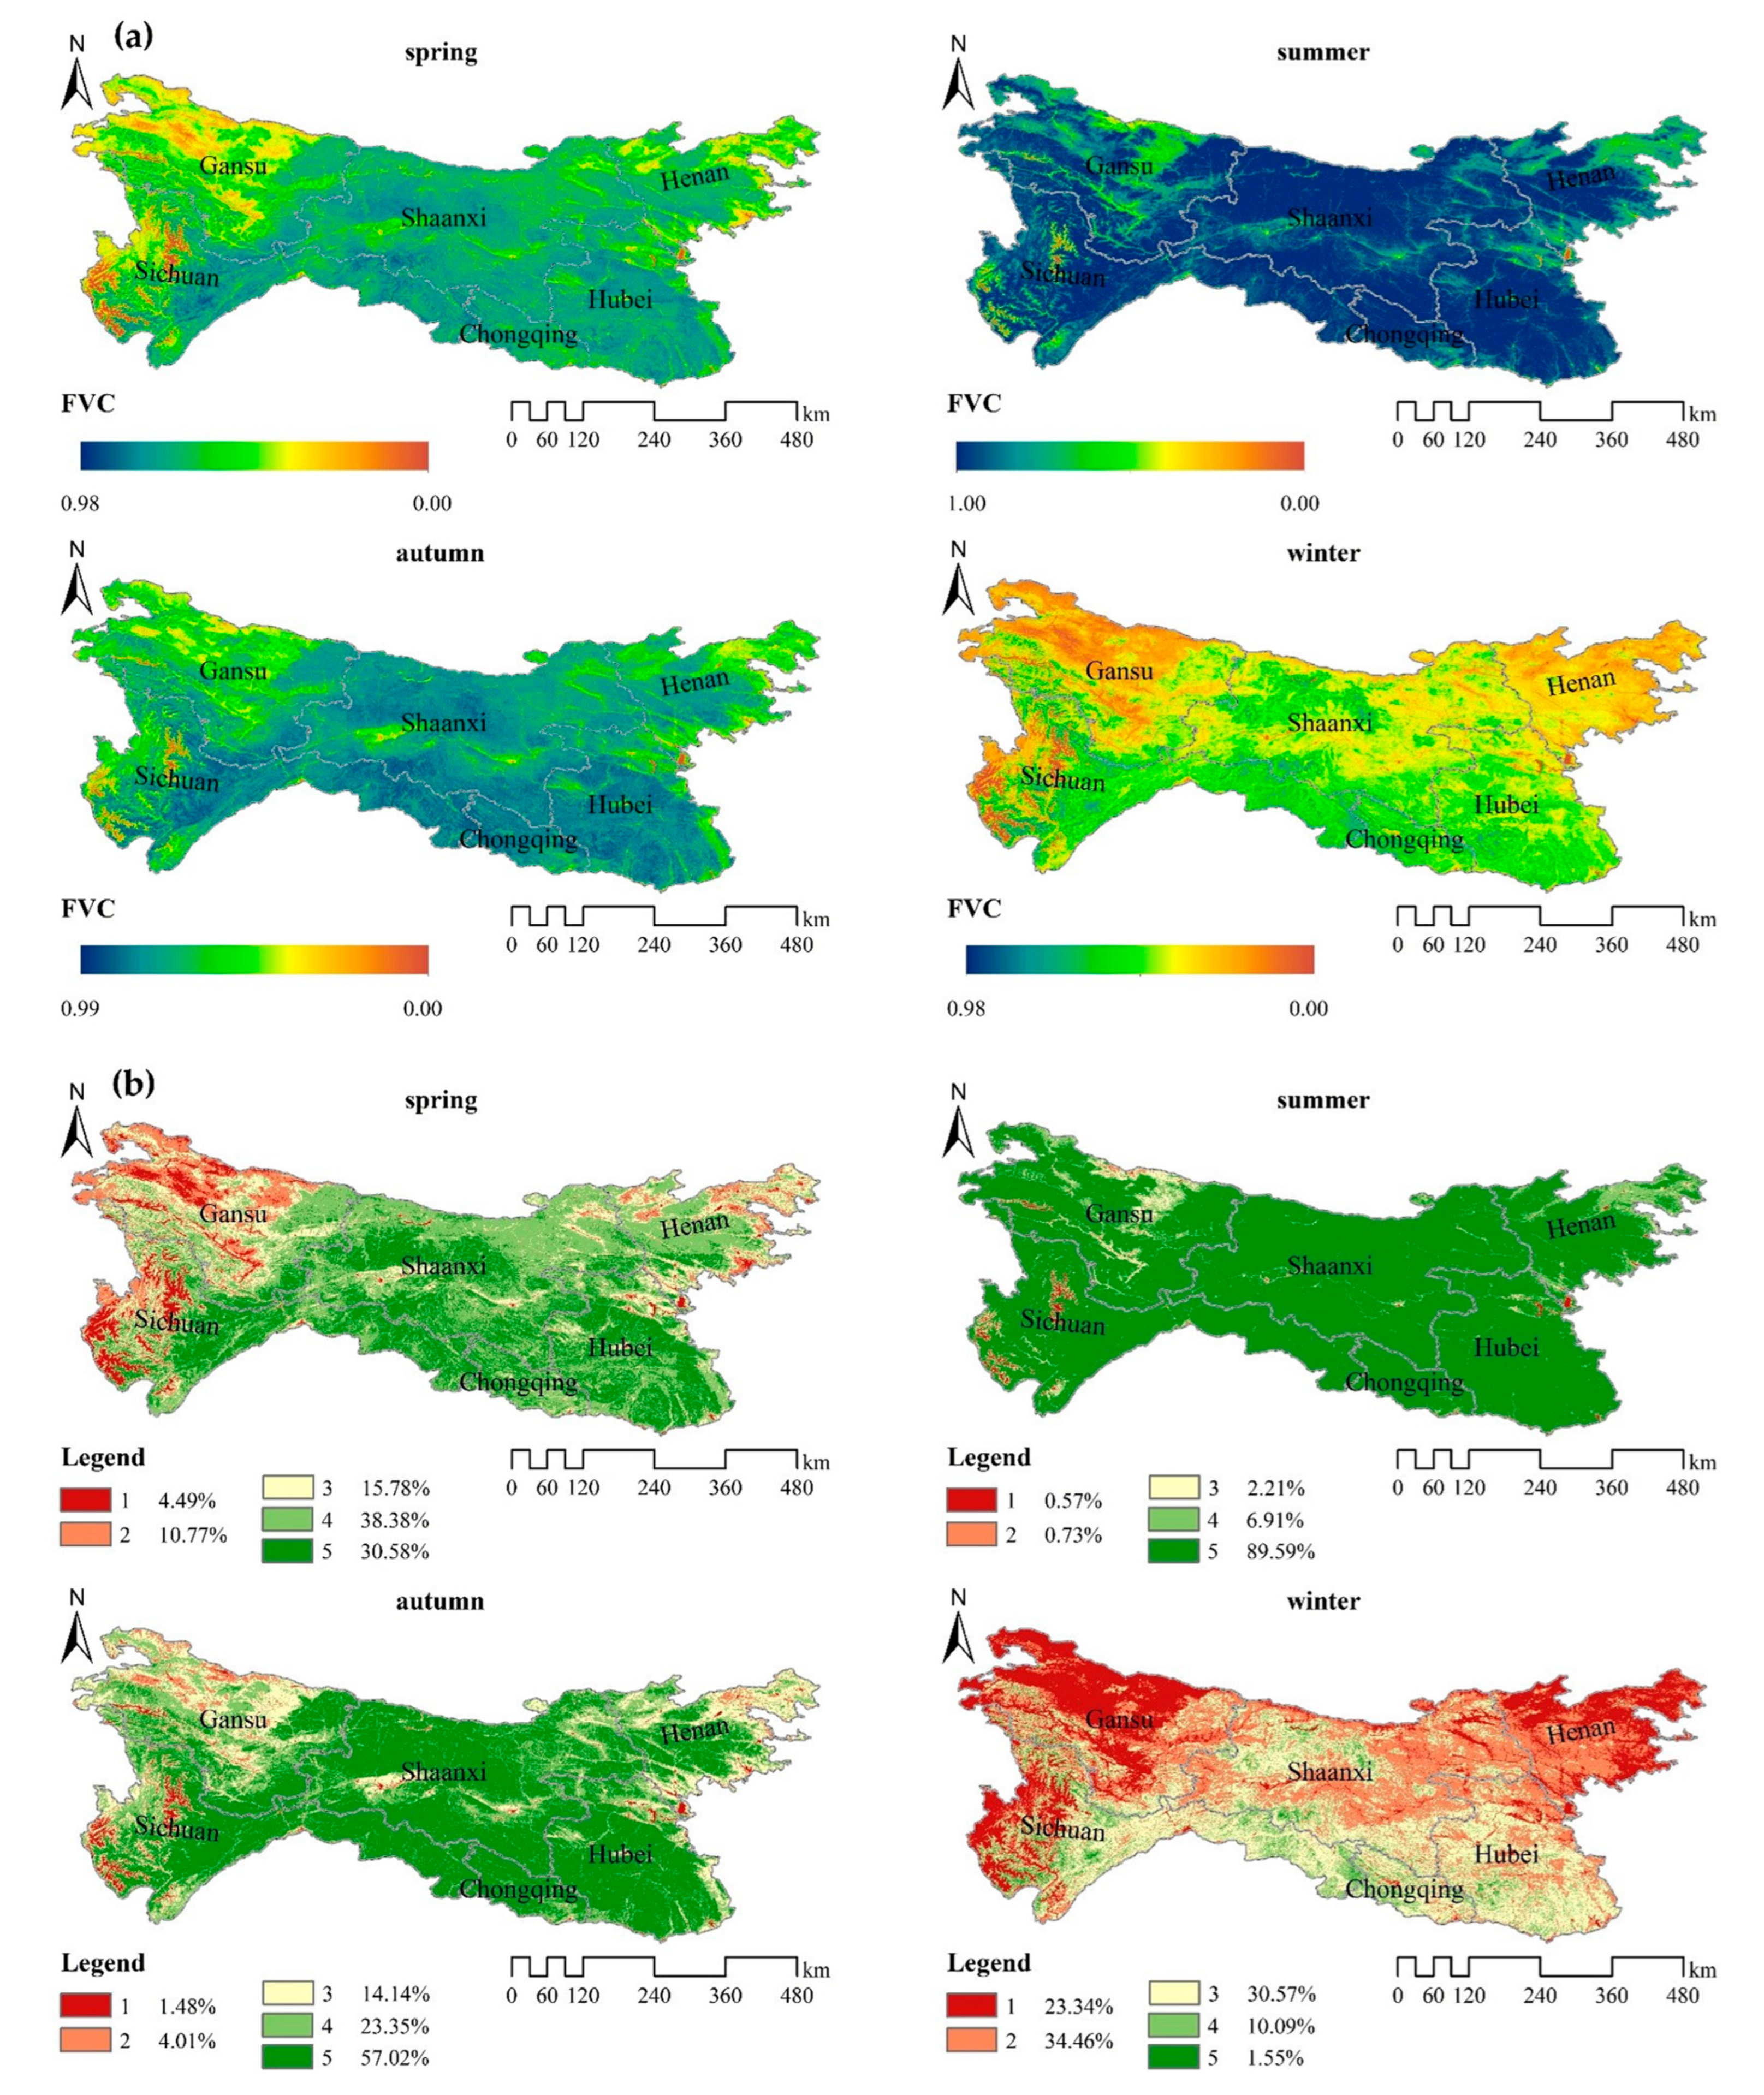
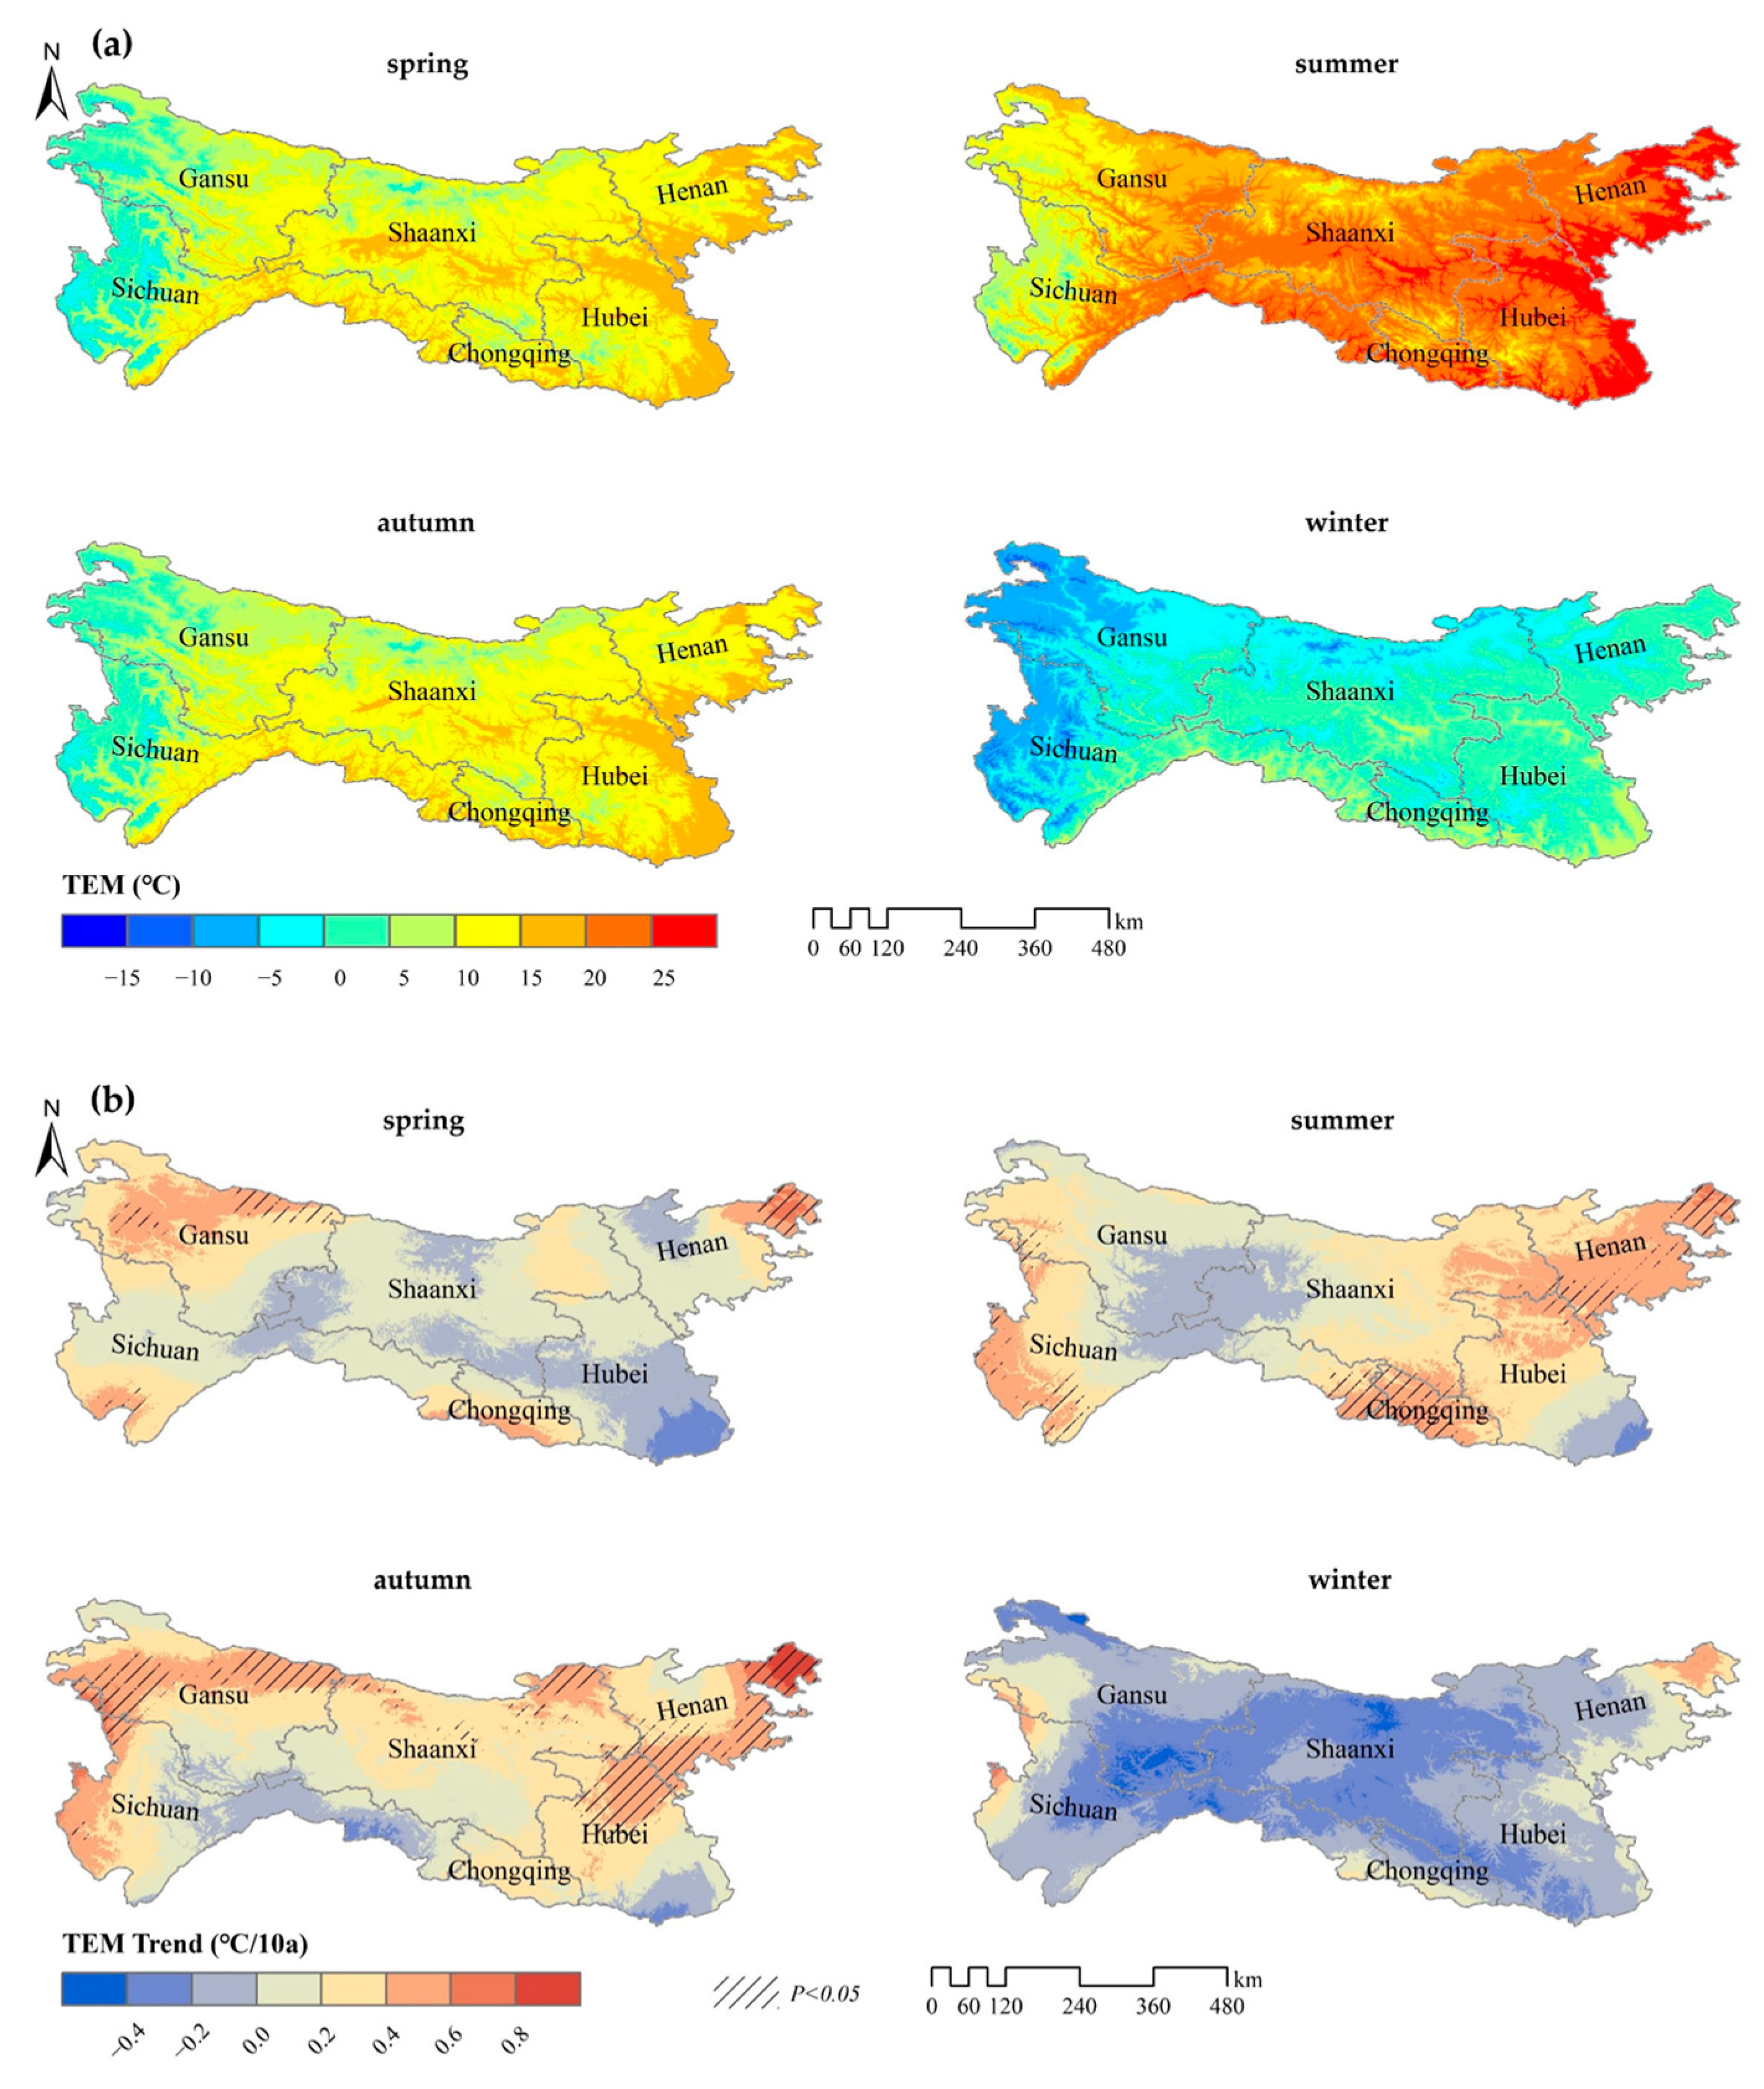
In the past 21 years, the spatial distribution characteristics of the average
TEM in each season showed a gradual increase from west to east. The spatial difference of average
TEM in summer was the largest, the maximum value between east and west was more than 25 °C (
Figure 9a). The annual average
TEM in each season was 10.63 °C, 19.49 °C, 10.43 °C and −0.05 °C in spring, summer, autumn, and winter, respectively (
Table 6). Gansu had the lowest average
TEM in spring, autumn and winter, and Shaanxi had the lowest average
TEM in summer, whereas Henan had the highest in spring and summer, and Hubei and Chongqing had the highest in autumn and winter.
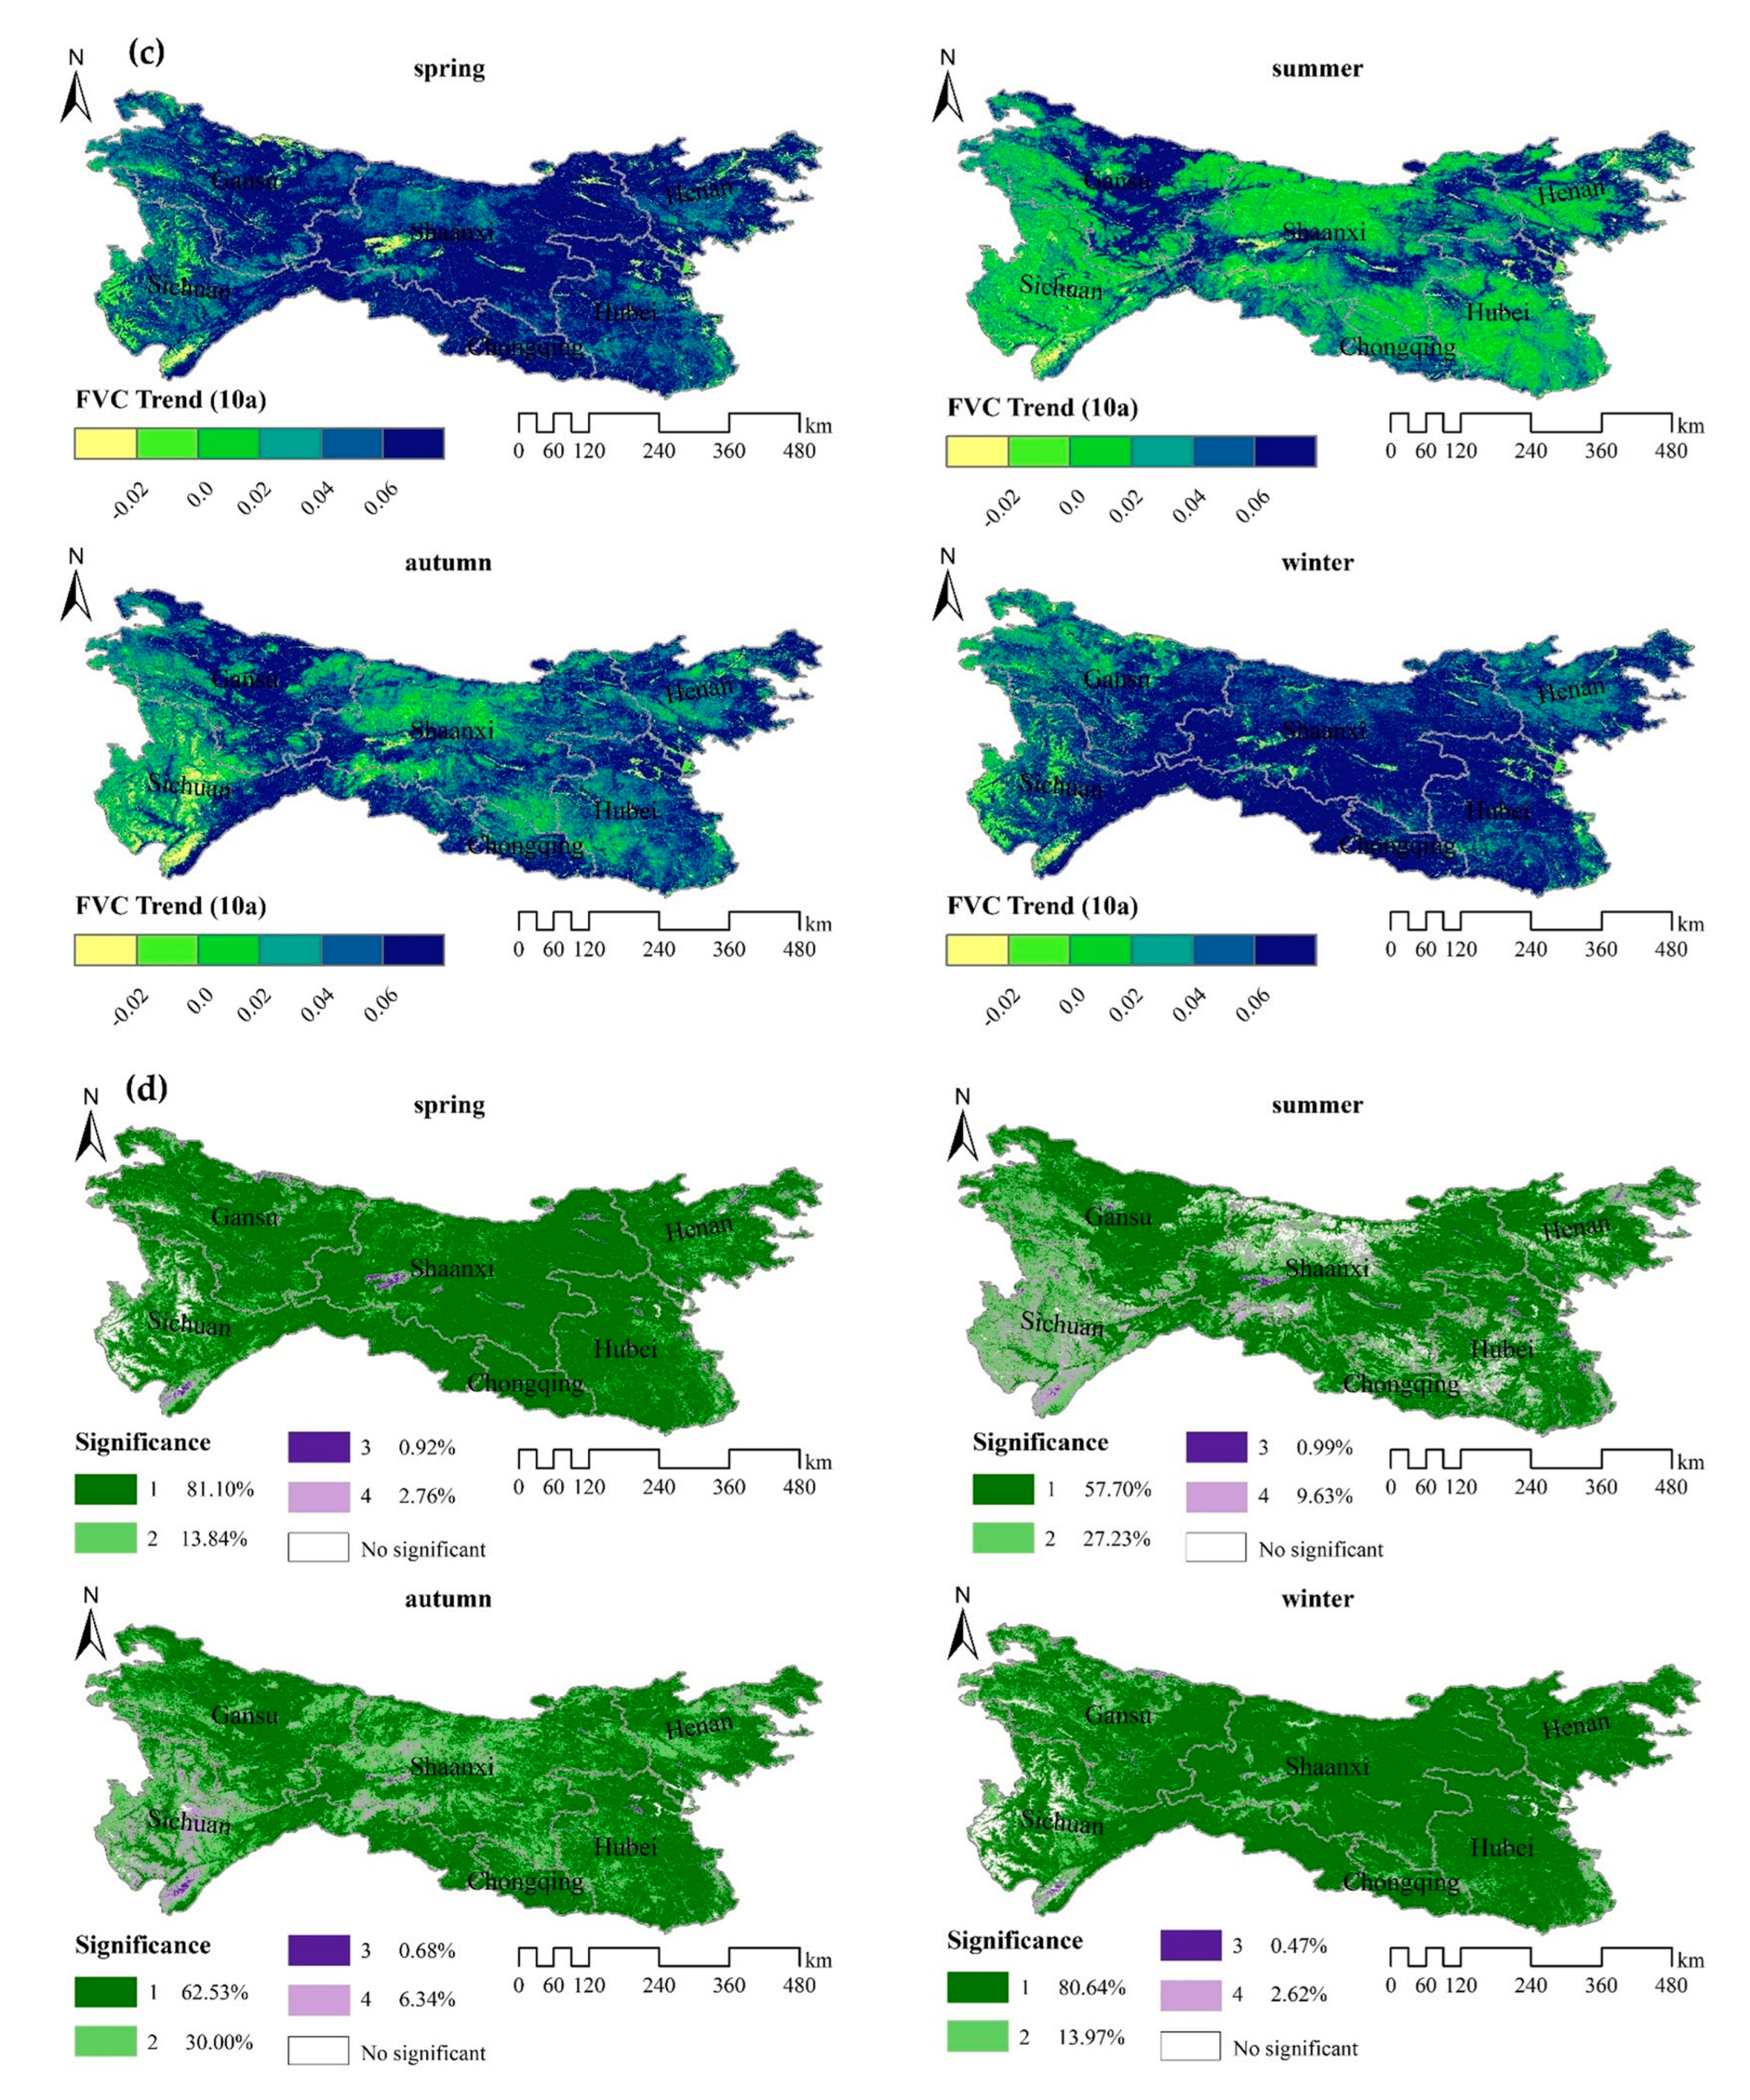
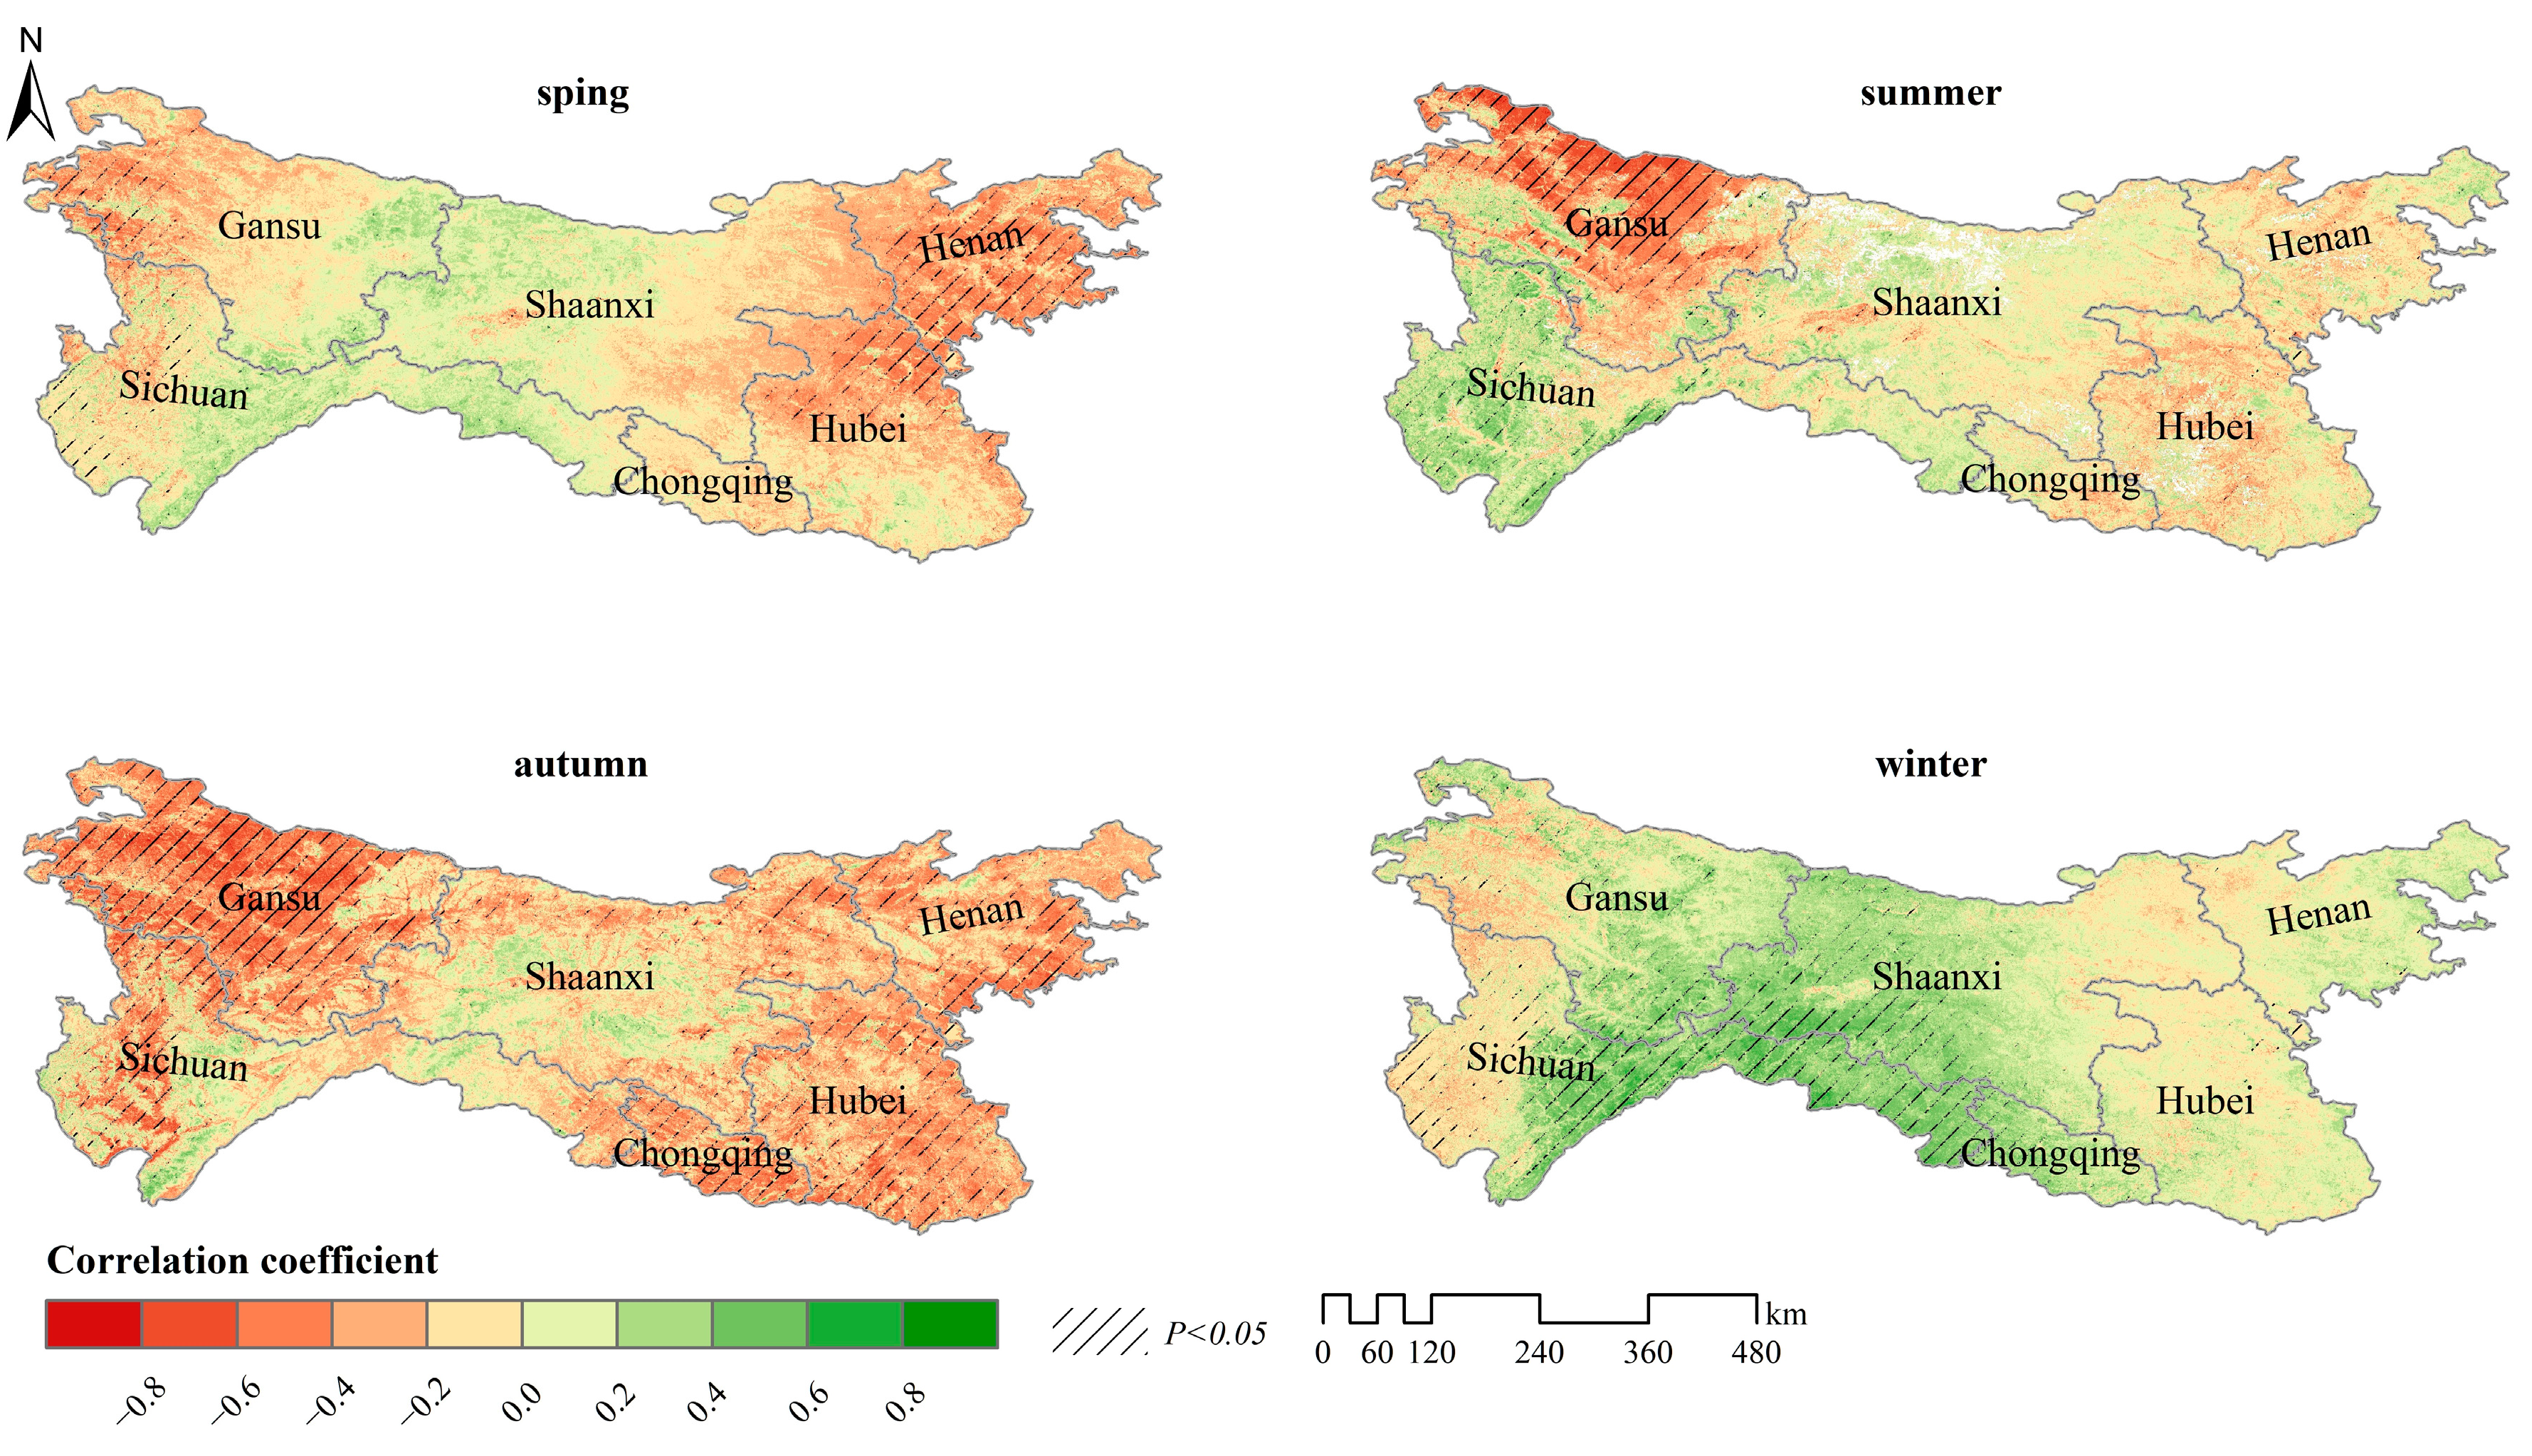
The variation in average
TEM in each season exhibited spatial heterogeneity. Most areas showed a warming trend in all seasons except for winter (
Figure 9b). The
TEM dropped in spring, mainly in the junction of Gansu, Shaanxi, and Sichuan, and south of the Han River. In summer, the cooling area was still concentrated at the junction of Gansu, Shaanxi, and Sichuan, the trend rate changed from negative to positive, and the diffusion increased from this central area. The autumn cooling areas were concentrated in the south, especially in Sichuan. The average
TEM in winter showed a downward trend overall, and the warming trend was mainly to the east and west.
From a regional perspective, the seasonal average TEM in Sichuan, Henan, Hubei, and Chongqing, as for FVC, initially experienced an increasing but then decreased. The maximum and minimum trend rates occurred in summer and winter, respectively. Although Shaanxi initially increased and then decreased, the maximum trend occurred in autumn. The change in trend rate in Gansu alternated from a change of decrease to increase to decrease, with the maximum appearing in autumn and the minimum in winter.
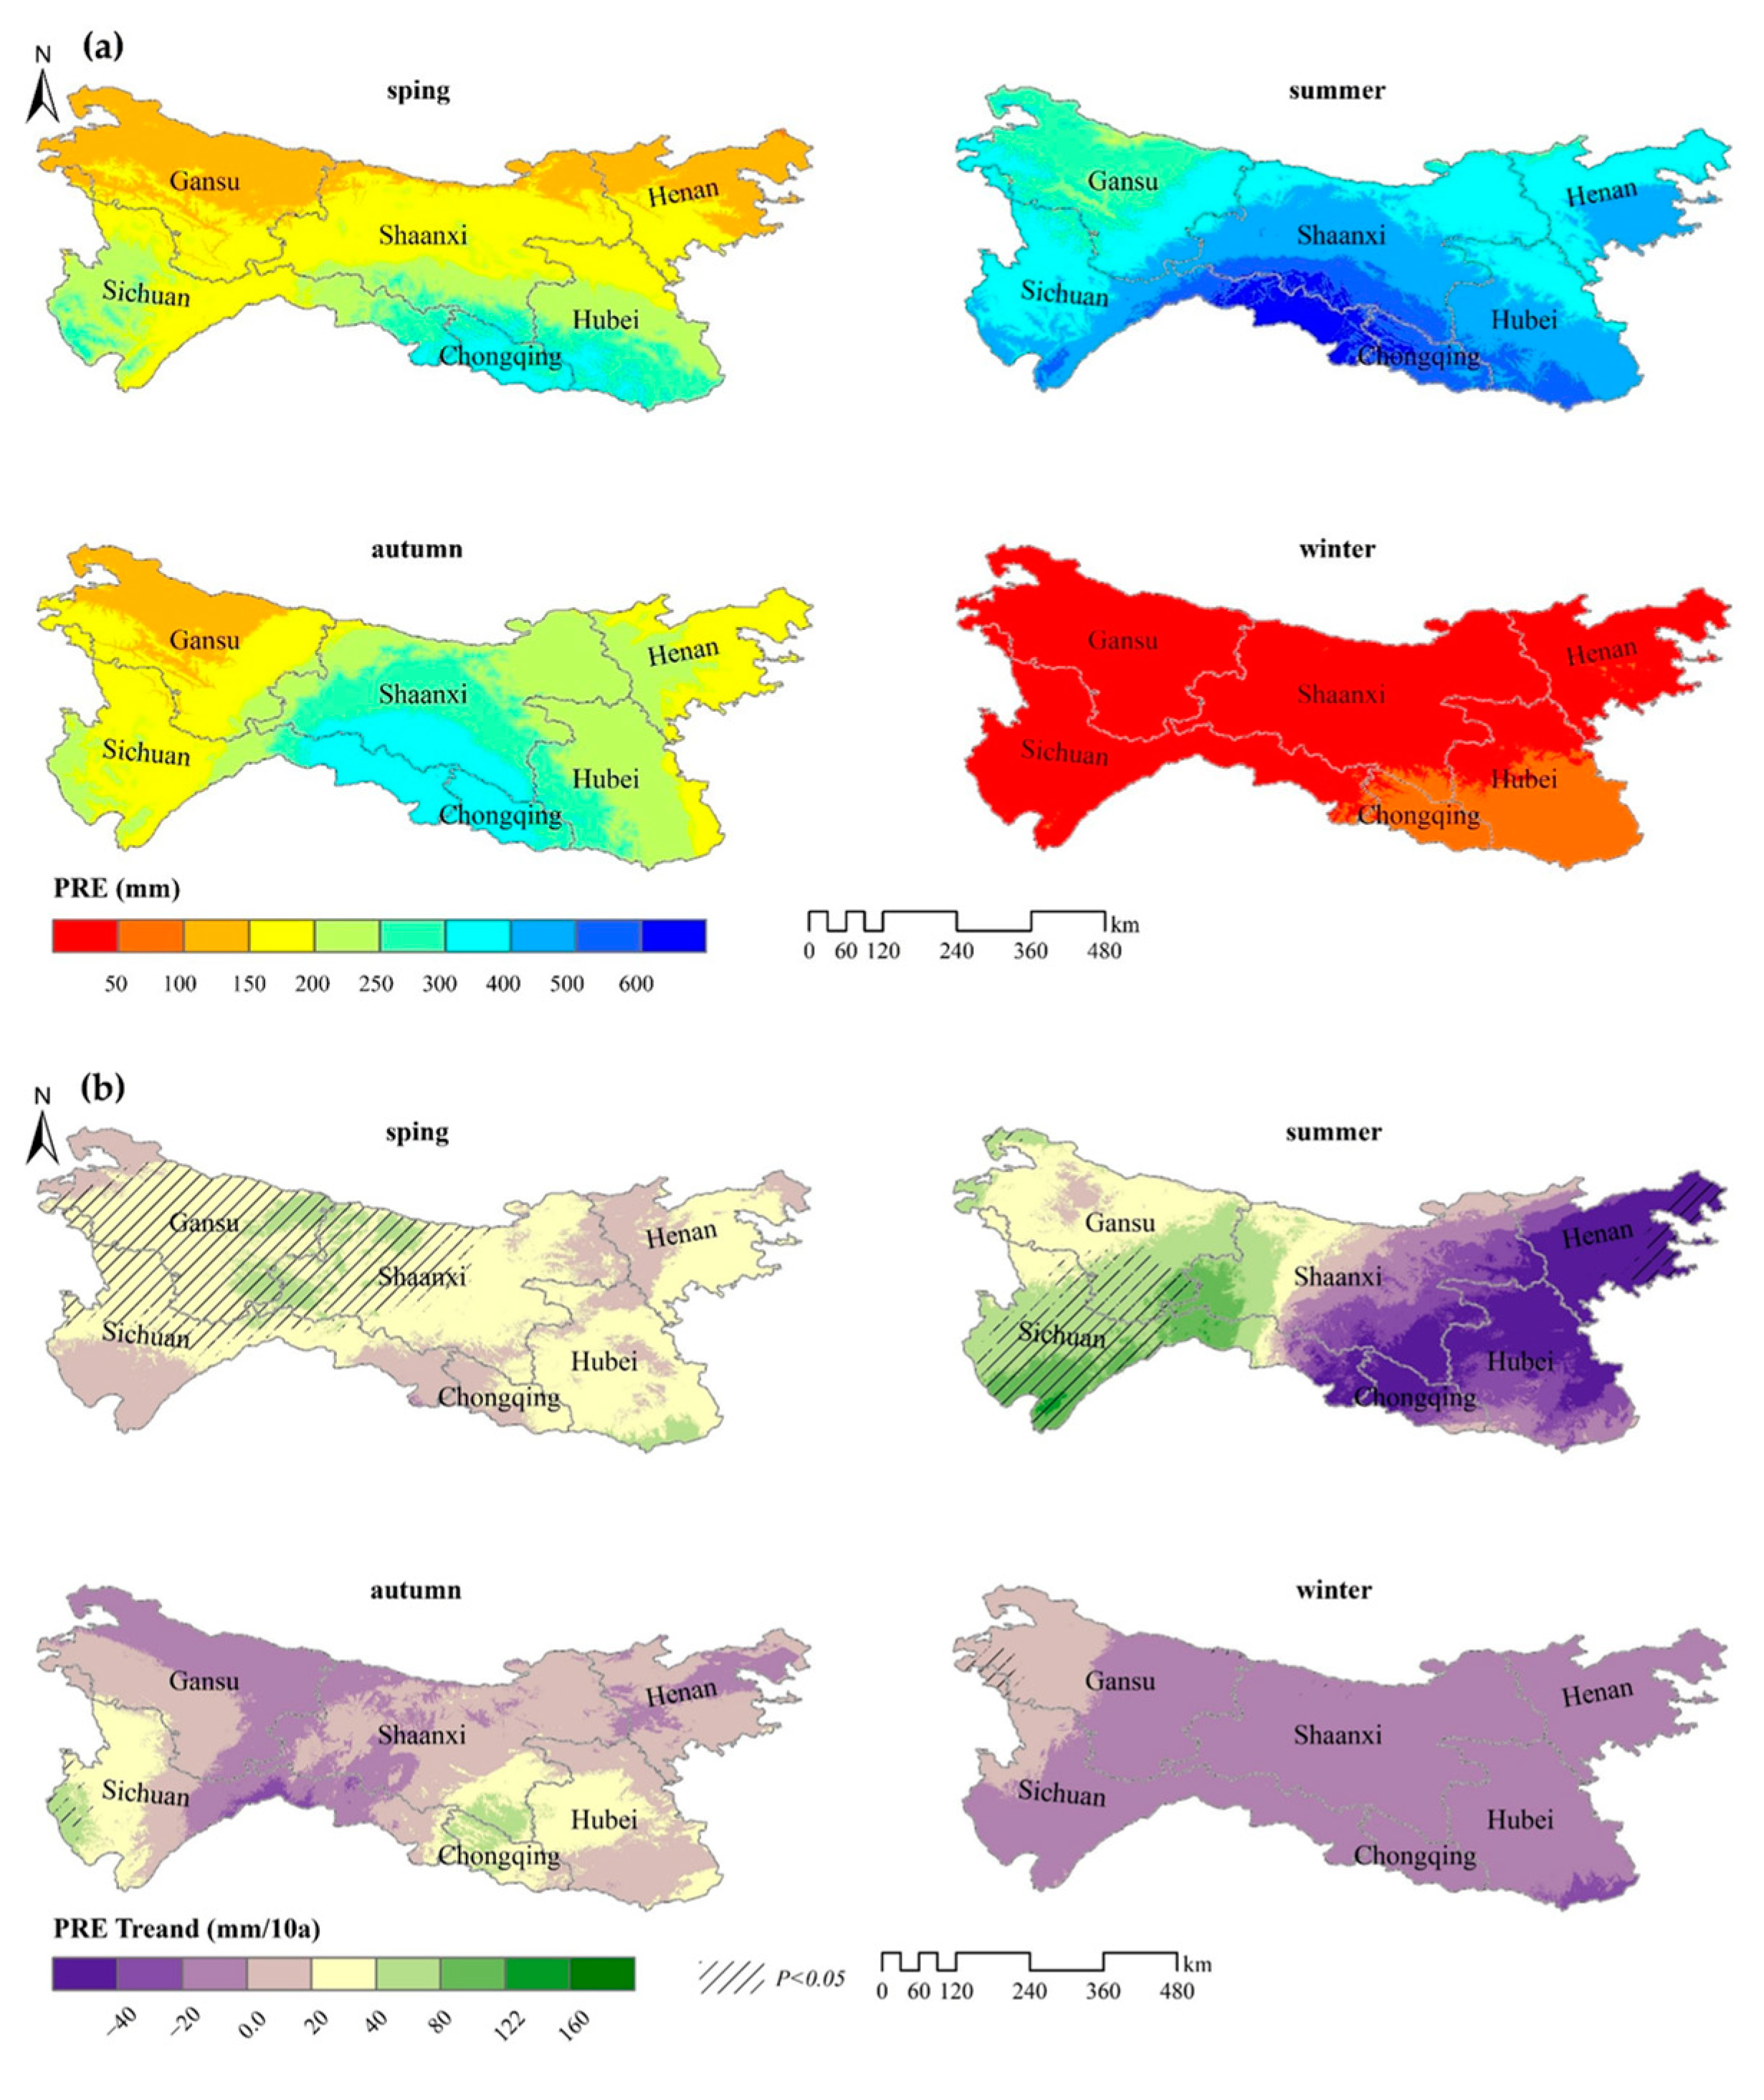
The seasonal
PRE in the QBM generally shows a decreasing spatial distribution from southeast to northwest (
Figure 10a). The
PRE values were the most abundant in summer and the spatial difference was the largest, reaching more than 400 mm. In contrast, the
PRE was rare in winter, and the spatial difference was the least. The distribution of
PRE in spring and autumn was similar in the western region, but in the central and eastern regions, it was lower in spring than in autumn. Chongqing had the largest regional
PRE in each season, Henan had the lowest
PRE in spring, and Gansu had the lowest
PRE in other seasons (
Table 7).
Figure 10b shows that the trend rate of the
PRE in spring was positive and gradually increased from four sides to the central region. The regions with increased and decreased summer
PRE presented a spatial pattern of opposite distributions. In the area west of Shangluo-Ankang-Bazhong, the summer
PRE showed an increasing trend, and the growth rate in the south was higher than that in the north. The area to the east showed a decreasing trend, and the rate of decrease shrank from the center to the northwest and southeast. In autumn, the
PRE shows an increasing trend in most areas. The downward trend was mainly distributed in Gansu, central Sichuan, western Shaanxi, and central Henan. The rate of change of winter
PRE gradually decreased from northwest to southeast. Only the northwest region exhibited a weak increasing trend.
From a regional perspective, the trend rate of seasonal PRE change in Shaanxi, Hubei, Henan, and Chongqing was characterized by a decrease-increase-decrease. The minimum value appeared in summer, and the maximum value in autumn. Sichuan and Gansu were characterized by first increasing and then decreasing, with the maximum in summer and the minimum in winter.
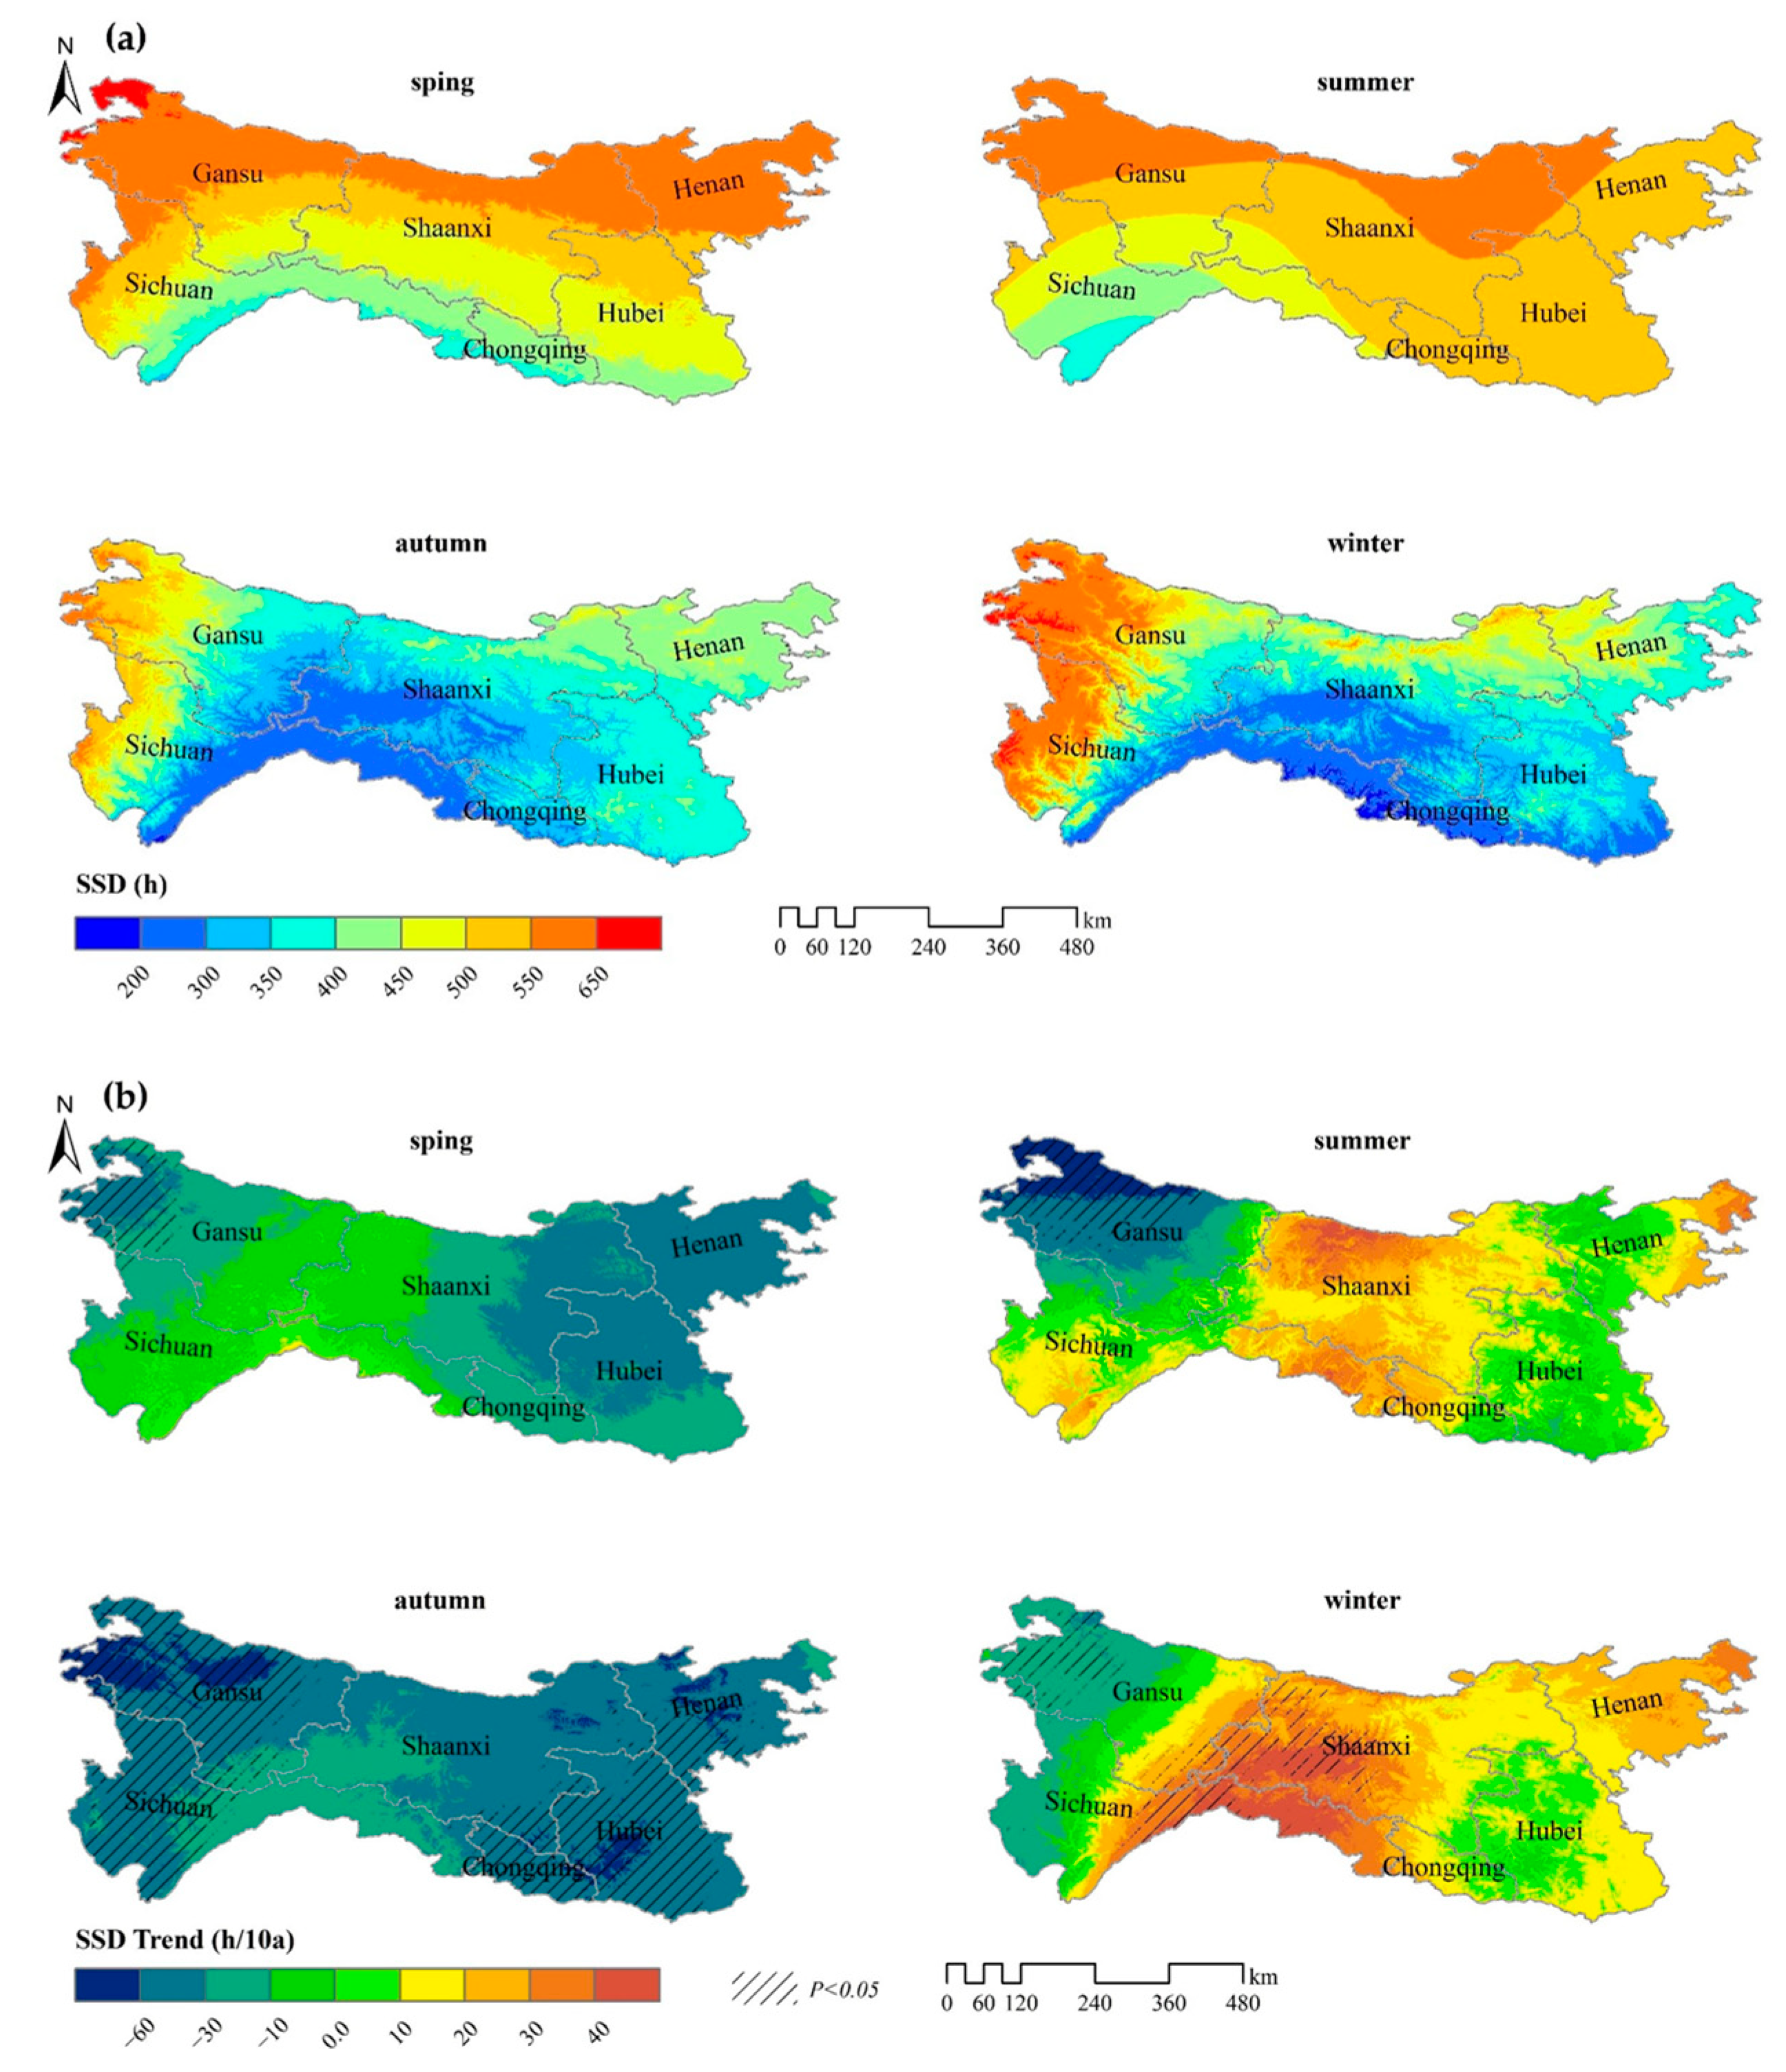
In the past 21 years, the
SSD in the QBM has been long in spring and summer; and short in autumn and winter (
Table 8). Spatially, the change along the latitude generally decreased from north to south (
Figure 11a). The spatial difference was the largest in winter, reaching more than 450 h, and the smallest in summer. In terms of different regions, in Sichuan and Chongqing,
SSD was relatively short, and in Henan and Gansu it was relatively long.
The change trend rate of
SSD in the four seasons showed clear spatial differences. The
SSD in spring generally showed a decreasing trend, and the trend rate decreased from the center to both sides. A small increase was mainly in the south at the edge of Sichuan Basin (
Figure 11b). In summer, decreases and increases in
SSD were distributed interactively; and decrease were mainly on the east and west sides; and increases were in the central area, Qinling Mountains in Shaanxi, and Daba Mountain area, which exhibited the fastest growth rate. Similar to spring,
SSD in autumn also decreased. The regions with the fastest decline rate were mainly in northern Gansu, central Henan, and the areas around Shennongjia in Hubei. In winter, the
SSD in most areas increased and the growth rate in the center was the fastest. The areas with reduced
SSD were concentrated in the west.
In Sichuan, Shaanxi, Hubei, Henan, and Chongqing, the rate of change of SSD in each season was consistent, showing a “N” pattern, with the maximum in winter and the minimum in autumn. The rate of change showed a “V” pattern, only in Gansu, with the maximum appearing in winter and the minimum in autumn.


