
The Complete Plastid Genome Sequences of the Belian (Eusideroxylon zwageri): Comparative Analysis and Phylogenetic Relationships with Other Magnoliids

Abstract
:1. Introduction
2. Materials and Methods
2.1. Plant Materials, Extraction, and Sequencing of DNA
2.2. Annotation and Assembly of the Chloroplast Genome
2.3. Chloroplast Genome Analysis
2.4. Comparative Sequence Analysis
2.5. Phylogenetic Analysis
3. Results
3.1. General Features of the Belian Chloroplast Genomes
3.2. Codon Usage
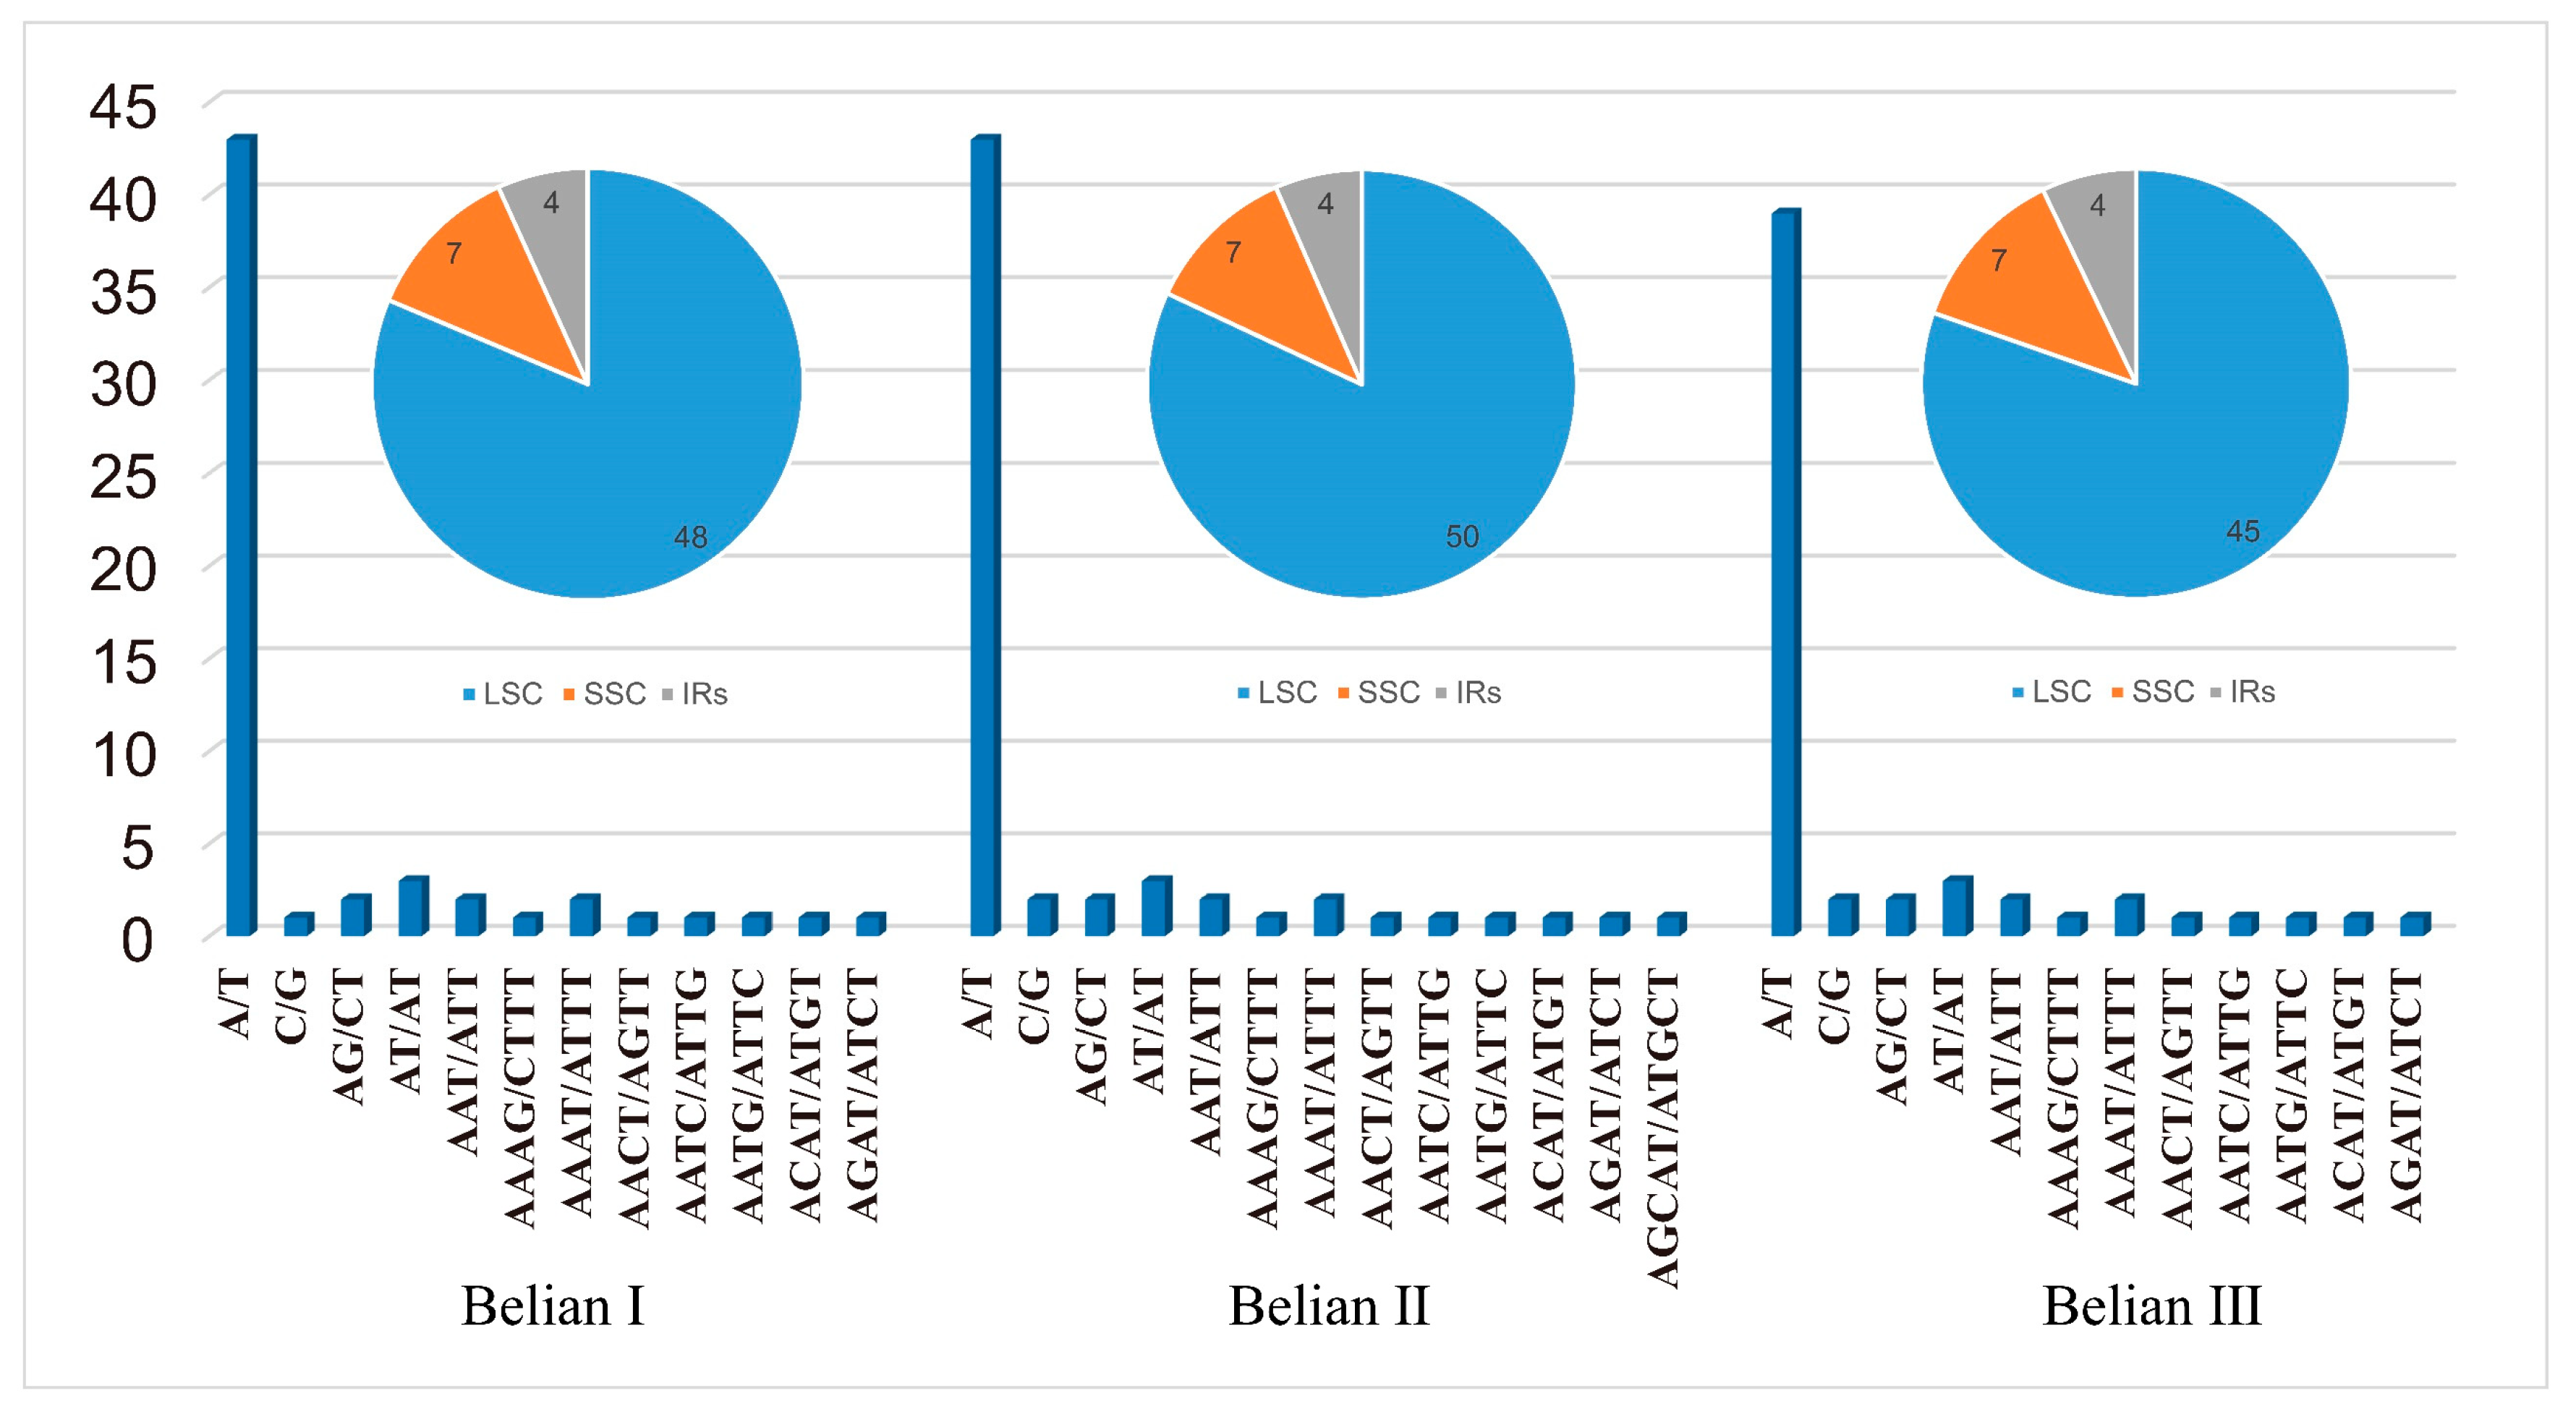
3.3. Repeat Sequences and Simple Sequence Repeats Analysis
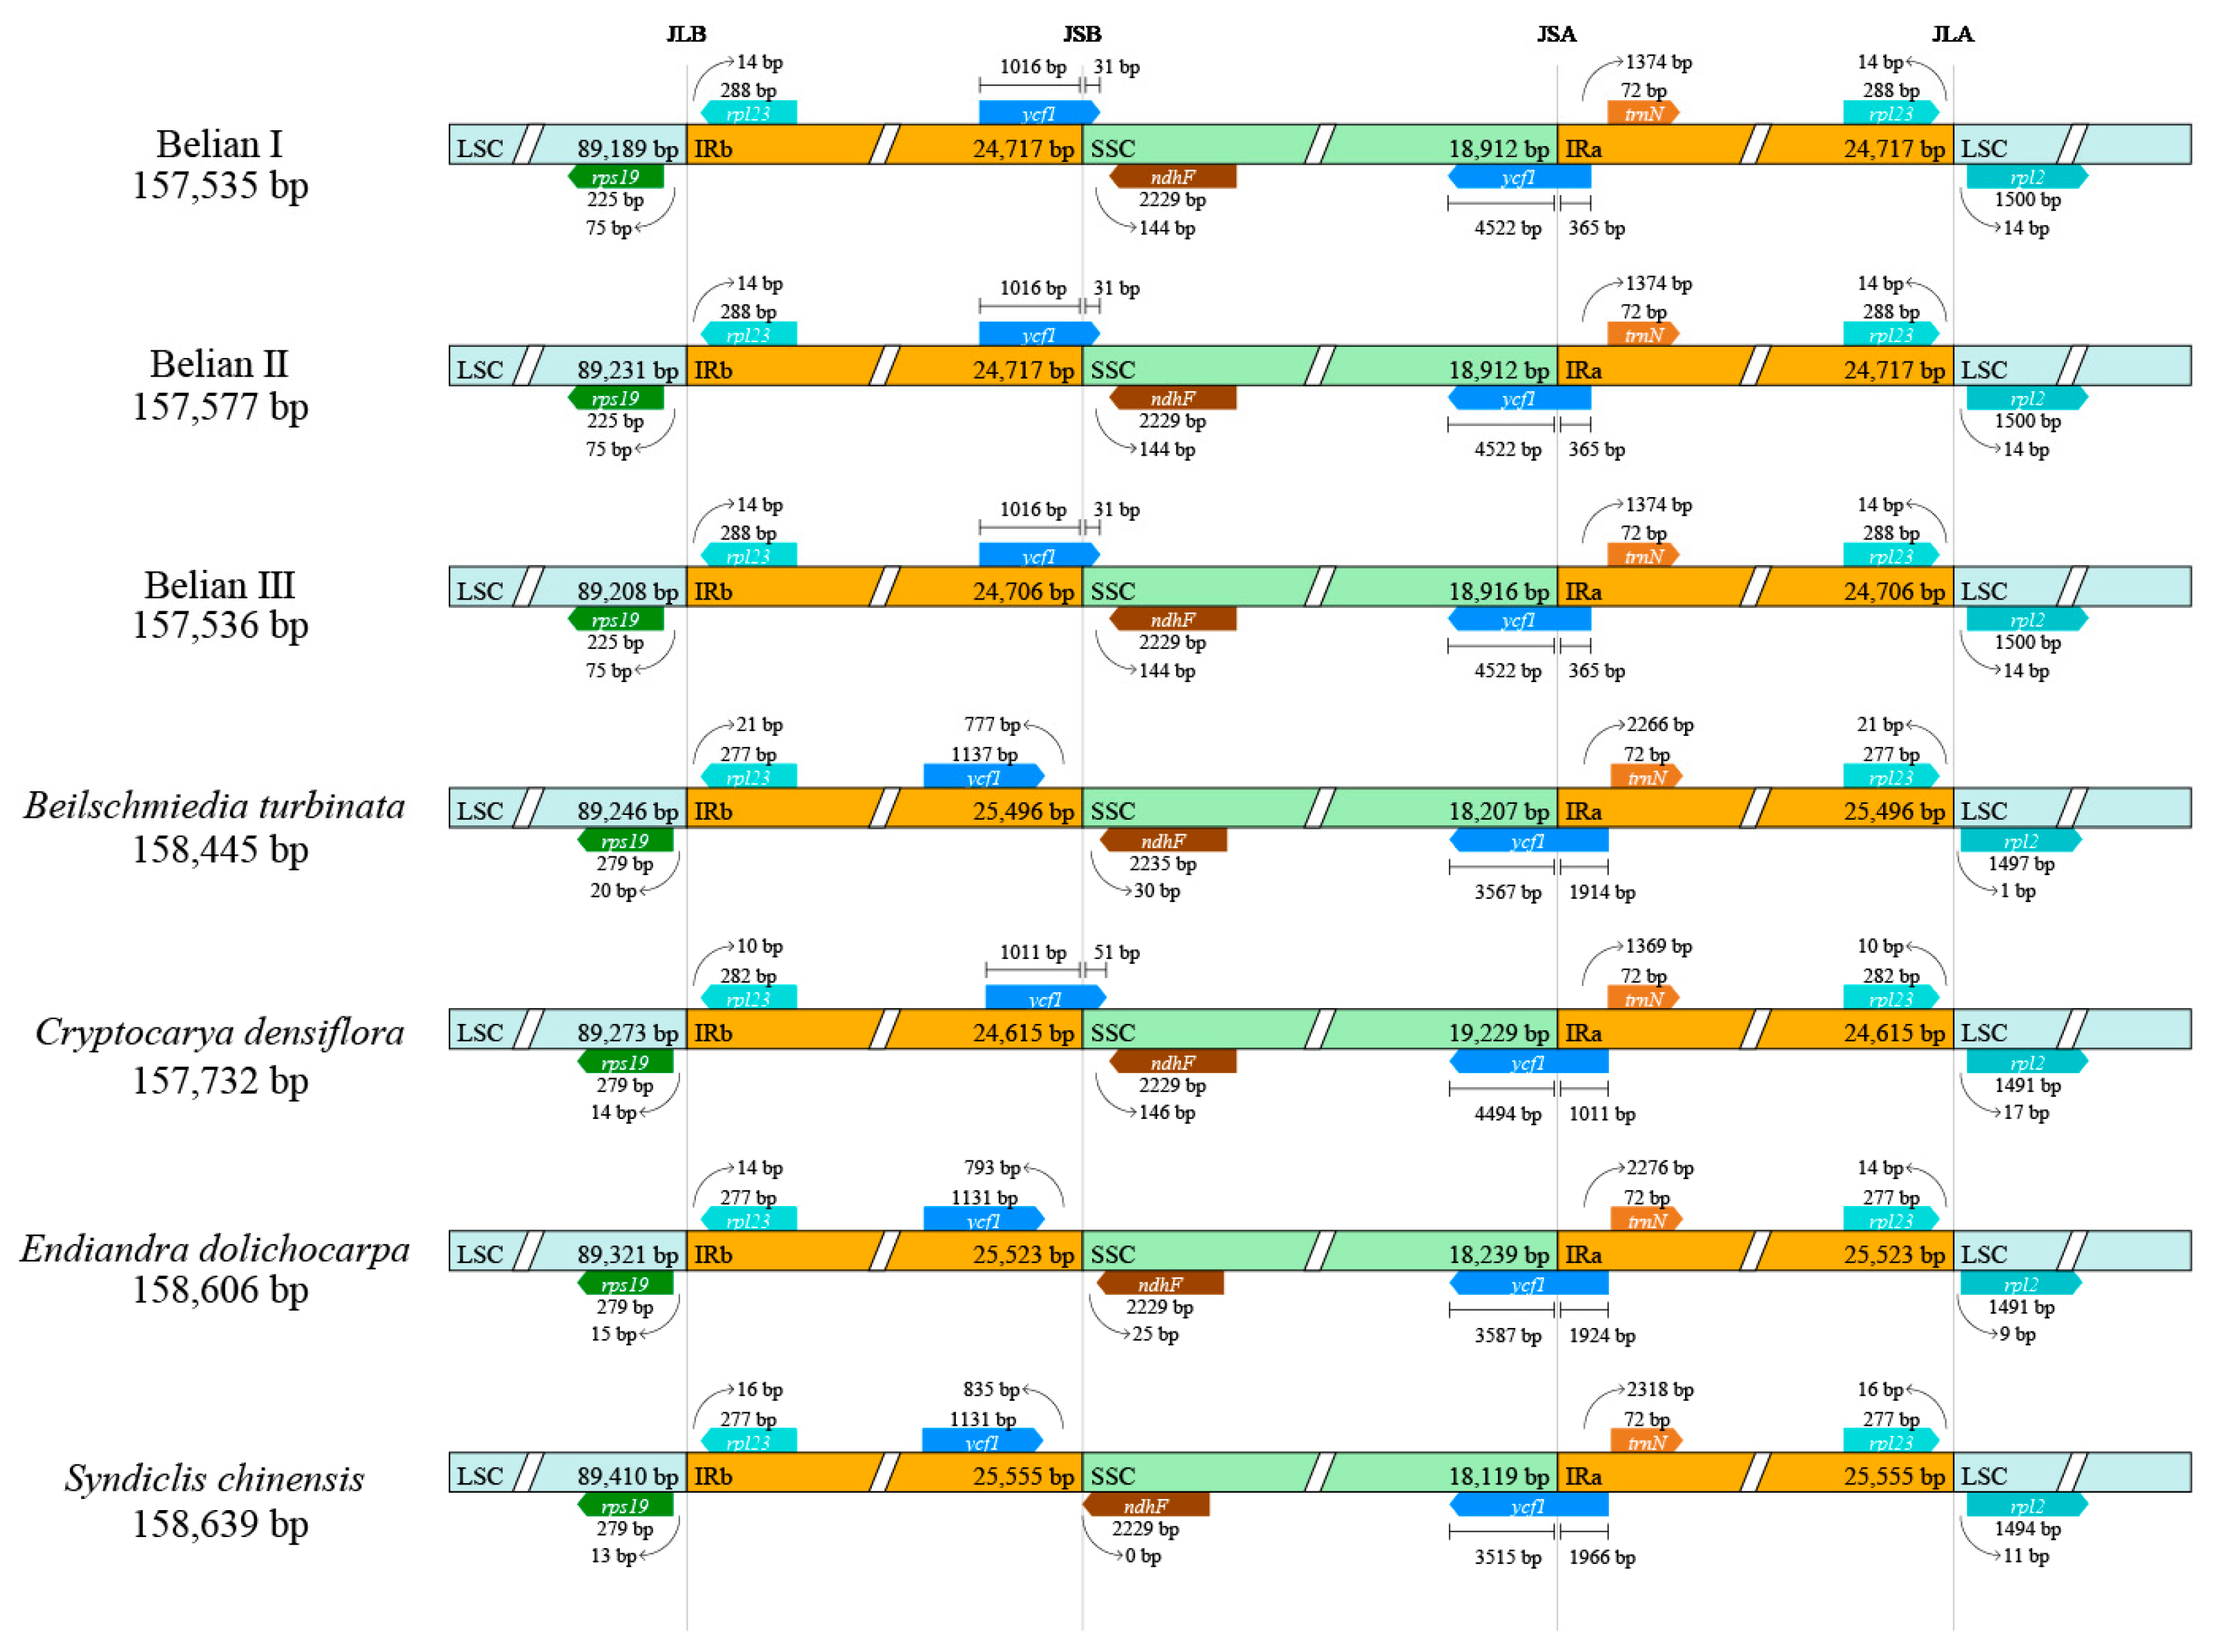
3.4. Inverted Repeat Contraction and Expansion
3.5. Mutations in the Belian Chloroplast Genomes
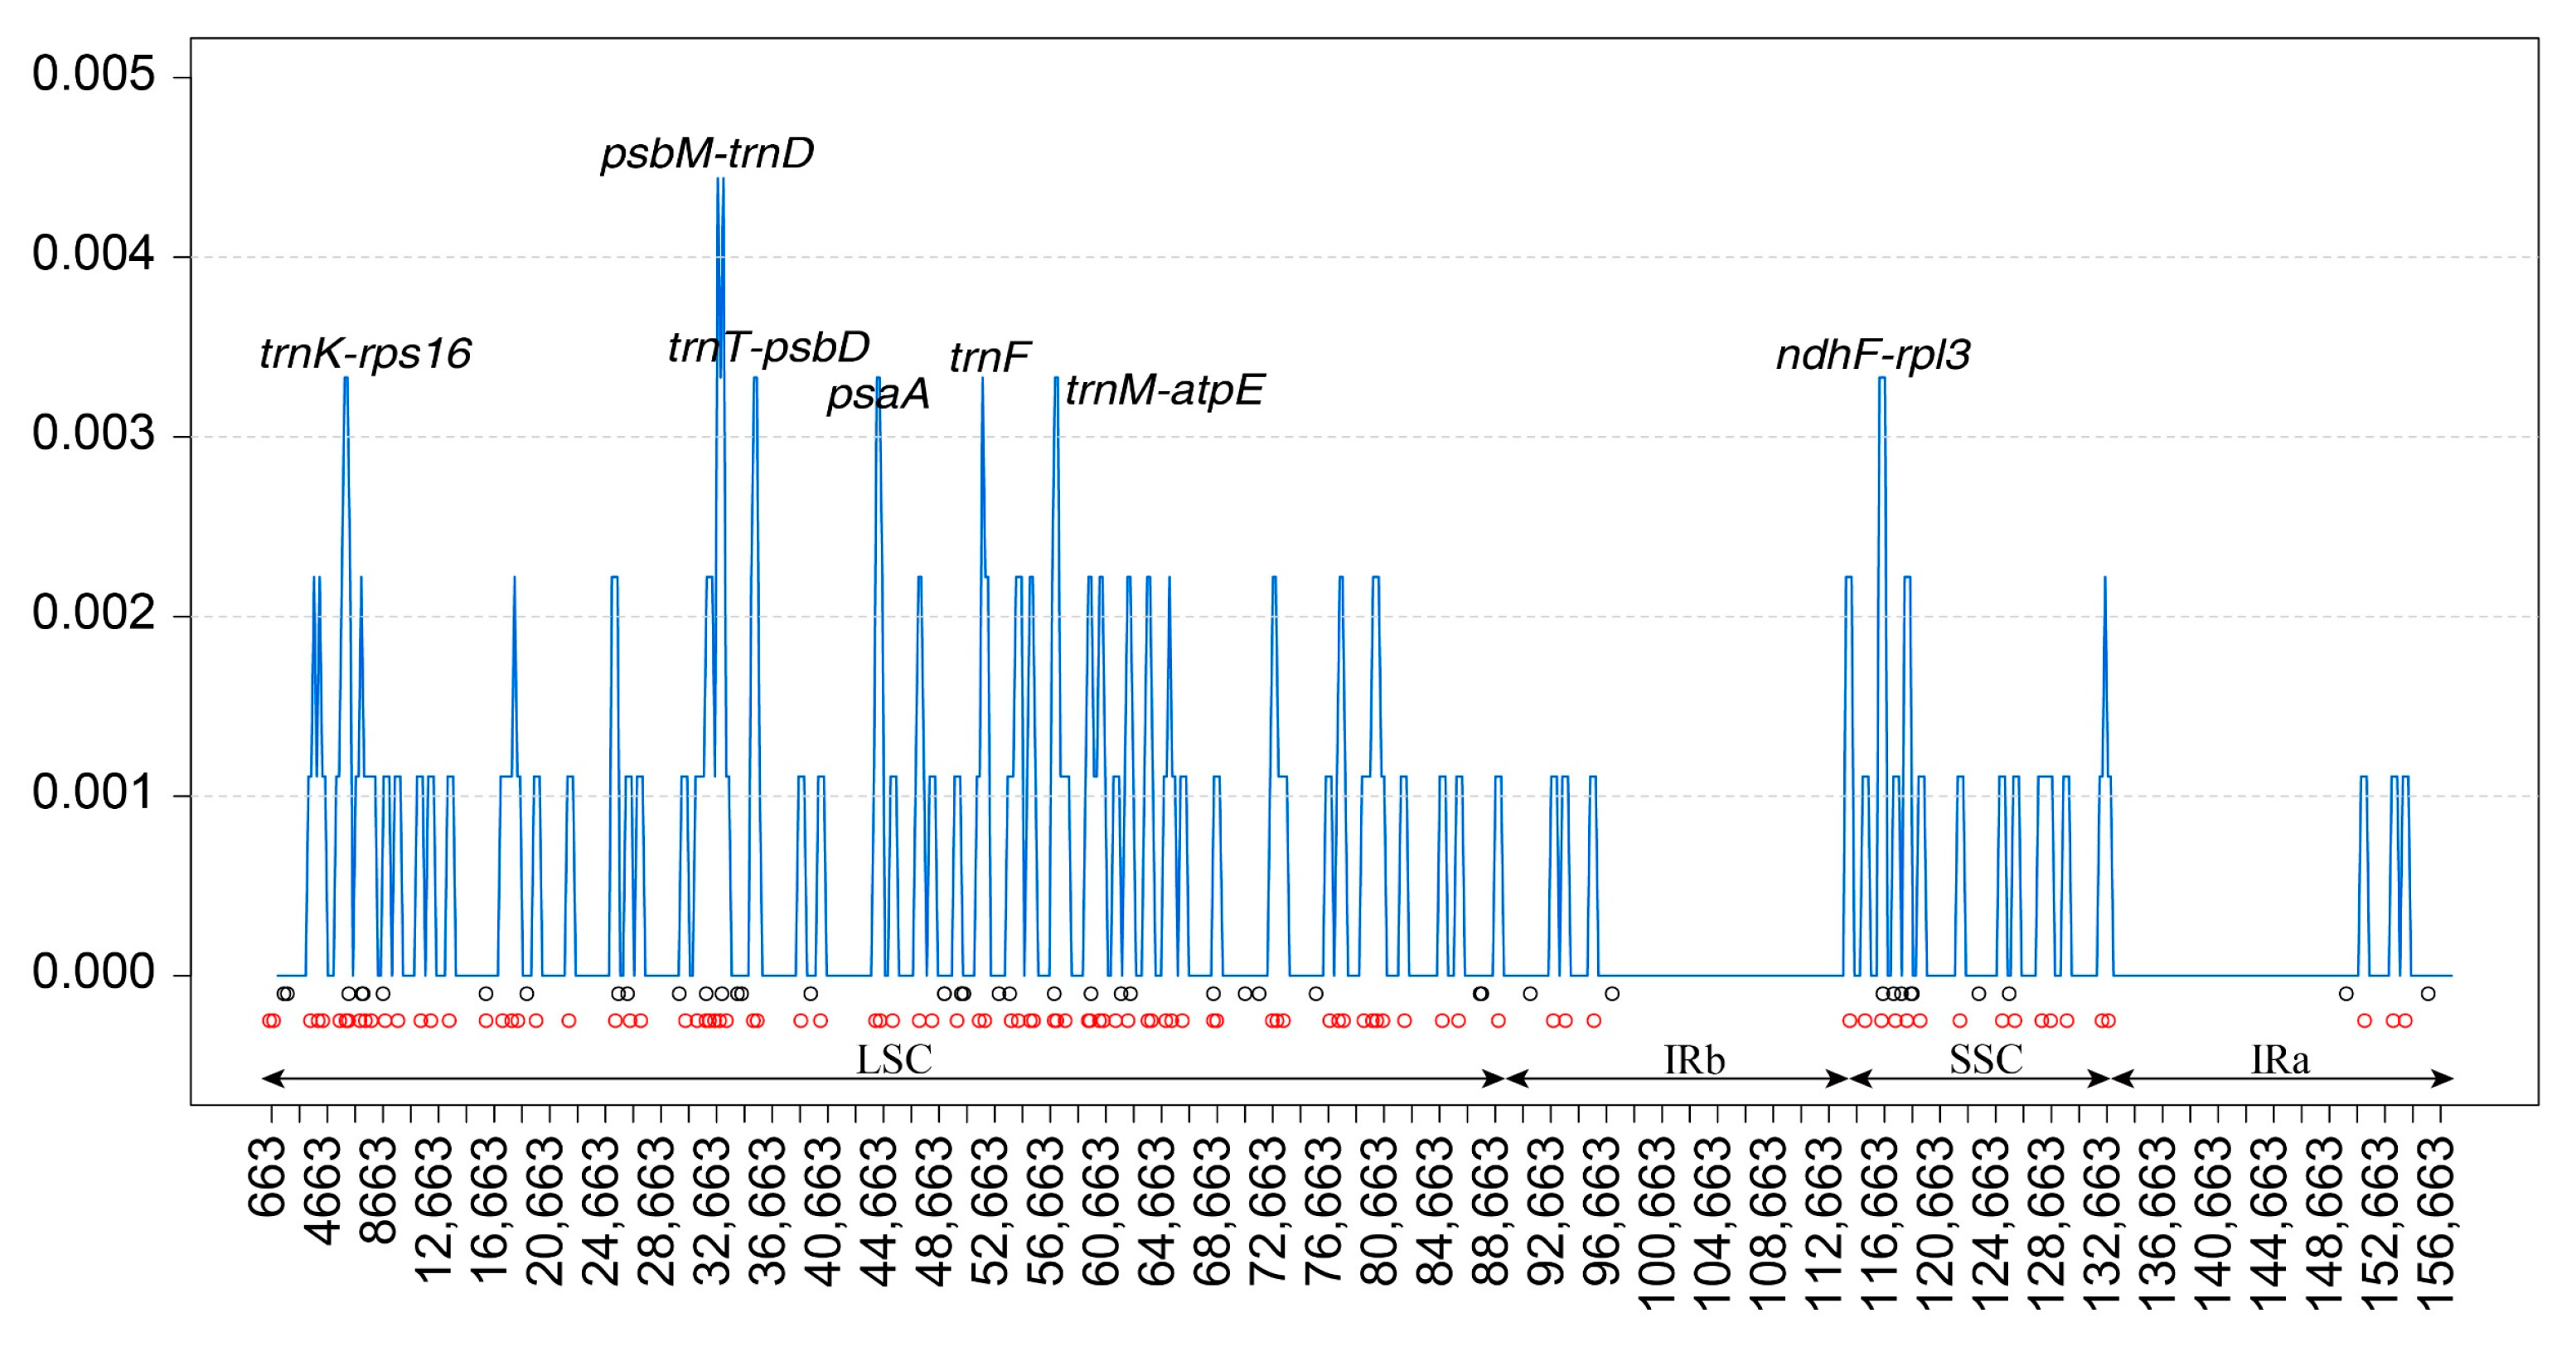
3.6. Nucleotide Diversity (Pi) Analysis
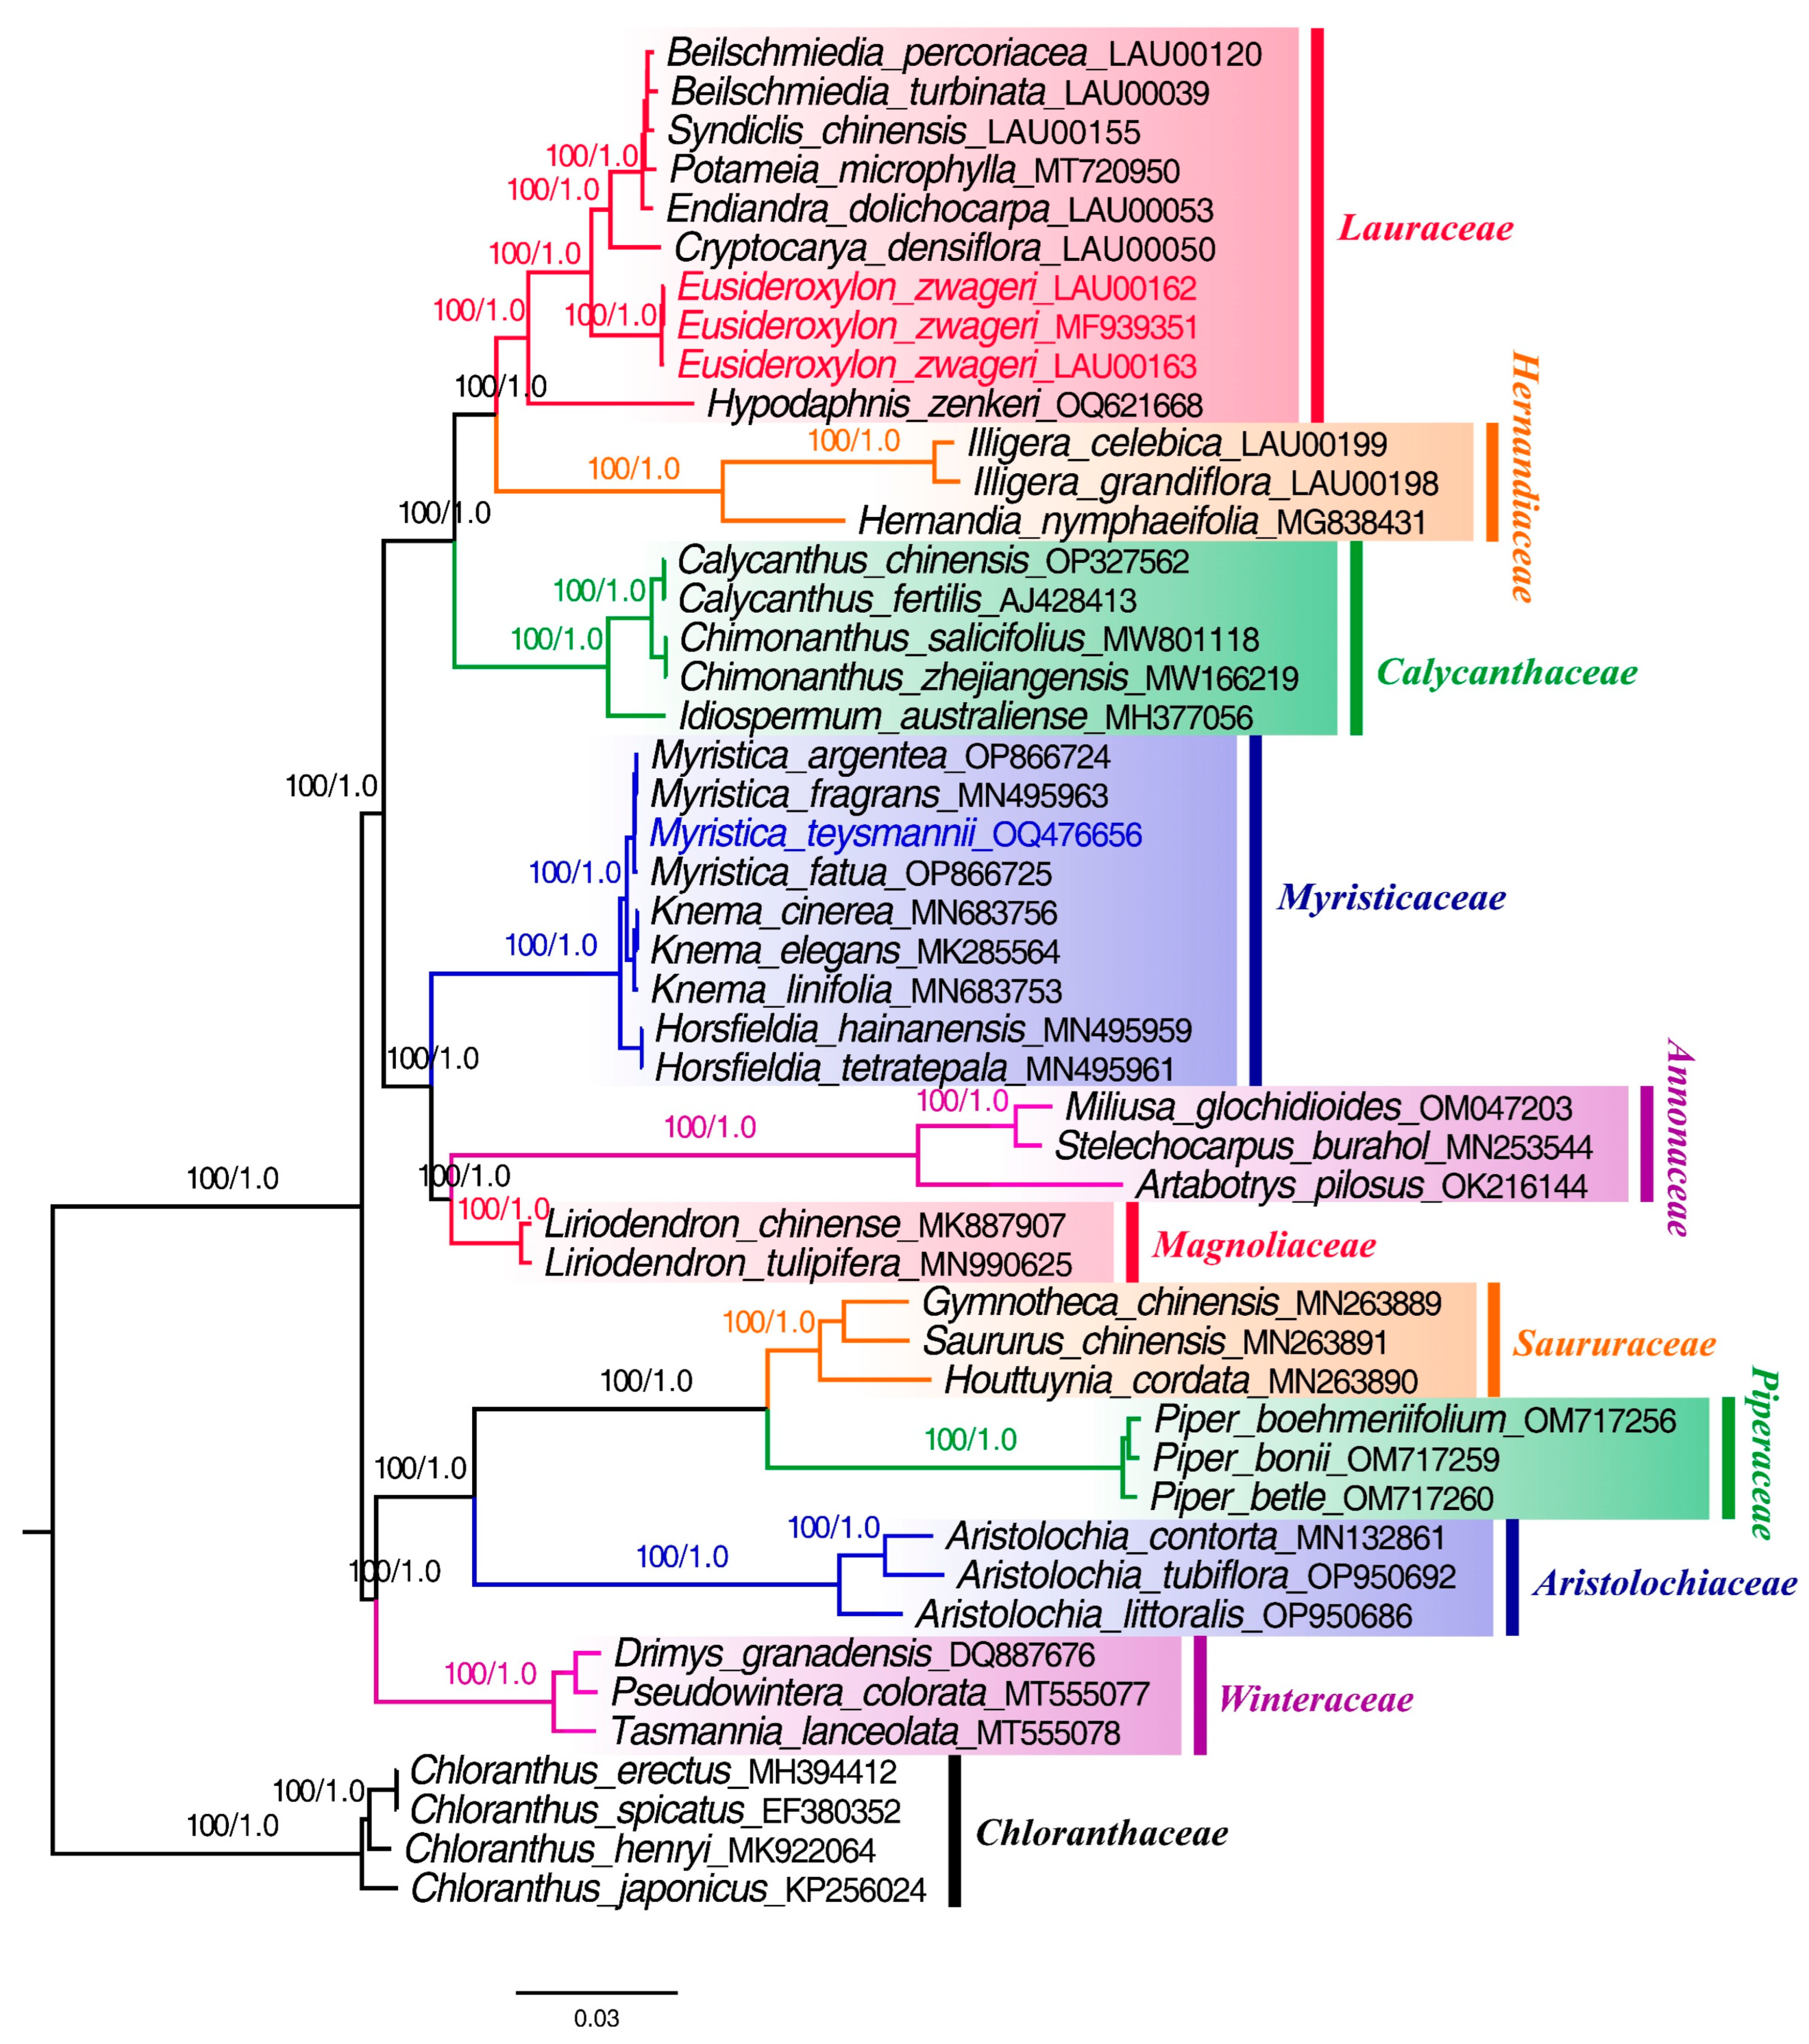
3.7. Phylogenetic Analysis
4. Discussion
5. Conclusions
Supplementary Materials
Author Contributions
Funding
Data Availability Statement
Conflicts of Interest
References
- The Angiosperm Phylogeny Group; Chase, M.W.; Christenhusz, M.J.M.; Fay, M.F.; Byng, J.W.; Judd, W.S.; Soltis, D.E.; Mabberley, D.J.; Sennikov, A.N.; Soltis, P.S.; et al. An update of the Angiosperm Phylogeny Group classification for the orders and families of flowering plants: APG IV. Bot. J. Linn. Soc. 2016, 181, 1–20. [Google Scholar] [CrossRef]
- Chanderbali, A.S.; van der Werff, H.; Renner, S.S. Phylogeny and Historical Biogeography of Lauraceae: Evidence from the Chloroplast and Nuclear Genomes. Ann. Mo. Bot. Gard. 2001, 88, 104–134. [Google Scholar] [CrossRef]
- Song, Y.; Yu, W.B.; Tan, Y.H.; Jin, J.J.; Wang, B.; Yang, J.B.; Liu, B.; Corlett, R.T. Plastid phylogenomics improve phylogenetic resolution in the Lauraceae. J. Syst. Evol. 2019, 58, 423–439. [Google Scholar] [CrossRef]
- Nurtjahjaningsih, I.L.G.; Sukartiningsih; Kurokochi, H.; Saito, Y.; Ide, Y. Genetic Structure of the Tropical Tree Eusideroxylon zwageri in Indonesia Revealed by Chloroplast DNA Phylogeography. Forests 2017, 8, 229. [Google Scholar] [CrossRef]
- Asian Regional Workshop. Conservation & Sustainable Management of Trees, Viet Nam, August 1996. Eusideroxylon zwageri. The IUCN Red List of Threatened Species. 1998. Available online: https://www.iucnredlist.org/species/31316/9624725 (accessed on 29 September 2023).
- Irawan, B.; Gruber, F.; Finkeldey, R.; Gailing, O. Linking indigenous knowledge, plant morphology, and molecular differentiation: The case of ironwood (Eusideroxylon zwageri Teijsm. et Binn.). Genet. Resour. Crop Evol. 2015, 63, 1297–1306. [Google Scholar] [CrossRef]
- Daniell, H.; Lin, C.S.; Yu, M.; Chang, W.J. Chloroplast genomes: Diversity, evolution, and applications in genetic engineering. Genome Biol. 2016, 17, 134. [Google Scholar] [CrossRef] [PubMed]
- Jansen, R.K.; Raubeson, L.A.; Boore, J.L.; dePamphilis, C.W.; Chumley, T.W.; Haberle, R.C.; Wyman, S.K.; Alverson, A.J.; Peery, R.; Herman, S.J.; et al. Methods for obtaining and analyzing whole chloroplast genome sequences. Methods Enzym. 2005, 395, 348–384. [Google Scholar] [CrossRef]
- Palmer, J.D. Comparative organization of chloroplast genomes. Annu. Rev. Genet. 1985, 19, 325–354. [Google Scholar] [CrossRef]
- Daniell, H.; Lee, S.B.; Grevich, J.; Saski, C.; Quesada-Vargas, T.; Guda, C.; Tomkins, J.; Jansen, R.K. Complete chloroplast genome sequences of Solanum bulbocastanum, Solanum lycopersicum and comparative analyses with other Solanaceae genomes. Theor. Appl. Genet. 2006, 112, 1503–1518. [Google Scholar] [CrossRef]
- Walker, T. Plant Diversity and Evolution. Genotypic and Phenotypic Variation in Higher Plants. Exp. Agric. 2006, 42, 121–126. [Google Scholar] [CrossRef]
- Palmer, J.D.; Nugent, J.M.; Herbon, L.A. Unusual structure of geranium chloroplast DNA: A triple-sized inverted repeat, extensive gene duplications, multiple inversions, and two repeat families. Proc. Natl. Acad. Sci. USA 1987, 84, 769–773. [Google Scholar] [CrossRef] [PubMed]
- Dyall, S.D.; Brown, M.T.; Johnson, P.J. Ancient invasions: From endosymbionts to organelles. Science 2004, 304, 253–257. [Google Scholar] [CrossRef] [PubMed]
- Clegg, M.T.; Gaut, B.S.; Learn, G.H., Jr.; Morton, B.R. Rates and patterns of chloroplast DNA evolution. Proc. Natl. Acad. Sci. USA 1994, 91, 6795–6801. [Google Scholar] [CrossRef] [PubMed]
- Raubeson, L.A.; Peery, R.; Chumley, T.W.; Dziubek, C.; Fourcade, H.M.; Boore, J.L.; Jansen, R.K. Comparative chloroplast genomics: Analyses including new sequences from the angiosperms Nuphar advena and Ranunculus macranthus. BMC Genom. 2007, 8, 174. [Google Scholar] [CrossRef] [PubMed]
- Aiso-Sanada, H.; Nezu, I.; Ishiguri, F.; Jaffar, A.N.N.B.M.; Ambun, D.B.A.; Perumal, M.; Wasli, M.E.; Ohkubo, T.; Abe, H. Basic wood properties of Borneo ironwood (Eusideroxylon zwageri) planted in Sarawak, Malaysia. Tropics 2020, 28, 99–103. [Google Scholar] [CrossRef]
- Kimoto, Y.; Utami, N.; Tobe, H. Embryology of Eusideroxylon (Cryptocaryeae, Lauraceae) and character evolution in the family. Bot. J. Linn. Soc. 2006, 150, 187–201. [Google Scholar] [CrossRef]
- Rohwer, J.G.; Rudolph, B. Jumping Genera: The Phylogenetic Positions of Cassytha, Hypodaphnis, and Neocinnamomum (Lauraceae) Based on Different Analyses of trnK Intron Sequences. Ann. Mo. Bot. Gard. 2005, 92, 153–178. [Google Scholar]
- Kurokochi, H.; Nurtjahjaningsih, I.L.G.; Sukartiningsih; Tan, E.; Asakawa, S.; Saito, Y.; Ide, Y. Development of polymorphic chloroplast DNA markers for the endangered tree Eusideroxylon zwageri through chloroplast isolation and next-generation sequencing. Conserv. Genet. Resour. 2015, 7, 845–850. [Google Scholar] [CrossRef]
- Md-Isa, S.F.; Yien Yong, C.S.; Saleh, M.N.; Go, R. An assessment of genetic variation in vulnerable Borneo Ironwood (Eusideroxylon zwageri Teijsm. & Binn.) in Sarawak using SSR markers. J. Threat. Taxa 2021, 13, 18588–18597. [Google Scholar] [CrossRef]
- Song, Y.; Yu, W.B.; Tan, Y.; Liu, B.; Yao, X.; Jin, J.; Padmanaba, M.; Yang, J.B.; Corlett, R.T. Evolutionary Comparisons of the Chloroplast Genome in Lauraceae and Insights into Loss Events in the Magnoliids. Genome Biol. Evol. 2017, 9, 2354–2364. [Google Scholar] [CrossRef]
- Liu, Z.-F.; Ma, H.; Ci, X.-Q.; Li, L.; Song, Y.; Liu, B.; Li, H.-W.; Wang, S.-L.; Qu, X.-J.; Hu, J.-L.; et al. Can plastid genome sequencing be used for species identification in Lauraceae? Bot. J. Linn. Soc. 2021, 197, 1–14. [Google Scholar] [CrossRef]
- Yang, Z.; Ferguson, D.K.; Yang, Y. New insights into the plastome evolution of Lauraceae using herbariomics. BMC Plant Biol. 2023, 23, 387. [Google Scholar] [CrossRef] [PubMed]
- Ariati, S.R.; Priyadi, A.; Hariri, M.R.; Risna, R.A. The complete chloroplast genome of Myristica teysmannii (Myristicaceae), an endemic and endangered species from Indonesia. J. Asia-Pac. Biodivers. 2023, 16, 734–738. [Google Scholar] [CrossRef]
- Doyle, J.J.; Doyle, J.L. A rapid DNA isolation procedure for small quantities of fresh leaf tissue. Phytochem. Bull. 1987, 19, 11–15. [Google Scholar]
- Patel, R.K.; Jain, M. NGS QC Toolkit: A toolkit for quality control of next generation sequencing data. PLoS ONE 2012, 7, e30619. [Google Scholar] [CrossRef] [PubMed]
- Jin, J.J.; Yu, W.B.; Yang, J.B.; Song, Y.; dePamphilis, C.W.; Yi, T.S.; Li, D.Z. GetOrganelle: A fast and versatile toolkit for accurate de novo assembly of organelle genomes. Genome Biol. 2020, 21, 241. [Google Scholar] [CrossRef]
- Wick, R.R.; Schultz, M.B.; Zobel, J.; Holt, K.E. Bandage: Interactive visualization of de novo genome assemblies. Bioinformatics 2015, 31, 3350–3352. [Google Scholar] [CrossRef]
- Shi, L.; Chen, H.; Jiang, M.; Wang, L.; Wu, X.; Huang, L.; Liu, C. CPGAVAS2, an integrated plastome sequence annotator and analyzer. Nucleic Acids Res. 2019, 47, W65–W73. [Google Scholar] [CrossRef]
- Greiner, S.; Lehwark, P.; Bock, R. OrganellarGenomeDRAW (OGDRAW) version 1.3.1: Expanded toolkit for the graphical visualization of organellar genomes. Nucleic Acids Res. 2019, 47, W59–W64. [Google Scholar] [CrossRef]
- Zhang, D.; Gao, F.; Jakovlic, I.; Zou, H.; Zhang, J.; Li, W.X.; Wang, G.T. PhyloSuite: An integrated and scalable desktop platform for streamlined molecular sequence data management and evolutionary phylogenetics studies. Mol. Ecol. Resour. 2020, 20, 348–355. [Google Scholar] [CrossRef]
- Kurtz, S.; Choudhuri, J.V.; Ohlebusch, E.; Schleiermacher, C.; Stoye, J.; Giegerich, R. REPuter: The manifold applications of repeat analysis on a genomic scale. Nucleic Acids Res. 2001, 29, 4633–4642. [Google Scholar] [CrossRef] [PubMed]
- Thiel, T.; Michalek, W.; Varshney, R.K.; Graner, A. Exploiting EST databases for the development and characterization of gene-derived SSR-markers in barley (Hordeum vulgare L.). Theor. Appl. Genet. 2003, 106, 411–422. [Google Scholar] [CrossRef] [PubMed]
- Li, H.; Guo, Q.; Xu, L.; Gao, H.; Liu, L.; Zhou, X. CPJSdraw: Analysis and visualization of junction sites of chloroplast genomes. PeerJ 2023, 11, e15326. [Google Scholar] [CrossRef] [PubMed]
- Kearse, M.; Moir, R.; Wilson, A.; Stones-Havas, S.; Cheung, M.; Sturrock, S.; Buxton, S.; Cooper, A.; Markowitz, S.; Duran, C.; et al. Geneious Basic: An integrated and extendable desktop software platform for the organization and analysis of sequence data. Bioinformatics 2012, 28, 1647–1649. [Google Scholar] [CrossRef]
- Hall, T.A. Bioedit: A user-friendly biological sequence alignment editor and analysis program for windows 95/98/ nt. Nucleic Acids Symp. Ser. 1999, 41, 95–98. [Google Scholar]
- Rozas, J.; Ferrer-Mata, A.; Sanchez-DelBarrio, J.C.; Guirao-Rico, S.; Librado, P.; Ramos-Onsins, S.E.; Sanchez-Gracia, A. DnaSP 6: DNA Sequence Polymorphism Analysis of Large Data Sets. Mol. Biol. Evol. 2017, 34, 3299–3302. [Google Scholar] [CrossRef] [PubMed]
- Katoh, K.; Rozewicki, J.; Yamada, K.D. MAFFT online service: Multiple sequence alignment, interactive sequence choice and visualization. Brief Bioinform. 2019, 20, 1160–1166. [Google Scholar] [CrossRef]
- Nguyen, L.T.; Schmidt, H.A.; von Haeseler, A.; Minh, B.Q. IQ-TREE: A fast and effective stochastic algorithm for estimating maximum-likelihood phylogenies. Mol. Biol. Evol. 2015, 32, 268–274. [Google Scholar] [CrossRef]
- Ronquist, F.; Teslenko, M.; van der Mark, P.; Ayres, D.L.; Darling, A.; Hohna, S.; Larget, B.; Liu, L.; Suchard, M.A.; Huelsenbeck, J.P. MrBayes 3.2: Efficient Bayesian phylogenetic inference and model choice across a large model space. Syst. Biol. 2012, 61, 539–542. [Google Scholar] [CrossRef]
- Darriba, D.; Taboada, G.L.; Doallo, R.; Posada, D. jModelTest 2: More models, new heuristics and parallel computing. Nat. Methods 2012, 9, 772. [Google Scholar] [CrossRef]
- Song, Y.; Dong, W.; Liu, B.; Xu, C.; Yao, X.; Gao, J.; Corlett, R.T. Comparative analysis of complete chloroplast genome sequences of two tropical trees Machilus yunnanensis and Machilus balansae in the family Lauraceae. Front. Plant Sci. 2015, 6, 662. [Google Scholar] [CrossRef]
- Bai, X.; Peng, J.; Yang, Y.; Xiong, B. The Complete Chloroplast Genome Sequence of Machilus chuanchienensis (Lauraceae): Genome Structure and Phylogenetic Analysis. Genes 2022, 13, 2402. [Google Scholar] [CrossRef] [PubMed]
- Shabalina, S.A.; Spiridonov, N.A.; Kashina, A. Sounds of silence: Synonymous nucleotides as a key to biological regulation and complexity. Nucleic Acids Res. 2013, 41, 2073–2094. [Google Scholar] [CrossRef] [PubMed]
- Zhou, M.; Long, W.; Li, X. Patterns of synonymous codon usage bias in chloroplast genomes of seed plants. For. Stud. China 2008, 10, 235–242. [Google Scholar] [CrossRef]
- Xiao-Ming, Z.; Junrui, W.; Li, F.; Sha, L.; Hongbo, P.; Lan, Q.; Jing, L.; Yan, S.; Weihua, Q.; Lifang, Z.; et al. Inferring the evolutionary mechanism of the chloroplast genome size by comparing whole-chloroplast genome sequences in seed plants. Sci. Rep. 2017, 7, 1555. [Google Scholar] [CrossRef] [PubMed]
- Zhu, A.; Guo, W.; Gupta, S.; Fan, W.; Mower, J.P. Evolutionary dynamics of the plastid inverted repeat: The effects of expansion, contraction, and loss on substitution rates. New Phytol. 2016, 209, 1747–1756. [Google Scholar] [CrossRef] [PubMed]
- Song, Y.; Yao, X.; Tan, Y.; Gan, Y.; Corlett, R.T. Complete chloroplast genome sequence of the avocado: Gene organization, comparative analysis, and phylogenetic relationships with other Lauraceae. Can. J. For. Res. 2016, 46, 1293–1301. [Google Scholar] [CrossRef]
- Ma, J.; Yang, B.; Zhu, W.; Sun, L.; Tian, J.; Wang, X. The complete chloroplast genome sequence of Mahonia bealei (Berberidaceae) reveals a significant expansion of the inverted repeat and phylogenetic relationship with other angiosperms. Gene 2013, 528, 120–131. [Google Scholar] [CrossRef]
- Zeb, U.; Wang, X.; AzizUllah, A.; Fiaz, S.; Khan, H.; Ullah, S.; Ali, H.; Shahzad, K. Comparative genome sequence and phylogenetic analysis of chloroplast for evolutionary relationship among Pinus species. Saudi J. Biol. Sci. 2022, 29, 1618–1627. [Google Scholar] [CrossRef]
- Dodsworth, S.; Chase, M.W.; Kelly, L.J.; Leitch, I.J.; Macas, J.; Novak, P.; Piednoel, M.; Weiss-Schneeweiss, H.; Leitch, A.R. Genomic repeat abundances contain phylogenetic signal. Syst. Biol. 2015, 64, 112–126. [Google Scholar] [CrossRef]
- dePamphilis, C.W.; Palmer, J.D. Loss of photosynthetic and chlororespiratory genes from the plastid genome of a parasitic flowering plant. Nature 1990, 348, 337–339. [Google Scholar] [CrossRef] [PubMed]
- McCoy, S.R.; Kuehl, J.V.; Boore, J.L.; Raubeson, L.A. The complete plastid genome sequence of Welwitschia mirabilis: An unusually compact plastome with accelerated divergence rates. BMC Evol. Biol. 2008, 8, 130. [Google Scholar] [CrossRef] [PubMed]
- Li, R.; Ma, P.F.; Wen, J.; Yi, T.S. Complete sequencing of five araliaceae chloroplast genomes and the phylogenetic implications. PLoS ONE 2013, 8, e78568. [Google Scholar] [CrossRef] [PubMed]
- Liu, J.; Shi, M.; Zhang, Z.; Xie, H.; Kong, W.; Wang, Q.; Zhao, X.; Zhao, C.; Lin, Y.; Zhang, X.; et al. Phylogenomic analyses based on the plastid genome and concatenated nrDNA sequence data reveal cytonuclear discordance in genus Atractylodes (Asteraceae: Carduoideae). Front. Plant Sci. 2022, 13, 1045423. [Google Scholar] [CrossRef] [PubMed]
- Han, B.; Xue, Y. Genome-wide intraspecific DNA-sequence variations in rice. Curr. Opin. Plant Biol. 2003, 6, 134–138. [Google Scholar] [CrossRef]
- Muraguri, S.; Xu, W.; Chapman, M.; Muchugi, A.; Oluwaniyi, A.; Oyebanji, O.; Liu, A. Intraspecific variation within Castor bean (Ricinus communis L.) based on chloroplast genomes. Ind. Crops Prod. 2020, 155, 112779. [Google Scholar] [CrossRef]
- Zhang, R.S.; Yang, J.; Hu, H.L.; Xia, R.X.; Li, Y.P.; Su, J.F.; Li, Q.; Liu, Y.Q.; Qin, L. A high level of chloroplast genome sequence variability in the Sawtooth Oak Quercus acutissima. Int. J. Biol. Macromol. 2020, 152, 340–348. [Google Scholar] [CrossRef]
- Dong, W.; Liu, J.; Yu, J.; Wang, L.; Zhou, S. Highly variable chloroplast markers for evaluating plant phylogeny at low taxonomic levels and for DNA barcoding. PLoS ONE 2012, 7, e35071. [Google Scholar] [CrossRef]
- Cao, Z.; Yang, L.; Xin, Y.; Xu, W.; Li, Q.; Zhang, H.; Tu, Y.; Song, Y.; Xin, P. Comparative and phylogenetic analysis of complete chloroplast genomes from seven Neocinnamomum taxa (Lauraceae). Front. Plant Sci. 2023, 14, 1205051. [Google Scholar] [CrossRef]
- Hinsinger, D.D.; Strijk, J.S. Toward phylogenomics of Lauraceae: The complete chloroplast genome sequence of Litsea glutinosa (Lauraceae), an invasive tree species on Indian and Pacific Ocean islands. Plant Gene 2017, 9, 71–79. [Google Scholar] [CrossRef]
- Song, Y.; Yao, X.; Tan, Y.; Gan, Y.; Yang, J.; Corlett, R.T. Comparative analysis of complete chloroplast genome sequences of two subtropical trees, Phoebe sheareri and Phoebe omeiensis (Lauraceae). Tree Genet. Genomes 2017, 13, 120. [Google Scholar] [CrossRef]
- Li, X.; Yang, Y.; Henry, R.J.; Rossetto, M.; Wang, Y.; Chen, S. Plant DNA barcoding: From gene to genome. Biol. Rev. Camb. Philos. Soc. 2015, 90, 157–166. [Google Scholar] [CrossRef] [PubMed]
- Zhang, Z.; Zhang, Y.; Song, M.; Guan, Y.; Ma, X. Corrigendum: Species Identification of Dracaena Using the Complete Chloroplast Genome as a Super-Barcode. Front. Pharmacol. 2020, 11, 51. [Google Scholar] [CrossRef] [PubMed]
- Göltenboth, F.; Timotius, K.; Milan, P.; Margraf, J. Ecology of Insular Southeast Asia; Elsevier: Amsterdam, The Netherlands, 2006; pp. 385–399. [Google Scholar]


| Belian I | Belian II | Belian III | |
|---|---|---|---|
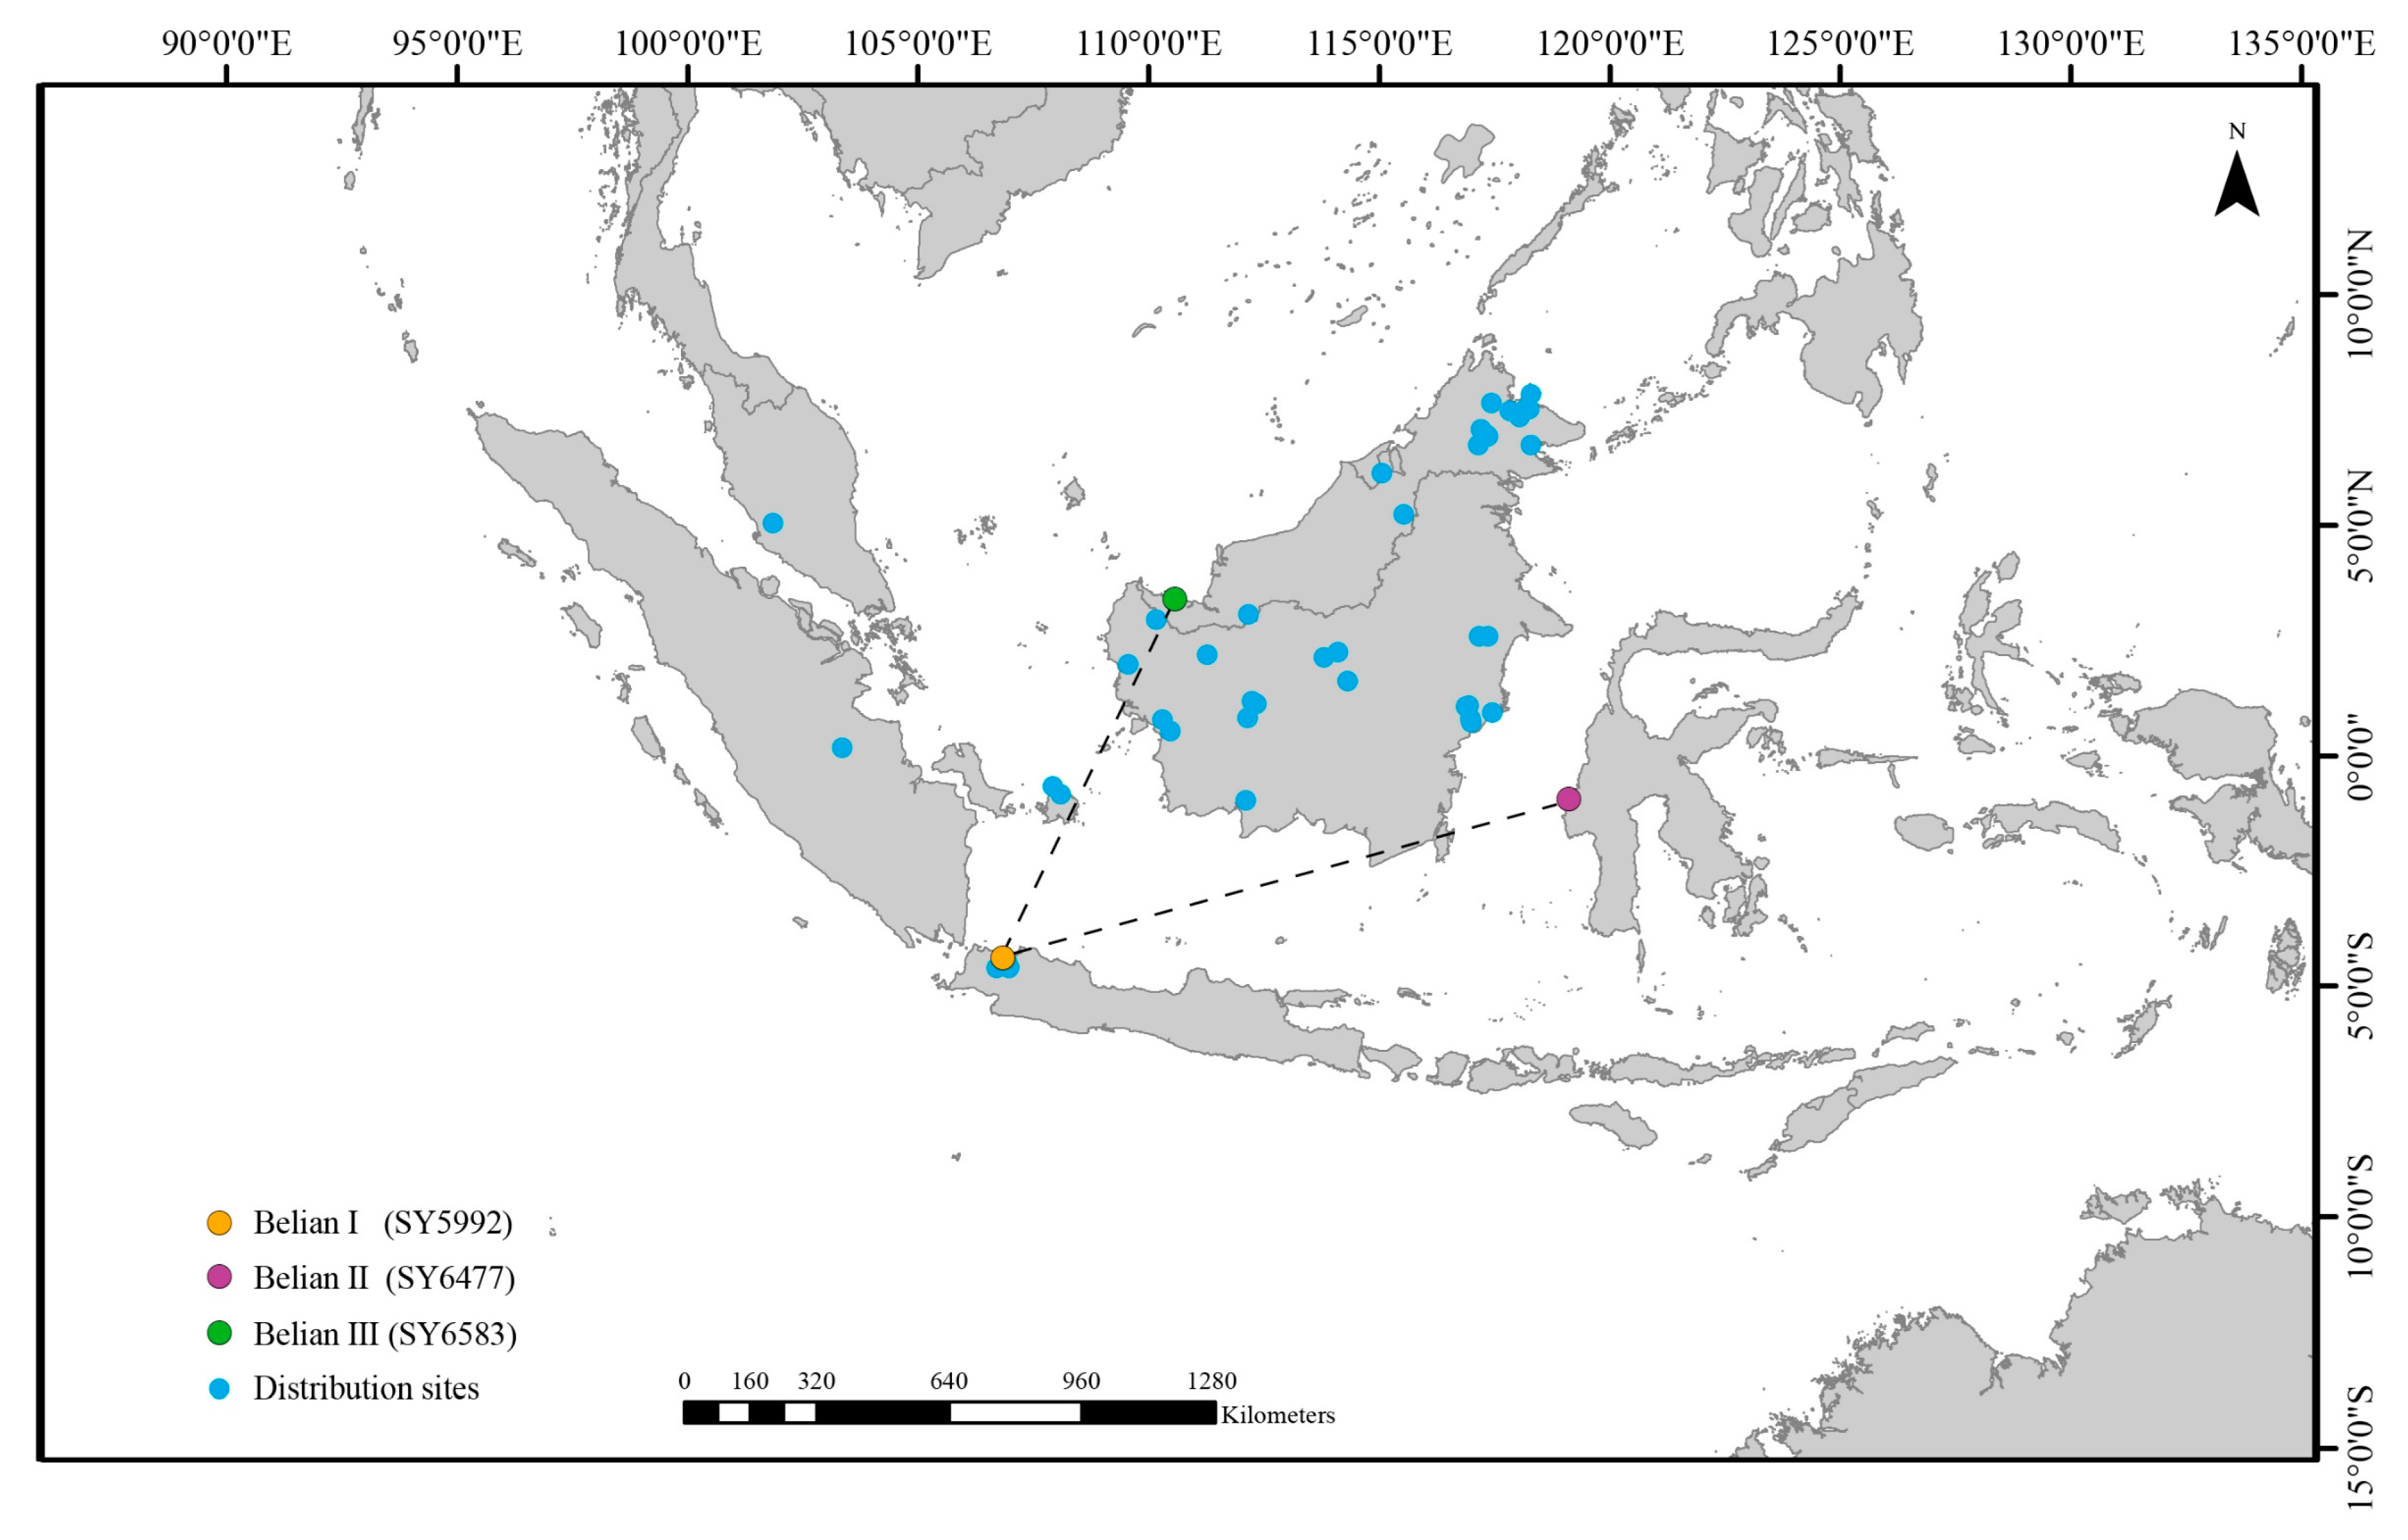
| Sequencing no. | SY5992 | SY6477 | SY6583 |
| Geographic origin | Java, Indonesia | Sulawesi, Indonesia | Kalimantan, Malaysia |
| Collector | TAN Yunhong | Michael Padmanaba | ZHOU Xinxin |
| Voucher | Y1019 | SY34806 | SY37637 |
| Accession no. | LAU00162 | MF939381 | LAU00163 |
| Herbarium | HITBC-BRG | HITBC-BRG | HITBC-BRG |
| Total cpDNA size (bp) | 157,535 | 157,577 | 157,536 |
| Length of LSC region (bp) | 89,189 | 89,231 | 89,208 |
| Length of IR region (bp) | 24,717 | 24,717 | 24,706 |
| Length of SSC region (bp) | 18,912 | 18,912 | 18,916 |
| Total GC content | 39.06% | 39.05% | 39.05% |
| LSC | 37.75% | 37.74% | 37.74% |
| IR | 43.24% | 43.23% | 43.24% |
| SSC | 34.34% | 34.32% | 34.34% |
| Total number of genes (unique) | 130 (113) | 130 (113) | 130 (113) |
| Protein encoding | 85 | 85 | 85 |
| tRNA | 37 | 37 | 37 |
| rRNA | 8 | 8 | 8 |
| Type | Total | LSC Density/kb | SSC Density/kb | IR Density/kb | Total Density/kb | |
|---|---|---|---|---|---|---|
| Belian II | SNP | 31 (Ts5, Tv26) | 0.213 | 0.529 | 0.04 | 0.197 |
| Belian III | SNP | 98 (Ts44, Tv54) | 0.874 | 0.74 | 0.121 | 0.622 |
| Belian II | InDel | 20 | 0.108 | 0.159 | 0 | 0.127 |
| Belian III | InDel | 40 | 0.325 | 0.37 | 0.081 | 0.254 |
Disclaimer/Publisher’s Note: The statements, opinions and data contained in all publications are solely those of the individual author(s) and contributor(s) and not of MDPI and/or the editor(s). MDPI and/or the editor(s) disclaim responsibility for any injury to people or property resulting from any ideas, methods, instructions or products referred to in the content. |
© 2023 by the authors. Licensee MDPI, Basel, Switzerland. This article is an open access article distributed under the terms and conditions of the Creative Commons Attribution (CC BY) license (https://creativecommons.org/licenses/by/4.0/).
Share and Cite
Zhu, W.; Tan, Y.; Zhou, X.; Song, Y.; Xin, P. The Complete Plastid Genome Sequences of the Belian (Eusideroxylon zwageri): Comparative Analysis and Phylogenetic Relationships with Other Magnoliids. Forests 2023, 14, 2443. https://doi.org/10.3390/f14122443
Zhu W, Tan Y, Zhou X, Song Y, Xin P. The Complete Plastid Genome Sequences of the Belian (Eusideroxylon zwageri): Comparative Analysis and Phylogenetic Relationships with Other Magnoliids. Forests. 2023; 14(12):2443. https://doi.org/10.3390/f14122443
Chicago/Turabian StyleZhu, Wen, Yunhong Tan, Xinxin Zhou, Yu Song, and Peiyao Xin. 2023. "The Complete Plastid Genome Sequences of the Belian (Eusideroxylon zwageri): Comparative Analysis and Phylogenetic Relationships with Other Magnoliids" Forests 14, no. 12: 2443. https://doi.org/10.3390/f14122443
APA StyleZhu, W., Tan, Y., Zhou, X., Song, Y., & Xin, P. (2023). The Complete Plastid Genome Sequences of the Belian (Eusideroxylon zwageri): Comparative Analysis and Phylogenetic Relationships with Other Magnoliids. Forests, 14(12), 2443. https://doi.org/10.3390/f14122443