Article

Using a Vegetation Index to Monitor the Death Process of Chinese Fir Based on Hyperspectral Data

1
Research Center of Forestry Remote Sensing & Information Engineering, Central South University of Forestry & Technology, Changsha 410004, China
2
Hunan Provincial Key Laboratory of Forestry Remote Sensing Based Big Data & Ecological Security, Changsha 410004, China
3
Key Laboratory of National Forestry and Grassland Administration on Forest Resources Management and Monitoring in Southern China, Changsha 410004, China
4
Research Institute of Tropical Forestry, Chinese Academy of Forestry, Guangzhou 510520, China
*
Author to whom correspondence should be addressed.
Forests 2023, 14(12), 2444; https://doi.org/10.3390/f14122444
Submission received: 27 October 2023 / Revised: 9 December 2023 / Accepted: 12 December 2023 / Published: 14 December 2023

Abstract

:
Chinese fir is one of the most widely distributed and extensively planted timber species in China. Therefore, monitoring pests and diseases in Chinese fir plantations is directly related to national timber forest security and forest ecological security. This study aimed to identify appropriate vegetation indices for the early monitoring of pests and diseases in Chinese fir plantations. For this purpose, the researchers used an imaging spectrometer to capture hyperspectral images of both experimental and control groups. The experimental group consisted of Chinese fir trees with two sections of bark stripped off, while the control group consisted of healthy Chinese fir trees. The study then assessed the sensitivity of 11 vegetation indices to the physiological differences between the two groups using the Mann–Whitney U test. The results showed that both the green-to-red region spectral angle index (GRRSGI) and the red edge position index (REP) were able to monitor the difference as early as 16 days after damage. However, GRRSGI performs best in monitoring early death changes in Chinese fir trees because it is less affected by noise and is more stable. The green–red spectral area index (GRSAI) also had high stability, but the monitoring effect was slightly worse than that of GRRSGI and REP. Compared with other indices, GRRSGI and GRSAI can better exploit the advantages of hyperspectral data.

1. Introduction

Chinese fir is a principal timber forest species in the subtropical region of China, with advantages such as being fast-growing and productive [1,2]. To meet the increasing demand for timber, the afforestation area of Chinese fir plantations has continued to increase, and its forest stock volume now ranks first in the country [3,4]. However, crude forestation techniques have resulted in Chinese fir plantations often being attacked by pests and diseases, which has seriously damaged the productivity and ecological benefits of Chinese fir plantations. Therefore, finding a timely, accurate, and effective method for the early monitoring of pests and diseases in Chinese fir plantations is conducive to safeguarding national timber security and ecological security.
The emergence of remote sensing technology has made rapid, real-time, large-scale monitoring of forest pests and diseases a reality [5]. Vegetation indices are often used to extract the spectral information on affected vegetation from remote sensing images. Lin Long et al. [6] constructed a monitoring model based on Landsat 8 images using three indices and four characteristic parameters to achieve regional-scale monitoring of pine wilt disease. Leila Gooshbor et al. [7] indicated that the normalized difference vegetation index (NDVI) is effective in assessing the impact of Tortrix viridana on the health status of oaks. André Duarte et al. [8] studied eucalyptus insect pests using the OTSU thresholding method and UAV multispectral imagery and showed that all five indices could distinguish well between healthy and dead eucalyptus trees. Deqin Xiao et al. [9] chose to combine a random forest algorithm and UAV multispectral images to monitor apple fire blight, screened three indices that are more sensitive to fire blight, and constructed a monitoring model, which achieved an overall accuracy of 94.0% in detecting apple fire blight. Anjin Chang et al. [10] found that the normalized difference red edge index (NDRE) performed better in citrus greening disease monitoring. In addition, many studies have successfully used vegetation indices to monitor the development of forest pests and diseases. However, the spectral resolution limits the accuracy of extracting information on damaged vegetation based on multispectral remote sensing techniques [11].
Hyperspectral remote sensing data are high-quality data sources for monitoring forest pests and diseases because of their high resolution and rich spectral information, which allows plant disease conditions to be captured before changes in the external characteristics of the infected plants occur [12,13]. All four indices calculated using EO-1 Hyperion data could effectively monitor the defoliation in spruce–balsam fir forests infected with spruce budworm [14]. The green normalized difference vegetation index (GNDVI) performed better in the detection experiments of Masson pine disease [15]. Run Yu et al. [16] concluded that a random forest algorithm incorporating REP could better classify the disease severity in diseased pine. The newly developed vegetation index from hyperspectral imaging data had good potential for practical application in the early monitoring of mangrove pests and diseases by Xiapeng Jiang et al. [17,18].
Recently, the combination of hyperspectral technology and vegetation indices has become an important tool for monitoring forest pests and diseases. However, many studies still utilize only a few spectral bands when calculating vegetation indices, which may not take full advantage of hyperspectral data. Some scholars have developed new vegetation indices for monitoring forest pests and diseases, mainly including GRSAI and GRRSGI. They are all constructed based on non-imaging hyperspectral data, which are less affected by the surrounding environment and perform better than other vegetation indices in the early monitoring of coniferous forest pests and diseases [19,20]. However, GRSAI and GRRSGI may not have the desired effect when used for imaging data because, compared with non-imaging data, imaging data are mixed pixels and are greatly affected by the surrounding environment. Therefore, verifying the application effect of the vegetation indices studied by previous researchers on hyperspectral imaging data is of great significance for monitoring forest vegetation diseases and insect pests.
This study aimed to use hyperspectral imaging data of a Chinese fir plantation to analyze the differences in reflectance between healthy and damaged Chinese fir trees, to compare the sensitivity of hyperspectral vegetation indices and other vegetation indices to changes in the physiological health of Chinese fir trees, and to find the optimal vegetation indices that are suitable for monitoring Chinese fir plantations. This study will offer data support to the early monitoring of pests and diseases in Chinese fir plantations and is also conducive to the promotion of hyperspectral imaging technology.

2. Materials and Methods
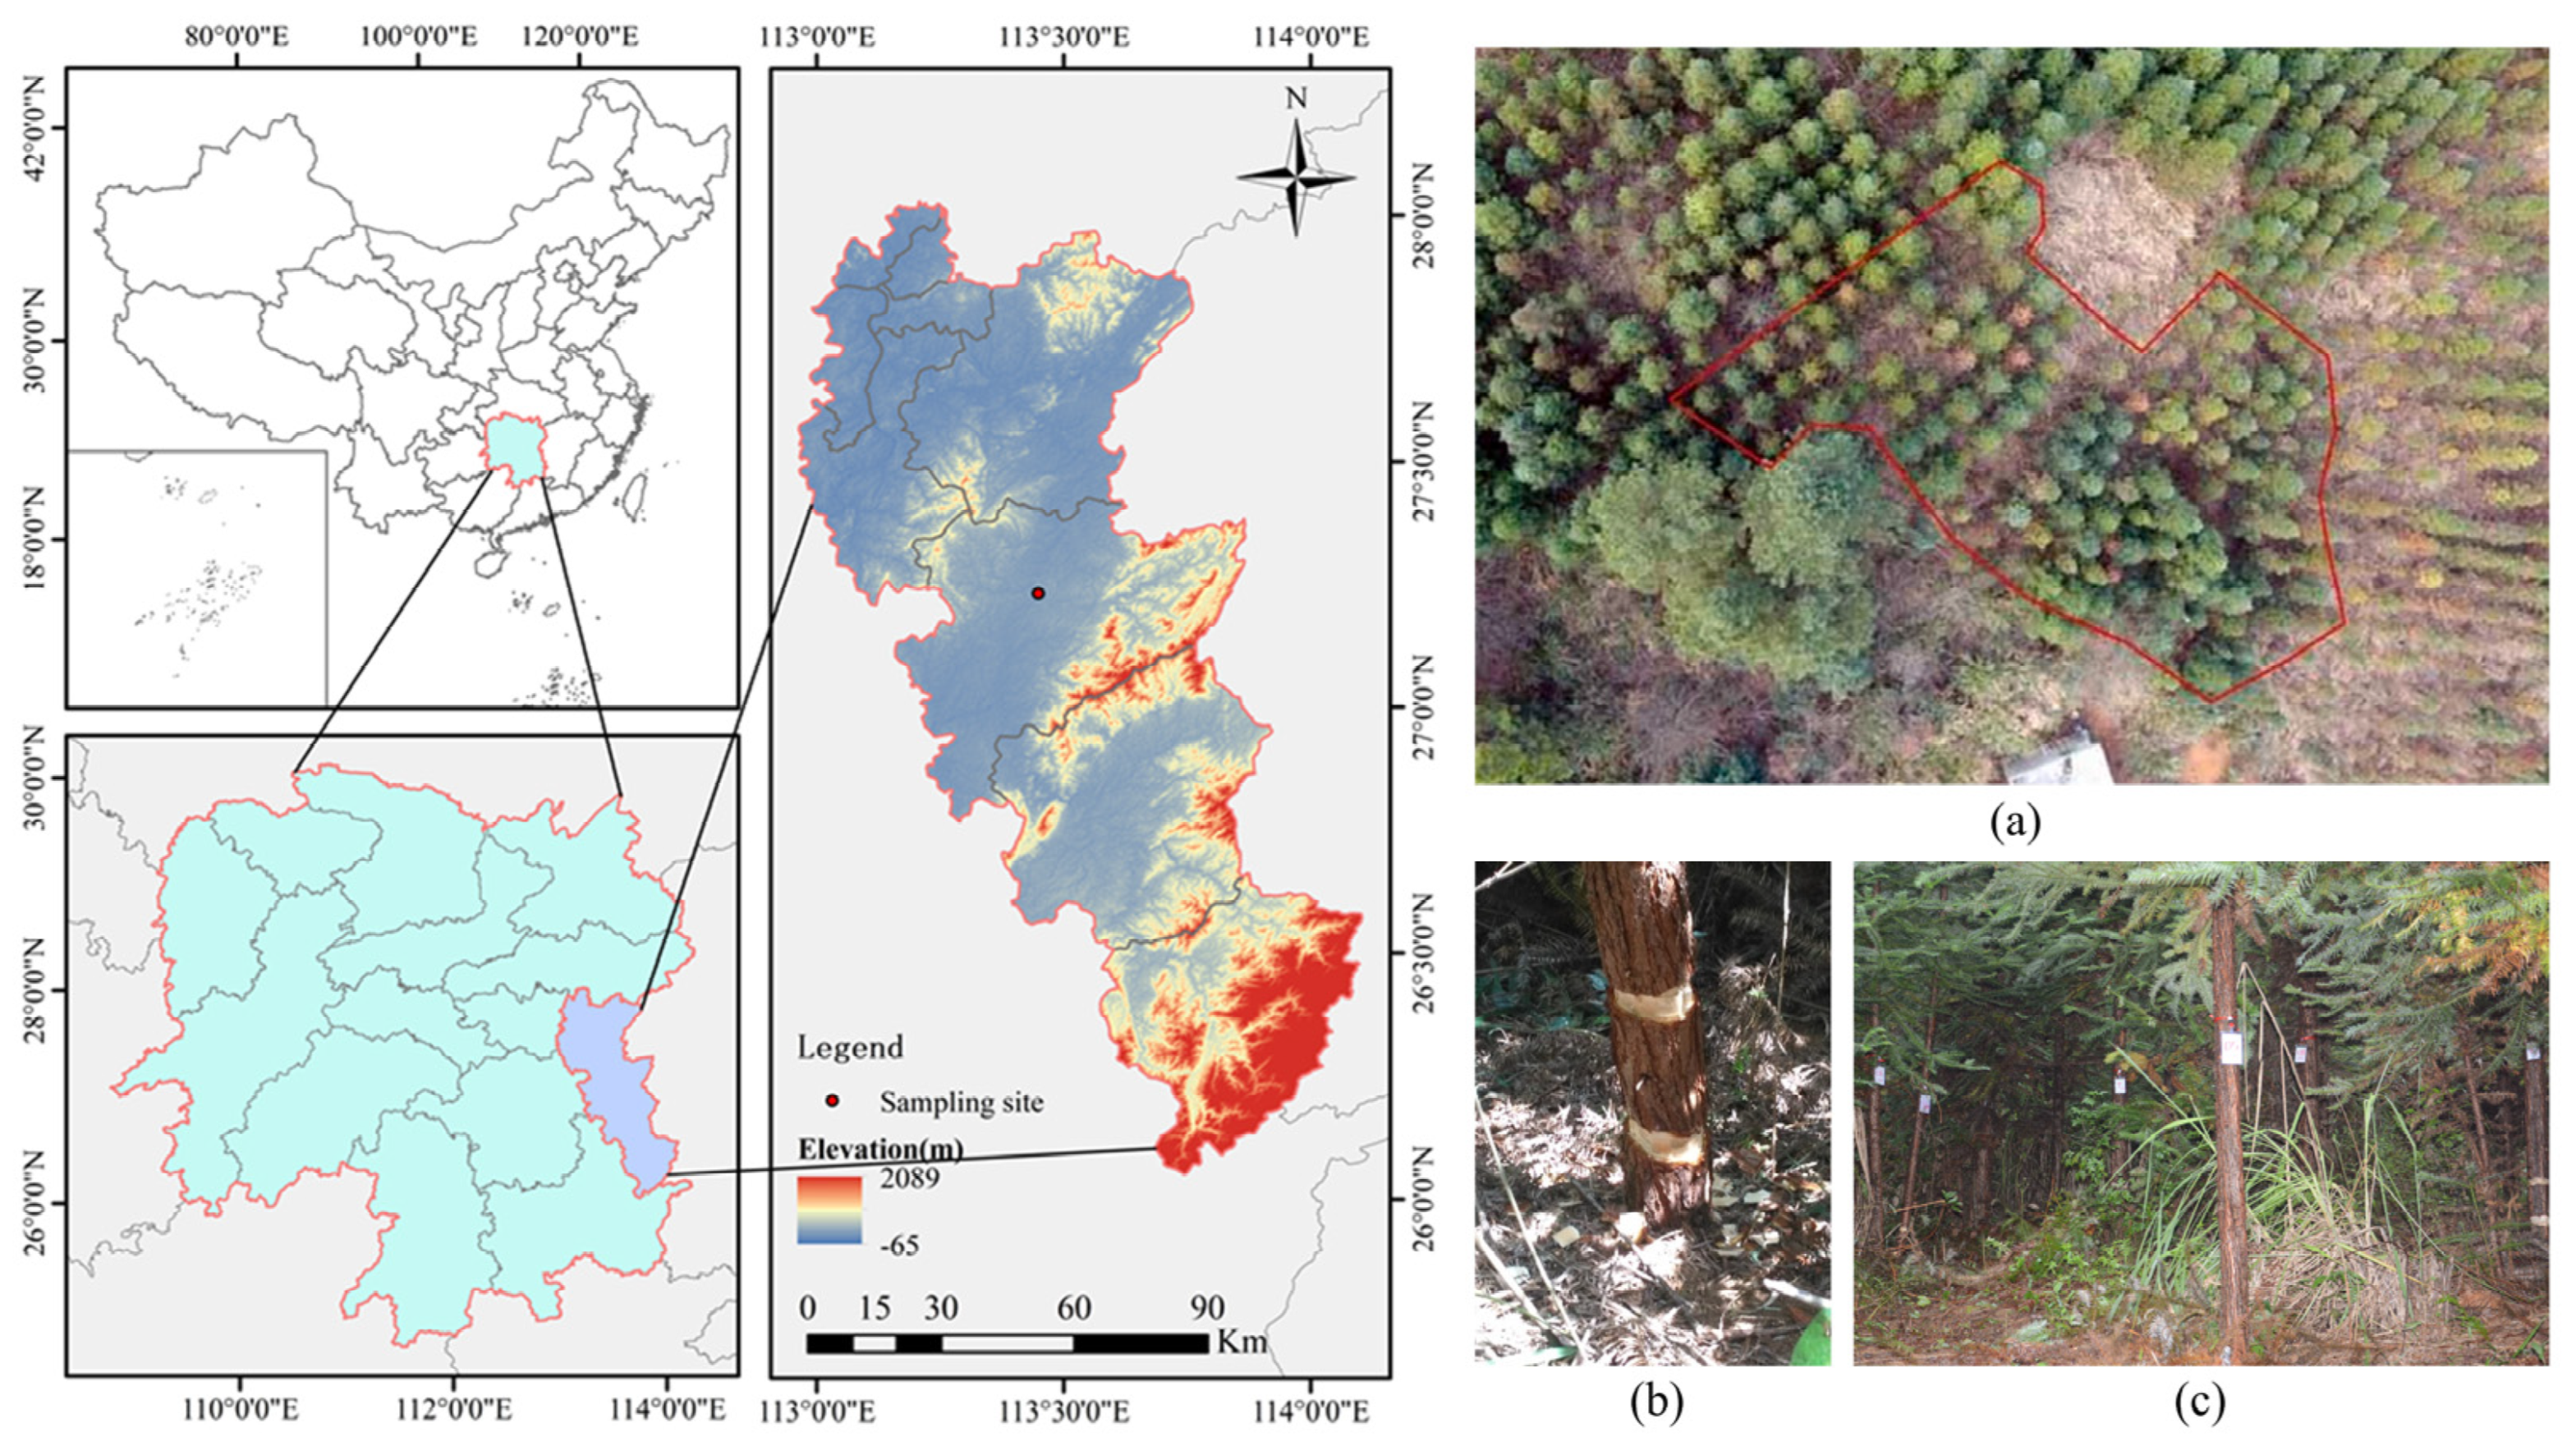
2.1. Study Area

The study area is located in the state-owned Huangfengqiao forest farm in You County, Hunan Province, with approximate geographic coordinates of 113°40′ E, 27°2′ N (Figure 1). It is situated in a subtropical monsoon humid climate zone, with simultaneous rain and heat, and a mild and wet winter. You County has a frost-free climate with an average annual temperature of 17.8 °C and precipitation of 1420.8 mm. The main landform of the forest is low to medium mountains, with altitudes ranging from 115 to 1270 m above sea level. The forest land of the forest farm has a total area of 6748.2 ha, mainly ecological public welfare forests consisting of Chinese fir plantations [21].

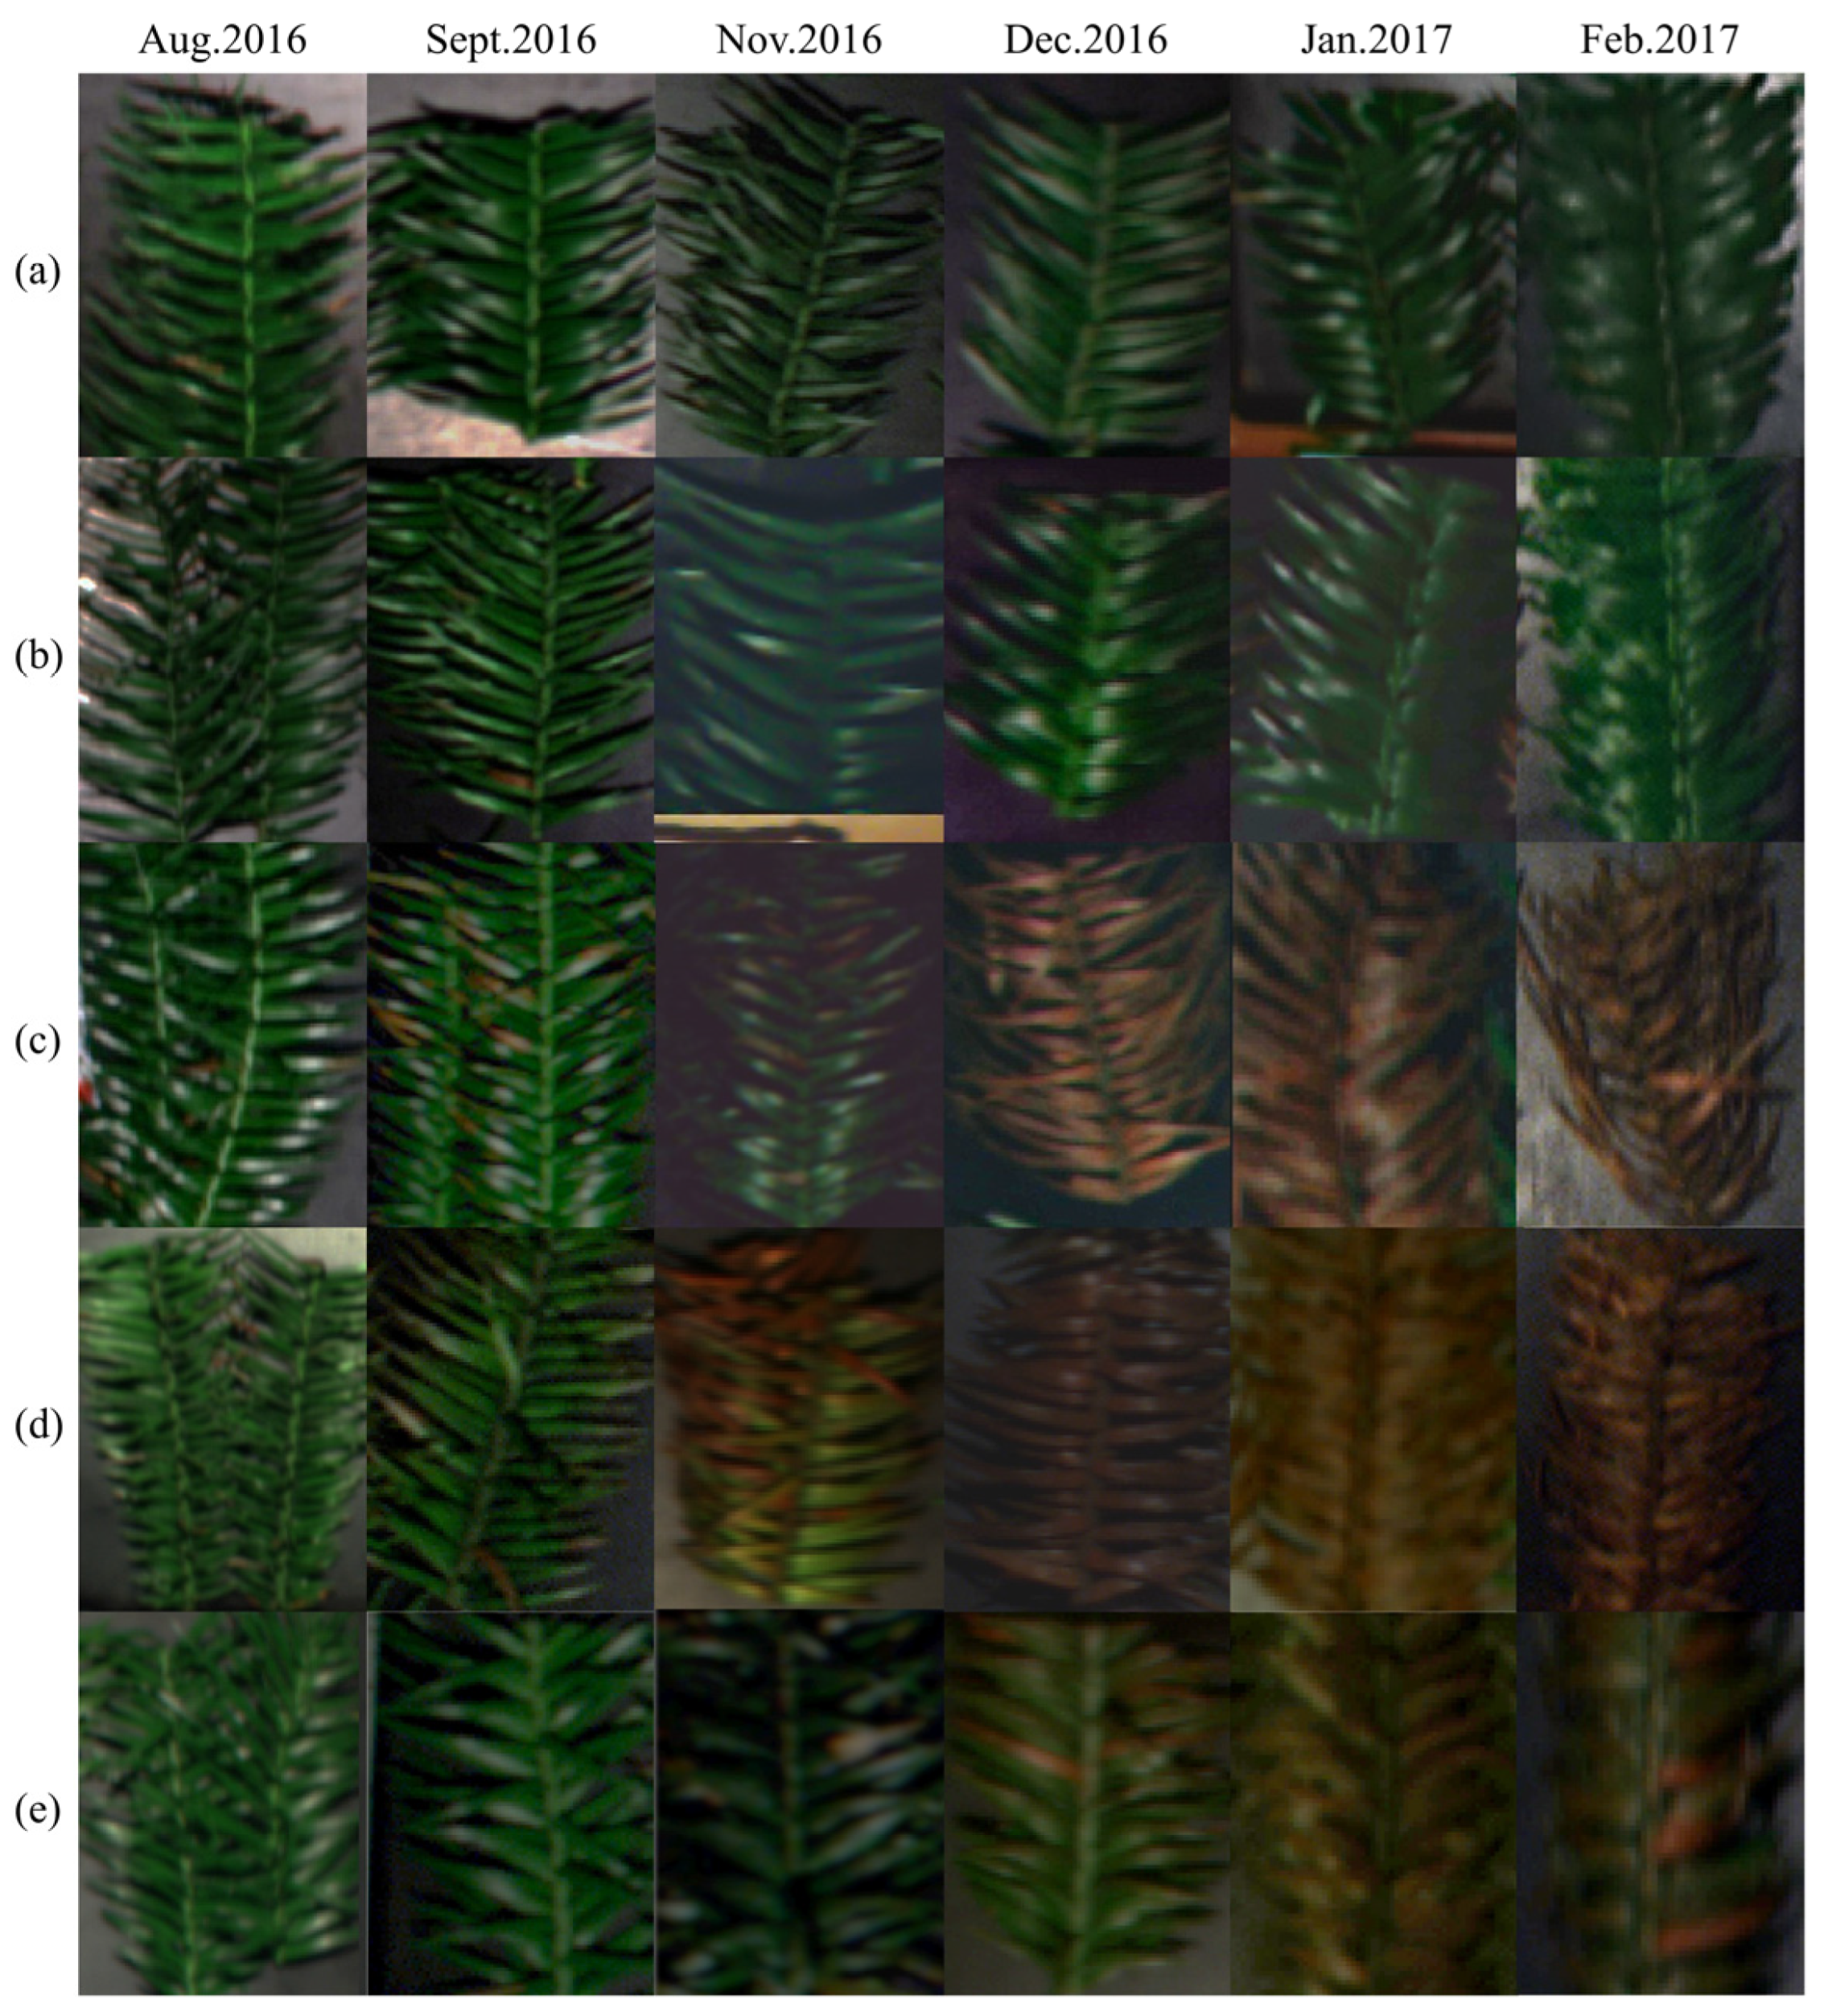
2.2. Experimental Design and Data Collection

When pests and diseases infest Chinese fir, it undergoes physiological and biochemical changes. The biofilm is damaged, the water content decreases, and the cells dehydrate. As the disease progresses, the affected Chinese fir experiences metabolic disorders that hinder its health growth and development. Additionally, the structure of chloroplasts may become damaged, causing a decreased photosynthetic rate and a reduction in pigment content. The external morphology of the Chinese fir begins to show a series of changes, with the leaves turning from green to yellow, then wilting, or even dying along with the whole plant.
In this study, to simulate the process of death of the affected Chinese fir trees, a 15-year-old middle-aged Chinese fir plantation was selected as the research object, and a total of 49 Chinese fir trees were selected, of which 32 target trees were used as the experimental group and 17 reference trees as the control group, and were numbered separately. After collecting hyperspectral imaging data in August 2016, we stripped the bark of Chinese fir trees in the experimental group at 20 cm and 70 cm above the ground, and the width of the stripped bark was 10 cm, resulting in the trees slowly losing water until they died.
The hyperspectral imaging data in this study were collected indoors using a tungsten lamp as a light source. The instrument used is the US SOC710 imaging spectrometer with 128 bands, a spectral range of 400–1000 nm, a spectral resolution of 4.6875 nm, and an imaging resolution of 696 × 520 pixels. The study data were collected monthly as often as possible to observe the spectral differences in Chinese fir trees. Therefore, the collection times for this experiment were 27 August, 12 September, 4 November, and 5 December 2016 and 8 January and 17 February 2017. Most of the Chinese fir trees in the experimental group had died in February 2017, but seven trees were still not dead.

2.3. Reflectance Extraction of Sample Points

Based on the preprocessed hyperspectral images, we randomly selected 20 sample points on the leaves of each tree, with 5880 sample points. After extracting each sample point’s reflectance using the ArcGIS software v 10.7, we made corresponding records according to the group, collection time, and whether the leaves were withered or not, and deleted the anomalous sample points located in the reflective position of the leaves.

2.4. Vegetation Indices Calculation

Vegetation indices offer a straightforward and efficient way to evaluate the state of vegetation [22]. According to different research objects and research purposes, scholars at home and abroad have developed several new vegetation indices and improved the existing ones. According to related papers, we selected 11 vegetation indices (Table 1).

2.5. Statistical Analysis

In this study, bootstrapping was used to calculate a 95% confidence interval for the difference between the medians of the control and experimental groups, with a sampling number of 1000. The Mann–Whitney U test was used to test the differences between the experimental and control groups each month to see the indices that would detect the differences earliest. The threshold for statistical significance (p) was established at 0.05.

3. Results

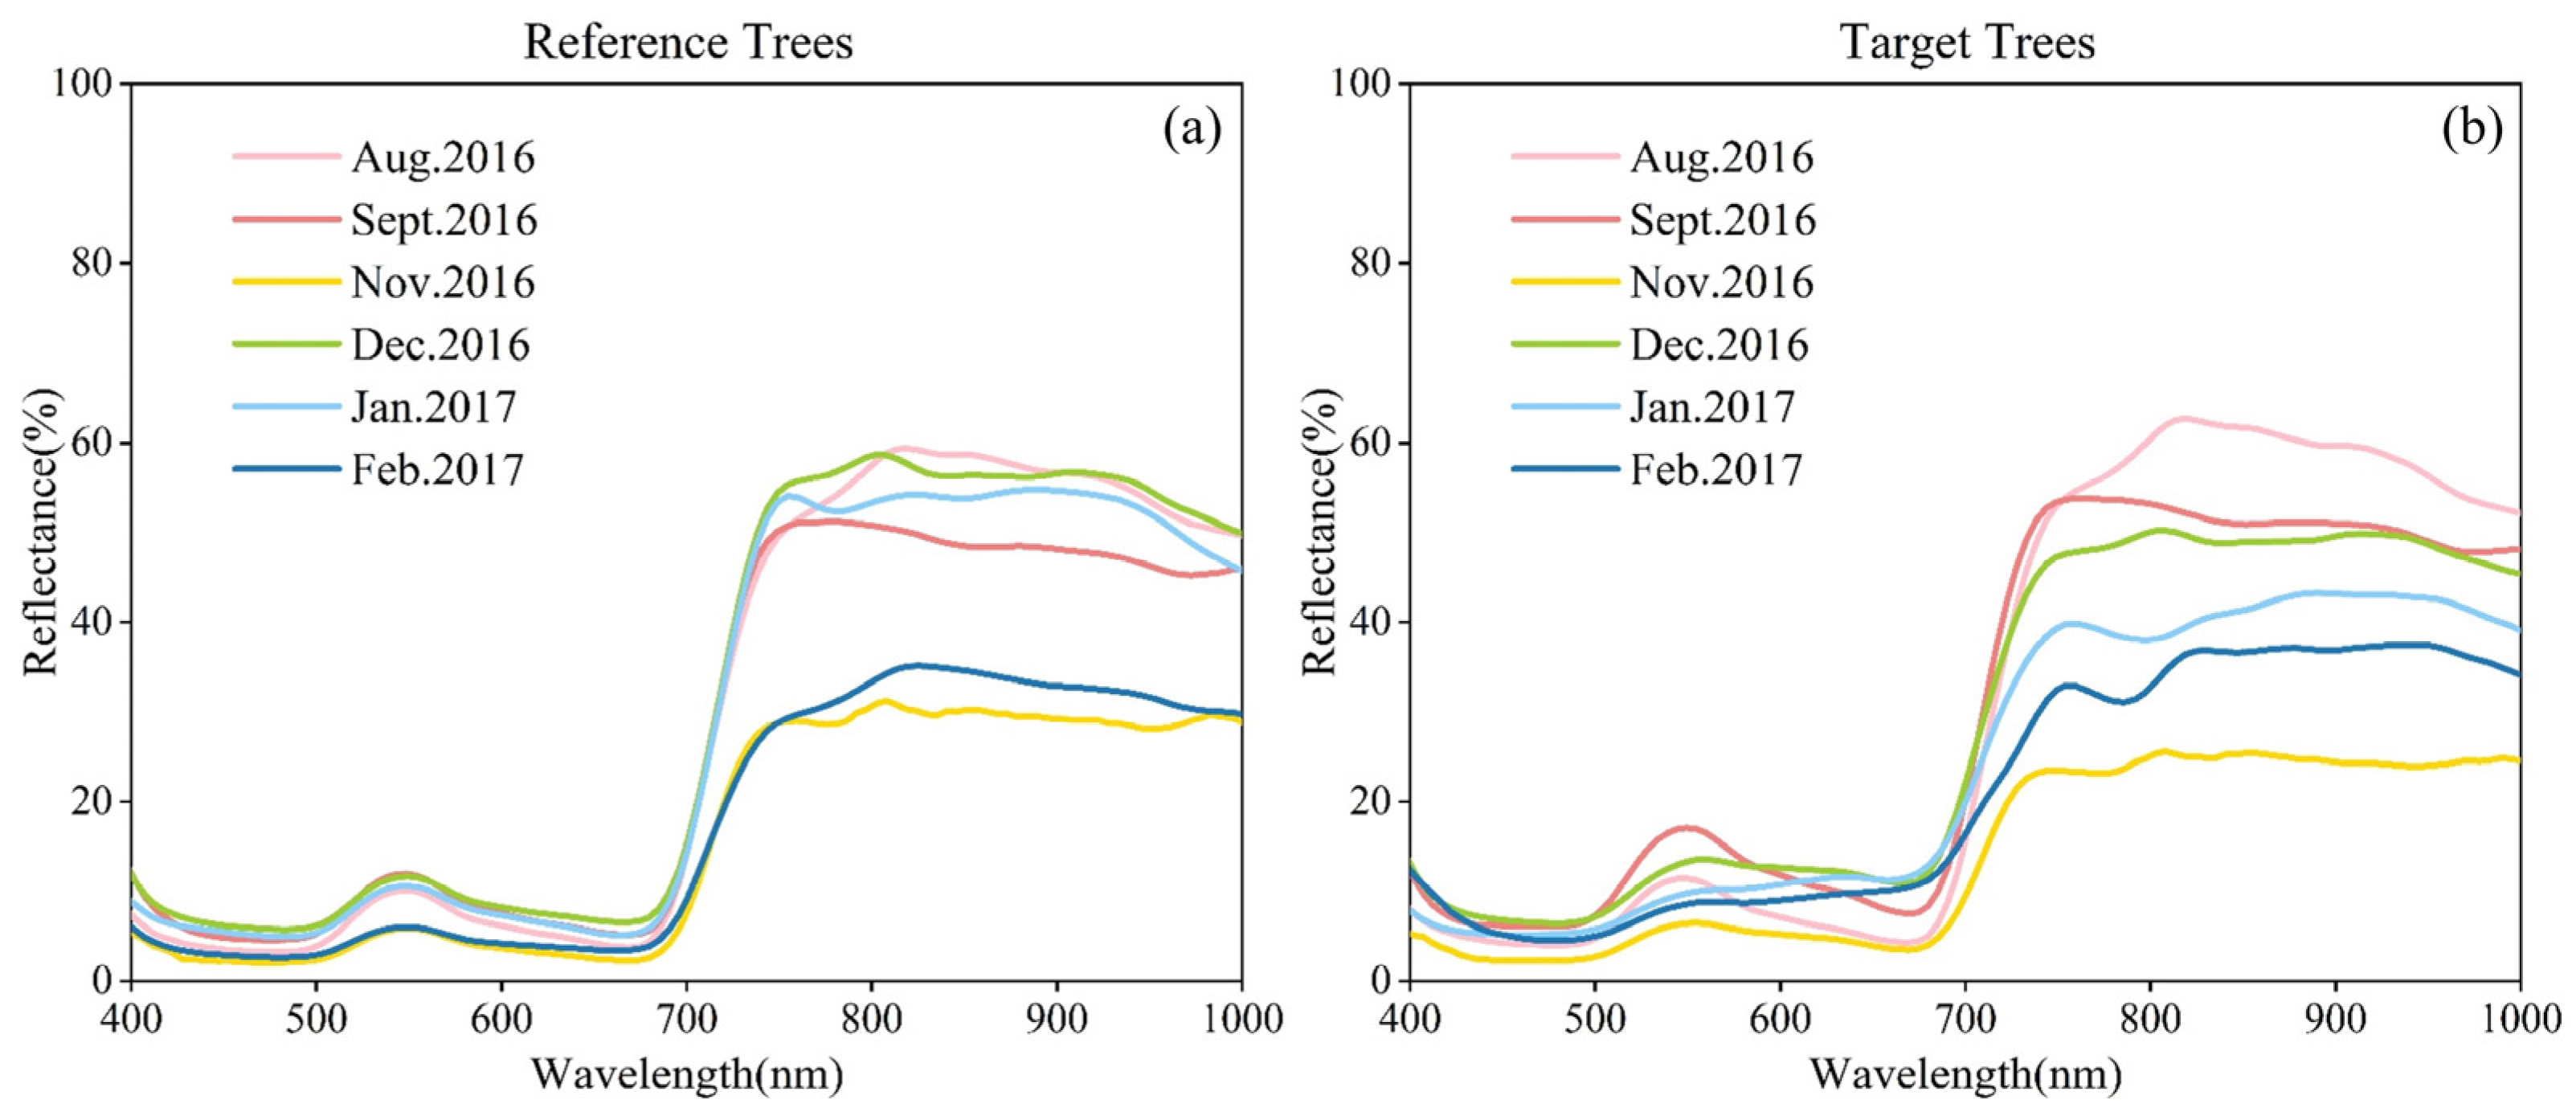
3.1. Comparison of Monthly Average Spectral Curves

In this study, the average spectral curves of the two groups were obtained based on the sample point reflectance data, as shown in Figure 2. Overall, the trends of the two groups of curves were significantly different. The curves of the control group for six months had similar trends, with a reflectance peak from 500 nm to 600 nm, the peak located near 550 nm, the reflectance from 680 nm to 760 nm starting to rise sharply to form a sloping edge, and the curves from 760 nm to 1000 nm all being relatively flat.
Although the trends of the spectral curves of the experimental group were different in different months, the reflectance of the same band showed a regular change in the degree of damage to the health of the Chinese fir trees. The trends of the curves before 550 nm did not differ much from those of the control group. The spectra from 550 nm to 680 nm changed slowly with the increase in dead trees. Between August and November 2016, the curves were high before and low after, but the reflectance differences gradually decreased. The curves became low before and high after in December 2016 and February 2017, and the green reflectance peaks disappeared. The slope of the curves became smaller from 680 nm to 760 nm. From 760 nm to 1000 nm, the characteristics of the curves in the six observation periods were similar, but the difference in reflectance was large enough to be clearly distinguished.
The mean reflectance value of the experimental group in August 2016 was nearly identical to that of the control group. This is because the bark of the Chinese fir trees in the experimental group had not been stripped off when the hyperspectral data were collected in August 2016. Therefore, the spectral data from August can be considered the spectral data of healthy trees. The trend of the curve of the experimental group in September was similar to that of the healthy trees. From November onward, the green reflection peak gradually decreased, and the experimental and control groups could be distinguished, as shown in Figure 2.

3.2. Comparison of Monitoring Effectiveness of Vegetation Indices

To find the vegetation indices that could detect the difference between the experimental and control data earlier, this study analyzed the effect of the 11 indices using Mann–Whitney U tests. Based on the images of each vegetation index, the indices values corresponding to each sample point were extracted and then tested (Table 2).
VIgreen, PSRI, and VARI were unsuitable for monitoring physiological changes in Chinese fir trees, and they could not detect differences between the experimental and control groups until the trees had been damaged for 134 days. Although GNDVI and SRPI were able to monitor the difference between the two groups at a significant level of 0.05 as early as September 2016, GNDVI performed poorly in January 2017, and SRPI performed poorly in November 2016, suggesting that these two indices are less stable and unsuitable for monitoring physiological changes in Chinese fir trees.
Six vegetation indices, NDVI, PSND, REP, NWI, GRSAI, and GRRSGI, could distinguish between the two groups at the 0.05 significance level. NDVI, PSND, and NWI showed irregular fluctuations at a significant level of 0.01, suggesting that these three indices are still not optimal. The indices with the best test results were REP and GRRSGI, with highly significant differences between the two groups from September 2016 to February 2017. GRSAI performs slightly worse than REP and GRRSGI as it can only differentiate the data in September 2016 at a 0.05 significance level.

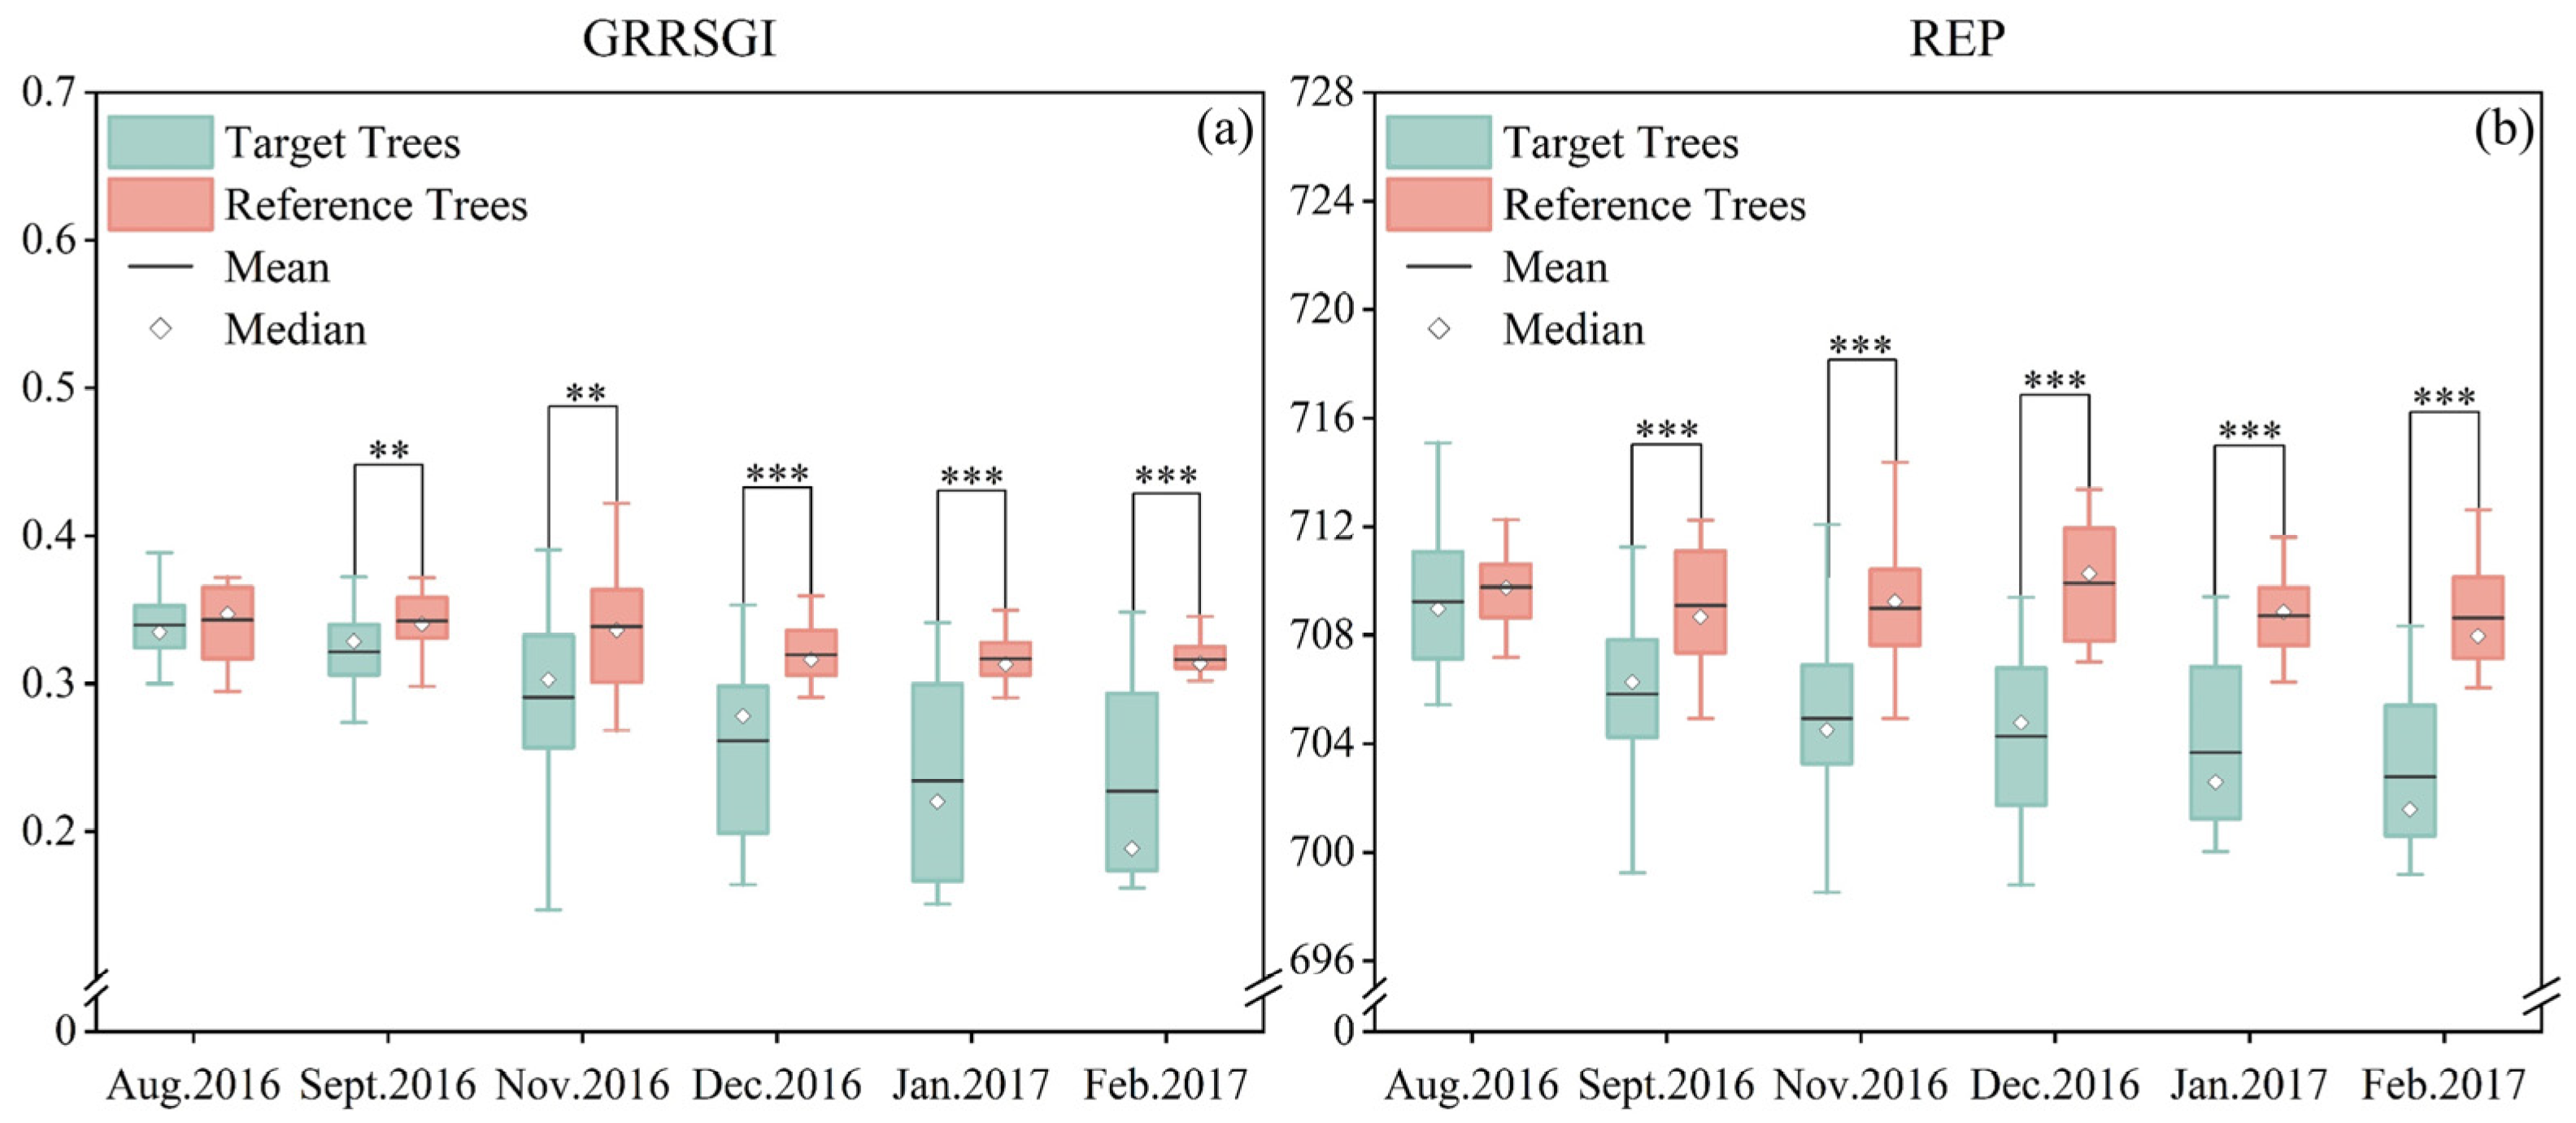
3.3. Effectiveness Evaluation of REP and GRRSGI

Since the test results for REP and GRRSGI were approximately the same, these indices need to be further evaluated to select the best vegetation index to monitor changes in Chinese fir trees’ health. As seen in Figure 3, the mean and median of the same index for the control group in the same month are very similar in magnitude, and the differences between these two sample statistics over the six different observation periods are small. The mean and median values of GRRSGI for the experimental group became progressively smaller as the number of Chinese fir tree deaths increased. The mean REP of the experimental group also gradually decreased over time, and the median showed a fluctuating trend, suggesting that it may have been influenced by other factors.
During the observation period, the relationship between the median and mean of REP in the experimental group changed frequently. The median and mean of GRRSGI were almost the same in August 2016. As the number of Chinese fir deaths increased, the relationship between the median and mean of GRRSGI changed from larger to less than in January 2017. It is demonstrated that GRRSGI was less variable than REP.
For a more intuitive view of the application effect of REP and GRRSGI, hyperspectral imagery, REP imagery, and GRRSGI imagery in September 2016 are compared in this study, as shown in Figure 4. The difference between the REP image and the GRRSGI image of the R26 sample branches is minimal. The GRRSGI of T9 and T29 outperformed REP and could distinguish green leaves from wilted leaves more accurately. For example, some of the sample branches in the two red ellipses have blurred edges for the wilted leaves in the REP image, which are more difficult to distinguish; the wilted leaves in the GRRSGI image have a high degree of differentiation from the green leaves, and their outlines match those in the hyperspectral image. In addition, there is more noise in the REP image, whereas GRRSGI is less affected by the noise factor. Therefore, GRRSGI is more suitable than REP as a reference factor for monitoring pests and diseases in Chinese fir trees.

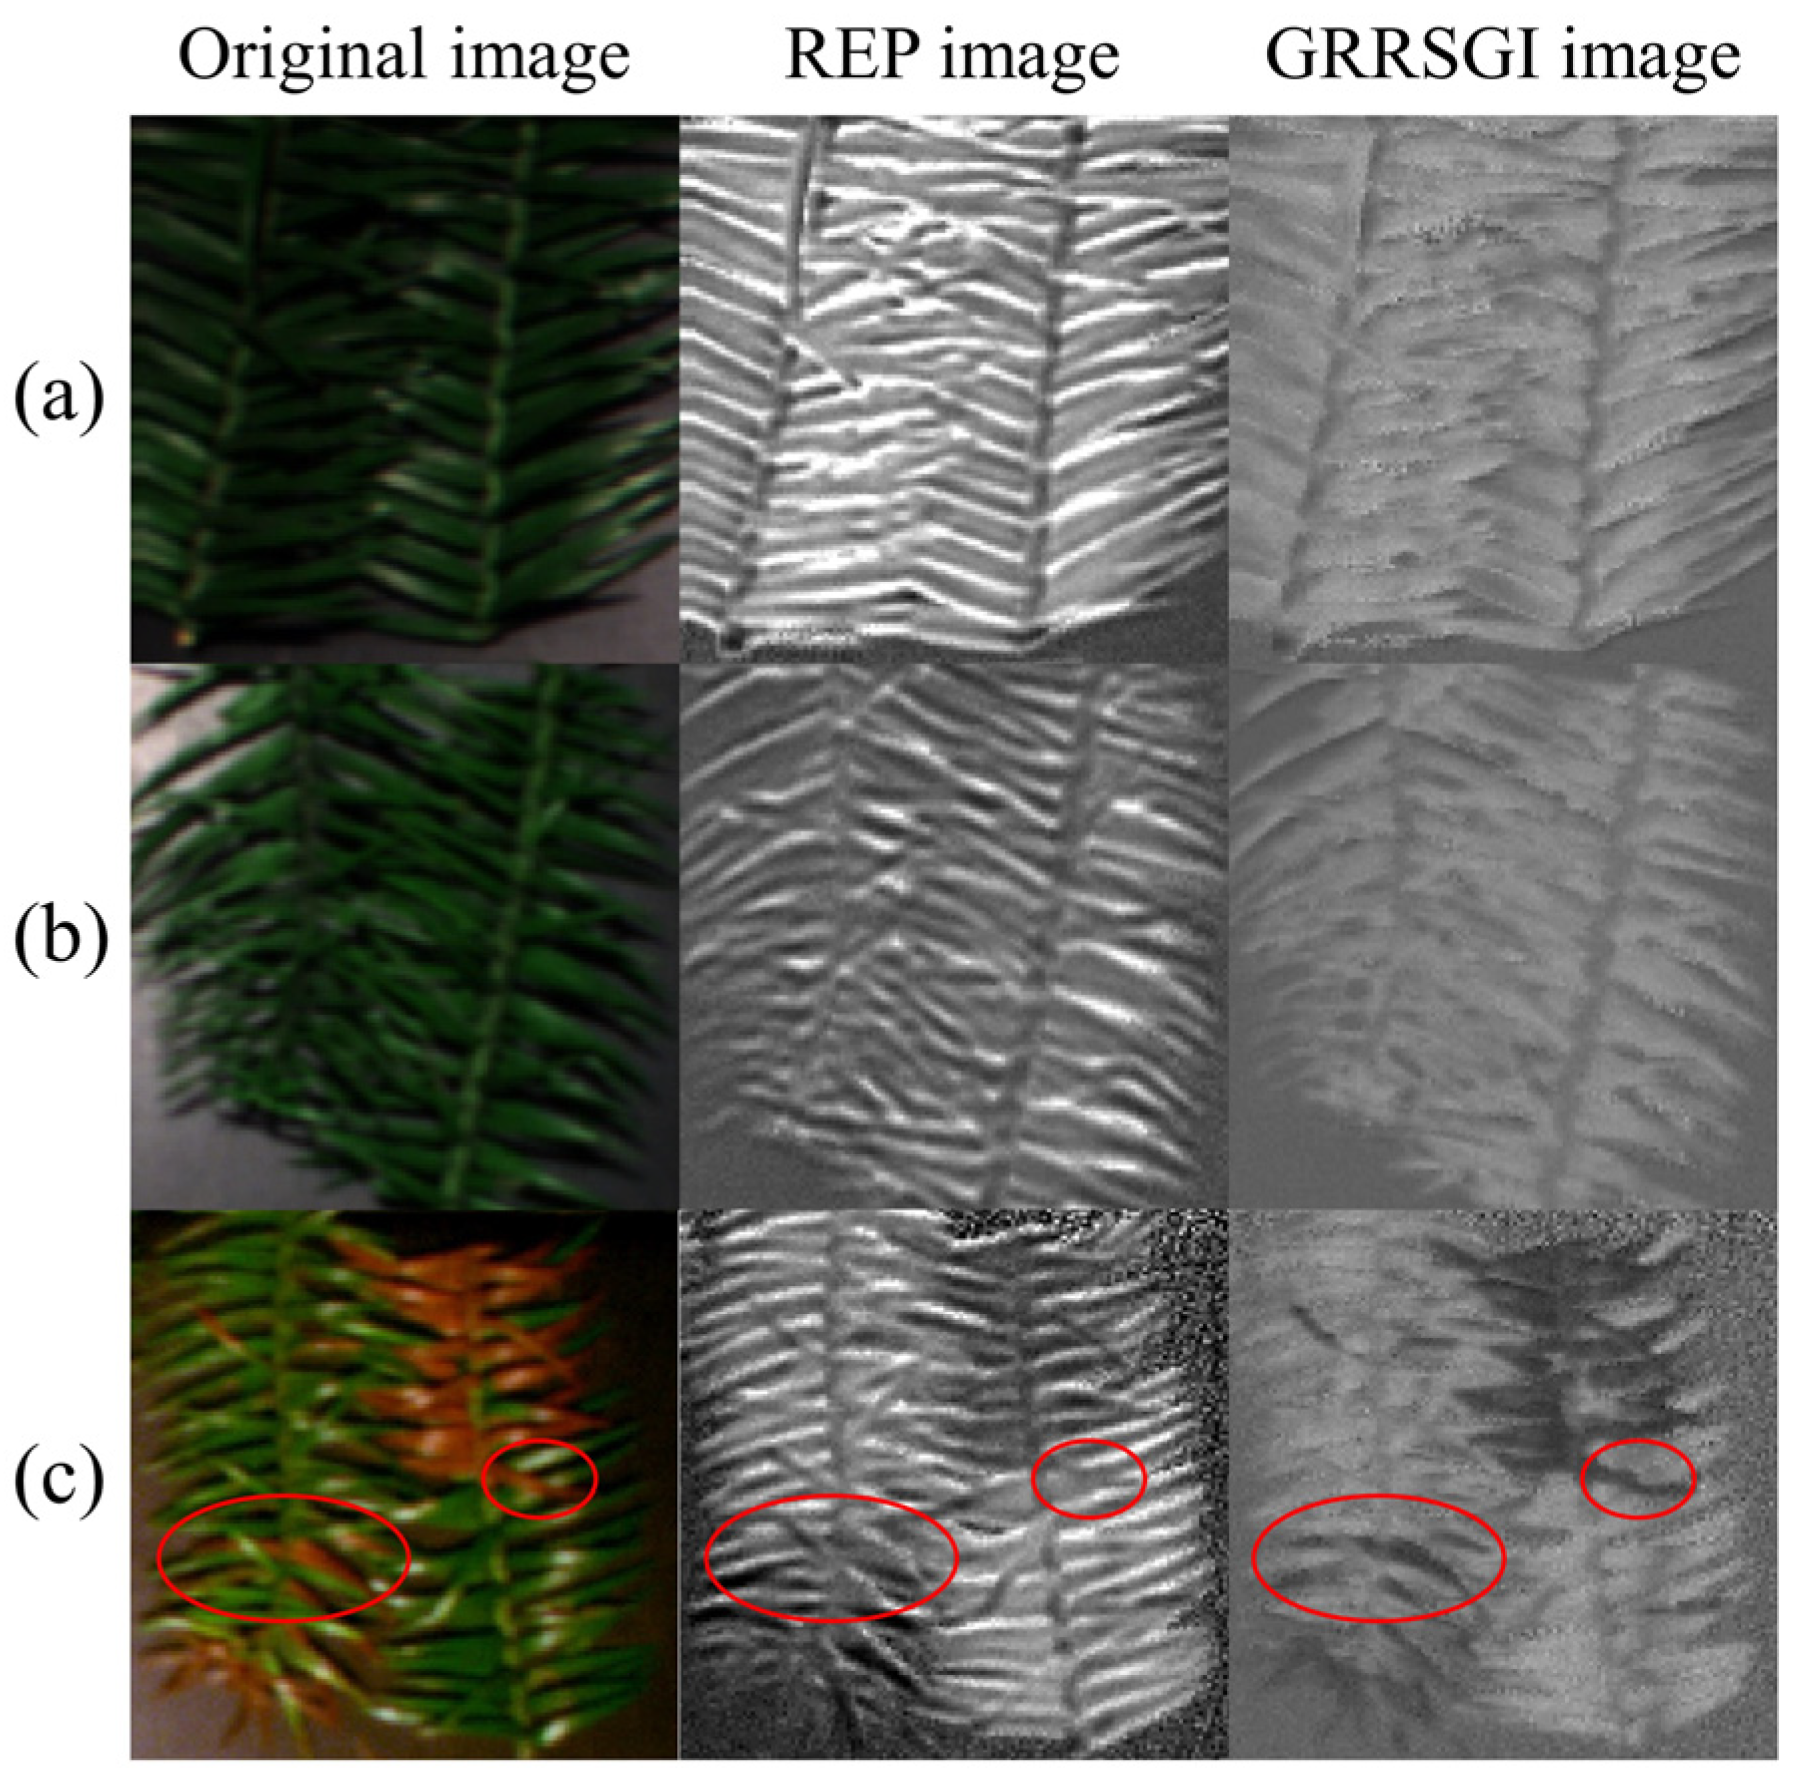
3.4. Validation of the Sensitivity of the Collection of Bands (550 nm–640 nm) Used by GRRSGI

The better and more stable performance of GRRSGI may be because it uses bands that are more sensitive to the health damage of Chinese fir trees and accumulates subtle variations in multiple bands (550 nm–640 nm). To verify the reliability of this band collection, we selected five trees in different physiological states and analyzed the differences in reflectance at 550 nm–640 nm for each tree.
Figure 5 and Figure 6 show hyperspectral images and spectral curves at 550 nm–640 nm for five Chinese fir trees, respectively. The leaves of both T6 and R6 were green, and the spectral curves both showed a decreasing trend. T6 and R6 behaved similarly with green leaves and both curves showed a decreasing trend, probably because T6 has a better ability to resist damage. In contrast, T1 already had a small portion of wilted leaves 16 days after being debarked, and then the symptoms gradually deepened until it completely wilted in December 2016. Its curves are a good representation of the spectral variation of the dying process, with a downward trend from August 2016 to November 2016 and an upward trend from December 2016 to February 2017 in all cases. T11 had more dead leaves on the sample branches in November 2016 with the slope of the curve near zero, and the trends of the curves in other months were similar to those of T1. The T25 curves from August to November 2016 show a consistent and continuous decrease, but the curve in January 2017 indicates an increase. The other curves show an initial increase followed by a decline, with the point of inflection occurring at approximately 600 nm. In February 2017, the T25 sample branches had more wilted leaves and a smaller decline in reflectance than in December 2016. The difference in the curve’s trend between January and February 2017 could be attributed to T25’s strong vitality.
Overall, although there were individual differences in the trends of the curves of five Chinese fir trees, 550 nm–640 nm could well reflect the physiological changes in each tree and follow a regular pattern. The reflectance of a healthy Chinese fir decreases as the wavelength increases. However, at the early stages of damage, the decrease in reflectance becomes smaller. As the Chinese fir becomes more damaged or dies, its reflectance increases as the wavelength increases.

4. Discussion

Of all the vegetation indices selected, NDVI is most commonly used to assess the severity of forest pests and diseases and to estimate tree mortality [31,32,33,34]. Like NDVI, PSND and REP utilize only the red and near-infrared bands. Since PSND varies with vegetation chlorophyll content, it can be used to estimate the chlorophyll content or to assess vegetation senescence [35,36]. Run Yu et al. showed that REP and PSRI could distinguish infected red pine from healthy red pine after 30 days [37]. The ability of PSRI to detect pine wilt disease was also verified by Dewei Wu et al. [38]. Vegetation indices that also use blue light bands include SRPI and VARI. SRPI is correlated with chlorophyll and carotene and was first used to assess damage in mite-infested apple trees [25]. It has also been used to predict chlorophyll content or detect flooding stress [39,40]. VARI is related to vegetation biomass and can be used to calculate relative greenness (RG) and monitor vegetation health [41,42]. The model it participates in has a high accuracy in applications for detecting diseased trees [43]. GNDVI, VIgreen, and NWI all use the green light band. The first two indices performed better in applications to identify avocados infected with laurel wilt [44]. NWI was constructed for oak wilt disease detection and performed better than NDVI [30].
All of the above vegetation indices are commonly used to estimate the physiological and biochemical parameters of vegetation or to monitor the vegetation damage caused by pests, diseases, human activities, and environmental stresses. However, GNDVI, NDVI, NWI, PSND, VIgreen, PSRI, SRPI, and VARI did not perform well in the early monitoring of the Chinese fir dying process. There are two main reasons. One is that the utilized bands do not reflect the subtle changes in damaged Chinese fir. The other may be that the number of bands used is small, susceptible to noise and environmental factors, and poorly stabilized. While REP could monitor highly significant differences between the experimental and control groups throughout September 2016–February 2017, it utilized only four bands and was also unstable. Kim et al. concluded that vegetation indices calculated based on only a few bands have higher variability than those calculated based on multiple bands [19].
GRRSGI and GRSAI were created based on the 550 nm–640 nm band collection and the 550 nm–670 nm band collection, respectively. Zhuo Zang et al. calculated 11 vegetation indices based on hyperspectral non-imaging data, and the results of t-tests showed that GRRSGI and GRSAI could detect differences between damaged and healthy Chinese fir trees at the 0.01 significance level [20]. This experiment obtained similar results on hyperspectral imaging data, indicating that GRRSGI and GRSAI can be generalized to hyperspectral imaging data and that GRRSGI is superior to other vegetation indices.
Although hyperspectral imaging data have significant advantages in the early monitoring of pests and diseases, data quality is susceptible to measurement conditions. This study compared only 11 vegetation indices to determine the best one for monitoring early damage in Chinese fir trees. However, there may be other indices that are more sensitive to vegetation senescence and damage. In future studies, we will compare the effectiveness of more different indices in extracting spectral information of damaged Chinese fir. In addition, the findings of this experiment only address early damage in a small range of Chinese fir trees and require further validation when applied to other conifer forest types and scales.

5. Conclusions

In this study, we monitored the Chinese fir dying process using hyperspectral imaging data and compared the effectiveness of 11 vegetation indices. The results show that REP and GRRSGI were able to effectively distinguish subtle differences in leaf reflectance between damaged Chinese fir trees and healthy Chinese fir trees at an early stage. However, GRRSGI was able to effectively avoid the influence of noise, thus extracting the spectral change information more stably and accurately, and performed best among the 11 vegetation indices. Overall, GRSAI and GRRSGI constructed based on non-imaging hyperspectral data showed better stability than the other vegetation indices in monitoring the early damage process of Chinese fir trees, and they have the same advantages when used for hyperspectral imaging data.

Author Contributions

Conceptualization, X.T. and Z.Z.; methodology, X.T. and Z.Z.; software, X.T., X.W. and Z.Z.; validation, X.T. and Z.Z.; formal analysis, X.T. and Z.Z.; investigation, X.T. and Z.Z.; resources, Z.Z. and H.L.; data curation, X.T. and Z.W.; writing—original draft preparation, X.T. and Z.Z.; writing—review and editing, X.T. and Z.Z.; visualization, X.T. and Z.Z.; supervision, Z.Z. and H.L.; project administration, H.L.; funding acquisition, H.L. All authors have read and agreed to the published version of the manuscript.

Funding

This research was funded by the National Natural Science Foundation of China (N#31370639), supported by the Hainan Provincial Natural Science Foundation of China (N#621RC673).

Data Availability Statement

The data presented in this study are available on request from the corresponding author. The data are not publicly available due to the university’s confidentiality agreement.

Conflicts of Interest

The authors declare no conflict of interest.

References

  1. Lei, L.; Chai, G.; Wang, Y.; Jia, X.; Yin, T.; Zhang, X. Estimating Individual Tree Above-Ground Biomass of Chinese Fir Plantation: Exploring the Combination of Multi-Dimensional Features from UAV Oblique Photos. Remote Sens. 2022, 14, 504. [Google Scholar] [CrossRef]
  2. You, R.; Zhu, N.; Deng, X.; Wang, J.; Liu, F. Variation in Wood Physical Properties and Effects of Climate for Different Geographic Sources of Chinese Fir in Subtropical Area of China. Sci. Rep. 2021, 11, 4664. [Google Scholar] [CrossRef] [PubMed]
  3. Yin, T.; Zeng, J.; Zhang, X.; Zhou, X. Individual Tree Parameters Estimation for Chinese Fir (Cunninghamia lanceolate (Lamb.) Hook) Plantations of South China Using UAV Oblique Photography: Possibilities and Challenges. IEEE J. Sel. Top. Appl. Earth Obs. Remote Sens. 2021, 14, 827–842. [Google Scholar] [CrossRef]
  4. Lei, J.; Wu, H.; Li, X.; Guo, W.; Duan, A.; Zhang, J. Response of Rhizosphere Bacterial Communities to Near-Natural Forest Management and Tree Species within Chinese Fir Plantations. Microbiol. Spectr. 2023, 11, e02328-22. [Google Scholar] [CrossRef] [PubMed]
  5. Zhang, N.; Yang, G.; Pan, Y.; Yang, X.; Chen, L.; Zhao, C. A Review of Advanced Technologies and Development for Hyperspectral-Based Plant Disease Detection in the Past Three Decades. Remote Sens. 2020, 12, 3188. [Google Scholar] [CrossRef]
  6. Long, L.; Chen, Y.; Song, S.; Zhang, X.; Jia, X.; Lu, Y.; Liu, G. Remote Sensing Monitoring of Pine Wilt Disease Based on Time-Series Remote Sensing Index. Remote Sens. 2023, 15, 360. [Google Scholar] [CrossRef]
  7. Gooshbor, L.; Bavaghar, M.P.; Amanollahi, J.; Ghobari, H. Monitoring infestations of oak forests by Tortrix viridana (Lepidoptera: Tortricidae) using remote sensing. Plant Prot. Sci. 2016, 52, 270–276. [Google Scholar] [CrossRef]
  8. Duarte, A.; Acevedo-Muñoz, L.; Gonçalves, C.I.; Mota, L.; Sarmento, A.; Silva, M.; Fabres, S.; Borralho, N.; Valente, C. Detection of Longhorned Borer Attack and Assessment in Eucalyptus Plantations Using UAV Imagery. Remote Sens. 2020, 12, 3153. [Google Scholar] [CrossRef]
  9. Xiao, D.; Pan, Y.; Feng, J.; Yin, J.; Liu, Y.; He, L. Remote Sensing Detection Algorithm for Apple Fire Blight Based on UAV Multispectral Image. Comput. Electron. Agric. 2022, 199, 107137. [Google Scholar] [CrossRef]
  10. Chang, A.; Yeom, J.; Jung, J.; Landivar, J. Comparison of Canopy Shape and Vegetation Indices of Citrus Trees Derived from UAV Multispectral Images for Characterization of Citrus Greening Disease. Remote Sens. 2020, 12, 4122. [Google Scholar] [CrossRef]
  11. Han, L.; Yang, G.; Dai, H.; Xu, B.; Yang, H.; Feng, H.; Li, Z.; Yang, X. Modeling Maize Above-Ground Biomass Based on Machine Learning Approaches Using UAV Remote-Sensing Data. Plant Methods 2019, 15, 10. [Google Scholar] [CrossRef] [PubMed]
  12. Gold, K.M.; Townsend, P.A.; Chlus, A.; Herrmann, I.; Couture, J.J.; Larson, E.R.; Gevens, A.J. Hyperspectral Measurements Enable Pre-Symptomatic Detection and Differentiation of Contrasting Physiological Effects of Late Blight and Early Blight in Potato. Remote Sens. 2020, 12, 286. [Google Scholar] [CrossRef]
  13. Xi, G.; Huang, X.; Xie, Y.; Gang, B.; Bao, Y.; Dashzebeg, G.; Nanzad, T.; Dorjsuren, A.; Enkhnasan, D.; Ariunaa, M. Detection of Larch Forest Stress from Jas’s Larch Inchworm (Erannis Jacobsoni Djak) Attack Using Hyperspectral Remote Sensing. Remote Sens. 2022, 14, 124. [Google Scholar] [CrossRef]
  14. Donovan, S.D.; MacLean, D.A.; Zhang, Y.; Lavigne, M.B.; Kershaw, J.A. Evaluating Annual Spruce Budworm Defoliation Using Change Detection of Vegetation Indices Calculated from Satellite Hyperspectral Imagery. Remote Sens. Environ. 2021, 253, 112204. [Google Scholar] [CrossRef]
  15. Pan, J.; Lin, J.; Xie, T. Exploring the Potential of UAV-Based Hyperspectral Imagery on Pine Wilt Disease Detection: Influence of Spatio-Temporal Scales. Remote Sens. 2023, 15, 2281. [Google Scholar] [CrossRef]
  16. Yu, R.; Ren, L.; Luo, Y. Early Detection of Pine Wilt Disease in Pinus Tabuliformis in North China Using a Field Portable Spectrometer and UAV-Based Hyperspectral Imagery. For. Ecosyst. 2021, 8, 44. [Google Scholar] [CrossRef]
  17. Jiang, X.; Zhen, J.; Miao, J.; Zhao, D.; Wang, J.; Jia, S. Assessing Mangrove Leaf Traits under Different Pest and Disease Severity with Hyperspectral Imaging Spectroscopy. Ecol. Indic. 2021, 129, 107901. [Google Scholar] [CrossRef]
  18. Jiang, X.; Zhen, J.; Miao, J.; Zhao, D.; Shen, Z.; Jiang, J.; Gao, C.; Wu, G.; Wang, J. Newly-Developed Three-Band Hyperspectral Vegetation Index for Estimating Leaf Relative Chlorophyll Content of Mangrove under Different Severities of Pest and Disease. Ecol. Indic. 2022, 140, 108978. [Google Scholar] [CrossRef]
  19. Kim, S.-R.; Lee, W.-K.; Lim, C.-H.; Kim, M.; Kafatos, M.C.; Lee, S.-H.; Lee, S.-S. Hyperspectral Analysis of Pine Wilt Disease to Determine an Optimal Detection Index. Forests 2018, 9, 115. [Google Scholar] [CrossRef]
  20. Zang, Z.; Wang, G.; Lin, H.; Luo, P. Developing a Spectral Angle Based Vegetation Index for Detecting the Early Dying Process of Chinese Fir Trees. ISPRS J. Photogramm. Remote Sens. 2021, 171, 253–265. [Google Scholar] [CrossRef]
  21. Zhang, T.; Lin, H.; Long, J.; Zheng, H.; Ye, Z.; Liu, Z. Evaluating the Sensitivity of Polarimetric Features Related to Rotation Domain and Mapping Chinese Fir AGB Using Quad-Polarimetric SAR Images. Remote Sens. 2023, 15, 1519. [Google Scholar] [CrossRef]
  22. Xue, J.; Su, B. Significant Remote Sensing Vegetation Indices: A Review of Developments and Applications. J. Sens. 2017, 2017, e1353691. [Google Scholar] [CrossRef]
  23. Rouse, J.W.; Haas, R.H.; Schell, J.A.; Deering, D.W. Monitoring Vegetation Systems in the Great Plains with ERTS; NASA: Washington, DC, USA, 1974. [Google Scholar]
  24. Gitelson, A.A.; Kaufman, Y.J.; Stark, R.; Rundquist, D. Novel Algorithms for Remote Estimation of Vegetation Fraction. Remote Sens. Environ. 2002, 80, 76–87. [Google Scholar] [CrossRef]
  25. Penuelas, J.; Filella, I.; Lloret, P.; Munoz, F.; Vilajeliu, M. Reflectance Assessment of Mite Effects on Apple Trees. Int. J. Remote Sens. 1995, 16, 2727–2733. [Google Scholar] [CrossRef]
  26. Gitelson, A.A.; Merzlyak, M.N.; Lichtenthaler, H.K. Detection of Red Edge Position and Chlorophyll Content by Reflectance Measurements Near 700 Nm. J. Plant Physiol. 1996, 148, 501–508. [Google Scholar] [CrossRef]
  27. Merzlyak, M.N.; Gitelson, A.A.; Chivkunova, O.B.; Rakitin, V.Y. Non-Destructive Optical Detection of Pigment Changes during Leaf Senescence and Fruit Ripening. Physiol. Plant. 1999, 106, 135–141. [Google Scholar] [CrossRef]
  28. Chappelle, E.W.; Kim, M.S.; McMurtrey, J.E. Ratio Analysis of Reflectance Spectra (RARS): An Algorithm for the Remote Estimation of the Concentrations of Chlorophyll A, Chlorophyll B, and Carotenoids in Soybean Leaves. Remote Sens. Environ. 1992, 39, 239–247. [Google Scholar] [CrossRef]
  29. Guyot, G.; Baret, F. Utilisation de la Haute Résolution Spectrale pour Suivre L’état des Couverts Végétaux. In Proceedings of the 4th International Colloquium on Spectral Signatures of Objects in Remote Sensing, Aussois, France, 18–22 January 1988; pp. 279–286. [Google Scholar]
  30. Uto, K.; Takabayashi, Y.; Kosugi, Y.; Ogata, T. Hyperspectral Analysis of Japanese Oak Wilt to Determine Normalized Wilt Index. In Proceedings of the IGARSS 2008—2008 IEEE International Geoscience and Remote Sensing Symposium, Boston, MA, USA, 7–11 July 2008; Volume 2, pp. II-295–II-298. [Google Scholar]
  31. Spruce, J.P.; Hicke, J.A.; Hargrove, W.W.; Grulke, N.E.; Meddens, A.J.H. Use of MODIS NDVI Products to Map Tree Mortality Levels in Forests Affected by Mountain Pine Beetle Outbreaks. Forests 2019, 10, 811. [Google Scholar] [CrossRef]
  32. Olsson, P.-O.; Lindström, J.; Eklundh, L. Near Real-Time Monitoring of Insect Induced Defoliation in Subalpine Birch Forests with MODIS Derived NDVI. Remote Sens. Environ. 2016, 181, 42–53. [Google Scholar] [CrossRef]
  33. Liu, M.; Zhang, Z.; Liu, X.; Li, M.; Shi, L. Trend Analysis of Coverage Variation in Pinus Yunnanensis Franch. Forests under the Influence of Pests and Abiotic Factors. Forests 2022, 13, 412. [Google Scholar] [CrossRef]
  34. Georgieva, M.; Belilov, S.; Dimitrov, S.; Iliev, M.; Trenkin, V.; Mirchev, P.; Georgiev, G. Application of Remote Sensing Data for Assessment of Bark Beetle Attacks in Pine Plantations in Kirkovo Region, the Eastern Rhodopes. Forests 2022, 13, 620. [Google Scholar] [CrossRef]
  35. Varpe, A.B.; Surase, R.R.; Vibhute, A.D.; Gaikwad, S.V.; Rajendra, Y.D.; Kale, K.V.; Mehrotra, S.C. Synygium Cumini Plant Photosynthetic Pigment Detection from Hyperspectral Datasets Using Spectral Indices. In Proceedings of the 2017 2nd International Conference on Man and Machine Interfacing (MAMI), Bhubaneswar, India, 21–23 December 2017; IEEE: Bhubaneswar, India, 2017; pp. 1–6. [Google Scholar]
  36. Blackburn, G.A. Spectral Indices for Estimating Photosynthetic Pigment Concentrations: A Test Using Senescent Tree Leaves. Int. J. Remote Sens. 1998, 19, 657–675. [Google Scholar] [CrossRef]
  37. Yu, R.; Huo, L.; Huang, H.; Yuan, Y.; Gao, B.; Liu, Y.; Yu, L.; Li, H.; Yang, L.; Ren, L.; et al. Early Detection of Pine Wilt Disease Tree Candidates Using Time-Series of Spectral Signatures. Front. Plant Sci. 2022, 13, 1000093. [Google Scholar] [CrossRef] [PubMed]
  38. Wu, D.; Yu, L.; Yu, R.; Zhou, Q.; Li, J.; Zhang, X.; Ren, L.; Luo, Y. Detection of the Monitoring Window for Pine Wilt Disease Using Multi-Temporal UAV-Based Multispectral Imagery and Machine Learning Algorithms. Remote Sens. 2023, 15, 444. [Google Scholar] [CrossRef]
  39. Feifei, Y.; Shengping, L.I.U.; Yeping, Z.H.U.; Shijuan, L.I. Identification and Level Discrimination of Waterlogging Stress in Winter Wheat Using Hyperspectral Remote Sensing. Smart Agric. 2021, 3, 35. [Google Scholar] [CrossRef]
  40. Baath, G.S.; Flynn, K.C.; Gowda, P.H.; Kakani, V.G.; Northup, B.K. Detecting Biophysical Characteristics and Nitrogen Status of Finger Millet at Hyperspectral and Multispectral Resolutions. Front. Agron. 2021, 2, 604598. [Google Scholar] [CrossRef]
  41. Schneider, P.; Roberts, D.A.; Kyriakidis, P.C. A VARI-Based Relative Greenness from MODIS Data for Computing the Fire Potential Index. Remote Sens. Environ. 2008, 112, 1151–1167. [Google Scholar] [CrossRef]
  42. Anisa, M.; Rokhmatuloh, R.; Hernina, R. UAV Application to Estimate Oil Palm Trees Health Using Visible Atmospherically Resistant Index (VARI) (Case Study of Cikabayan Research Farm, Bogor City). E3S Web Conf. 2020, 211, 05001. [Google Scholar] [CrossRef]
  43. Hoshikawa, T.; Yamamoto, K. Individual Tree Detection and Classification for Mapping Pine Wilt Disease Using Multispectral and Visible Color Imagery Acquired from Unmanned Aerial Vehicle. J. Remote Sens. Soc. Jpn. 2020, 40, 13–19. [Google Scholar] [CrossRef]
  44. De Castro, A.I.; Ehsani, R.; Ploetz, R.; Crane, J.H.; Abdulridha, J. Optimum Spectral and Geometric Parameters for Early Detection of Laurel Wilt Disease in Avocado. Remote Sens. Environ. 2015, 171, 33–44. [Google Scholar] [CrossRef]
Figure 1. Study area: (a) the area marked in red is the selected experimental forest area; (b) one Chinese fir tree in the experimental group was stripped of its bark; (c) the numbered trees.
Forests 14 02444 g001
Figure 2. Monthly average spectral profiles of two groups for 400–1000 nm: (a) the control group and (b) the experimental group.
Forests 14 02444 g002
Figure 3. Changes in two vegetation indices over time: p < 0.01 (**), p < 0.001 (***); (a) GRRSGI, (b) REP.
Forests 14 02444 g003
Figure 4. Hyperspectral imaging images, REP images, and GRRSGI images of three Chinese fir trees in September 2016: (a) R26 in the control group; (b) T9 in the experimental group; (c) T29 in the experimental group. The red ellipses highlight the areas where there are differences between REP image and GRRSGI image.
Forests 14 02444 g004
Figure 5. Hyperspectral imaging images of five Chinese fir trees over time: (a) R6 in the control group; (b) T6 in the experimental group; (c) T1 in the experimental group; (d) T11 in the experimental group; (e) T25 in the experimental group.
Forests 14 02444 g005
Figure 6. Five Chinese fir trees 550 nm–640 nm spectral curves over time: (a) R6 in the control group; (b) T6 in the experimental group; (c) T1 in the experimental group; (d) T11 in the experimental group; (e) T25 in the experimental group.
Forests 14 02444 g006
Table 1. Vegetation indices to monitor vegetation senescence or damage.
Vegetation IndexEquationReference
Normalized difference vegetation index (NDVI) N D V I = R N I R R r e d R N I R + R r e d Rouse et al. [23]
Green normalized difference vegetation index (GNDVI) G N D V I = R N I R R g r e e n R N I R + R g r e e n Gitelson et al. [24]
Simple ratio pigment index (SRPI) S R P I = R 430 R 680 Penuelas et al. [25]
Vegetation index green (VIgreen) V I g r e e n = R g r e e n R r e d R g r e e n + R r e d Gitelson et al. [26]
Plant senescing reflectance index (PSRI) P S R I = R 680 R 500 R 750 Merzlyak et al. [27]
Vegetation atmospherically resistant index (VARI) V A R I = R g r e e n R r e d R g r e e n + R r e d R b l u e Gitelson et al. [26]
Pigment-specific normalized difference (PSND) P S N D = R 800 R 680 R 800 + R 680 Chappelle et al. [28]
Red edge position (REP) R r e = R 670 R 780 2
R E P = 700 + 40 × R r e R 700 R 740 + R 700
Guyot & Baret [29]
Normalized with index (NWI) N D G I = R r e d R g r e e n R r e d + R g r e e n
N W I = N D G I × ( N D V I + N D G I )
Uto et al. [30]
Green–red spectral area index (GRSAI) T o t a l A r e a = k = 550 670 x k + 1 x k 1 2 × f ( x k ) G R S A I = T o t a l A r e a x 550 × 120 Kim et al. [19]
Green-to-red region spectral angle index (GRRSGI) 1 G R R S G I = cos 1 ( r 1 i = 1 n r i 2 ) Zhuo Zang et al. [20]
1 r1(r550), rn(r640), ri(r1, r2,…, rn).
Table 2. The results of bootstrapping and Mann–Whitney U tests for 11 vegetation indices.
VIsAugust 2016September 2016November 2016December 2016January 2017February 2017
pMedian Difference (95%CI)pMedian Difference (95%CI)pMedian Difference (95%CI)pMedian Difference (95%CI)pMedian Difference (95%CI)pMedian Difference (95%CI)
NDVI0.395−0.02(−0.05, 0.01)0.000 ***−0.05(−0.10, −0.02)0.037 *−0.03(−0.10, −0.02)0.008 **−0.07(−0.11, 0.00)0.004 **−0.11(−0.41, −0.04)0.000 ***−0.46(−0.50, −0.05)
GNDVI0.361−0.02(−0.06, 0.02)0.000 ***−0.10(−0.16, −0.04)0.003 **−0.06(−0.15, −0.01)0.000 ***−0.11(−0.15, −0.03)0.059−0.03(−0.09, 0.00)0.000 ***−0.08(−0.11, −0.03)
SRPI0.5360.09(−0.13, 0.22)0.000 ***−0.30(−0.37, −0.12)0.6670.28(−0.54, 0.67)0.003 **−0.15(−0.30, −0.03)0.003 **−0.23(−0.85, −0.03)0.011 *−0.43(−0.68, −0.08)
VIgreen0.5640.02(−0.11, 0.11)0.2890.03(−0.04, 0.10)0.713−0.02(−0.14, 0.14)0.5640.03(−0.07, 0.13)0.1240.10(−0.04, 0.70)0.007 **0.57(0.03, 0.67)
PSRI0.9580.00(−0.01, 0.01)0.0870.01(0.00, 0.03)0.1330.01(−0.01, 0.04)0.150.01(−0.01, 0.04)0.1650.02(−0.01, 0.35)0.004 **0.28(0.01, 0.40)
VARI0.745−0.02(−0.11, 0.12)0.189−0.01(−0.13, 0.03)0.372−0.02(−0.22, 0.15)0.383−0.04(−0.17, 0.05)0.082−0.17(−0.94, 0.03)0.024 *−0.86(−0.93, −0.09)
PSND0.35−0.02(−0.05, 0.02)0.000 ***−0.06(−0.09, −0.02)0.005 **−0.05(−0.12, 0.00)0.011 *−0.06(−0.10, −0.01)0.003 **−0.10(−0.50, −0.04)0.000 ***−0.52(−0.58, −0.09)
REP0.35−0.77(−2.23, 0.98)0.000 ***−2.41(−5.58, −0.95)0.000 ***−3.69(−5.61, −2.23)0.000 ***−5.49(−8.49, −2.44)0.000 ***−6.27(−7.68, −3.01)0.000 ***−6.38(−8.60, −3.80)
NWI0.8250.00(−0.01, 0.02)0.000 ***−0.02(−0.04, −0.01)0.002 **−0.03(−0.05, −0.01)0.027 *−0.02(−0.05, −0.01)0.002 **−0.05(−0.36, −0.01)0.001 **−0.29(−0.36, −0.03 )
GRSAI0.5080.01(−0.01, 0.02)0.014 *0.01(0.00, 0.02)0.000 ***0.01(0.00, 0.03)0.000 ***0.02(0.01, 0.05)0.000 ***0.07(0.02, 0.13)0.000 ***0.10(0.02, 0.12)
GRRSGI0.443−0.01(−0.03, 0.01)0.009 **−0.01(−0.03, 0.00)0.006 **−0.02(−0.08, 0.00)0.000 ***−0.04(−0.07, −0.02)0.000 ***−0.09(−0.15, −0.03)0.000 ***−0.13(−0.14, −0.04)
* p < 0.05, ** p < 0.01, *** p < 0.001.
Disclaimer/Publisher’s Note: The statements, opinions and data contained in all publications are solely those of the individual author(s) and contributor(s) and not of MDPI and/or the editor(s). MDPI and/or the editor(s) disclaim responsibility for any injury to people or property resulting from any ideas, methods, instructions or products referred to in the content.

