Article

Trends in Atmospheric CO2 Fertilization Effects with Stand Age Based on Tree Rings

1
Key Laboratory of Sustainable Forest Ecosystem Management-Ministry of Education, School of Forestry, Northeast Forestry University, Harbin 150040, China
2
Engineering Consulting & Design Institute, Northeast Forestry University, Harbin 150040, China
*
Authors to whom correspondence should be addressed.
Forests 2023, 14(12), 2441; https://doi.org/10.3390/f14122441
Submission received: 15 November 2023 / Revised: 10 December 2023 / Accepted: 12 December 2023 / Published: 14 December 2023
(This article belongs to the Topic Forest Carbon Sequestration and Climate Change Mitigation)

Abstract

:
The increase in global carbon emissions has intensified the effects of CO2 fertilization on the carbon cycle. CO2 fertilization is shaped by several factors, including the physiological differences among trees of varied forest ages and types, as well as the influence of different climatic conditions. It is essential to investigate the differences in CO2 fertilization effects across diverse climate zones and delve into the association between these effects and forest age and type. Such exploration will deepen our knowledge of forest responses to environmental changes. This study used annual ring width data from the International Tree-Ring Data Bank, employing the generalized additive mixed models and the Random Forest model to discern the pattern of the CO2 fertilization effect concerning forest age in the Northern Hemisphere. This study also explored the variations in the effect of CO2 fertilization across unique climate zones and the disparities among various forest types within the same climatic zone. The results indicated a link between forest age and the CO2 fertilization effect: it tends to increase in sapling forests and middle-aged forests and diminish in mature forests. Warmer, drier environments had a more marked effect of increased CO2 on tree fertilization. Additionally, coniferous forests demonstrated a more substantial CO2 fertilization effect than broadleaf forests, and deciduous needle-leaf forests surpassed evergreen needle-leaf forests in this regard. This research is pivotal in understanding the shifting patterns of CO2 fertilization effects and how forests respond to atmospheric changes.

1. Introduction

Since the industrial revolution, a significant amount of greenhouse gases (CO2, CH4, O3, etc.) enters the atmosphere because of the combustion of fossil fuels such as coal and oil and the depletion of forest resources caused by human activities [1]. The concentration of atmospheric CO2, the primary greenhouse gas, has increased from approximately 280 ppm before the start of the industrial era to more than 400 ppm currently [2]. This growing concentration of atmospheric CO2 is the primary contributor to global warming [3]. The significance of global warming has captured the attention of nations worldwide. Countries are proactively taking measures and seeking solutions to mitigate global warming, combat climate change, and protect the environment. Utilizing terrestrial ecosystems for carbon sequestration has emerged as a significant area of global research, given its effectiveness in controlling greenhouse gas emissions and reducing the greenhouse effect [4]. Over the past six decades, terrestrial ecosystem carbon sinks have accounted for more than 50% of global carbon sinks, and this trend is on the increase, helping to lessen the effects of global warming [5]. Moreover, substantial evidence emphasizes the critical role of forest ecosystems in the process of terrestrial carbon sequestration [6,7]. Some research has associated the long-term increase in the terrestrial carbon sink with elevated atmospheric CO2 levels, which might boost photosynthesis and vegetation biomass growth. This phenomenon is commonly termed the “CO2 fertilization effect” (β) [8].
In theory, atmospheric CO2 molecules can be sequestered through the process of plant photosynthesis and react with water molecules to produce carbohydrates. Therefore, the fertilization effect of increasing atmospheric CO2 concentration on vegetation growth manifests in two aspects: direct and indirect fertilization [9]. The higher concentration of CO2 in the external environment will directly increase the content of CO2 and the CO2-to-O2 ratio in the leaves of green vegetation, facilitating the carboxylation of enzymes and thus intensifying vegetation photosynthesis while inhibiting respiration, resulting in an increased net photosynthetic rate of vegetation. This is the direct fertilization effect of CO2 [10]. On the other hand, the increasing atmospheric CO2 concentration is likely to reduce the opening of leaf stomata, thereby decreasing water loss from transpiration and enhancing the water use efficiency of vegetation. This indirect effect of elevated CO2 can extend the growth cycle of seasonally dry ecosystems, potentially stimulating continuous biomass accumulation in plants, known as the indirect fertilization effect of CO2 [11]. With more than 80% of C3 plants on the global land surface still not reaching their CO2 saturation point during photosynthesis, there is optimism that rising atmospheric CO2 concentrations will further bolster global vegetation productivity [12]. The response of different plant species to increasing atmospheric CO2 concentrations during photosynthesis is also anticipated to vary significantly [13].
Forests play a pivotal role in terrestrial ecosystems, constituting 45% and 50% of biomass and productivity, respectively, and serving as a crucial component in the global carbon cycle [14]. Trees, being a significant component of forest ecosystems, encapsulate historical adaptation records to fluctuating environmental factors within their annual rings [15,16]. The annual rings represent an essential data source for detecting the effects of CO2 fertilization on tree growth [17]. Cook et al. were pioneers in analyzing the radial growth (ring width) of a tree, considering multiple factors such as internal stand disturbances, external disturbances, age-related factors, and climatic and atmospheric changes [18]. Among these, researchers postulated that stand-internal disturbances (e.g., stand windows created by downed trees) only affected a few trees around a downed tree at a specific moment. Subsequent averaging treatments mitigated this effect, provided sample sizes were sufficient. Conversely, external disturbances within the stand (e.g., forest fires, pests, diseases, and other disturbances) can be minimized by pre-selecting sample sites that are less disturbed. This allows for the detection of atmospheric CO2 fertilization effects by eliminating interference from factors such as age in the tree annual rings’ information. Tree whorl width is a concentric whorl structure formed by seasonal alternation in the process of inward differentiation of the tree formation layer, containing long-term climatic signals of various environmental factors and nonclimatic signals of the tree’s growth and development, as well as internal disturbances [19]. Therefore, before reconstructing or predicting climate change using ring width sequences, age-related growth trends should be eliminated to maximize the retention of climate information [20]. Currently, many scholars have utilized tree annual rings’ data under natural conditions to analyze the fertilization signal of atmospheric CO2, presenting various perspectives. According to the theory of the fertilizing effect of atmospheric CO2, numerous scholars have substantiated this hypothesis through various methods in different regions, utilizing data on the width of naturally growing trees’ annual rings [21,22,23]. However, some studies have concluded that under natural conditions, the increase of atmospheric CO2 concentration promotes only tree growth in specific regions (arid and semi-arid areas) or certain tree species [24,25]. By contrast, other studies have examined tree rings and deduced that at certain high latitudes, due to low temperatures and the limiting effect of atmospheric nitrogen deposition, the effect of elevated CO2 concentrations on tree growth is minimal and challenging to detect [26]. Furthermore, it is plausible that atmospheric CO2 concentrations have yet to reach the threshold for a fertilization effect, suggesting that increases in atmospheric CO2 concentrations may not directly or indirectly enhance tree biomass growth [27].
In summary, the notable surge in CO2 levels since the Industrial Revolution has, to some extent, influenced the radial growth of trees. However, current research using tree ring data to quantify the effects of atmospheric CO2 fertilization faces challenges and disagreements. To accurately assess the influence of rising atmospheric CO2 on the growth of tree annual rings, it is important to examine the relationship with forest age and perform a comparative analysis of the variations in CO2 fertilization effects among distinct climatic zones and forest categories. The resulting data will improve the understanding of not only the influence of the fertilizing effect of atmospheric CO2 on the radial growth of trees, possibly providing scientific evidence but also the mechanism underlying forests’ response to atmospheric changes to enrich our perspectives on the global carbon cycle based on the annual rings of trees. Consequently, the carbon sequestration ability of forests can be improved. This study aimed to (1) minimize the influence of age on radial tree growth using optimal statistical techniques, while preserving the low-frequency signal of the atmospheric CO2 fertilization effect to the greatest extent possible, (2) accurately quantify the atmospheric CO2 fertilization effect, (3) investigate the association between forest age and the atmospheric CO2 fertilization effect and compare the differences in this effect across various climate zones and forest types.

2. Materials and Methods

2.1. Annual Cycle Data

The annual tree ring data used in this study were sourced from the International Tree-Ring Data Bank (ITRDB). Currently, the ITRDB is the largest global database for tree rings, providing an open and freely accessible platform for both uploading and accessing data. Maintenance of the ITRDB has been overseen by NOAA and the World Data Center for Paleoclimatology since 1990. The ITRDB documents chronologies dating back to 6000 BC for all continents (excluding Antarctica due to the lack of trees), covering more than 4000 locations and spanning 226 species [28]. The ITRDB contains a variety of tree ring metadata, including width data, density data, stable isotope data, and other types. However, because each contributed dataset in the ITRDB might not have undergone rigorous verification, there are instances of formatting errors, unreadable files, and missing data. This study enhances database utility by downloading and organizing data from Zhao and the Global Annual Rotation Database (https://www.ncdc.noaa.gov/paleo/study/25570) (accessed on 10 May 2022) [28]. Due to the limited data distribution in the southern hemisphere, this study primarily focuses on the northern hemisphere, as illustrated in Figure 1.

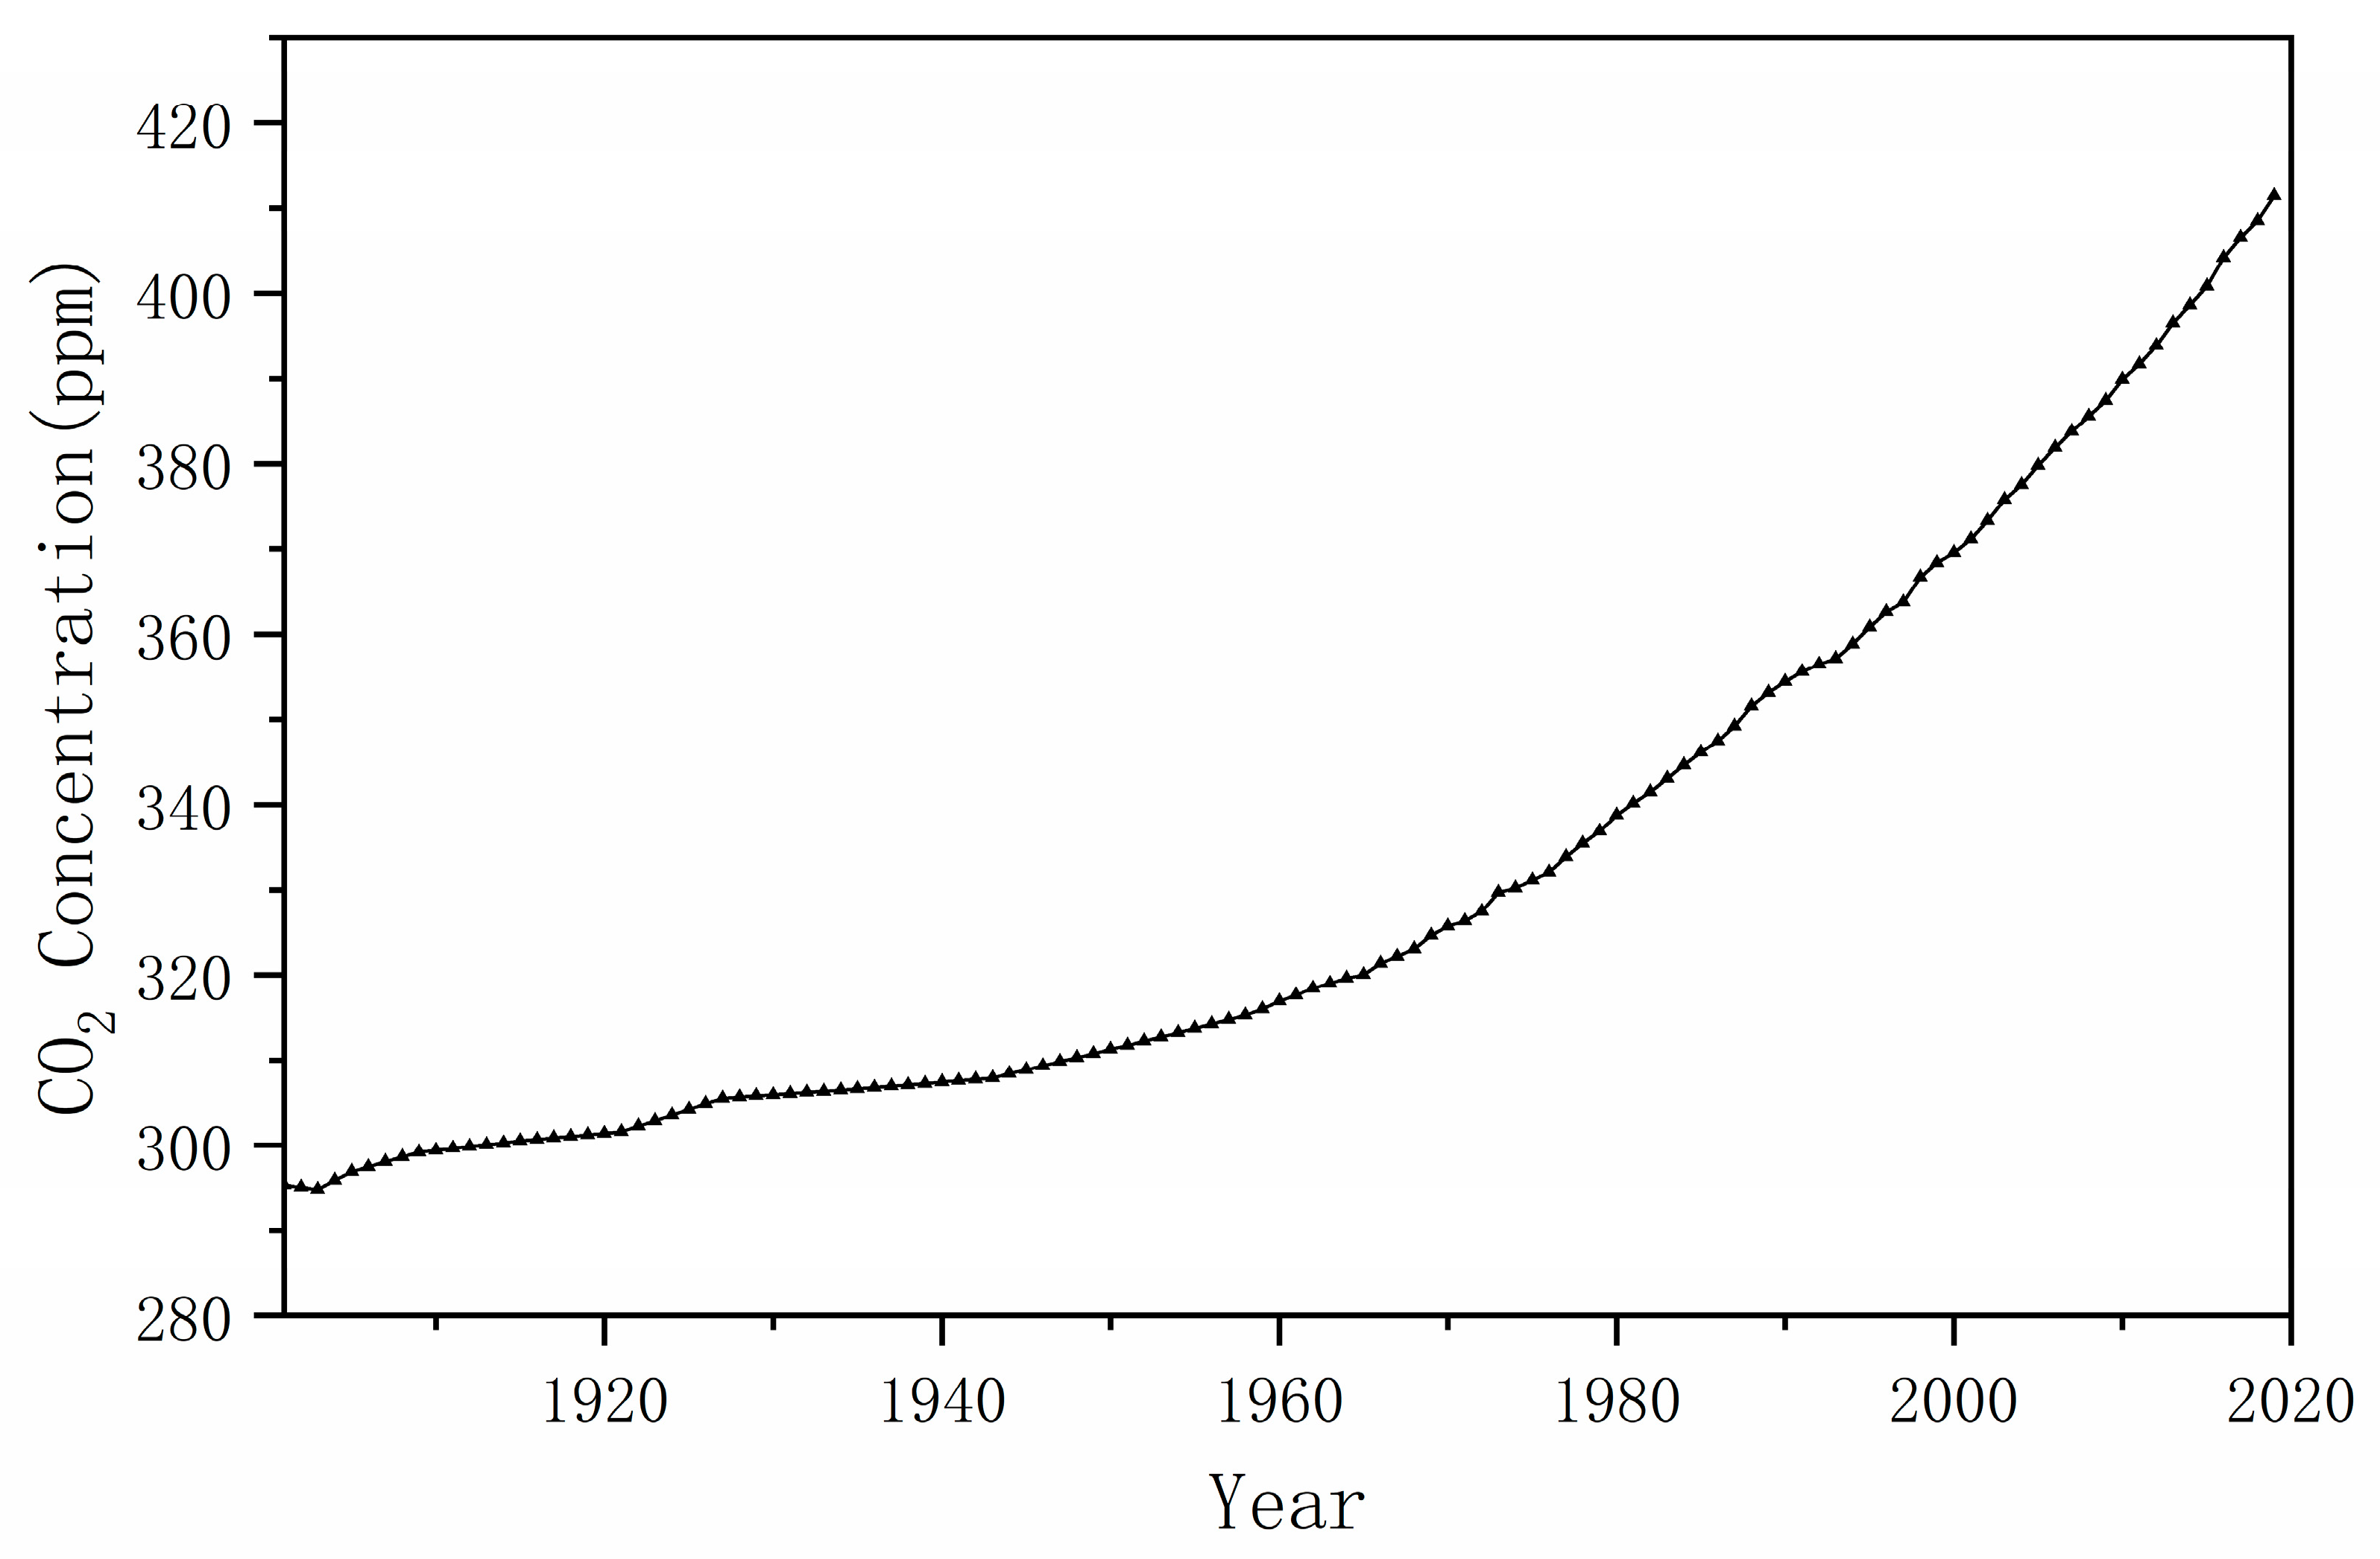
2.2. Atmospheric CO2 Concentration Data

The study utilizes atmospheric CO2 concentration data from 1901 to 1957, derived from the ice core CO2 historical record [29]. Data from 1958 to 2020 are sourced from the Mauna Loa Observatory in Hawaii, USA, and are measured in parts per million (https://www.esrl.noaa.gov/gmd/ccgg/trends/data.html) (accessed on 20 June 2022) [30,31]. The change in atmospheric CO2 concentration from 1901 to 2020 is shown in Figure 2.

2.3. Climate Data

The climate data for this research were obtained from the National Center for Atmospheric Sciences CRU TS (version 4.0.5) [32]. The study employs monthly mean temperature (TMP), monthly total precipitation (PRE), monthly water vapor pressure (VAP), and monthly water vapor pressure difference (VPD) as its primary data sources. The monthly VPD was calculated by subtracting the monthly saturated water vapor pressure (SVP) from the monthly VAP. The method for determining the monthly VPD was further explained through the provided formula. Equations (1)–(4).
V P D = S V P V A P
S V P = 6.112 f w e   17.67 T m e a n T m e a n + 243.5  
f w = 1 + 7 10 4 + 3.46 10 6 P m s t
P m s t = P m s l T m e a n + 273.16 T a + 273.16 + 0.0065 Z 5.625  
where Tmean represents the mean temperature, Pmst denotes the sea-level pressure, Pmsl refers to the mean sea-level pressure (1013.25 hPa), and Z denotes the altitude.

2.4. Atmospheric Nitrogen Deposition Data

The global atmospheric nitrogen deposition (Ndep) data are sourced from CMIP6 driver data with a spatial resolution of 0.5° [33]. This dataset was generated using the NCAR-CCMI-2-0 model, which allows for a more accurate assessment of the effects of Ndep changes on forest carbon sequestration. Data from the historical Ndep database (1850–2014) cover the period 1901–2014, while data from the future Ndep database (2015–2100) cover the period 2015–2020.

2.5. Koppen Climate Type Data

Climate type data were sourced from the Koppen Climate Classification dataset (http://www.gloh2o.org/koppen/) (accessed on 10 July 2022), published by Princeton University in 2018 [34]. The globe is divided into five climate zones: A (Tropical), B (Arid), C (Temperate), D (Continental), and E (Polar). These divisions are based on two metrics: temperature and precipitation, as depicted in Figure 3.

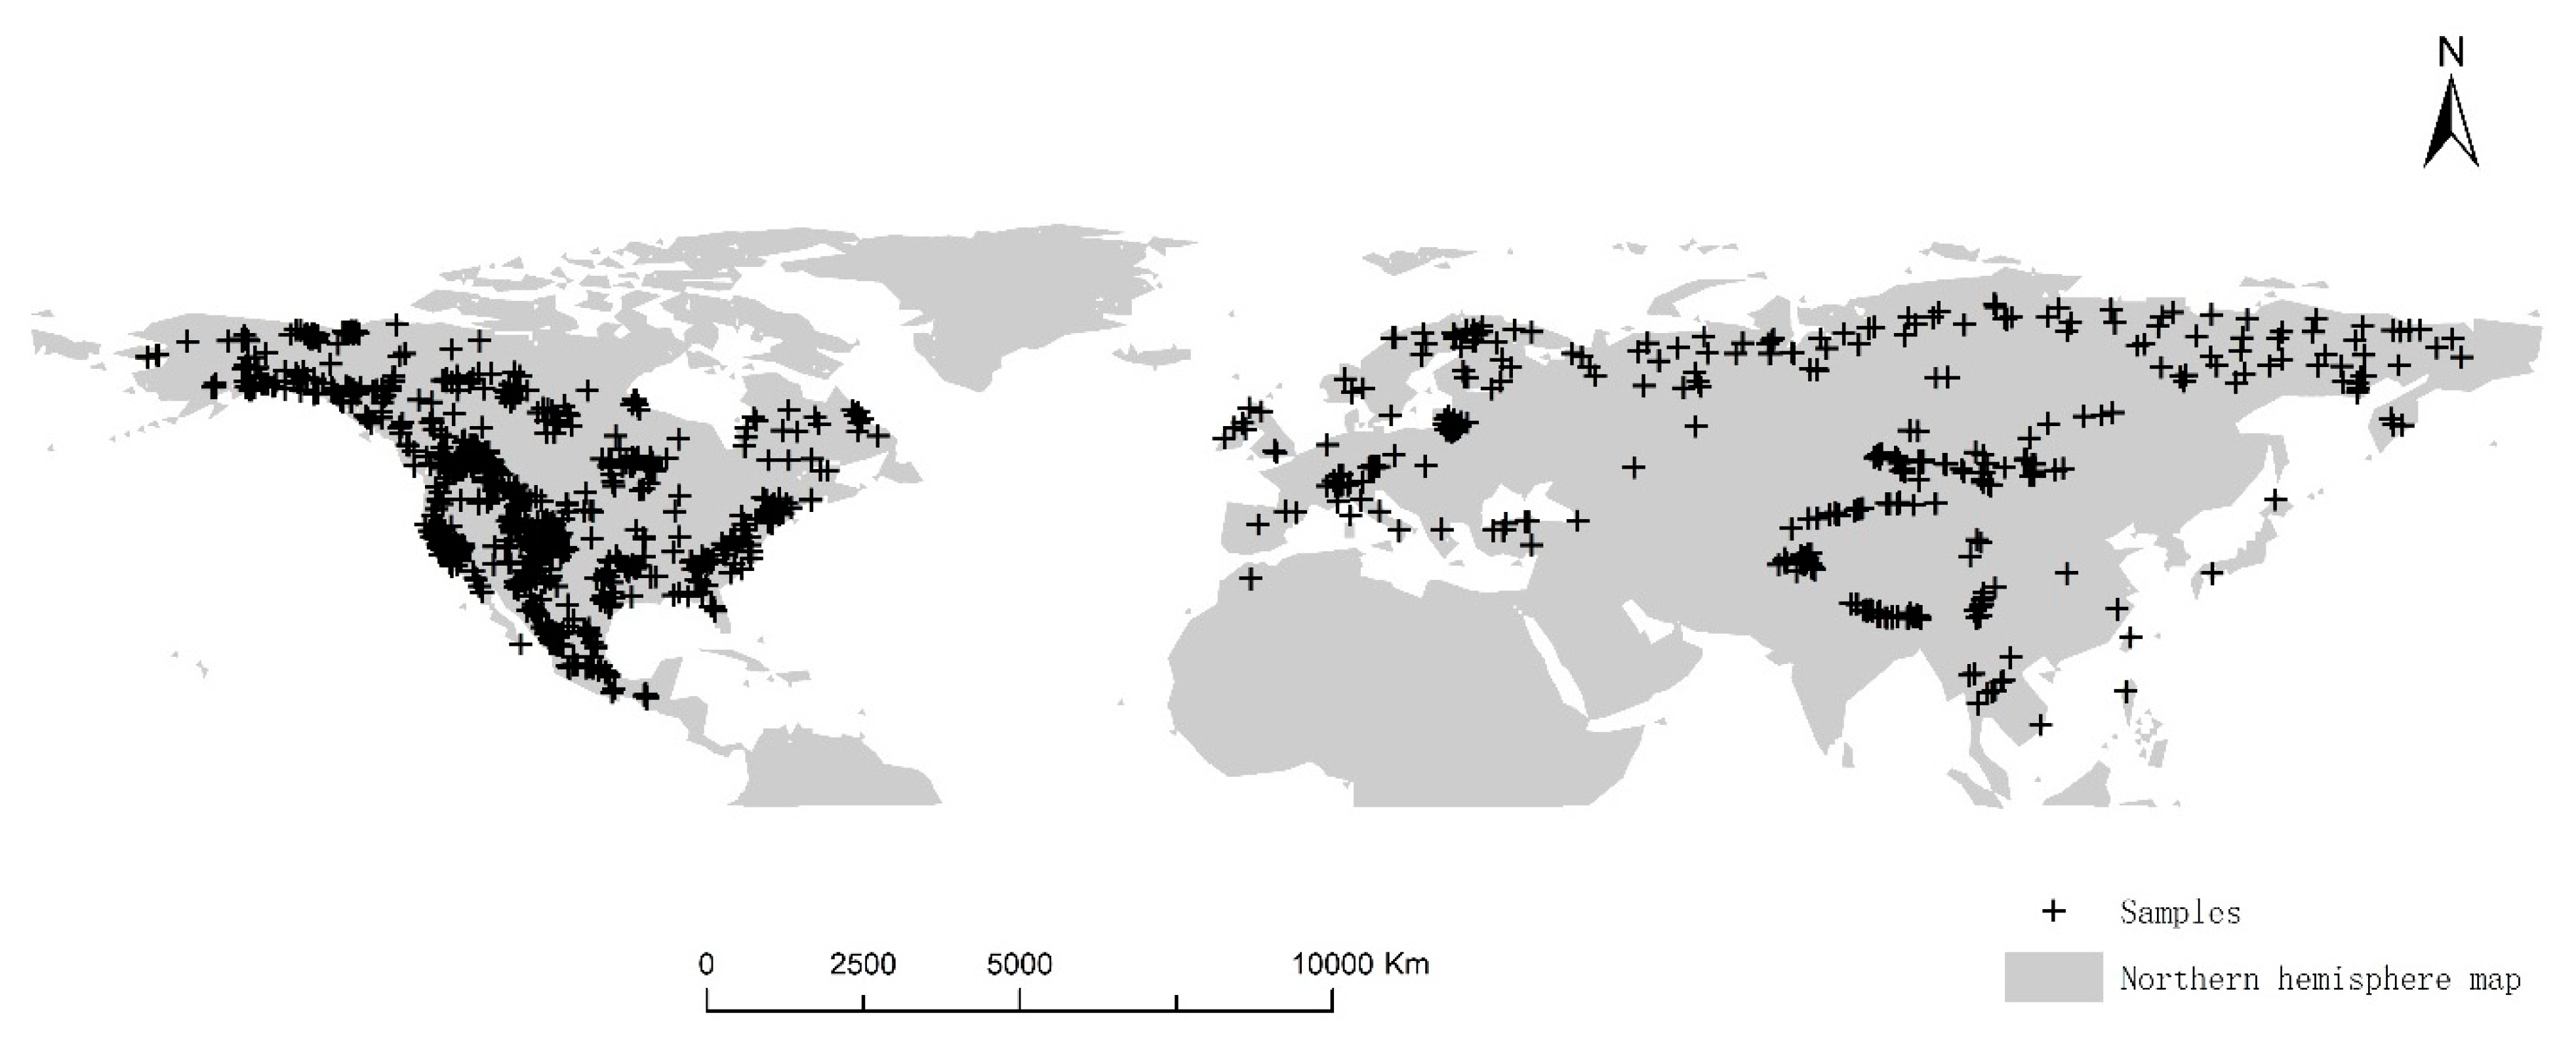
2.6. Data Processing

For this study, the downloaded chronology data were specifically extracted for chronologies above the latitude of 0°N and for stands concluding after the year 1902. Chronologies not meeting these criteria were excluded. The final sample number and plant count for each climatic zone are detailed in Table 1.
The removal of the growth trend associated with tree age is crucial for examining the effects of atmospheric CO2 and other climatic factors on tree radial growth. Hence, this study employed the GAMMs model to mitigate the influence of a tree’s age and diameter at breast height (DBH) on its radial growth. This model has been shown to better preserve low-frequency signals, such as atmospheric CO2 fertilization effects, compared with other detrending methods (e.g., linear, negative exponential, etc.). The initial step involved converting tree annual ring width data to basal area increment (BAI) using Equation (5).
B A I = π R t 2 π R t 1 2
where BAI represents the incremental cross-sectional area of the trunk, and Rt and Rt−1 denote the cumulative sum of annual ring widths from tree growth up to year t and year t − 1, respectively.
The skewed distribution of BAI required a logarithmic transformation. Subsequently, the effects of age and DBH on BAI were fitted using the GAMM model for each sample plot. In the GAMMs model, each tree was modeled and analyzed individually. Chest diameter (DBH) and age of the tree formation layer (age) were treated as fixed effects, while tree number was viewed as a random effect. This model is represented by Equation (6).
ln B A I i , t + 1 = s D B H i , t + s A g e i , t + Z i , t B i , t + v i , t + ε i , t
where the symbol i denotes the tree number, t represents the year, ZB is the random effect, and v is the error term with a first-order autoregressive structure. The term ε signifies the residual term, and s is the smoothing function. In this context, the smoothing function employed is the cubic spline smoothing function. This study utilizes the gamm function from the mgcv package in the R language to model each sample of the annual cycle individually.
In this study, the reconstruction of BAI_res and the estimation of β were achieved using the Random Forest algorithm in machine learning. β is commonly used as a metric to gauge changes in vegetation productivity due to elevated atmospheric CO2 concentrations, signifying the magnitude of the CO2 fertilization effect. For the purpose of this research, BAI_res, the fractional area growth after eliminating the age trend, served as the observed variable. Influential factors, including the mean temperature (Tmean), total precipitation (Pre), VPD, and atmospheric nitrogen deposition (Ndep) in summer (June–September), were selected. Additionally, winter (December–February) precipitation and the temperature of the prior year’s growing season (June–September) were integrated as influencing variables. BAI_res data for each global sample site was individually reconstructed for the study period spanning 1902–2020.
This study employed two scenarios to reconstruct the historical observation variable BAI_res, focusing on shifts in atmospheric CO2 concentration. The first scenario accounted for genuine changes in all drivers over time, while the second scenario held the atmospheric CO2 concentration constant at 1901 levels, permitting other drivers to undergo real-time changes. For example, the 1902 BAI_res was rebuilt, as shown in Equations (7)–(8).
Scenario 1:
B A I r e s 1902 ~ C O 2 1902 + T m e a n 1902 + P r e 1902 + V P D 1902 + N d p e 1902
Scenario 2:
B A I r e s 1902 ~ C O 2 1901 + T m e a n 1902 + P r e 1902 + V P D 1902 + N d p e 1902
The BAI_res for subsequent years was reconstructed following the same methodology. The variance between estimates yielded by the Random Forest algorithm simulation in both scenarios was leveraged to determine the fitting of the β-value, as shown in Equation (9).
B A I r e s = β C O 2 + ε  
where ΔBAI_res indicates the difference between estimated values of the observed variables, modeled using the Random Forest algorithm, across different CO2 concentration scenarios. β represents the response of BAI_res to the rise in atmospheric CO2.
Trees aged 1–150 years were chosen to ascertain the β value associated with each tree’s age. The average β value for each sampling point was derived by averaging the β values of trees of the same age within that point. With this approach, trends of β in relation to stand age in diverse climatic zones were established. For a comparative analysis, regions B (arid), C (temperate), and D (continental) with substantial sample sizes were selected. Trends of β concerning stand age for various tree species within these climatic zones were studied. In this research, the relationship between β and stand age was mapped through nonlinear regression, as shown in Equation (10).
β t r e e = a 1 + b a g e c d 1 e a g e c  
where a, b, c, and d are nonlinear regression model coefficients.

3. Results

3.1. Generalized Additive Mixed Model Results

To explore the correlation between tree annual rings, atmospheric CO2, and other climatic factors, it is crucial to adjust the original tree rings to account for age-related patterns. This study assessed the significance of the nonparametric terms in the GAMMs model across each climate zone. The trend of tree BAI was analyzed by fitting it with tree age and DBH across sample plots in five distinct climate zones using the GAMMs model. The analysis revealed that all p-values were less than 0.01 (Table 2), pointing to a significant effect of both tree age and DBH on BAI. Concurrently, the adjusted coefficient of determination (R2) for the GAMMs model ranged between 0.75 and 0.93 for each sample point, indicating the model’s effectiveness in capturing the influence of tree age on BAI.
The biased residual plots of BAI against tree age for the five climate zones are provided in Figure 4. The figure demonstrates that the influence of tree age on the increment of BAI in all five zones follows a similar pattern: BAI increment decreases as tree age rises. The sharpest drop in the incremental trunk fracture area occurred between 0 and 60 years of tree age, after which the trend slowly stabilized.

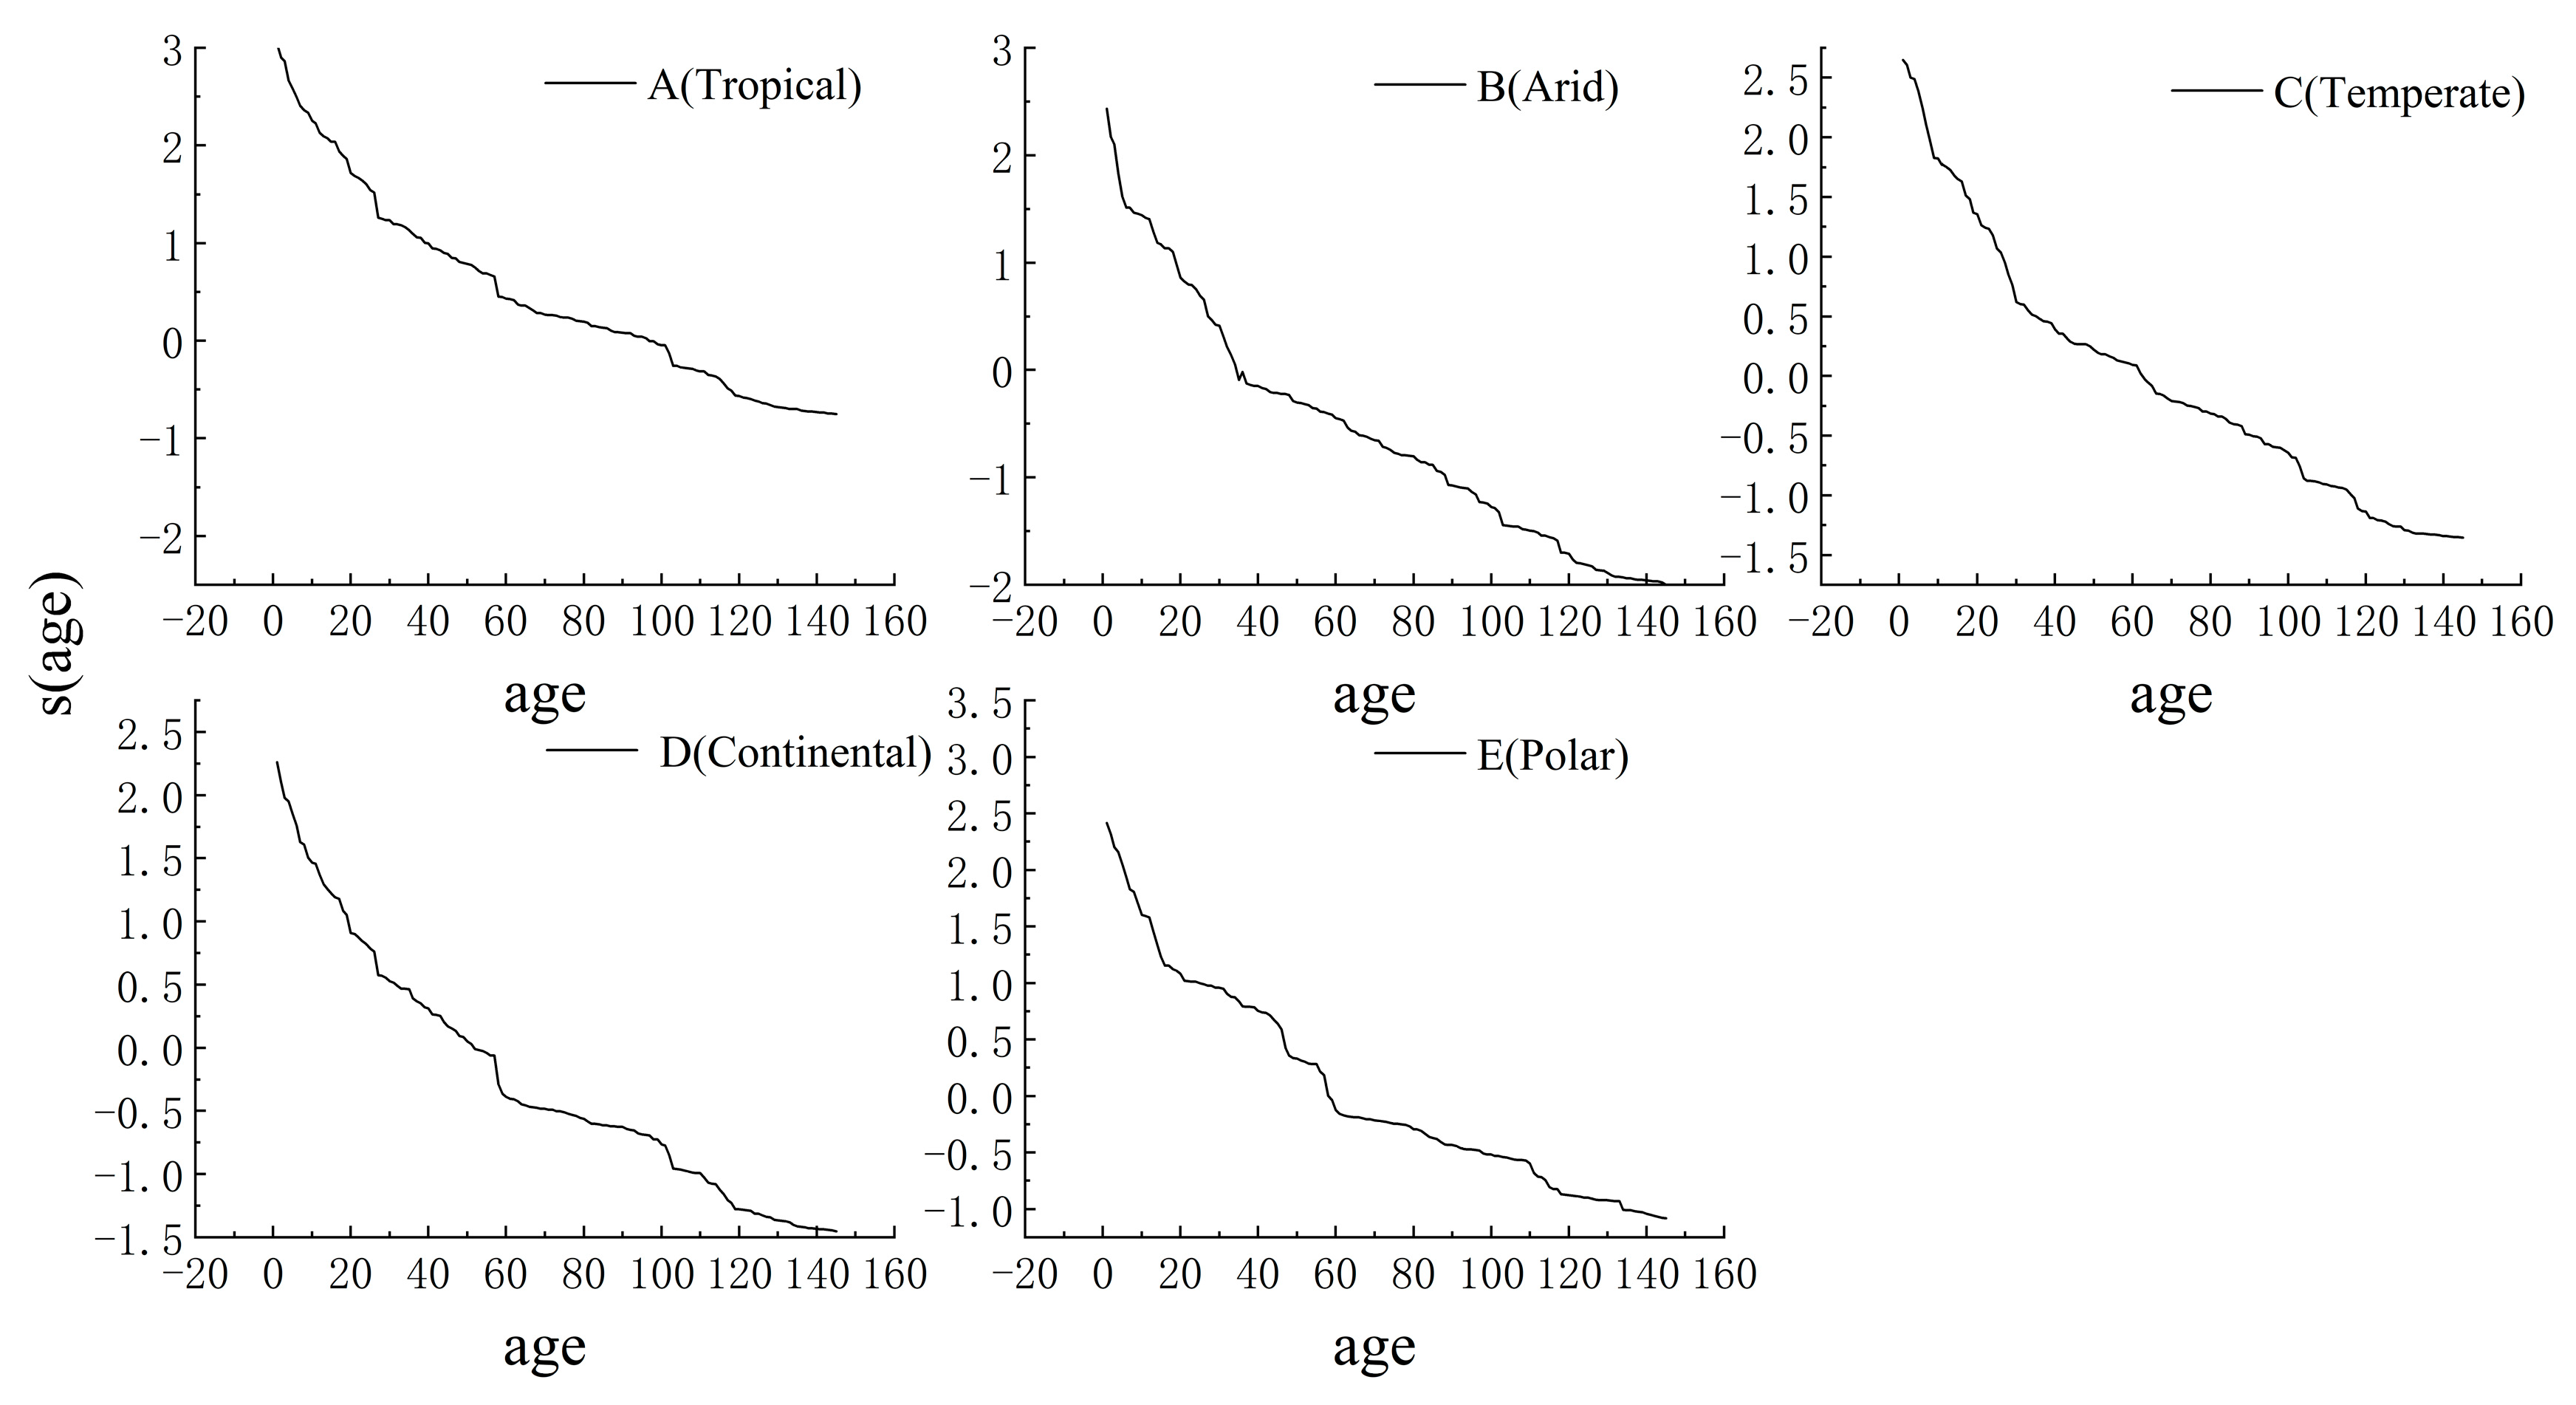
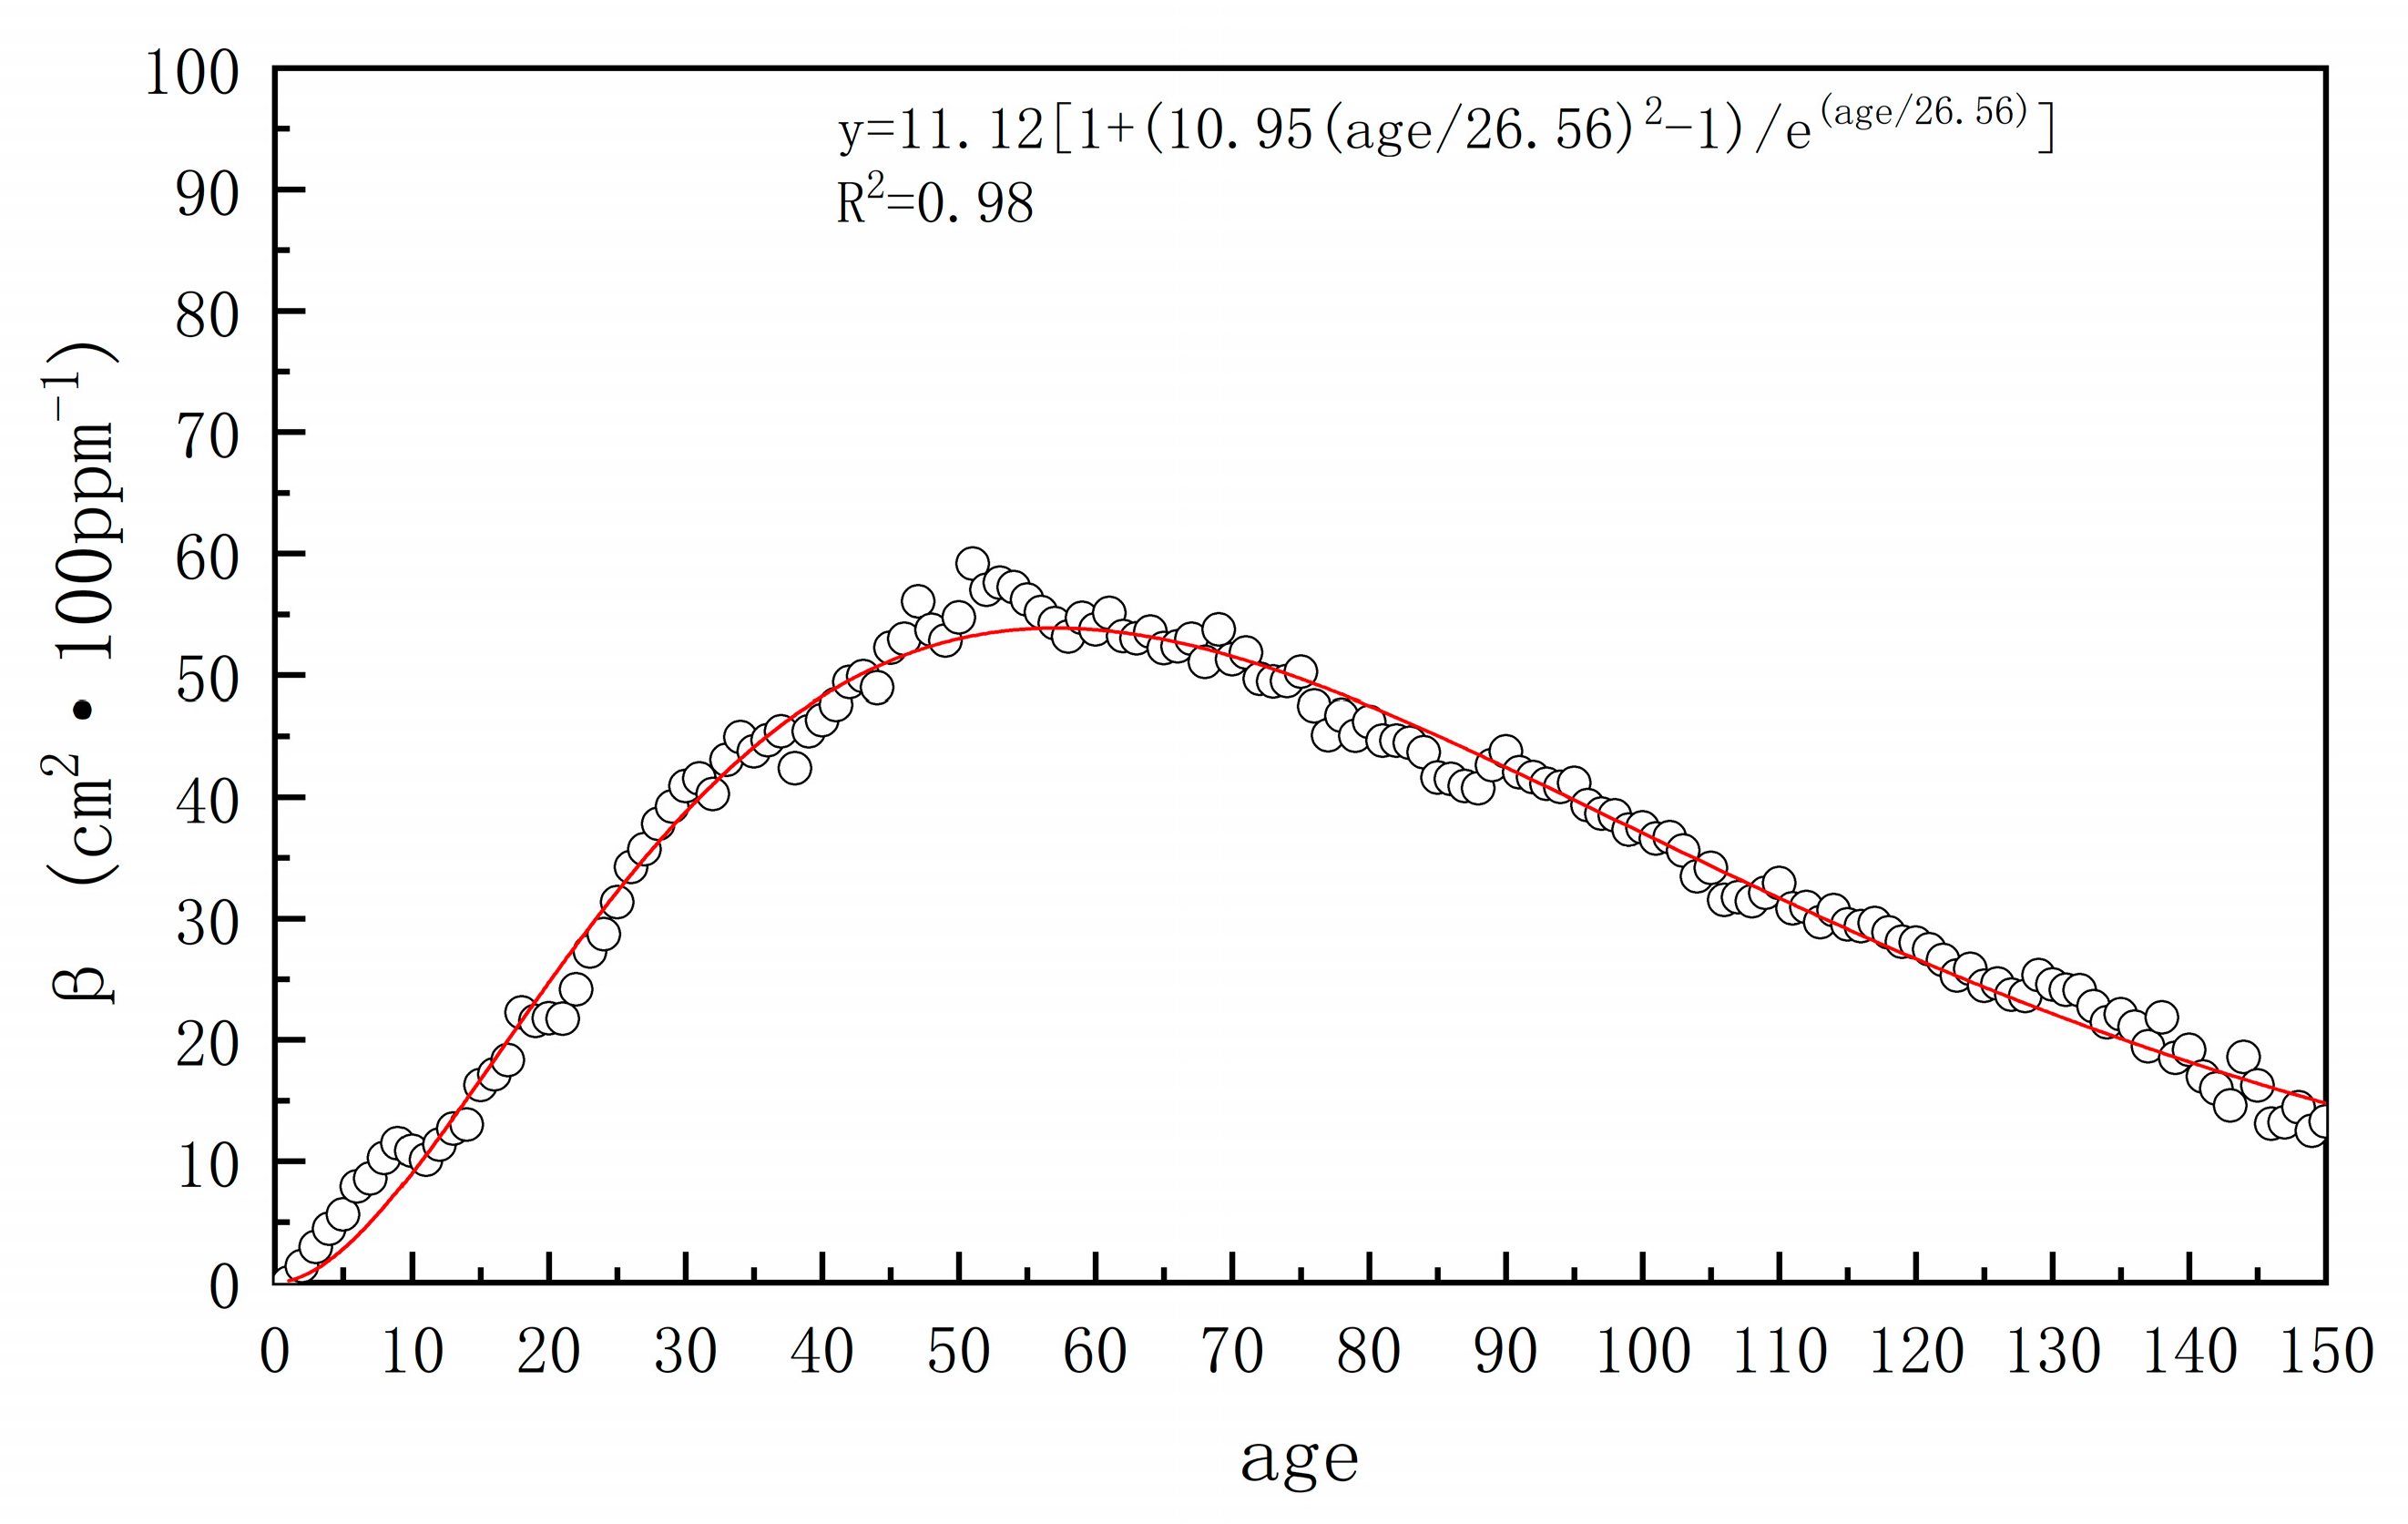
3.2. Trends in CO2 Fertilization Effects with Stand Age

Research findings indicate that the average atmospheric CO2 fertilization effect on trees aged 1–150 years in the Northern Hemisphere shows a steady rise during early growth stages, slowing down in middle age. It peaks at a value of 53.85 cm2·100 ppm−1 at the age of 50 years and then declines annually as trees mature (Figure 5).

3.3. Differences in the Effects of CO2 Fertilization in Different Climatic Zones

The study revealed that the CO2 fertilization effect of trees exhibited a consistent pattern of an initial increase and a subsequent decrease across various climatic zones as the stand age increased (Figure 6). However, the rate of increase in the CO2 fertilization effect and the strength of the response varied across different climatic zones.
The effect of CO2 fertilization on trees across different climatic zones is ranked as follows: A (tropical) > C (temperate) > B (arid) > D (continental) > E (polar). Trees in the A (tropical) zone experience the most pronounced CO2 effect, peaking at 48 years (βA = 156.58 cm100 ppm−1). When comparing trees in the B (arid) and C (temperate) regions, no significant difference was observed during the ascending stage, with both reaching maximum growth at 45 years (βB = 84.44 cm2·100 ppm−1, βC = 89.22 cm2·100 ppm−1). During the declining stage, as tree age increased, the β value of B (arid) declined more significantly than that of the C (temperate). Compared with B (arid) and C (temperate) regions, trees in the D (continental) region exhibited a lower intensity of response to CO2 fertilization, peaking at 54 years (βD = 48.23 cm2·100 ppm−1), but ultimately aligning with the values of the B (arid) region as trees matured. Trees in the E (polar) zone showed the mildest response, peaking at 50 years (βE= 32.88 cm2·100 ppm−1) and gradually declined annually after that. Table 3 presents results from fitting the model parameters for the various climate zones.

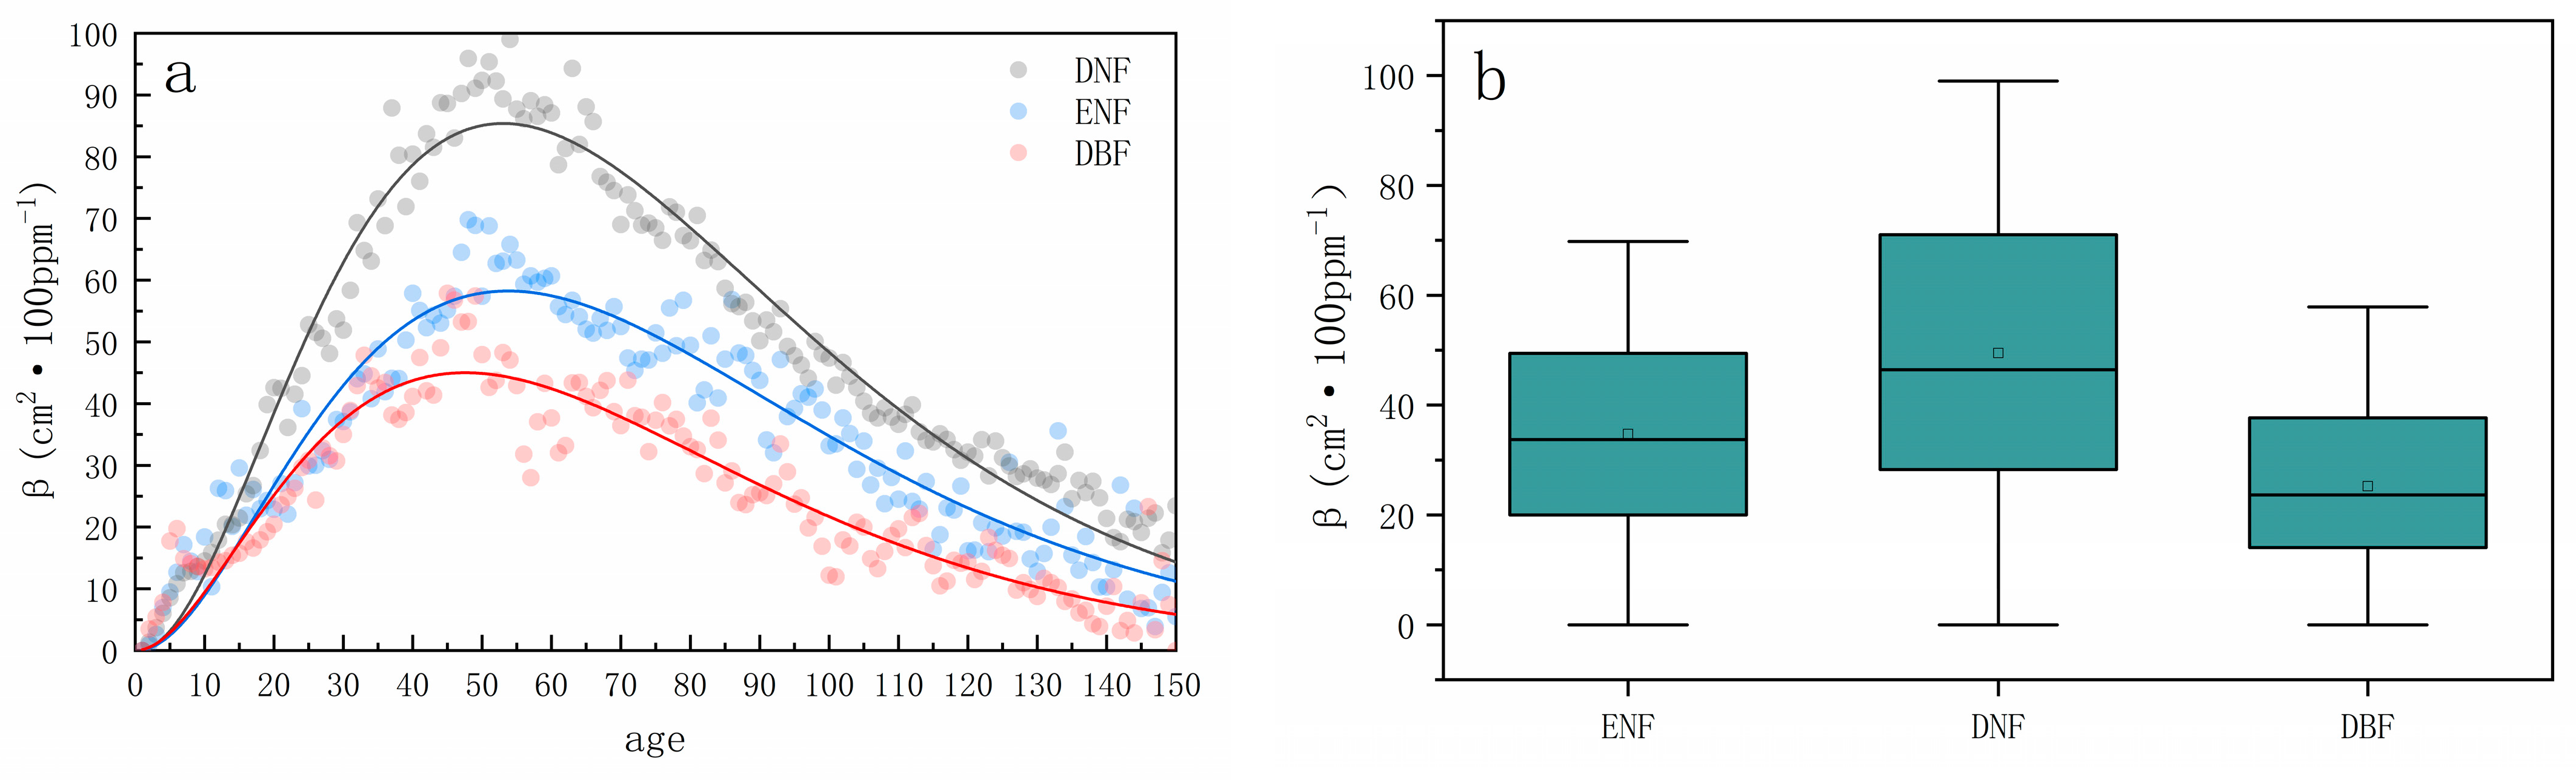
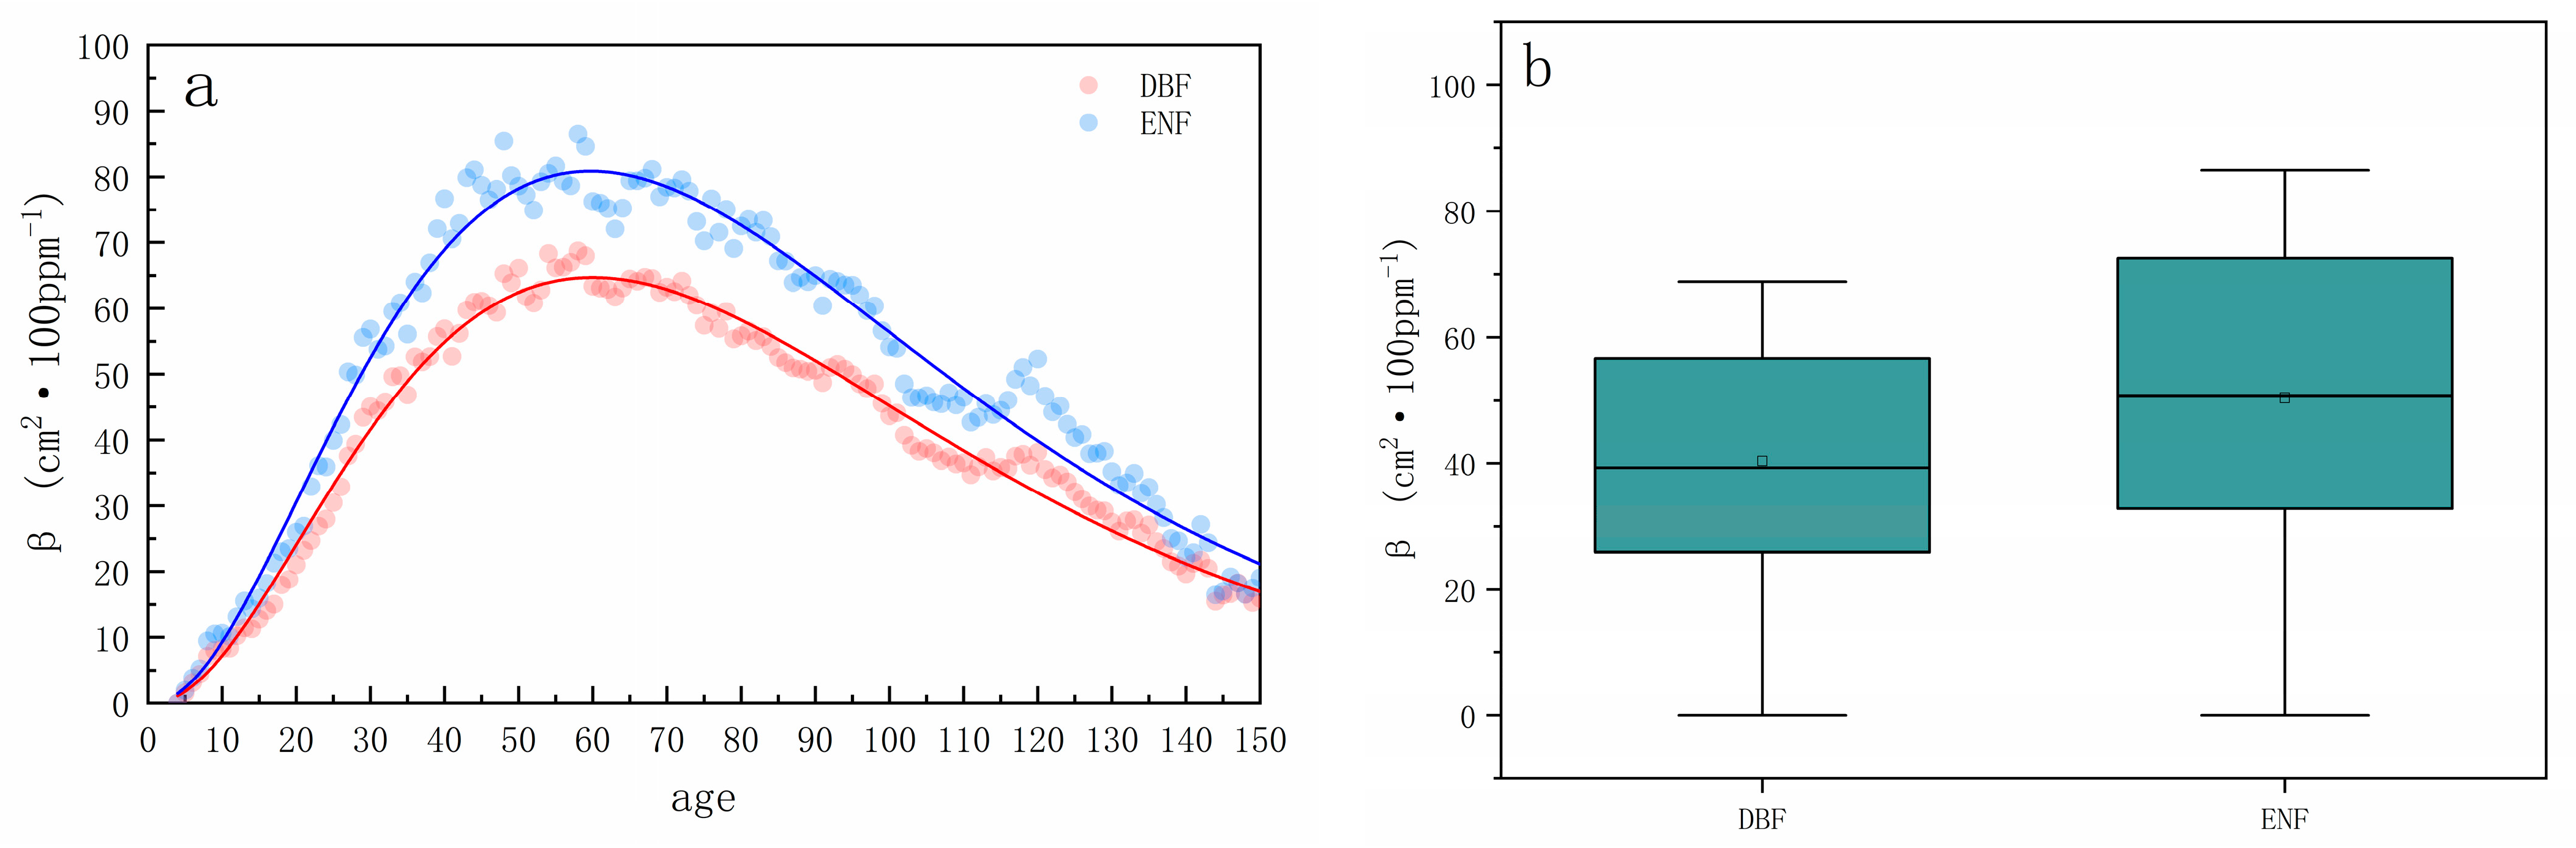
3.4. Differences in CO2 Fertilization Effects across Forest Types

To investigate the response of various stand types to CO2 fertilization, three climatic zones were chosen: B (arid), C (temperate), and D (continental). The selection ensured adequate sample sizes for each zone. The B (arid) region includes three distinct forest types: evergreen needle-leaved forest (ENF), deciduous needle-leaf forest (DNF), and deciduous broad-leaved forest (DBF). The C (temperate) region features two forest types: ENF and DBF. The D (continental) region encompasses the same three distinct types of forests: ENF, DNF, and DBF.
In the B (arid) region, the effects of CO2 fertilization on various stand types rank as follows: DNF > ENF > DBF. The DNF reached its peak value at the age of 53 years (βDNF = 85.35 cm2·100 ppm−1), the ENF peaked at the age of 52 years (βENF = 58.48 cm2·100 ppm−1), and the DBF peaked at the age of 47 years (βDBF = 45.77 cm2·100 ppm−1) (Figure 7).
For the C (temperate) region, the effect of CO2 fertilization on various stand types is ENF > DBF. The ENF peaked at the age of 55 years (βENF = 93.11 cm2·100 ppm−1), and the DBF peaked at the of age 53 years (βDBF = 51.58 cm2·100 ppm−1) (Figure 8).
In the D (continental) region, the ranking of CO2 fertilization effects is: DNF > ENF > DBF. The DNF peaked at the age of 50 years (βDNF = 71.13 cm100 ppm−1), the ENF peaked at the age of 57 years (βENF = 53.84 cm2·100 ppm−1), and the DBF peaked at the age of 50 years (βDBF = 45.98 cm2·100 ppm−1) (Figure 9).
Across all examined climate zones, needle-leaf forests demonstrated a more pronounced CO2 fertilization effect compared to broad-leaved forests. Additionally, the CO2 fertilization effects were more distinct in deciduous forests than in evergreen ones. Table 4 presents the results of model parameter fitting for different stand types.
Figure 7. Trends in CO2 fertilization effect with stand age for different forest types in the B (arid) region (a). Comparison of CO2 fertilization for different forest types in the B (arid) region. Boxes represent the interquartile range of the β values (solid lines represent medians, and empty rectangles represent the average value). The upper and lower extension lines extend to 1.5 times the interquartile spacing (b).
Forests 14 02441 g007
Figure 8. Trends in CO2 fertilization effect with forest age for different forest types in the C (temperate) region (a). Comparison of CO2 fertilization for different forest types in the C (temperate) region. Boxes represent the interquartile range of the β values (solid lines represent medians, and empty rectangles represent the average value). The upper and lower extension lines extend to 1.5 times the interquartile spacing (b).
Forests 14 02441 g008
Figure 9. Trends in CO2 fertilization effect with forest age for different forest types in the D (continental) region (a). Comparison of CO2 fertilization for different forest types in the D (continental) region. Boxes represent the interquartile range of the β values (solid lines represent medians, and empty rectangles represent the average value). The upper and lower extension lines extend to 1.5 times the interquartile spacing (b).
Forests 14 02441 g009
Table 4. Fitting results of model parameters for different forest types.
Climatic ZoneStand TypeParametersR2SSERMSERF
abcd
B (Arid)ENF11.2011.5323.422.260.963492.394.89146
DNF9.699.9224.962.150.894747.055.70146
DBF9.448.6423.452.030.873797.775.10146
ENF13.7512.5227.931.990.964287.935.42146
C (Temperate)DBF10.019.4227.722.040.97725.732.23146
ENF11.4112.1830.351.670.885610.836.20146
D (Continental)DNF13.2913.6033.011.390.702244.2512.40146
DBF10.6711.5434.431.550.932024.993.72146

4. Discussion

The examination of annual tree rings in the northern hemisphere revealed a pattern in the impact of CO2 fertilization on trees. This effect was most pronounced during the sapling forest phase, peaked in the middle-aged forest stage, and gradually diminished with the trees’ age. When comparing tree responses to increasing atmospheric CO2 concentrations across various climatic zones, distinct variations were observed. The A (tropical) region demonstrated the most significant effect, followed by the B (arid) and C (temperate) regions, with an average effect in the D (continental) region, and the weakest effect in the E (polar) region. Furthermore, the fertilization effect of atmospheric CO2 varied among different stand types within the same climatic zones. Needle-leaved forests exhibited a more substantial effect than broad-leaved forests, with deciduous needle-leaf forests displaying the highest CO2 fertilization effect, while the lowest effect was observed in deciduous broad-leaved forests.
The substrate for plant photosynthesis is atmospheric CO2; therefore, an increase in atmospheric CO2 concentration directly enhances the rate of plant photosynthesis by facilitating greater CO2 uptake [35,36]. Elevated concentrations of atmospheric CO2 prompt stomatal closure, leading to reduced water evaporation and improved water utilization [11,37,38]. This, in turn, extends the growing season in seasonally arid ecosystems, promoting the accumulation of plant biomass [39,40]. In this study, we consider the combined effect of several factors, encompassing not only the direct impact of carbon dioxide on photosynthesis but also the indirect effects resulting from increased temperatures.
The Investigation into tree annual rings in the northern hemisphere revealed that the effect of CO2 fertilization on trees peaks during the middle-aged forest stage. It becomes more pronounced during the sapling forest phase and then slowly diminishes as the trees age. The study indicates that while young trees can help offset atmospheric CO2 concentrations, this ability lessens as they mature. Various CO2 enrichment experiments have demonstrated that elevated CO2 levels significantly influence juvenile trees or seedlings. In high CO2 environments, seedlings or young trees often grow faster than their mature counterparts. This rapid growth is due to young trees having a greater ability for photosynthesis [40,41,42,43]. Elevated CO2 levels promote photosynthesis, increase nutrient uptake and utilization efficiency, and thus support faster growth and development[44]. At the same time, research indicates that higher CO2 levels notably enhance water use efficiency in trees during their early growth stage and promote increased biomass [22]. Trees in sapling and middle-aged forest stages are more sensitive to increased atmospheric CO2 concentrations [9,22]. However, as trees grow older, they face greater nutrient and water constraints [41,45,46,47]. Elevated concentrations of CO2 [48,49,50] can exacerbate these limitations, reducing the benefits of CO2 fertilization [51,52,53]. Some studies suggest that tree growth might adapt to these higher CO2 concentrations over time [54].
Comparing the response of trees to increasing atmospheric CO2 levels across different climatic regions, we noted variations in the CO2 fertilization effect. The A (tropical) region displayed the most noticeable effect, followed by the B (arid) and C (temperate) regions with even more pronounced effects, while the D (continental) region exhibited an average effect, and the E (polar) region showed the least discernible effect. The factors contributing to this outcome are as follows: Firstly, analyzing from the perspective of temperature. When examining the interaction between increasing CO2 concentrations and temperature, researchers found that the potential carbon uptake lost to photorespiration increases as temperature rises [55]. The influence of CO2 concentration on plant growth affects both leaf photosynthesis and overall plant respiration [56]. As dark respiration depends on temperature, increased temperatures amplify plant respiration rates. This, in turn, reduces the plant’s carbohydrate content, limiting respiration and stunting growth [55,57]. Nevertheless, some studies suggest that the CO2 fertilization effect is negligible in tropical regions or has a minimal effect on tree growth in the tropics [17,58]; this finding diverges from the current study, potentially due to the limited number of sampling locations in tropical areas, uneven distribution causing an incomplete representation of the climatic zone, and variances in the tree species studied. In high-CO2 environments, upregulation of photosynthesis produces extra carbohydrates, which can meet the increased energy demand for respiration in warmer conditions [54]. Low temperatures might hamper carboxylase activity, offsetting the effects of rising atmospheric CO2 levels on plant growth [59,60]. Trees in subtropical regions, characterized by warmer and wetter conditions, experience a more pronounced CO2 fertilization effect, which diminishes in cooler temperatures. Secondly, taking into account the water-use efficiency. With higher atmospheric CO2 concentrations, trees under drought stress might benefit from increased water-use efficiency, helping to alleviate drought effects and postpone the decrease in photosynthesis due to stomatal closure [61]. This allows for a prolonged growing season [25]. Several studies emphasize that in dry ecosystems, raised CO2 levels can enhance water use efficiency, subsequently increasing plant biomass [39,42,48,49,62]. Ecosystems in warm, somewhat dry regions with adequate nitrogen supply might show the most significant responsiveness to CO2 [9]. Elevated CO2 concentrations’ most noticeable effect on tree radial growth appears in areas with the most limited water resources, as confirmed by research [50]. The collective findings from these studies consistently highlight a more noticeable CO2 fertilization effect on trees in dry areas.
Regarding different forest stand types, the study unveiled a more prominent CO2 fertilization effect in needle-leaved forests compared to broad-leaved forests. According to a study, the distinct physiological and ecological traits of needle-leaved forests and broad-leaved forests result in heightened water utilization in needle-leaf forests compared with their broad-leaved counterparts [63]. Simultaneously, the higher leaf build-up efficiency of needle-leaved forests leads to the ability to induce faster and stronger growth of LAI when stimulated by CO2 growth, subsequently resulting in enhanced photosynthesis in needle-leaf forests [64,65]. All indications point to a more pronounced atmospheric CO2 fertilization effect in needle-leaved forests than in broad-leaved forests under identical environmental conditions. This study found that the CO2 fertilization effect was more pronounced in deciduous needle-leaf forests than in evergreen needle-leaf forests in both B (arid) and D (continental) regions. The radial growth of both coniferous and deciduous trees peaks a few weeks after needle lengthening, largely relying on assimilates from the current year [66,67]. Conversely, evergreen conifers begin radial growth before needle development, drawing on stored carbon [68]. deciduous needle-leaf forests have shown more efficient utilization of carbon in the current year. The effects of climate change on photosynthesis are more detrimental to evergreen species more than deciduous species [69,70,71,72]. With global warming, deciduous needle-leaf forests demonstrate stronger photosynthetic activity than that in evergreen needle-leaf forests.
This study leverages the existing international tree ring database in the northern hemisphere to conduct a comprehensive analysis of the relationship between forest age changes and the atmospheric CO2 fertilization effect. Additionally, it explores changes in different climatic zones and forest types, contributing to our understanding of future carbon sink dynamics. However, some limitations still need to be acknowledged. (1) A multitude of studies have demonstrated that elevated carbon dioxide concentrations hasten the senescence of trees and reduce their turnover times [73,74]. However, due to a lack of sufficient data, these variables were not taken into account in this research. Consequently, this study solely represents the average response of individual trees to carbon dioxide across different climate zones and forest types and should not be taken as indicative of entire forest ecosystems. In future research, we intend to collect additional data to enable a more thorough discussion and analysis. (2) Due to limited data available in the ITRDB regarding broad-leaf forests, a comparison between broad-leaf deciduous forests and broad-leaf evergreen forests was not feasible. Gathering more extensive data in the future is imperative to evaluate the effect of CO2 fertilization on various stand types.

5. Conclusions

This study utilizes the ITRDB to examine the correlation between the CO2 fertilization effect and forest age. It aimed to compare variations in the CO2 fertilization effect across diverse climatic zones and stand types. The results of the study are as follows: (a) The effect of CO2 fertilization increases with forest age, showing an ascending pattern from sapling forests to middle-aged forests. However, this effect declines as the trees mature. Notably, young forests exhibit a higher CO2 fertilization effect than their older counterparts. (b) The effect of trees on CO2 fertilization is more pronounced in warm and arid environments. (c) Coniferous forests display a greater CO2 fertilization effect than broad-leaf forests. Additionally, deciduous needle-leaf forests have a more pronounced CO2 fertilization effect than evergreen needle-leaf forests. The findings suggest that younger trees have the potential to significantly mitigate the increase in atmospheric CO2 levels. Moreover, trees in hotter and drier climates show a heightened response to increased CO2 concentrations, enhancing their ability to offset carbon emissions. Conifer species have a superior ability to mitigate carbon emissions in comparison to broad-leaved species. This research broadens the global carbon cycle perspective through the analysis of tree annual rings and investigates the response of forests to escalating CO2 levels.

Author Contributions

Conceptualization, Y.C., B.W. and M.L.; Formal analysis, Y.C. and X.K.; Investigation, Y.C., X.K. and S.B.; Methodology, Y.C.; Project administration, B.W. and M.L.; Resources, B.W. and M.L.; Supervision, B.W. and M.L.; Validation, B.W.; Visualization, Y.C.; Writing—original draft, Y.C.; Writing—review and editing, B.W. All authors have read and agreed to the published version of the manuscript.

Funding

This research was funded by the National Key Research and Development Program of China, 2020YFC1511603-1; The Fundamental Research Funds for the Central Universities, 418 2572022DT03; Carbon neutrality special scientific Foundation project, HFW220100054; China Longjiang Forest Industry Group Subsidized scientific and technological projects, HFW230100074.

Data Availability Statement

The data presented in this study are openly available in [NOAA web repository] at [https://www.ncdc.noaa.gov/paleo/study/25570], reference number [28].

Conflicts of Interest

The authors declare that they have no known competing financial interest or personal relationships that could have appeared to influence the work reported in this paper.

References

  1. MacCracken, M.C. Prospects for Future Climate Change and the Reasons for Early Action. J. Air Waste Manag. Assoc. 2008, 58, 735–786. [Google Scholar] [CrossRef] [PubMed]
  2. Friedlingstein, P.; O’Sullivan, M.; Jones, M.W.; Andrew, R.M.; Luke, G.; Hauck, J.; Le Corinne, Q.; Luijkx, I.T.; Olsen, A.; Peters, G.P.; et al. Global Carbon Budget 2022. Earth Syst. Sci. Data 2022, 14, 4811–4900. [Google Scholar] [CrossRef]
  3. He, M.; Piao, S.; Huntingford, C.; Xu, H.; Wang, X.; Bastos, A.; Cui, J.; Gasser, T. Amplified warming from physiological responses to carbon dioxide reduces the potential of vegetation for climate change mitigation. Commun. Earth Environ. 2022, 3, 160. [Google Scholar] [CrossRef]
  4. Gifford, L. See the Carbon through the Trees: Market-Based Climate Change Mitigation, Forest Carbon Offsets and the Uneven Power of Carbon Accounting. Ph.D. Thesis, University of Colorado, Boulder, CO, USA, 2018. [Google Scholar]
  5. Yue, C.; Ciais, P.; Cadule, P.; Thonicke, K.; van Leeuwen, T.T. Modelling the role of fires in the terrestrial carbon balance by incorporating SPITFIRE into the global vegetation model ORCHIDEE—Part 2: Carbon emissions and the role of fires in the global carbon balance. Geosci. Model Dev. 2015, 8, 1321–1338. [Google Scholar] [CrossRef]
  6. Gampe, D.; Zscheischler, J.; Reichstein, M.; O’Sullivan, M.; Smith, W.K.; Sitch, S.; Buermann, W. Increasing impact of warm droughts on northern ecosystem productivity over recent decades. Nat. Clim. Change 2021, 11, 772–779. [Google Scholar] [CrossRef]
  7. Piao, S.; Sitch, S.; Ciais, P.; Friedlingstein, P.; Peylin, P.; Wang, X.; Ahlström, A.; Anav, A.; Canadell, J.G.; Cong, N. Evaluation of terrestrial carbon cycle models for their response to climate variability and to CO2 trends. Glob. Change Biol. 2013, 19, 2117–2132. [Google Scholar] [CrossRef] [PubMed]
  8. Bacastow, R.; Keeling, C.D. Atmospheric carbon dioxide and radiocarbon in the natural carbon cycle: II. Changes from AD 1700 to 2070 as deduced from a geochemical model. In Proceedings of the Brookhaven Symposia in Biology, Upton, NY, USA, 16–18 May 1972; pp. 86–135. [Google Scholar]
  9. Huang, J.-G.; Bergeron, Y.; Denneler, B.; Berninger, F.; Tardif, J. Response of forest trees to increased atmospheric CO2. Crit. Rev. Plant Sci. 2007, 26, 265–283. [Google Scholar] [CrossRef]
  10. Bazzaz, F.A. The response of natural ecosystems to the rising global CO2 levels. Annu. Rev. Ecol. Syst. 1990, 21, 167–196. [Google Scholar] [CrossRef]
  11. Field, C.B.; Jackson, R.B.; Mooney, H.A. Stomatal responses to increased CO2: Implications from the plant to the global scale. Plant Cell Environ. 1995, 18, 1214–1225. [Google Scholar] [CrossRef]
  12. Norby, R.J.; Zak, D.R. Ecological lessons from free-air CO2 enrichment (FACE) experiments. Annu. Rev. Ecol. Evol. Syst. 2011, 42, 181–203. [Google Scholar] [CrossRef]
  13. Jiang, G.; Qu, C. Photosynthetic response of six woody species to elevated CO2, in quercus liaotungensis forest in the beijing mountainous areas. Chin. J. Plant Ecol. 2000, 24, 204–208. [Google Scholar]
  14. Li, Z.; Chen, W.; Wei, J.; Keyimu, M.; Zhang, Y.; Zhang, S.; Wang, X. Tree-ring growth responses of Liaodong Oak (Quercus wutaishanica) to climate in the Beijing Dongling Mountain of China. Acta Ecol. Sin. 2021, 41, 27–37. [Google Scholar]
  15. Babst, F.; Alexander, M.R.; Szejner, P.; Bouriaud, O.; Klesse, S.; Roden, J.; Ciais, P.; Poulter, B.; Frank, D.; Moore, D.J. A tree-ring perspective on the terrestrial carbon cycle. Oecologia 2014, 176, 307–322. [Google Scholar] [CrossRef] [PubMed]
  16. Fritts, H. Tree Rings and Climate; Elsevier: Amsterdam, The Netherlands, 2012. [Google Scholar]
  17. Battipaglia, G.; Zalloni, E.; Castaldi, S.; Marzaioli, F.; Cazzolla-Gatti, R.; Lasserre, B.; Tognetti, R.; Marchetti, M.; Valentini, R.J. Long tree-ring chronologies provide evidence of recent tree growth decrease in a central African tropical forest. PLoS ONE 2015, 10, e0120962. [Google Scholar] [CrossRef] [PubMed]
  18. Cook, E.R.; Peters, K. The smoothing spline: A new approach to standardizing forest interior tree-ring width series for dendroclimatic studies. Tree-Ring Bull. 1981, 41, 45–53. [Google Scholar]
  19. Biondi, F.; Qeadan, F.J. A theory-driven approach to tree-ring standardization: Defining the biological trend from expected basal area increment. Tree-Ring Res. 2008, 64, 81–96. [Google Scholar] [CrossRef]
  20. Wu, X.; Shao, X. Status of dendroclimatological study and its prospects in China. Adv. Earth Sci. 1993, 8, 31–35. [Google Scholar]
  21. Chen, Z.; Zhang, X.; He, X.; Davi, N.K.; Li, L.; Bai, X. Response of radial growth to warming and CO2 enrichment in southern Northeast China: A case of Pinus tabulaeformis. Clim. Change 2015, 130, 559–571. [Google Scholar] [CrossRef]
  22. Geoff Wang, G.; Chhin, S.; Bauerle, W.L. Effect of natural atmospheric CO2 fertilization suggested by open-grown white spruce in a dry environment. Glob. Change Biol. 2006, 12, 601–610. [Google Scholar] [CrossRef]
  23. Huang, J.-G.; Zhang, Q.-B. Tree rings and climate for the last 680 years in Wulan area of northeastern Qinghai-Tibetan Plateau. Clim. Change 2007, 80, 369–377. [Google Scholar] [CrossRef]
  24. Graybill, D.A.; Idso, S.B. Detecting the aerial fertilization effect of atmospheric CO2 enrichment in tree-ring chronologies. Glob. Biogeochem. Cycles 1993, 7, 81–95. [Google Scholar] [CrossRef]
  25. Knapp, P.A.; Soulé, P.T.; Grissino-Mayer, H.D. Detecting potential regional effects of increased atmospheric CO2 on growth rates of western juniper. Glob. Change Biol. 2001, 7, 903–917. [Google Scholar] [CrossRef]
  26. Schweingruber, F.; Briffa, K.; Nogler, P. A tree-ring densitometric transect from Alaska to Labrador: Comparison of ring-width and maximum-latewood-density chronologies in the conifer belt of northern North America. Int. J. Biometeorol. 1993, 37, 151–169. [Google Scholar] [CrossRef]
  27. Girardin, M.P.; Bernier, P.Y.; Raulier, F.; Tardif, J.C.; Conciatori, F.; Guo, X.J. Testing for a CO2 fertilization effect on growth of Canadian boreal forests. J. Geophys. Res. Biogeosci. 2011, 116, G01012. [Google Scholar] [CrossRef]
  28. Zhao, S.; Pederson, N.; D’Orangeville, L.; HilleRisLambers, J.; Boose, E.; Penone, C.; Bauer, B.; Jiang, Y.; Manzanedo, R.D. The International Tree-Ring Data Bank (ITRDB) revisited: Data availability and global ecological representativity. J. Biogeogr. 2019, 46, 355–368. [Google Scholar] [CrossRef]
  29. Neftel, A.; Friedli, H.; Moor, E.; Lötscher, H.; Oeschger, H.; Siegenthaler, U.; Stauffer, B.J.T. Historical carbon dioxide record from the Siple Station ice core. J. Geophys. Res. Atmos. 1994, 93, 92093-0444. [Google Scholar]
  30. Girardin, M.P.; Bouriaud, O.; Hogg, E.H.; Kurz, W.; Zimmermann, N.E.; Metsaranta, J.M.; de Jong, R.; Frank, D.C.; Esper, J.; Büntgen, U. No growth stimulation of Canada’s boreal forest under half-century of combined warming and CO2 fertilization. Proc. Natl. Acad. Sci. USA 2016, 113, E8406–E8414. [Google Scholar] [CrossRef] [PubMed]
  31. Wang, S.; Zhang, Y.; Ju, W.; Chen, J.M.; Ciais, P.; Cescatti, A.; Sardans, J.; Janssens, I.A.; Wu, M.; Berry, J.A. Recent global decline of CO2 fertilization effects on vegetation photosynthesis. Science 2020, 370, 1295–1300. [Google Scholar] [CrossRef]
  32. Climatic Research Unit, Met Office. CRU TS Version 4.05. Available online: https://crudata.uea.ac.uk/cru/data/hrg/cru_ts_4.05/ (accessed on 20 June 2022).
  33. Hegglin, M.; Kinnison, D.; Lamarque, J.-F. CCMI nitrogen surface fluxes in support of CMIP6—Version 2.0. Version 20160706. Earth Syst. Grid Fed. Available online: https://www.wdc-climate.de/ui/cmip6?input=input4MIPs.CMIP6.CMIP.NCAR.NCAR-CCMI-2-0 (accessed on 20 June 2022).
  34. Beck, H.E.; Zimmermann, N.E.; McVicar, T.R.; Vergopolan, N.; Berg, A.; Wood, E.F. Present and future Köppen-Geiger climate classification maps at 1-km resolution. Sci. Data 2018, 5, 180214. [Google Scholar] [CrossRef]
  35. Amthor, J.S. Terrestrial higher-plant response to increasing atmospheric [CO2] in relation to the global carbon cycle. Glob. Change Biol. 1995, 1, 243–274. [Google Scholar] [CrossRef]
  36. Arp, W. Effects of source-sink relations on photosynthetic acclimation to elevated CO2. Plant Cell Environ. 1991, 14, 869–875. [Google Scholar] [CrossRef]
  37. Bowes, G. Facing the inevitable: Plants and increasing atmospheric CO2. Annu. Rev. Plant Physiol. Plant Mol. Biol. 1993, 44, 309–332. [Google Scholar] [CrossRef]
  38. Farquhar, G.D.; Ehleringer, J.R.; Hubick, K.T. Carbon isotope discrimination and photosynthesis. Annu. Rev. Plant Physiol. Plant Mol. Biol. 1989, 40, 503–537. [Google Scholar] [CrossRef]
  39. Ceulemans, R.; Mousseau, M. Tansley Review No. 71 Effects of elevated atmospheric CO2 on woody plants. New Phytol. 1994, 127, 425–446. [Google Scholar] [CrossRef]
  40. Saxe, H.; Ellsworth, D.S.; Heath, J. Tree and forest functioning in an enriched CO2 atmosphere. New Phytol. 1998, 139, 395–436. [Google Scholar] [CrossRef]
  41. Körner, C. Plant CO2 responses: An issue of definition, time and resource supply. New Phytol. 2006, 172, 393–411. [Google Scholar] [CrossRef] [PubMed]
  42. Norby, R.J.; Wullschleger, S.D.; Gunderson, C.A.; Johnson, D.W.; Ceulemans, R. Tree responses to rising CO2 in field experiments: Implications for the future forest. Plant Cell Environ. 1999, 22, 683–714. [Google Scholar] [CrossRef]
  43. Wang, X. Effects of species richness and elevated carbon dioxide on biomass accumulation: A synthesis using meta-analysis. Oecologia 2007, 152, 595–605. [Google Scholar] [CrossRef]
  44. Ryan, M.G.; Binkley, D.; Fownes, J.H. Age-related decline in forest productivity: Pattern and process. Adv. Ecol. Res. 1997, 27, 213–262. [Google Scholar]
  45. Ellsworth, D.S.; Anderson, I.C.; Crous, K.Y.; Cooke, J.; Drake, J.E.; Gherlenda, A.N.; Gimeno, T.E.; Macdonald, C.A.; Medlyn, B.E.; Powell, J.R. Elevated CO2 does not increase eucalypt forest productivity on a low-phosphorus soil. Nat. Commun. 2017, 7, 279–282. [Google Scholar] [CrossRef]
  46. Oren, R.; Ellsworth, D.S.; Johnsen, K.H.; Phillips, N.; Ewers, B.E.; Maier, C.; Schäfer, K.V.; McCarthy, H.; Hendrey, G.; McNulty, S.G. Soil fertility limits carbon sequestration by forest ecosystems in a CO2-enriched atmosphere. Nature 2001, 411, 469–472. [Google Scholar] [CrossRef]
  47. Sigurdsson, B.D.; Medhurst, J.L.; Wallin, G.; Eggertsson, O.; Linder, S.J. Growth of mature boreal Norway spruce was not affected by elevated [CO2] and/or air temperature unless nutrient availability was improved. Tree Physiol. 2013, 33, 1192–1205. [Google Scholar] [CrossRef]
  48. Lloyd, J.; Farquhar, G. The CO2 dependence of photosynthesis, plant growth responses to elevated atmospheric CO2 concentrations and their interaction with soil nutrient status. I. General principles and forest ecosystems. Funct. Ecol. 1996, 10, 4–32. [Google Scholar] [CrossRef]
  49. Schlesinger, W.H.; Lichter, J. Limited carbon storage in soil and litter of experimental forest plots under increased atmospheric CO2. Nature 2001, 411, 466–469. [Google Scholar] [CrossRef] [PubMed]
  50. Soulé, P.T.; Knapp, P.A. Radial growth rate increases in naturally occurring ponderosa pine trees: A late-20th century CO2 fertilization effect? Glob. Change Biol. 2006, 171, 379–390. [Google Scholar] [CrossRef] [PubMed]
  51. Cotrufo, M.F.; Ineson, P.; Scott, A. Elevated CO2 reduces the nitrogen concentration of plant tissues. Glob. Change Biol. 1998, 4, 43–54. [Google Scholar] [CrossRef]
  52. Luo, Y.; Su, B.; Currie, W.S.; Dukes, J.S.; Finzi, A.; Hartwig, U.; Hungate, B.; McMurtrie, R.E.; Oren, R.; Parton, W.J. Progressive nitrogen limitation of ecosystem responses to rising atmospheric carbon dioxide. BioScience 2004, 54, 731–739. [Google Scholar] [CrossRef]
  53. Norby, R.J.; Warren, J.M.; Iversen, C.M.; Medlyn, B.E.; McMurtrie, R.E. CO2 enhancement of forest productivity constrained by limited nitrogen availability. Proc. Natl. Acad. Sci. USA 2010, 107, 19368–19373. [Google Scholar] [CrossRef] [PubMed]
  54. Loehle, C. Anomalous responses of plants to CO2 enrichment. Oikos 1995, 73, 181–187. [Google Scholar] [CrossRef]
  55. Long, S. Modification of the response of photosynthetic productivity to rising temperature by atmospheric CO2 concentrations: Has its importance been underestimated? Plant Cell Environ. 1991, 14, 729–739. [Google Scholar] [CrossRef]
  56. Desjardins, R.; Gifford, R.; Nilson, T.; Greenwood, E.; Gifford, R. Interaction of carbon dioxide with growth-limiting environmental factors in vegetation productivity: Implications for the global carbon cycle. In Advances in Bioclimatology; Springer: Berlin/Heidelberg, Germany, 1992; pp. 24–58. [Google Scholar]
  57. Rowland-Bamford, A.; Baker, J.; Allen, L., Jr.; Bowes, G. Interactions of CO2 enrichment and temperature on carbohydrate accumulation and partitioning in rice. Environ. Exp. Bot. 1996, 36, 111–124. [Google Scholar] [CrossRef]
  58. Van Der Sleen, P.; Groenendijk, P.; Vlam, M.; Anten, N.P.; Boom, A.; Bongers, F.; Pons, T.L.; Terburg, G.; Zuidema, P.A. No growth stimulation of tropical trees by 150 years of CO2 fertilization but water-use efficiency increased. Nat. Geosci. 2015, 8, 24–28. [Google Scholar] [CrossRef]
  59. Hendrickson, L.; Ball, M.; Wood, J.; Chow, W.; Furbank, R.T. Low temperature effects on photosynthesis and growth of grapevine. Plant Cell Environ. 2004, 27, 795–809. [Google Scholar] [CrossRef]
  60. Sage, R.F.; Kubien, D.S. The temperature response of C3 and C4 photosynthesis. Plant Cell Environ. 2007, 30, 1086–1106. [Google Scholar] [CrossRef] [PubMed]
  61. Owensby, C.E.; Ham, J.M.; Knapp, A.K.; Auen, L.M. Biomass production and species composition change in a tallgrass prairie ecosystem after long-term exposure to elevated atmospheric CO2. Glob. Change Biol. 1999, 5, 497–506. [Google Scholar] [CrossRef]
  62. Curtis, P.S.; Wang, X. A meta-analysis of elevated CO2 effects on woody plant mass, form, and physiology. Oecologia 1998, 113, 299–313. [Google Scholar] [CrossRef] [PubMed]
  63. Li, X.; Piao, S.; Wang, K.; Wang, X.; Wang, T.; Ciais, P.; Chen, A.; Lian, X.; Peng, S.; Peñuelas, J.; et al. Temporal trade-off between gymnosperm resistance and resilience increases forest sensitivity to extreme drought. Nat. Ecol. Evol. 2020, 4, 1075–1083. [Google Scholar] [CrossRef]
  64. McGroddy, M.E.; Daufresne, T.; Hedin, L.O. Scaling of C:N:P stoichiometry in forests worldwide: Implications of terrestrial redfield-type ratios. Ecology 2004, 85, 2390–2401. [Google Scholar] [CrossRef]
  65. Niklas, K.J. Plant allometry, leaf nitrogen and phosphorus stoichiometry, and interspecific trends in annual growth rates. Ann. Bot. 2006, 97, 155–163. [Google Scholar] [CrossRef]
  66. Hansen, J.; Beck, E. The fate and path of assimilation products in the stem of 8-year-old Scots pine (Pinus sylvestris L.) trees. Trees 1990, 4, 16–21. [Google Scholar] [CrossRef]
  67. Oribe, Y.; Funada, R.; Kubo, T. Relationships between cambial activity, cell differentiation and the localization of starch in storage tissues around the cambium in locally heated stems of Abies sachalinensis (Schmidt) Masters. Trees 2003, 17, 185–192. [Google Scholar] [CrossRef]
  68. Oberhuber, W.; Swidrak, I.; Pirkebner, D.; Gruber, A. Temporal dynamics of nonstructural carbohydrates and xylem growth in Pinus sylvestris exposed to drought. Can. J. For. Res. 2011, 41, 1590–1597. [Google Scholar] [CrossRef] [PubMed]
  69. Kurepin, L.V.; Stangl, Z.R.; Ivanov, A.G.; Bui, V.; Mema, M.; Hüner, N.P.; Öquist, G.; Way, D.; Hurry, V. Contrasting acclimation abilities of two dominant boreal conifers to elevated CO2 and temperature. Plant Cell Environ. 2018, 41, 1331–1345. [Google Scholar] [CrossRef] [PubMed]
  70. Way, D.A.; Sage, R.F. Elevated growth temperatures reduce the carbon gain of black spruce [Picea mariana (Mill.) BSP]. Glob. Change Biol. 2008, 14, 624–636. [Google Scholar] [CrossRef]
  71. Way, D.A.; Sage, R.F. Thermal acclimation of photosynthesis in black spruce [Picea mariana (Mill.) BSP]. Plant Cell Environ. 2008, 31, 1250–1262. [Google Scholar] [CrossRef]
  72. Zhang, X.W.; Wang, J.R.; Ji, M.F.; Milne, R.I.; Wang, M.H.; Liu, J.-Q.; Shi, S.; Yang, S.-L.; Zhao, C.-M. Higher thermal acclimation potential of respiration but not photosynthesis in two alpine Picea taxa in contrast to two lowland congeners. PLoS ONE 2015, 10, e0123248. [Google Scholar] [CrossRef]
  73. Needham, J.F.; Chambers, J.; Fisher, R.; Knox, R.; Koven, C.D. Forest responses to simulated elevated CO2 under alternate hypotheses of size-and age-dependent mortality. Glob. Change Biol. 2020, 26, 5734–5753. [Google Scholar] [CrossRef]
  74. Yu, K.; Smith, W.K.; Trugman, A.T.; Condit, R.; Hubbell, S.P.; Sardans, J.; Peng, C.; Zhu, K.; Peñuelas, J.; Cailleret, M.; et al. Pervasive decreases in living vegetation carbon turnover time across forest climate zones. Proc. Natl. Acad. Sci. USA 2019, 116, 24662–24667. [Google Scholar] [CrossRef]
Figure 1. Distribution of tree rings in the Northern Hemisphere.
Forests 14 02441 g001
Figure 2. Atmospheric CO2 concentration, 1901–2020.
Forests 14 02441 g002
Figure 3. Spatial distribution of climate zones in the Northern Hemisphere.
Forests 14 02441 g003
Figure 4. Effect of tree age on BAI. Note: The horizontal coordinate is age, referring to the age of the tree formation layer. The vertical coordinate is bias residual.
Forests 14 02441 g004
Figure 5. Trends in CO2 fertilization effect with stand age in the Northern Hemisphere.
Forests 14 02441 g005
Figure 6. Trends in CO2 fertilization effect with forest age under different climate zones in the northern hemisphere (a). Comparison of CO2 fertilization in different Climatic Zones. Boxes represent the interquartile range of the β values (solid lines represent medians, and empty rectangles represent the average value). The upper and lower extension lines extend to 1.5 times the interquartile spacing (b).
Forests 14 02441 g006
Table 1. Distribution of tree sample sites in the northern hemisphere across various climatic zones.
Climate ZoneNo. of SamplesPlant Number
A (Tropical)15241
B (Arid)2357744
C (Temperate)551657
D (Continental)108525,033
E (Polar)551657
Table 2. Generalized additive mixed model (GAMM) fitting results.
Parameter TermNonparametric Term
Climate ZoneInterceptStandard Errort-Valuep-ValueVariantFreedomp-ValueRadj2
A (Tropical)0.890.3343.82<0.01DBH17.44<0.010.83
Age3.21<0.01
B (Arid)1.840.0533.34<0.01DBH16.46<0.010.79
Age9.30<0.01
C (Temperate)1.980.0455.04<0.01DBH25.89<0.010.87
Age5.25<0.01
D (Continental)1.780.7224.49<0.01DBH15.28<0.010.75
Age4.49<0.01
E (Polar)0.610.0415.53<0.01DBH18.30<0.010.81
Age7.52<0.01
Table 3. Fitting results of model parameters for different climate zones.
Climate ZoneParametersR2SSERMSERF
abcd
A (Tropical)26.6713.2929.101.660.8649508.6518.41146
B (Arid)9.7313.4124.222.170.962784.554.37146
C (Temperate)9.4616.9228.851.920.979828.688.20146
D (Continental)11.259.1429.251.950.98521.961.89146
E (Polar)8.089.6929.991.730.632626.734.08146
Disclaimer/Publisher’s Note: The statements, opinions and data contained in all publications are solely those of the individual author(s) and contributor(s) and not of MDPI and/or the editor(s). MDPI and/or the editor(s) disclaim responsibility for any injury to people or property resulting from any ideas, methods, instructions or products referred to in the content.

