Article

Identification of Ecological Restoration Priority Areas Integrating Human Activity Intensity and Multi-Criteria Decision Analysis

1
School of Geography and Tourism, Shaanxi Normal University, Xi’an 710119, China
2
Department of Life Sciences, Imperial College London, Ascot SL5 7PY, UK
3
College of Marxism, Fujian Normal University, Fuzhou 350117, China
*
Author to whom correspondence should be addressed.
Forests 2023, 14(12), 2348; https://doi.org/10.3390/f14122348
Submission received: 20 October 2023 / Revised: 13 November 2023 / Accepted: 27 November 2023 / Published: 29 November 2023
(This article belongs to the Special Issue Ecosystem Degradation and Restoration: From Assessment to Practice)

Abstract

:
Restoration action is critical to ensure a safe environment for humans. Reasonable planning is essential to optimize the efficiency of ecological restoration inputs and outputs when implementing restoration measures. In this study, a method that combines human activity intensity assessment and multi-criteria decision analysis to determine ecological restoration priority (ERP) areas was developed to identify priority and feasible areas for ecological restoration in Shaanxi Province in 2020. The results showed that the total area involved in restoration feasibility assessment in Shaanxi is 10.89 × 10⁴ km2. Among them, the percentage of regions with low feasibility (less than 0.2) is 68.86%, mainly located in Qinling area. High feasibility areas (more than 0.6) accounted for 2.47%, mainly located in the Loess Plateau area of northern Shaanxi. The spatial distribution of the human activity intensity is concentrated in urban areas and extended with the distribution of roads. In total, 10.69% of the regions showed high and very high intensity of human activity, including the Guanzhong urban agglomeration region. This study identified 6078 km2 and 671 km2 of medium and high ecological restoration priority areas, which are more concentrated in the north of the study area. The need for ecological restoration work is even more urgent in northern Shaanxi. In general, the framework in this study has spatially located the priority and feasible areas for restoration, and may provide a useful reference for landscape-scale spatial conservation planning.

1. Introduction

In the process of rapid industrialization and urbanization, human activities have become the main driving force to change and reshape the regional ecological environment [1,2]. The increasing effect of human interference on ecosystem structure and function has led to many ecological problems, such as biodiversity loss, agricultural pollution, and soil erosion, which seriously threaten regional ecological security and sustainable development [3]. In response to the ecological problems, the Chinese government has carried out several ecological restoration programs and achieved good results [4]. However, ecological restoration is an ongoing effort. The constant investments in funding bring certain financial pressure to local governments [5]. After the success of wide-scale ecological restoration, it has become a growing consensus among policy makers that adjusting the existing ecological restoration policies and investments to areas in urgent need of ecological restoration is required [6,7]. Therefore, how to effectively identify ecological restoration priority (ERP) areas and provide useful decision support for decision makers to improve ecological restoration efficiency has become one of the focuses of ecological restoration studies.
Previous studies have tried some methods to identify the ERP areas. This includes evaluating the regional ecological environment and ecological security based on land use, ecosystem service, vegetation coverage, and other ecological indicators, and finding areas with more fragile ecological environment or lower ecological security for priority restoration [8,9,10]. Some other studies try to select the priority areas by using methods such as landscape ecology theory and multi-decision criteria analysis [11,12,13]. Although these studies clearly identified the level of ecological degradation and concluded that the degradation areas could be restored by revegetation and other measures, the actual ecological restoration may be difficult to achieve or costly to implement. Because these areas may be located in inaccessible locations, and revegetation may be difficult or impossible [5,14]. Meanwhile, most studies do not consider the socio-economic needs of human beings, such as settlements and cultivation areas [15]. Counties and cities in these studies are replaced with points, which fails to consider their spatial existence. This will certainly influence the judgment of the ERP areas. Therefore, to improve the spatial accuracy of the ERP area selection, and to improve the efficiency and feasibility of restoration, it is necessary to perform some further studies on the evaluation methods of ERP areas.
As the central province of China, the Shaanxi Province encompasses many ecological regions such as the Qinba Mountains, the Loess Plateau, and the Yellow River Basin. With plateaus, mountains, plains, and basins scattered throughout the province, its natural environment is complex and rich in ecological resources [7]. Over a long period, due to the continuous impact of human activities such as population increase, urban expansion, and forestry exploitation, the vegetation degradation and soil erosion in the province are obvious and the biodiversity continues to decrease [16]. To solve the related environmental problems, the Shaanxi Province has become the key implementation area of major ecological programs such as the Grain for Green Project, and has achieved great results [17]. However, under the principle of giving equal importance to economic development and ecological protection, how to carry out ecological restoration work efficiently and economically in the future while maintaining the existing development achievements is still a difficult issue for ecological construction in the region. Thus, taking the Shaanxi Province as the study area, carrying out studies on the evaluation of ERP areas will provide strong support for local social development and ecological construction.
In summary, based on data on population density, land use, nighttime lights, roads and nature reserves in 2020, this study constructs an index of human activity intensity. Meanwhile, a framework for assessing ERP areas at the pixel scale is proposed by combining human activity intensity, vegetation coverage data, distance to roads/towns, and multi-criteria decision analysis. The ERP areas identified based on this framework will have characteristics of degradation tendency, disturbance by human activities, and good accessibility to implement ecological restoration projects. The final purpose of this study is to identify the ERP areas in the Shaanxi Province based on the assessment framework.

2. Data and Methods

2.1. Study Area

The Shaanxi Province is located in the interior of China (105°29′–110°15′ E, 31°42′–39°35′ N), covering an area of 20.56 × 10⁴ km2 (Figure 1). The climate conditions vary greatly in the Shaanxi Province, with the south belonging to the northern subtropical climate, and the central to northern part gradually changing to the warm temperate and middle temperate climates. The annual average temperature and annual precipitation in the Shaanxi Province are 13 °C and 578.56 mm. The unique geographical features and significant north–south span contribute to notable climatic variations among its northern, central (Guanzhong), and southern regions. The annual average temperature from north to south is 9.24 °C, 12.08 °C, and 13.70 °C, and the annual precipitation from north to south is 279 mm, 563 mm, and 840 mm, respectively. The terrain of study area is generally high in the north and south, low in the middle, long and narrow in the longitudinal direction, and contains a variety of topography such as plateaus, mountains, plains, and basins. The temperature and precipitation in the region show a gradual increase from north to south as the topography changes [16]. The main vegetation types in the province also have typical geographical characteristics, which are temperate grassland, forest-steppe interlacing, and broad-leaved forest form north to south.

2.2. Datasets Sources

The data used in this study are normalized difference vegetation index (NDVI), population density, land use, night lighting, roads, railroads, and protected areas in 2020. The NDVI was used to estimate the Fractional Vegetation Cover (fc), which can be obtained from the MODIS NDVI product (MOD13Q1) (https://ladsweb.modaps.eosdis.nasa.gov, accessed on 1 September 2021) with a spatial resolution of 250 m. Land use and road data were used to assess the distance to human settlements and roads. Land use data were obtained from the European Space Agency with a resolution of 300 m (http://maps.elie.ucl.ac.be/CCI/viewer/, accessed on 3 September 2021), which was reclassified into six types, including farmland, forest, grassland, water body, construction land, and bare area. Road data was retrieved from the Resource and Environment Science and Data Center (https://www.resdc.cn/, accessed on 7 September 2021). Population density, land use, night lighting, roads, railroads, and protected areas data were used to construct the human activity intensity index. Among them, protected areas data came from the Research Center for Eco-Environment Sciences, Chinese Academy of Sciences (http://www.rcees.ac.cn/, accessed on 10 September 2021). The roads data, population density, night lighting, and railroads data were all retrieved from the Resource and Environment Science and Data Center (https://www.resdc.cn/, accessed on 7 September 2021). The spatial resolution of population density and night lighting were 250 m. To unify the resolution of different datasets, all the data were resampled into 300 m resolution by using ArcGIS v10.2 software (Esri, Redlands, CA, USA). The specific information of all data is shown in Table 1.

2.3. Vegetation Coverage

Fractional Vegetation Cover (fc) corresponds to the proportion of vegetation covering the ground. Since fc is independent of light direction and sensitive to the amount of vegetation, it is an effective indicator to be used for ecological monitoring [18]. In this study, fc was used to evaluate the ecological environment status, and the higher the value of fc, the better the ecological environment. It is calculated based on the pixel bisection method with the following equation:
f c = N D V I i N D V I m i n N D V I m a x N D V I m i n ,
where NDVIi the average NDVI value in pixel i, NDVImin and NDVImax are the minimum and the maximum NDVI value in the area. Using the NDVI frequency histogram, NDVI values corresponding to 1% and 99% of the cumulative frequency values were adopted as NDVImin and NDVImax, respectively [19].

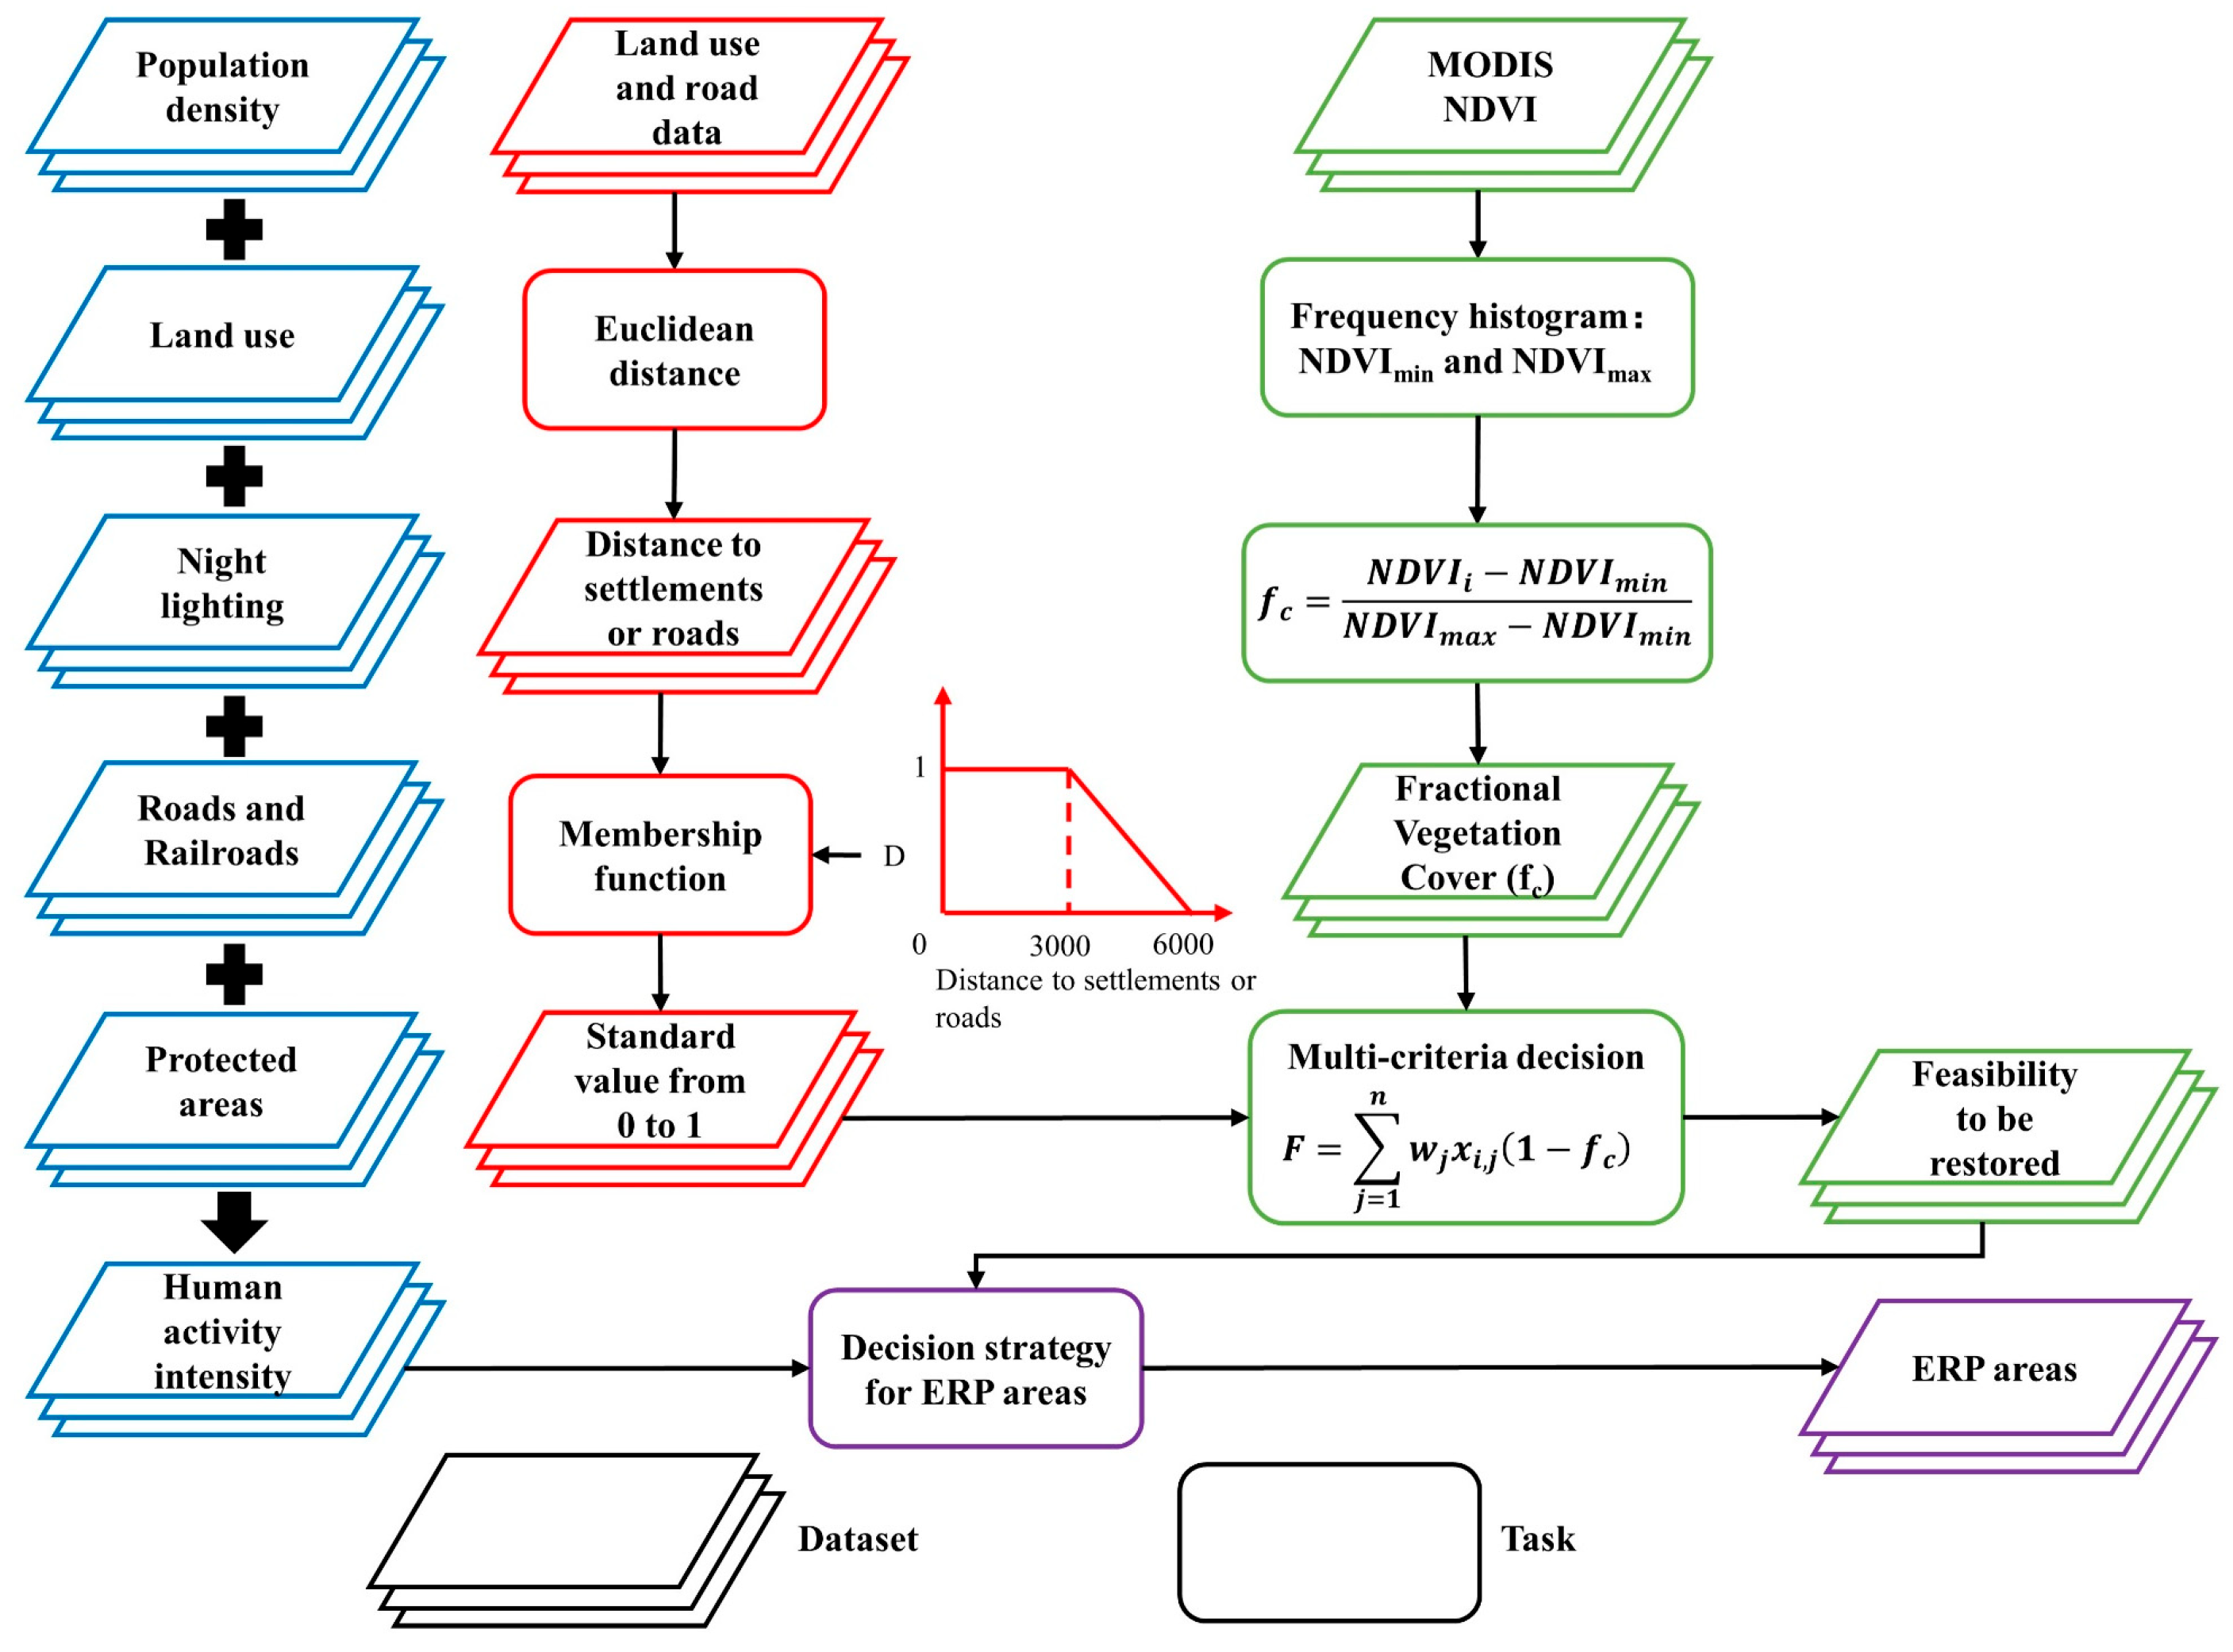
2.4. Determination of Feasibility to Be Restored

Multi-criteria decision analysis is a decision method for selecting the ideal alternative or ranking options considering multiple attributes [13]. This study evaluates the feasibility of restoration areas by considering two factors (human settlement, accessibility) and one constraint (fc). The first factor to consider is human settlement, as it is both an important factor affecting the ecosystem and the area of origin for ecological restoration [7]. Therefore, Euclidean distance maps to human settlements were calculated at a spatial resolution of 300 m based on land use data for construction land, farmland, and administrative boundary data. The second factor is to measure the accessibility of the restoration area to ensure its feasibility [5]. The distance to the roads was calculated using road data containing provincial level, national level, and other roads. Highways and railroads are not considered here, as they are primarily tasked with town-to-town transportation. Transportation by highway or railroad makes it difficult to leave the road randomly to approach areas where ecological restoration is needed. Thus, if a place is close to human settlements or roads, it is favorable for priority restoration, but if it is far away, it is inappropriate. The distance calculation results need to be normalized by using the membership function to change the actual distance to a standard value from 0 to 1. The used formula is as follows:
if   D < 5000   m   then   X i = 1
if   D > 10 , 000   m   then   X i = 0
if   5000   m D 10 , 000   m   then   X i = 10 , 000 D / 5000
where D is the distance to the settlement or road. Xi is the normalized value of pixel i, the highest suitability value is 1 for the distance from 0–3000 m, and 0 for the distance of over 6000 m.
The weighted linear combination method was used to combine the distance to the settlement or road with the fc [20]. The formula is:
F = j = 1 n w j x i , j 1 f c
where F refers to the feasibility of the restored area. wj is the weight of different factors j. Considering that settlements and roads are equally important to the feasibility index, they are assigned an equal weight of 0.5. xi, j is the normalized distance value of pixel i of factor j, j = 1 for the distance between the pixel and the road, j = 2 for the distance between the pixel and the settlement, n = 2. fc is the vegetation coverage. The higher the F value is, the higher the feasibility to be restored. Once F is obtained, it is classified into 5 levels: very low (0–0.2), low (0.2–0.4), medium (0.4–0.6), high (0.6–0.8), and very high (0.8–1).

2.5. Index of Human Activity Intensity

In this study framework, six types of spatial data representing human activities are selected, which are assigned a score of 0–10 for each pixel based on different evaluation methods. After summing up the six types of evaluated data, the higher the pixel scores, the higher the intensity of human activity. Detailed information for each type of data is as follows.

2.5.1. Population Density

Population density is an important indicator of the interaction between ecosystem and human activities [21]. The effect of population on the ecosystem can be expressed as a logarithmic relationship [22]. Therefore, this study assigns population density data according to a logarithmic equation with a value range of 0–10.
p o p s c o r e = 1.8527 × log p o p d e n s i t y + 1 ,
where popscore represents the reassigned score of the pixel, popdensity represents the population density value of the pixel.

2.5.2. Land Use

Land use transformation is an important factor reflecting the process and result of human activities [23]. Based on the results of the 5 ecological experts’ consultations and previous studies [24,25], this study assigned 10 points to all construction land, 7 points to farmland, 4 points to grassland and bare land, 2 points to forest, and 0 points to water.

2.5.3. Night Lighting

Nighttime light changes directly reflect the intensity of human activity; the more highly lighted area, the greater the intensity of human activity [22]. Utilizing the night lighting data of the Shaanxi Province in 2020, the pixels with 0 value are assigned 0 points, and the pixels with a value greater than 0 are divided into 10 parts using the natural breakpoint method, which are assigned 1 to10 points from small to large in turn. Specifically, the 10 parts are part 1 (0–1.59), part 2 (1.59–7.17), part 3 (7.17–15.15), part 4 (15.15–23.91), part 5 (23.91–33.48), part 6 (33.48–43.84), part 7 (43.84–58.19), part 8 (58.19–82.10), part 9 (82.10–123.55), and part 10 (123.55–202.47), respectively.

2.5.4. Roads and Railroads

Due to the complex topography of the Shaanxi Province, different kinds of roads facilitate the movement of people and are one of the most important paths of human activities. In this study, the area within 500 m of both sides of roads (provincial roads, national roads, highways, etc.) in the Shaanxi Province is assigned a score of 10, the area within 500–1500 m is assigned a score of 8, and the area within 1500–2500 m is assigned a score of 4. Due to the closed character of the train running along the railroad line, the influence range on both sides is relatively small. Therefore, only the area within 500 m of both sides of the railroad is assigned a value of 8 points [25].

2.5.5. Protected Areas

The establishment of nature protection areas can appropriately reduce the intensity of human activity. Based on previous studies [26,27,28], the total value of human activity intensity in protected areas decreases by 8%, 4%, and 2% every five years. This study primarily focuses on the effects within the first five years following the establishment of the protected area, thus data was adjusted downward by 8%.
The above data were reassigned and spatially overlaid to obtain the map of the human activity intensity index in the Shaanxi Province in 2020. Based on the natural breakpoint method, the index was classified into five levels: very low, low, medium, high, and very high. The specific information for each data assignment method is shown in Table 2.

2.6. Determination of ERP Areas

This study aims to combine the results of feasibility analysis of restoration areas and human activity intensity to select ERP areas. By overlaying the results of both analyses, this study will follow the rules in Table 3 to determine three kinds of priorities (low, medium, and high priority). The basic structure of the study framework is shown in Figure 2.

3. Results

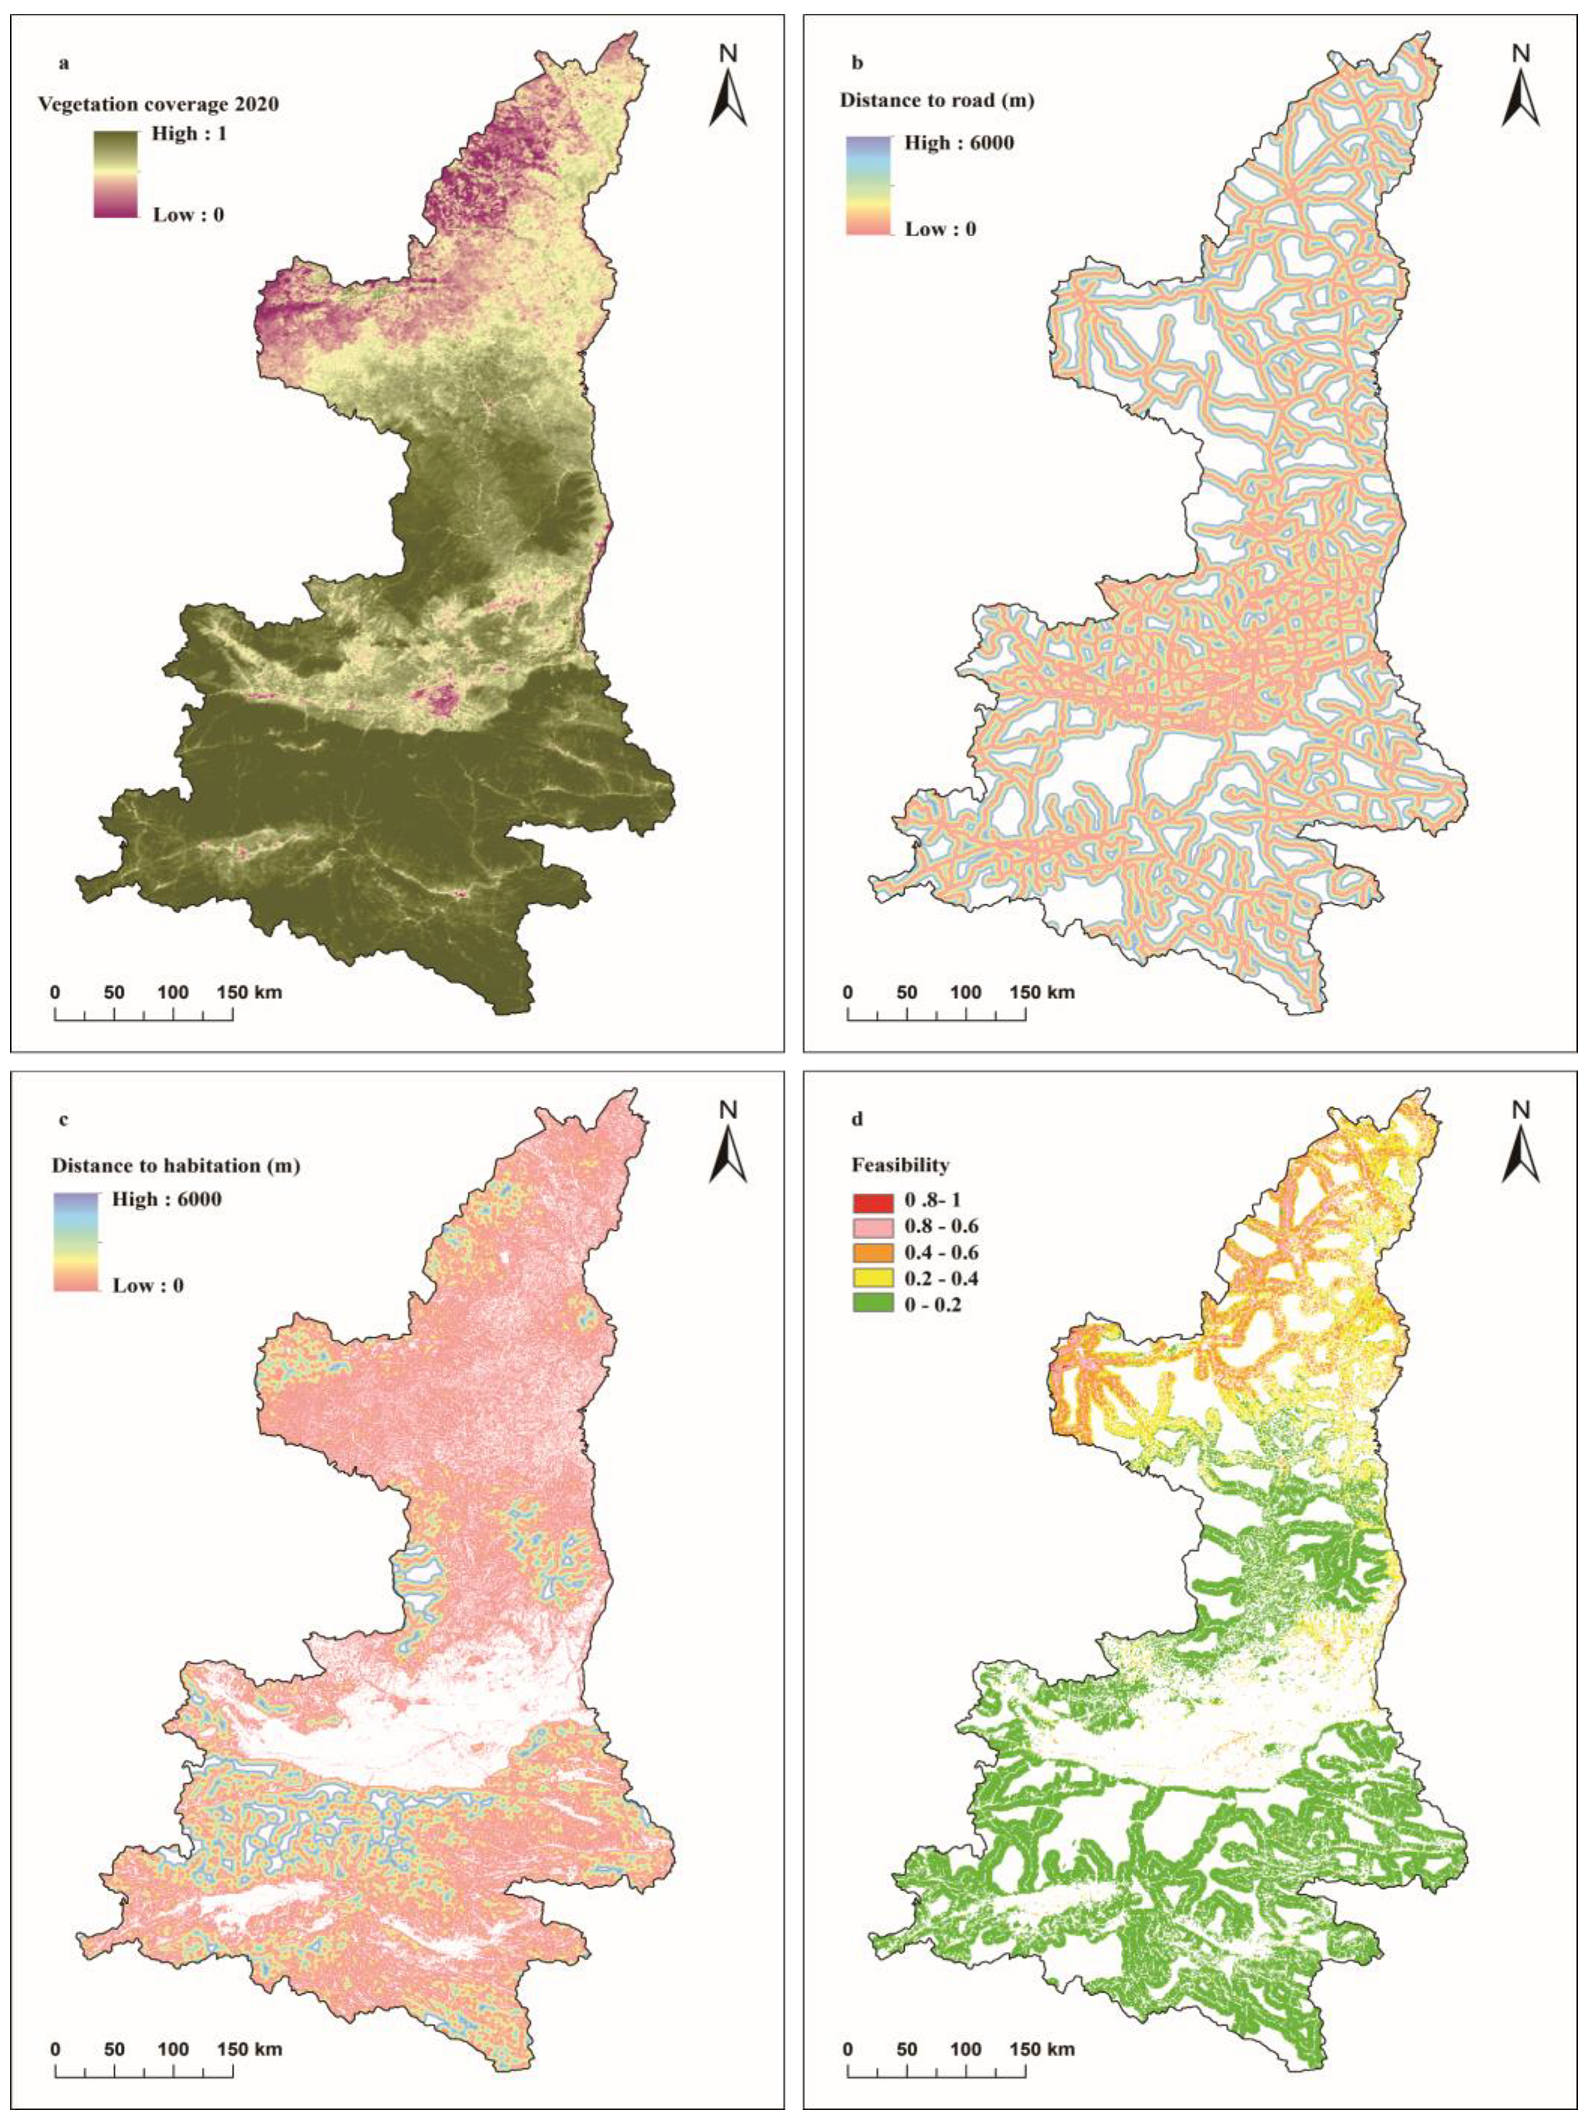
3.1. Feasibility Analysis

The result of the fc analysis in the Shaanxi Province in 2020 is shown in Figure 3a. The average fc in study area is 81.24%, which gradually decreased from south to north. The areas with high vegetation coverage are mainly concentrated in Qinling region in southern Shaanxi with an average fc of 96.26%. The fc of the urban cluster area focusing on Xi’an City in the Guanzhong area in central Shaanxi is relatively lower, where the average fc is 84.37%. The fc of the Loess Plateau area in the north of the province is the lowest, where the average fc is only 66.12%.
Road construction in the Shaanxi Province is relatively complete, with all regions of the province having a certain level of accessibility. Among them, the Guanzhong area in central Shaanxi has the densest roads (Figure 3b). Compared to the distribution of roads, the distribution of human settlements in Shaanxi Province is more complex. There are many blank areas in the Guanzhong region, as the existence of the Guanzhong urban agglomeration occupies a large amount of space, making it difficult to establish an effective 6 km buffer zone (Figure 3c). Similar blank areas also appear in the southern part of Shaanxi, which is mainly the region where large cities such as Hanzhong and Ankang are located. However, the Qinling Mountains in southern Shaanxi and the forested areas in central Shaanxi effectively limit the extent of human activities, and both areas appear to have a complete 6 km buffer zone. For northern Shaanxi, due to the existence of a large amount of farmland, the buffer zone is mainly around 3 km wide.
Based on the multi-criteria decision analysis, the result of the restoration feasibility is shown in Figure 3d. In general, the total area involved in restoration feasibility assessment in Shaanxi Province is 10.89 × 10⁴ km2. Among them, the percentage of regions with low feasibility (less than 0.2) is 68.86%, mainly located in the Qinling area in the south of the study area with a better ecological environment. Regions with moderate feasibility (0.2–0.6) accounted for 28.67%, mainly in Guanzhong and northern Shaanxi. High feasibility areas (more than 0.6) accounted for 2.47%, mainly located in Yulin, Dingbian, and Hengshan counties and cities in the Loess Plateau area of northern Shaanxi.

3.2. Human Activity Intensity
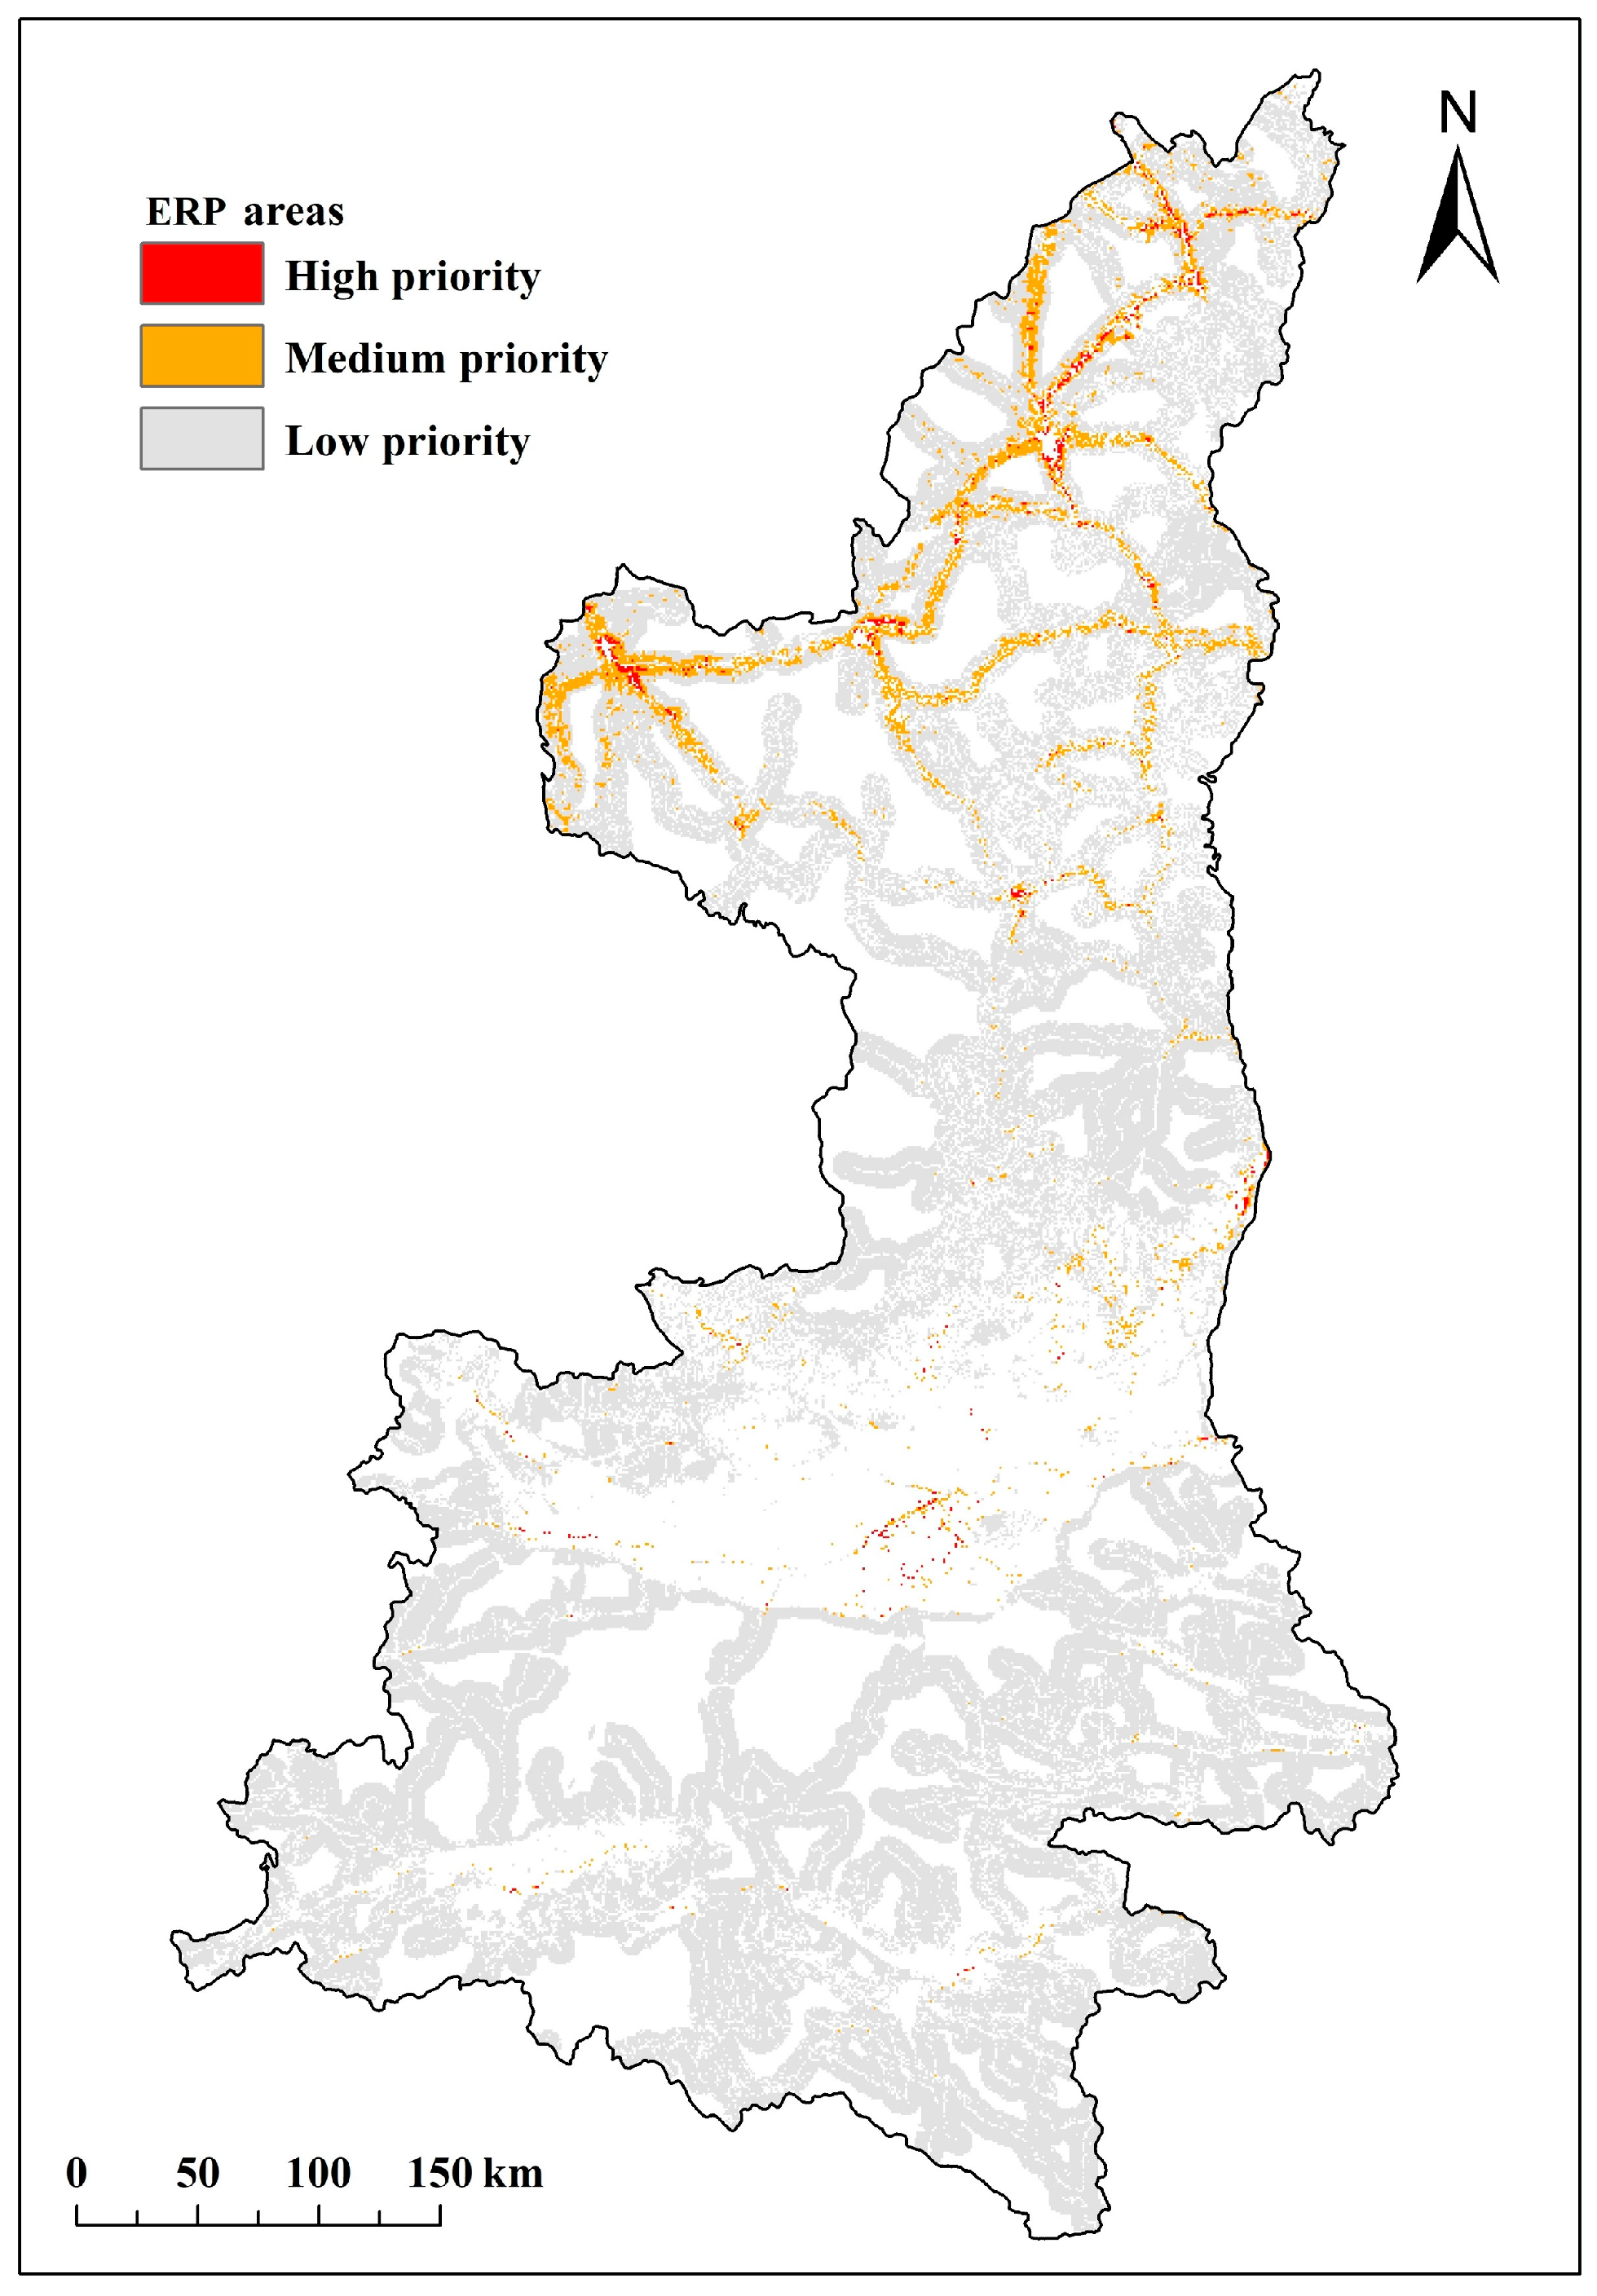
The spatial distribution of the human activity intensity in the Shaanxi Province in 2020 is shown in Figure 4. It has been classified into five levels, including very low (0–7.70), low (7.70–12.46), medium (12.46–17.78), high (17.78–25.66), and very high (25.66–46.73). In general, human activity in this region is concentrated in urban areas and extended with the distribution of roads. The highest human activity intensity occurred in the Guanzhong urban agglomeration represented by Xi’an city. The area with relatively low (very low and low) human activity intensity covers 79.05% of the entire province, with the lowest intensity in the Qinling Mountains in the southern part of the study area. The area of medium intensity of human activity accounts for 10.26% of the total area, which is mostly farmland. In total, 10.69% of the regions showed high and very high intensity of human activity, with the Guanzhong urban agglomeration region, Yulin and Yan’an cities in northern Shaanxi, and Hanzhong and Ankang cities in southern Shaanxi all showing strong intensity. The cities have a remarkable population aggregation effect.

3.3. ERP Areas

Based on the decision strategy in Table 3, this study classifies the ERP areas in the Shaanxi Province into 3 levels: low priority, medium priority, and high priority, as shown in Figure 5. Most of the ERP areas are low-priority restoration areas, especially in the south of the study area, where there are basically no medium or high-priority ecological restoration areas. Meanwhile, this study identified 6078 km2 and 671 km2 of medium and high-ecological restoration priority areas, respectively. Besides being scattered in the areas around the Guanzhong urban agglomeration, these areas are more concentrated in northern Shaanxi. Therefore, it is more necessary to carry out ecological restoration work in the relevant areas of northern Shaanxi.

4. Discussion

4.1. Methodology

This study proposed a methodology framework to identify appropriate sites for ecological restoration at the regional scale. Previous studies have mostly evaluated the need for ecological restoration from an isolated viewpoint. Some studies focused on the spatial and temporal distribution of different indicators in order to protect different ecological functions in the regions [11,29], while some aimed to identify the areas with potential risk of degradation as ERP areas [30,31]. However, their results are relatively limited in identifying the feasibility and urgency of restoration work [32,33]. In this study, an evaluation of human activities and vegetation growth conditions was combined with the feasibility of restoration, and suitable restoration sites were identified and classified into different priority levels with the accuracy of pixel level. Among them, the limits on vegetation cover and distance to human settlements and roads are of practical importance and can quickly help to identify the most feasible and closest restoration sites for decision makers. Meanwhile, in identifying the areas that need to be restored, this study did not consider farmland, but considered it as one of the factors for the identification of human settlements. The reason is that the Shaanxi Province is one of the key areas for the implementation of the Grain for Green Program, and the program had already achieved its goals successfully in this area [34]. The first stage of the program was completed in 2010, and as the follow-up work continues, hillside farmland with a slope higher than 25° in Shaanxi Province has basically been returned to the forest [35,36]. At present, preserving the ecological restoration achievements and maintaining the coordinated development of regional ecological construction and food production have become the key elements in the region [37]. Therefore, this study assumes that the area of farmland is currently maintained unchanged in the process of selecting ERP areas.
The construction of a cross-matrix table based on the feasibility results in combination with the intensity of human activity has two implications. On one hand, stronger human activities further predicted the urgency of local ecological restoration. On the other hand, based on the intensity of human activity identified by data such as population and nighttime lights, places with stronger intensity tend to be able to invest more human and material resources to carry out relevant restoration activities. Therefore, the human activity intensity index will be helpful to improve the efficiency of identifying ERP areas. In summary, this study proposed a referenceable methodological framework for the identification of ERP areas, and its results will be useful in providing spatial guidance for the implementation of restoration programs. In future studies, the indicators remain to be further improved to better represent the actual condition. For instance, incorporating economic indicators such as GDP into the index of human activity intensity, or considering terrain factors in order to optimize the evaluation of feasibility. Moreover, the data resolution needs to be improved, so that the results will represent the actual situation more closely.

4.2. Restoration Areas in Shaanxi

According to the results of this study, the need for ecological restoration in southern Shaanxi is relatively low, which is basically at a low-priority restoration level. Because this part of study area is close to the Qinling region, where the overall ecological environment is relatively good. This region has the characteristics of well vegetation coverage with a high value of NDVI. Meanwhile, to protect the region’s unique natural environment, the local government has set up a sequence of nature reserves in the area, including Taibai Mountain nature reserves, Foping nature reserves, etc., which provide a strong guarantee for the regional ecological environment [38,39].
Despite the high level of human activity, most land in the Guanzhong region is taken by urban and farmland, leaving relatively limited land for ecological restoration. The framework for assessing ERP areas in this study estimates restoration needs only for lands outside of human settlements. For the Guanzhong urban agglomeration, a large amount of land has been occupied by urban and farmland, which leads to a great decline in vegetation coverage. It is particularly important to maintain its ecological environment not only by restoring the identified medium or high-priority restoration areas in the periphery, but also by building ecological environments such as urban green spaces in its interior [40]. As an important part of the urban ecosystem, urban green space is one of the effective ways to relieve the pressure on the ecosystem of urban agglomerations [41]. Proper planning and construction of urban green spaces will bring various benefits of ecosystem services such as air cleaning, climate regulation, noise mitigation, and recreation to the city [42,43,44]. Therefore, one of the priorities of future environmental management in the Guanzhong region should be in the control of the urban scale, optimizing urban green space structure, and strengthening urban ecological construction, so as to achieve high-quality sustainable development of urban agglomeration.
The largest ERP area and the most widely distributed medium or high-priority restoration areas in this study were concentrated in northern Shaanxi. As a key area for ecological programs such as Grain for Green and Natural Forest Protection, the ecological environment in northern Shaanxi has been greatly improved. The local vegetation coverage has increased year by year, and ecological problems such as soil erosion and land degradation have been effectively solved [36,45]. However, along with the implementation of ecological programs, the energy economy represented by coal and oil had also developed rapidly in northern Shaanxi [46]. The continuous exploitation of energy resources led to problems including population growth, urban expansion, and environmental damage during the mining process [47,48]. Li et al. pointed out that, in northern Shaanxi, there is an increasing risk of vegetation degradation due to the continuous construction of energy production facilities, and increased exploitation of mineral resources [49]. Due to the results in this study, compared with the good ecological environment of southern Shaanxi and the population gathered area in Guanzhong, the ecological restoration needs in northern Shaanxi are characterized by a clear radial trend of priority areas distributed along the path of human activities, centered on human settlements and towns formed by mineral development. As the ecological environment in northern Shaanxi has been improved overall, ecological restoration work is prioritized around vegetation degradation areas brought by human activities including energy and economic development, which meets the actual needs of regional ecological restoration [45,50]. Therefore, the framework of the ERP area identification method proposed in this study has spatially located the priority and feasible ecological restoration sites, and may offer a useful reference for future ecological restoration work in the area.

5. Conclusions

This study takes Shaanxi Province as the study area, and constructs a methodological framework by combining human activity intensity and multi-decision criterion analysis to determine the ERP sites. The sites were identified at three levels: low, medium, and high priority, taking into account the feasibility determined by vegetation coverage, distance to human settlements and roads, and in combination with certain strategies for decision making. The analysis results in Shaanxi Province showed that the average fc in study area is 81.24%, which gradually decreased from south to north. The accessibility of roads throughout the province is high, and there is a significant population aggregation effect in the Guanzhong urban agglomeration among human settlements. The total area with ecological restoration feasibility is 10.89 × 10⁴ km2, in which the medium and high feasibility areas are mainly concentrated in Guanzhong and northern Shaanxi. The areas with high intensity of human activity account for 10.69% of the province, and the intensity of the Guanzhong urban agglomeration is significantly higher than other regions in the province. This study eventually identified 6749 km2 of ERP areas, among them, medium level ERP areas are 6078 km2, and high level ERP areas are 671 km2. Medium- and high-level areas are mainly concentrated in the northern part of the Shaanxi Province, showing the characteristics of the city as the center and radiation along the road. The methodological framework constructed in this study integrates feasibility and human activity, which can be used by stakeholders in similar areas for reference in regional ecosystem restoration practices.

Author Contributions

Conceptualization, H.W. and B.T.; methodology, H.W.; software, B.T. and W.L.; formal analysis, W.Z.; visualization, J.L.; writing—original draft preparation, H.W.; writing—review and editing, B.T., L.Z. and L.J. All authors have read and agreed to the published version of the manuscript.

Funding

This research was funded by the Natural Science Basic Research Plan in Shaanxi Province of China (2023-JC-YB-229), and the National Natural Science Foundation of China (No. 42371103).

Data Availability Statement

The data presented in this study are available on request from the corresponding author.

Conflicts of Interest

The authors declare no conflict of interest.

References

  1. Jiang, H.; Peng, J.; Dong, J.; Zhang, Z.; Xu, Z.; Meersmans, J. Linking Ecological Background and Demand to Identify Ecological Security Patterns across the Guangdong-Hong Kong-Macao Greater Bay Area in China. Landsc. Ecol. 2021, 36, 2135–2150. [Google Scholar] [CrossRef]
  2. Zhang, D.; Wang, X.; Qu, L.; Li, S.; Lin, Y.; Yao, R.; Zhou, X.; Li, J. Land Use/Cover Predictions Incorporating Ecological Security for the Yangtze River Delta Region, China. Ecol. Indic. 2020, 119, 106841. [Google Scholar] [CrossRef]
  3. Xie, H.; He, Y.; Choi, Y.; Chen, Q.; Cheng, H. Warning of Negative Effects of Land-Use Changes on Ecological Security Based on GIS. Sci. Total Environ. 2020, 704, 135427. [Google Scholar] [CrossRef] [PubMed]
  4. Wang, L.-J.; Ma, S.; Qiao, Y.-P.; Zhang, J.-C. Simulating the Impact of Future Climate Change and Ecological Restoration on Trade-Offs and Synergies of Ecosystem Services in Two Ecological Shelters and Three Belts in China. Int. J. Environ. Res. Public Health 2020, 17, E7849. [Google Scholar] [CrossRef] [PubMed]
  5. Aguirre-Salado, C.A.; Miranda-Aragón, L.; Pompa-García, M.; Reyes-Hernández, H.; Soubervielle-Montalvo, C.; Flores-Cano, J.A.; Méndez-Cortés, H. Improving Identification of Areas for Ecological Restoration for Conservation by Integrating USLE and MCDA in a GIS-Environment: A Pilot Study in a Priority Region Northern Mexico. ISPRS Int. J. Geo-Inf. 2017, 6, 262. [Google Scholar] [CrossRef]
  6. Fang, C.; Liu, H.; Li, G. International Progress and Evaluation on Interactive Coupling Effects between Urbanization and the Eco-Environment. J. Geogr. Sci. 2016, 26, 1081–1116. [Google Scholar] [CrossRef]
  7. Lü, Y.; Fu, B.; Feng, X.; Zeng, Y.; Liu, Y.; Chang, R.; Sun, G.; Wu, B. A Policy-Driven Large Scale Ecological Restoration: Quantifying Ecosystem Services Changes in the Loess Plateau of China. PLoS ONE 2012, 7, e31782. [Google Scholar] [CrossRef] [PubMed]
  8. De Mendonça, G.C.; Costa, R.C.A.; Parras, R.; de Oliveira, L.C.M.; Abdo, M.T.V.N.; Pacheco, F.A.L.; Pissarra, T.C.T. Spatial Indicator of Priority Areas for the Implementation of Agroforestry Systems: An Optimization Strategy for Agricultural Landscapes Restoration. Sci. Total Environ. 2022, 839, 156185. [Google Scholar] [CrossRef]
  9. Liu, Z.; Huang, Q.; Zhou, Y.; Sun, X. Spatial Identification of Restored Priority Areas Based on Ecosystem Service Bundles and Urbanization Effects in a Megalopolis Area. J. Environ. Manag. 2022, 308, 114627. [Google Scholar] [CrossRef]
  10. Silva, T.; Guimarães Vieira, I. Identification of Priority Areas for Ecological Restoration in Eastern Pará, Brazil. Floresta Ambiente 2020, 27, e014418. [Google Scholar] [CrossRef]
  11. Antongiovanni, M.; Venticinque, E.M.; Tambosi, L.R.; Matsumoto, M.; Metzger, J.P.; Fonseca, C.R. Restoration Priorities for Caatinga Dry Forests: Landscape Resilience, Connectivity and Biodiversity Value. J. Appl. Ecol. 2022, 59, 2287–2298. [Google Scholar] [CrossRef]
  12. Metzger, J. A Framework for Setting Local Restoration Priorities Based on Landscape Context. Nat. Conserv. Rev. Bras. Conserv. Nat. 2013, 11, 152–157. [Google Scholar] [CrossRef]
  13. Valente, R.A.; de Mello, K.; Metedieri, J.F.; Américo, C. A Multicriteria Evaluation Approach to Set Forest Restoration Priorities Based on Water Ecosystem Services. J. Environ. Manag. 2021, 285, 112049. [Google Scholar] [CrossRef] [PubMed]
  14. Vettorazzi, C.A.; Valente, R.A. Priority Areas for Forest Restoration Aiming at the Conservation of Water Resources. Ecol. Eng. 2016, 94, 255–267. [Google Scholar] [CrossRef]
  15. Castillo-Mandujano, J.; Smith-Ramírez, C. The Need for Holistic Approach in the Identification of Priority Areas to Restore: A Review. Restor. Ecol. 2022, 30, e13637. [Google Scholar] [CrossRef]
  16. Wang, H.; Liu, G.; Li, Z.; Zhang, L.; Wang, Z. Processes and Driving Forces for Changing Vegetation Ecosystem Services: Insights from the Shaanxi Province of China. Ecol. Indic. 2020, 112, 106105. [Google Scholar] [CrossRef]
  17. Su, C.; Fu, B. Evolution of Ecosystem Services in the Chinese Loess Plateau under Climatic and Land Use Changes. Glob. Planet. Change 2013, 101, 119–128. [Google Scholar] [CrossRef]
  18. Shifaw, E.; Sha, J.; Li, X.; Bao, Z.; Ji, J.; Chen, B. Spatiotemporal Analysis of Vegetation Cover (1984–2017) and Modelling of Its Change Drivers, the Case of Pingtan Island, China. Model. Model. Earth Syst. Environ. 2018, 4, 899–917. [Google Scholar] [CrossRef]
  19. Wang, H.; Li, Z.; Zhang, W.; Ye, X.; Liu, X. A Modified Temperature-Vegetation Dryness Index (MTVDI) for Assessment of Surface Soil Moisture Based on MODIS Data. Chin. Geogr. Sci. 2022, 32, 592–605. [Google Scholar] [CrossRef]
  20. Drobne, S.; Lisec, A. Multi-Attribute Decision Analysis in GIS: Weighted Linear Combination and Ordered Weighted Averaging. Informatica 2009, 33, 459–474. [Google Scholar]
  21. Ellis, E.C.; Ramankutty, N. Putting People in the Map: Anthropogenic Biomes of the World. Front. Ecol. Environ. 2008, 6, 439–447. [Google Scholar] [CrossRef]
  22. Venter, O.; Sanderson, E.; Magrach, A.; Allan, J.; Beher, J.; Jones, K.; Possingham, H.; Laurance, W.; Wood, P.; Fekete, B.; et al. Sixteen Years of Change in the Global Terrestrial Human Footprint and Implications for Biodiversity Conservation. Nat. Commun. 2016, 7, 12558. [Google Scholar] [CrossRef] [PubMed]
  23. Lu, Y.; Zhang, L.; Feng, X.; Zeng, Y.; Fu, B.-J.; Yao, X.; Li, J.; Wu, B. Recent Ecological Transitions in China: Greening, Browning, and Influential Factors. Sci. Rep. 2015, 5, 8732. [Google Scholar] [CrossRef] [PubMed]
  24. Xu, Y.; Xu, X.; Tang, Q. Human Activity Intensity of Land Surface: Concept, Methods and Application in China. J. Geogr. Sci. 2016, 26, 1349–1361. [Google Scholar] [CrossRef]
  25. Duan, Q.; Luo, L.; Zhao, W.; Zhuang, Y.; Liu, F. Mapping and Evaluating Human Pressure Changes in the Qilian Mountains. Remote Sens. 2021, 13, 2400. [Google Scholar] [CrossRef]
  26. Correa Ayram, C.A.; Mendoza, M.E.; Etter, A.; Pérez Salicrup, D.R. Anthropogenic Impact on Habitat Connectivity: A Multidimensional Human Footprint Index Evaluated in a Highly Biodiverse Landscape of Mexico. Ecol. Indic. 2017, 72, 895–909. [Google Scholar] [CrossRef]
  27. Duan, Q.; Luo, L. A dataset of human footprint over the Qinghai-Tibet Plateau during 1990–2015. China Sci. Data 2020, 5, 303–312. [Google Scholar]
  28. Etter, A.; McAlpine, C.A.; Seabrook, L.; Wilson, K.A. Incorporating Temporality and Biophysical Vulnerability to Quantify the Human Spatial Footprint on Ecosystems. Biol. Conserv. 2011, 144, 1585–1594. [Google Scholar] [CrossRef]
  29. Li, S.; Zhang, H.; Zhou, X.; Yu, H.; Li, W. Enhancing Protected Areas for Biodiversity and Ecosystem Services in the Qinghai–Tibet Plateau. Ecosyst. Serv. 2020, 43, 101090. [Google Scholar] [CrossRef]
  30. Huang, X.; Wang, X.; Zhang, X.; Zhou, C.; Ma, J.; Feng, X. Ecological Risk Assessment and Identification of Risk Control Priority Areas Based on Degradation of Ecosystem Services: A Case Study in the Tibetan Plateau. Ecol. Indic. 2022, 141, 109078. [Google Scholar] [CrossRef]
  31. Louzada, R.O.; Bergier, I.; Diniz, J.M.D.S.; Guerra, A.; Roque, F.D.O. Priority Setting for Restoration in Surrounding Savannic Areas of the Brazilian Pantanal Based on Soil Loss Risk and Agrarian Structure. J. Environ. Manag. 2022, 323, 116219. [Google Scholar] [CrossRef] [PubMed]
  32. Baró, F.; Gómez-Baggethun, E.; Haase, D. Ecosystem Service Bundles along the Urban-Rural Gradient: Insights for Landscape Planning and Management. Ecosyst. Serv. 2017, 24, 147–159. [Google Scholar] [CrossRef]
  33. Chen, X.; Li, F.; Li, X.; Liu, H.; Hu, Y.; Hu, P. Integrating Ecological Assessments to Target Priority Restoration Areas: A Case Study in the Pearl River Delta Urban Agglomeration, China. Remote Sens. 2021, 13, 2424. [Google Scholar] [CrossRef]
  34. Zhang, D.; Jia, Q.; Xu, X.; Yao, S.; Chen, H.; Hou, X. Contribution of Ecological Policies to Vegetation Restoration: A Case Study from Wuqi County in Shaanxi Province, China. Land. Use Policy 2018, 73, 400–411. [Google Scholar] [CrossRef]
  35. Tang, Y.; Shao, Q.; Liu, J.; Zhang, H.; Yang, F.; Cao, W.; Wu, D.; Gong, G. Did Ecological Restoration Hit Its Mark? Monitoring and Assessing Ecological Changes in the Grain for Green Program Region Using Multi-Source Satellite Images. Remote Sens. 2019, 11, 358. [Google Scholar] [CrossRef]
  36. Zhou, X.; Zhou, Y. Spatio-Temporal Variation and Driving Forces of Land-Use Change from 1980 to 2020 in Loess Plateau of Northern Shaanxi, China. Land 2021, 10, 982. [Google Scholar] [CrossRef]
  37. Li, Y.; Zhang, X.; Cao, Z.; Liu, Z.; Lu, Z.; Liu, Y. Towards the Progress of Ecological Restoration and Economic Development in China’s Loess Plateau and Strategy for More Sustainable Development. Sci. Total Environ. 2021, 756, 143676. [Google Scholar] [CrossRef]
  38. Zhang, K.; Zhang, Y.; Tian, H.; Cheng, X.; Dang, H.; Zhang, Q. Sustainability of Social–Ecological Systems under Conservation Projects: Lessons from a Biodiversity Hotspot in Western China. Biol. Conserv. 2013, 158, 205–213. [Google Scholar] [CrossRef]
  39. Zhang, Y.; Liu, X.; Lv, Z.; Zhao, X.; Yang, X.; Jia, X.; Sun, W.; He, X.; He, B.; Cai, Q.; et al. Animal Diversity Responding to Different Forest Restoration Schemes in the Qinling Mountains, China. Ecol. Eng. 2019, 136, 23–29. [Google Scholar] [CrossRef]
  40. Wang, J.; Zhao, M.; Zhong, W.; Li, J.; Zheng, C. Coupling Relationship of Urban Development and the Eco-Environment in Guanzhong Region, China. Sustainability 2022, 14, 2969. [Google Scholar] [CrossRef]
  41. Zhang, J.; Yu, Z.; Cheng, Y.; Sha, X.; Zhang, H. A Novel Hierarchical Framework to Evaluate Residential Exposure to Green Spaces. Landsc. Ecol. 2022, 37, 895–911. [Google Scholar] [CrossRef]
  42. De Carvalho, R.M.; Szlafsztein, C.F. Urban Vegetation Loss and Ecosystem Services: The Influence on Climate Regulation and Noise and Air Pollution. Environ. Pollut. 2019, 245, 844–852. [Google Scholar] [CrossRef]
  43. Liu, H.; Remme, R.P.; Hamel, P.; Nong, H.; Ren, H. Supply and Demand Assessment of Urban Recreation Service and Its Implication for Greenspace Planning—A Case Study on Guangzhou. Landsc. Urban Plan. 2020, 203, 103898. [Google Scholar] [CrossRef]
  44. Zardo, L.; Geneletti, D.; Pérez-Soba, M.; van Eupen, M. Estimating the Cooling Capacity of Green Infrastructures to Support Urban Planning. Ecosyst. Serv. 2017, 26, 225–235. [Google Scholar] [CrossRef]
  45. Wei, H.; Fan, W.; Ding, Z.; Weng, B.; Xing, K.; Wang, X.; Lu, N.; Ulgiati, S.; Dong, X. Ecosystem Services and Ecological Restoration in the Northern Shaanxi Loess Plateau, China, in Relation to Climate Fluctuation and Investments in Natural Capital. Sustainability 2017, 9, 199. [Google Scholar] [CrossRef]
  46. Shang, Y.; Lu, S.; Li, X.; Hei, P.; Lei, X.; Gong, J.; Liu, J.; Zhai, J.; Wang, H. Balancing Development of Major Coal Bases with Available Water Resources in China through 2020. Appl. Energy 2017, 194, 735–750. [Google Scholar] [CrossRef]
  47. Li, S.; Liang, W.; Fu, B.; Lü, Y.; Fu, S.; Wang, S.; Su, H. Vegetation Changes in Recent Large-Scale Ecological Restoration Projects and Subsequent Impact on Water Resources in China’s Loess Plateau. Sci. Total Environ. 2016, 569–570, 1032–1039. [Google Scholar] [CrossRef] [PubMed]
  48. Wen, X.-J.; Yang, H.-J.; Liu, Y.-X.; Jiang, C. Industrialization process and ecological risk pattern in a rich energy region of northern Shaanxi, Northwest China. Chin. J. Ecol. 2013, 32, 1578–1586. [Google Scholar]
  49. Li, S.; Yang, S.; Liu, X.; Liu, Y.; Shi, M. NDVI-Based Analysis on the Influence of Climate Change and Human Activities on Vegetation Restoration in the Shaanxi-Gansu-Ningxia Region, Central China. Remote Sens. 2015, 7, 11163–11182. [Google Scholar] [CrossRef]
  50. Ding, Z.; Yao, S. Assessing the Ecological Effectiveness of Sloping Land Conversion Programme to Identify Vegetation Restoration Types: A Case Study of Northern Shaanxi Loess Plateau, China. Ecol. Indic. 2022, 145, 109671. [Google Scholar] [CrossRef]
Figure 1. The location of the Shaanxi Province.
Forests 14 02348 g001
Figure 2. The structure of the study framework.
Forests 14 02348 g002
Figure 3. Restoration feasibility results for the study area. (ad) are vegetation coverage, distance to road, distance to habitation, and restoration feasibility, respectively.
Forests 14 02348 g003
Figure 4. Human activity intensity in Shaanxi Province.
Forests 14 02348 g004
Figure 5. ERP areas in Shaanxi Province.
Forests 14 02348 g005
Table 1. Information of all data.
NameTypeTimeResolution (m)Sources
NDVIGrid2020250https://ladsweb.modaps.eosdis.nasa.gov, accessed on 1 September 2021
Population densityGrid2020250https://www.resdc.cn/, accessed on 7 September 2021
Land useGrid2020300http://maps.elie.ucl.ac.be/CCI/viewer/, accessed on 3 September 2021
Night lightingGrid2020250https://www.resdc.cn/, accessed on 7 September 2021
RoadsShapefile2020\https://www.resdc.cn/, accessed on 7 September 2021
RailroadsShapefile2020\https://www.resdc.cn/, accessed on 7 September 2021
Protected areasShapefile2020\http://www.rcees.ac.cn/, accessed on 10 September 2021
Table 2. Information of data assignment.
DataAssignmentMethod
Population density0–10popscore = 1.8527 × log(popdensity + 1)
Land use0, 2, 4, 7, 1010 points to construction land,
7 points to farmland,
4 points to grassland and bare land,
2 points to forest,
0 points to water
Night lighting0–10Natural breakpoint method
Railroads88 points within 500 m on both sides
Roads4, 8, 1010 points within 500 m on both sides
8 points within 500–1500 m on both sides
4 points within 1500–2500 m on both sides
Protected areas\Downward by 8%
Table 3. Decision strategy for ERP areas.
Human Activity Intensity
Very LowLowMiddleHighVery High
Feasibility to be restoredVery lowLPLPLPLPLP
LowLPLPLPMPMP
MiddleLPLPMPMPHP
HighLPMPMPHPHP
Very highMPMPHPHPHP
Notes: LP, MP, and HP indicate low, medium, and high priority, respectively.
Disclaimer/Publisher’s Note: The statements, opinions and data contained in all publications are solely those of the individual author(s) and contributor(s) and not of MDPI and/or the editor(s). MDPI and/or the editor(s) disclaim responsibility for any injury to people or property resulting from any ideas, methods, instructions or products referred to in the content.

