Article

Genetic Parameters and Selection Responses for Important Breeding Traits in Liquidambar formosana Based on a Provenance–Family Trial

1
State Key Laboratory of Tree Genetics and Breeding, Research Institute of Tropical Forestry, Chinese Academy of Forestry, Guangzhou 510520, China
2
School of Food Science and Engineering, South China University of Technology, Guangzhou 510640, China
3
Guangdong Eco-Engineering Polytechnic, Guangzhou 510520, China
*
Authors to whom correspondence should be addressed.
Forests 2023, 14(12), 2293; https://doi.org/10.3390/f14122293
Submission received: 3 October 2023 / Revised: 30 October 2023 / Accepted: 2 November 2023 / Published: 23 November 2023

Abstract

:
Liquidambar formosana is a multipurpose tree species native to China. There has been increasing interest in L. formosana due to its leaves being rich in shikimic acid, which plays a key role in the synthesis of the antiviral drug oseltamivir phosphate. Here, shikimic acid content (SAC) and other breeding traits, including tree height (HT), diameter at breast height (DBH), height to crown base (HCB), individual tree volume (VOL), leaf color (LC) and stem straightness degree (SSD), for 387 families of 19 provenances were evaluated in a provenance–family trial of L. formosana to estimate genetic parameters and reveal geographical variation patterns and, ultimately, screen out superior provenances and families. Differences among provenances and families were significant for all tested traits, indicating a high potential for selective breeding. Broad-sense heritabilities of provenance ( h p 2 = 0.19–0.57) and family ( h f 2 = 0.16–0.31) were moderate for most traits. Moderate to strong genetic correlations were found among HT, DBH, VOL, HCB and LC (rA = 0.339–0.982), while adverse correlations (rA = −0.494 to −0.816) were observed between SAC and growth traits. All target traits, excluding SSD, exhibited clinal variation in response to latitudinal gradients, and a clustering heatmap divided the 19 provenances into three groups. For single-trait selection, SAC persistently had the highest genetic gains (85.14%–163.57%). A weighted index based on breeding values was used to concomitantly improve SAC, HT and DBH. At a selection rate of 25%, the genetic gains at the provenance and family levels for SAC were 36.42% and 73.52%, and those for core growth traits ranged from −2.29% to 3.49% and 4.05% to 4.47%, respectively. As far as we know, this is the first study in L. formosana to explore the inheritance of SAC and its correlations with other traditional breeding traits. The genetic parameter estimations contribute to a better understanding of the genetic basis of SAC, and the superior provenances and families obtained lay a material foundation for the development of new varieties rich in shikimic acid, thereby promoting the in-depth exploitation and utilization of germplasm resources of L. formosana.

1. Introduction

Liquidambar formosana Hance, also known as Chinese sweetgum, is a large deciduous tree species in the genus Liquidambar, family Altingiaceae, and is native to the most temperate and subtropical regions of China [1]. As a valuable multipurpose tree species, it is widely used for wood production, urban landscaping, and ecological protection due to its fast growth rate, high-quality timber, diverse leaf colors and wide ecological adaptability [2]. In addition, the roots, leaves, fruits, and resin exuded from the damaged outer bark of this tree species have various medicinal properties and are commonly used in the pharmaceutical and cosmetic industries [3]. Among these organs, the leaves of L. formosana are believed to possess the effects of hemostasis, detoxification and pain relief, and thus can be used to treat dysentery, dermatosis and acute gastroenteritis, which is mainly attributed to a range of bioactive compounds, such as essential oils, flavonoids, tannins and shikimic acid [4,5].
Shikimic acid, a low-molecular-weight organic acid, has multiple physiological antithrombosis, anti-inflammatory, antioxidant and anticancer activities [6]. Moreover, it plays a key role in the synthesis of the antiviral drug oseltamivir phosphate with the trade name of Tamiflu [7,8]. In recent years, the frequent outbreaks of the novel influenza pandemic have led to a sharp increase in the clinical application and strategic stockpile of oseltamivir phosphate, and, correspondingly, the demand for shikimic acid has also increased. At present, nearly 90% of commercially available shikimic acid is extracted from Chinese star anise (Illicium verum) [9]. Although China is the main production area of Chinese star anise, germplasm resources for this plant are only distributed in a few provinces in South China due to its specific climatic and soil conditions for growth [10]. Hence, there seems to be extremely limited room for significantly increasing its yield. L. formosana contains shikimic acid, similar to its closely related species, L. styraciflua [11,12]. A previous study showed that the content of shikimic acid in the leaves of unselected individuals of L. formosana could reach 5.16%, which was higher than that in the needles of Pinus massoniana (1.17%) and in the leaves of I. verum (4.06%) and Ginkgo biloba (4.13%) [13]. Furthermore, the wide geographical distribution (i.e., abundant resource reserves) and obvious differences in habitat conditions indicate that L. formosana has a high level of genetic variability due to long-term natural selection [14]. Therefore, L. formosana has great potential as a new resource of shikimic acid, especially in combination with a selective breeding strategy to screen excellent germplasms with fast growth and rich shikimic acid and use them in production practices to meet the challenge of insufficient shikimic acid supply.
The overall goal of genetic improvement in forest tree breeding programs is to improve the economic value and productivity of planted forests [15]. In L. formosana, the main objectives of breeding programs include selection for growth and stem form [14,16], branching [17], leaf color [18] and wood properties [19]. However, there has not been any report on breeding research for shikimic acid thus far, mainly due to the time-consuming and costly determination of shikimic acid content. Genetic parameters such as variance components, trait heritability, between-trait correlations and breeding values are essential for understanding the genetic basis of traits of interest, and are crucial for evaluating the potential outcomes of future genetic gains in a tree improvement program [20,21]. Heritability is a key genetic parameter used to measure the genetic control level of a given trait [22], and some studies in L. formosana have estimated it for a wide spectrum of economic traits, including tree height, diameter at breast height, volume, crown width, branch number, bark thickness, bark percentage, stem eccentricity and wood basic density using data from individual trees [17,19,23]. It can be seen that the estimation of genetic parameters to date mostly focuses on growth and wood quality traits, which is consistent with the current main cultivation purpose of L. formosana; but shikimic acid content, an important metabolic trait that needs to be improved in this tree species, is poorly understood. Genetic variation analysis of metabolites in other trees has shown that although some metabolic traits have low heritability estimates or exhibit complex patterns [24,25], more evidence suggests that variation in metabolites falls under moderate to high levels of genetic control [26,27,28]. These results are promising in terms of the possibility of obtaining meaningful improvement in shikimic acid content through selective breeding in L. formosana. In addition, the phenotypic correlations among growth traits have been evaluated [16,29], but the genetic relationships between shikimic acid content, a novel target trait in L. formosana, and other traditional breeding traits have yet to be explored.
In the current study, shikimic acid content, growth, stem form and leaf color were assessed in a provenance–family trial established in Heyuan, Guangdong. The detailed objectives of this work were (1) to describe the overall performance and variation level of these target traits; (2) to estimate variance components and heritability for various traits; (3) to assess the phenotypic and genetic correlations between traits; (4) to preliminarily reveal the geographic variation patterns of breeding traits; and (5) to calculate genetic gains under different selection intensities at the provenance and family levels based on the ranking of breeding values or a weighted index. As far as we know, this study is the first to explore the inheritance of shikimic acid content and its correlations with other traditional breeding traits in L. formosana. The results reported here will contribute to the knowledge of the genetic basis of shikimic acid content and promote the genetic improvement of shikimic acid content in this species.

2. Materials and Methods

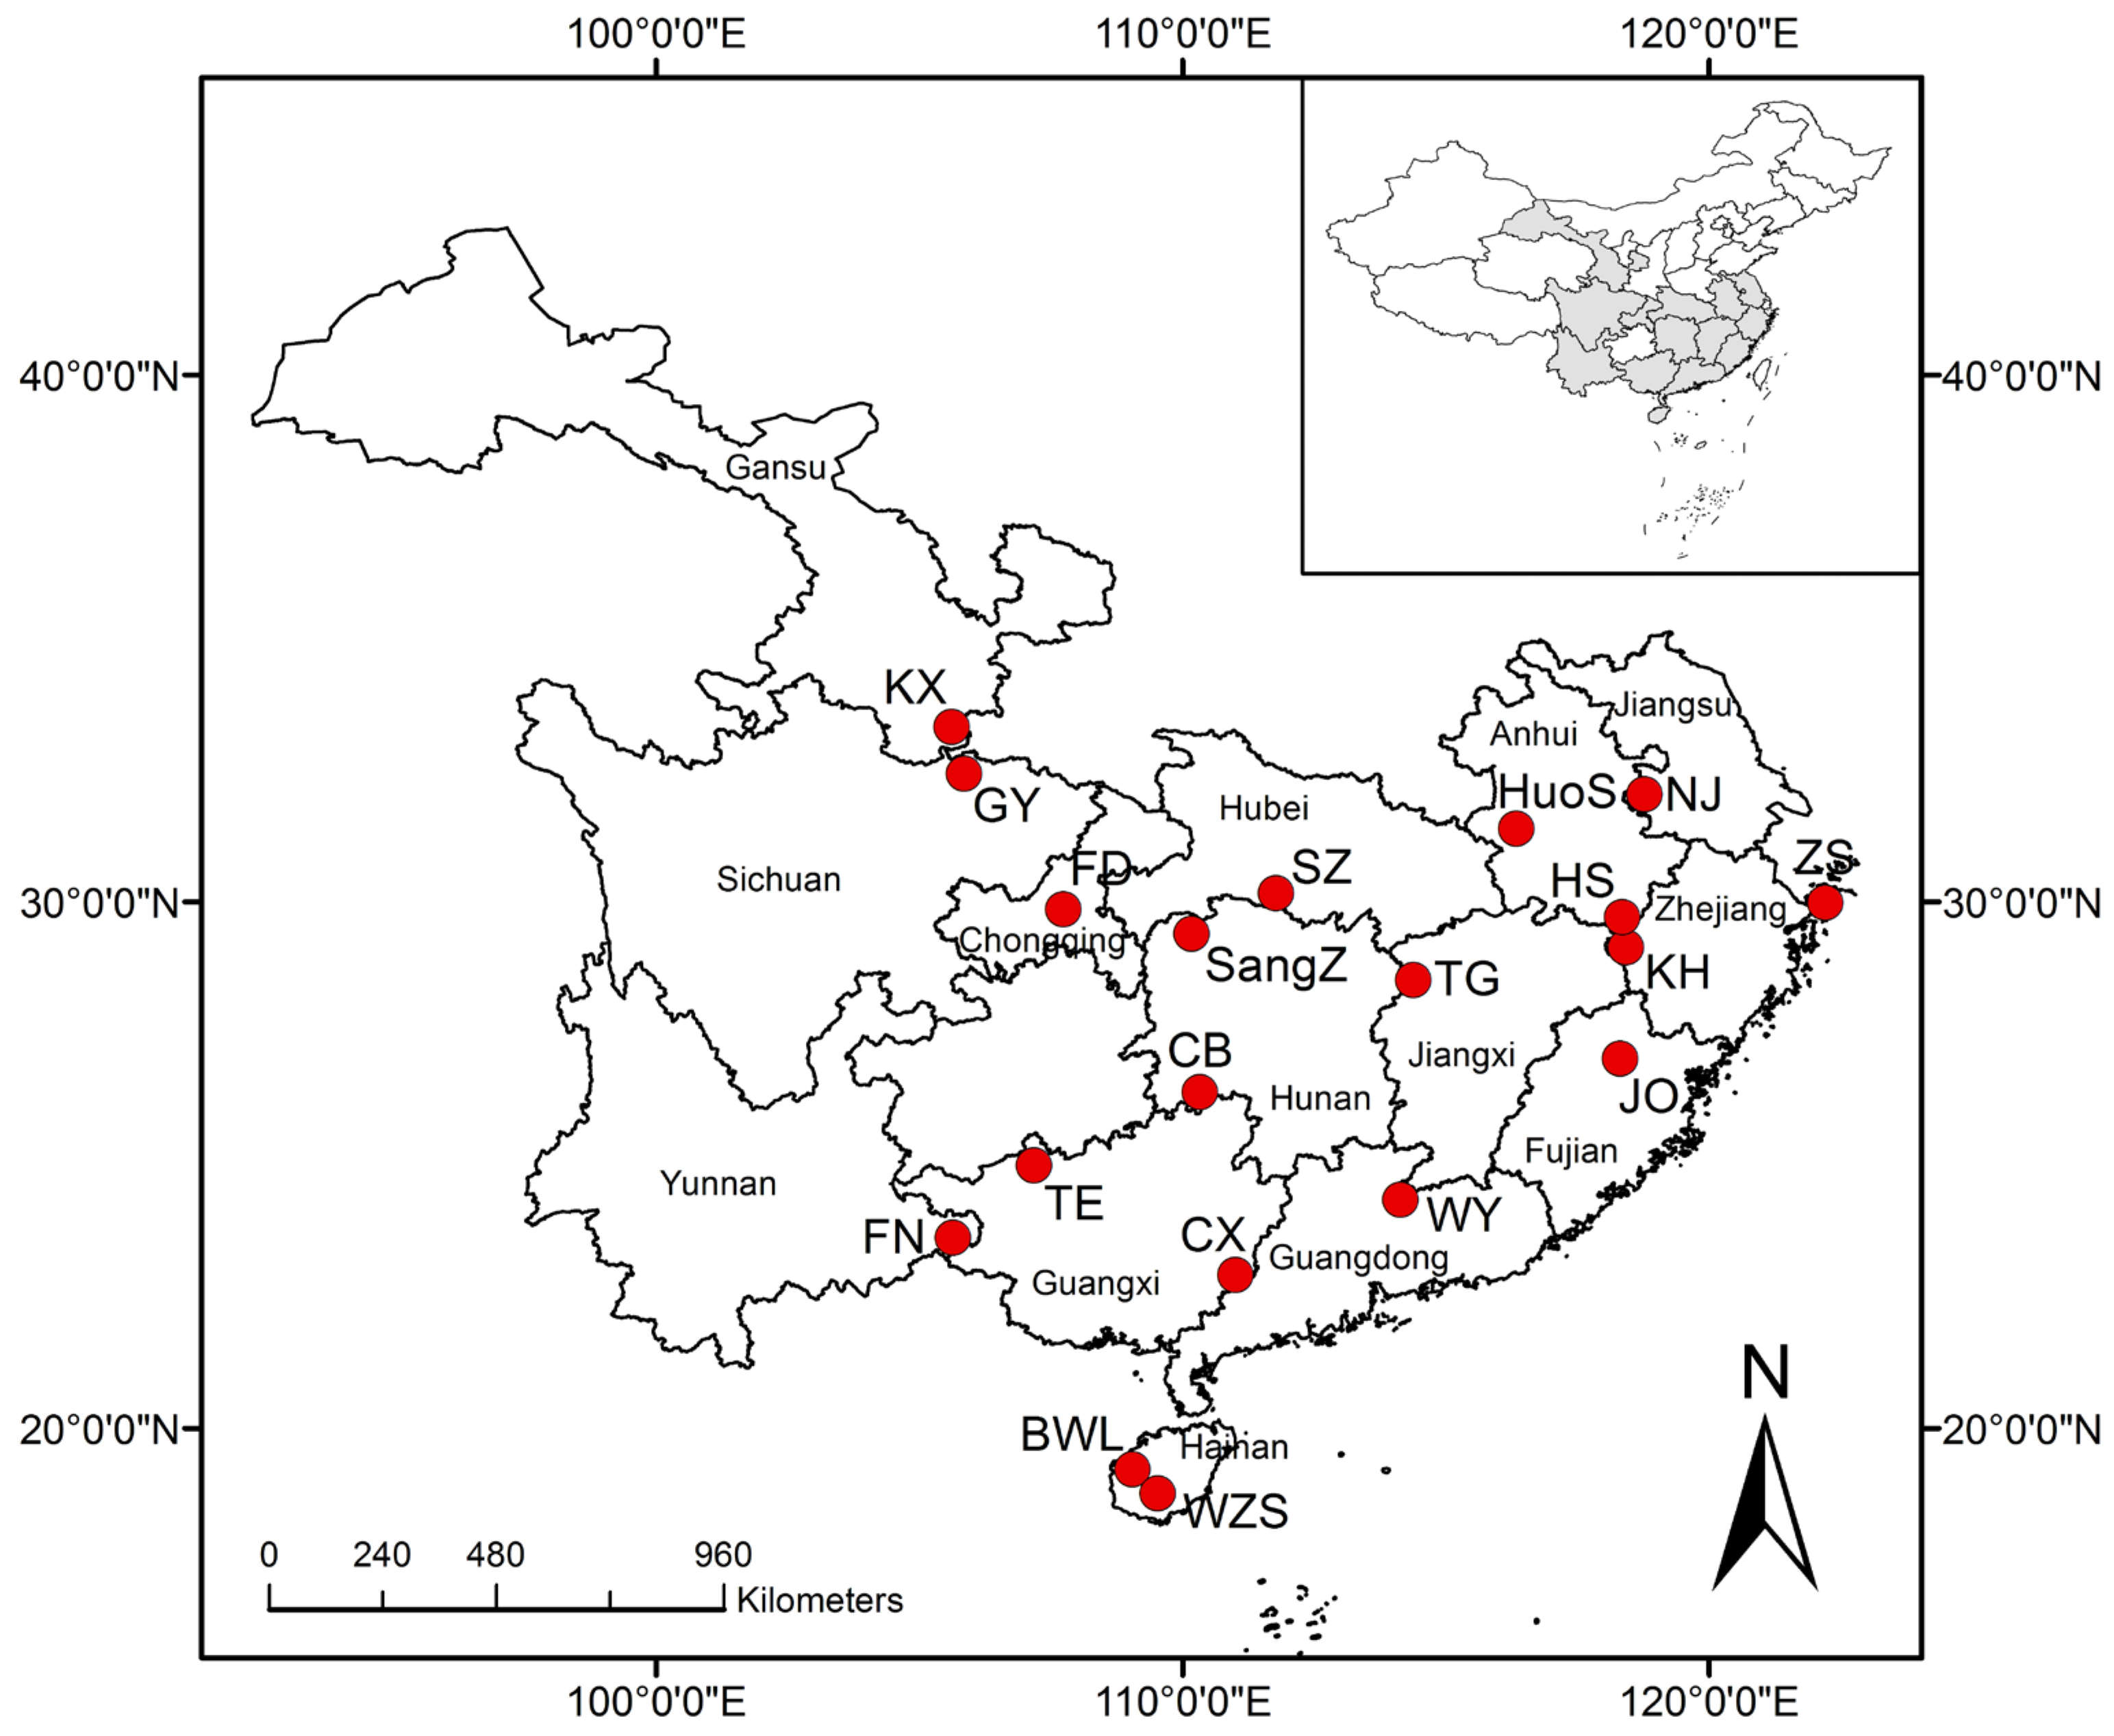
2.1. Genetic Material, Field Trial and Experimental Design

An L. formosana provenance–family trial comprising 534 open-pollinated families of 30 provenances was established in May 2008 at Heyuan, Guangdong, China (latitude 23°38′20″ N, longitude 114°38′45″ E; elevation 120–270 m). The number of families per provenance ranged from 1 to 34. The seeds of each family were collected separately from an excellent maternal tree selected among natural stands almost across the whole distribution area of the species, with a spacing of at least 100 m between the maternal trees. The trial site experiences a subtropical monsoon climate with a mean annual temperature of 20.9–21.5 °C, and annual precipitation of 1600–1900 mm. The soil type is lateritic red soil with a thickness of 30–50 cm. The analysis of soil samples before planting indicated that the soil was acidic (pH = 4.35), containing 29.22 g/kg organic matter, 0.81 g/kg total nitrogen, 1.80 mg/kg available phosphorus and 80.38 mg/kg available potassium. The trial was deployed following a randomized complete block design and represented by three blocks of four tree plots with a spacing of 2 m within rows and 3 m between rows. Michelia macclurei was planted on the periphery of the blocks for protection. Approximately 250 g of superphosphate was used per tree as basal fertilizer. Manual weed control was conducted at 2 months, 1 year and 2 years after planting, accompanied by the application of 150, 200 and 250 g of compound fertilizer for each individual plant, respectively.

2.2. Shikimic Acid Extraction and Determination

During October 2019, healthy and mature leaves were randomly collected from the middle-upper part of the crown of a well-grown individual selected from each family in the three blocks for shikimic acid extraction. A total of 60–80 g of leaf material was sampled and cleaned and then placed in an oven at 80 °C until constant in weight. The dried leaves from each tree were ground to a fine powder using a multifunctional grinder and transferred to a sealable bag for room temperature storage. Then, 0.1 g of the powdered leaves was accurately weighed using an electronic balance, and extraction was performed with 100 mL of 50% ethanol using a Soxhlet extractor (JT-SXT-06, Jutong, Hangzhou, China) at 96 °C for 3 h. The extraction solution containing shikimic acid was subjected to filtration and distillation, and the final volume was adjusted to 50 mL with distilled deionized water. Samples were stored at 4 °C until liquid chromatography–tandem mass spectrometry (LC–MS/MS) analysis.
Quantification of shikimic acid was carried out on a SCIEX ExionLC AC system coupled to an API 4000 QTRAP mass spectrometer (AB SCIEX, Foster City, CA, USA) equipped with an electrospray ionization source. The column used for chromatographic separation was a Kinetex C18 column with an inner diameter of 2.1 mm, a length of 100 mm and a particle size of 2.6 μm (Phenomenex, Torrance, CA, USA). A mobile phase consisting of (A) 0.1% formic acid in water and (B) methanol was applied at a flow rate of 0.4 mL/min. The elution was conducted with a gradient as follows: B started with 5% and was held for 1 min, was increased to 95% by 3 min and then was kept at 95% for 4 min. The column was returned to its initial condition with 2 min of equilibration, giving a total of 9 min for each run. The injection volume was 5 μL, and the column temperature was set at 40 °C. The mass spectrometer was run in negative ionization mode, and the parameters were as follows: ion source temperature of 550 °C, ion spray voltage of −4500 V, curtain gas of 25 psi, collision gas of medium, gas 1 and 2 both at 55 psi, de-clustering potential of −40 V, entrance potential of −10 V, collision energy of −20 V, and collision cell exit potential of −16 V. The precursor and product ions used for multiple reaction monitoring (MRM) were 173 > 110.8 and 173 > 92.8 for shikimic acid. Before injection, the samples were diluted 5–200 times to ensure that their diluted concentrations fell within the linear range of the standard curve (100–1600 ng/mL). Analyst 1.6.3 software, provided by AB SCIEX LC–MS/MS, was used to quantify the concentration of the analyte.
The shikimic acid content (SAC) in each individual was calculated according to the following equation, where k is the dilution ratio (5–200), c is the concentration of each sample after dilution (g/mL) and m stands for the weight of leaf powder used for extraction (approximately 0.1 g).
SAC   ( % ) = k × c × 50 m × 100 %

2.3. Other Breeding Trait Measurements

All trees were investigated after the 2019 growing season at 12 years old. Growth traits, including tree height (HT, m), diameter at breast height (DBH, cm), and height to crown base (HCB, m), were measured according to international standards. Individual tree volume (VOL, dm3) was calculated using the following volume formula [29]:
VOL = 0.052764291 × DBH1.8821611 × HT1.0093166
Leaf color (LC) was scored from 1 to 5 (1 = green, 2 = yellow–green, 3 = yellow, 4 = yellow–red or light red, 5 = red or purple–red). For stem straightness degree (SSD), trees were divided into 5 classes (1 = completely straight stem, 2 = one slight bending point in the stem, 3 = two slight bending points in the stem, 4 = one obvious bending point in the stem, 5 = more than two obvious bending points in the stem).

2.4. Statistical Analysis

Trait measurement data from provenances with fewer than 10 families were excluded from statistical analysis to reduce the impact of data imbalance on genetic parameter estimations. Finally, data for 387 families of 19 provenances were retained. The geographic distribution and family information of different provenances are shown in Table 1 and Figure 1. Among the seven traits, the two that required transformation were LC and SSD, both of which were implemented as log(x + 1) to approximate the normality of residuals. One-way analyses of variance (ANOVA) and Duncan’s multiple comparisons tests were carried out using R software version 4.2.0 [30].
Correlations between provenance means for each trait and geoclimatic factors, including longitude, latitude, altitude, annual mean temperature, and annual precipitation, were detected using Kendall’s nonparametric rank correlation coefficient (R). Clustering analysis among 19 provenances was performed using the complete method, and the Euclidean distance among provenances was calculated using the standardized provenance means. The R packages ‘ggplot2′ and ‘pheatmap’ [31,32] were used to generate a scatter diagram and a clustering heatmap, respectively.
The ASReml-R 4.0 package [33] was used to estimate the variance and covariance components for all phenotypic traits by fitting the following mixed linear model:
Yijkl = μ + Bi + Pj + Fk(j) + eijkl
where Yijkl is the phenotypic observation on the lth tree from the kth family within the jth provenance in the ith block. μ is the overall mean; Fk(j) is the random effect of the kth family within the jth provenance; Pj is the random effect of the jth provenance; Bi is the fixed effect of the ith block; and eijkl is the random error.
For each trait, broad-sense heritability of provenance ( h p 2 ), family ( h f 2 ), and narrow-sense individual heritability ( h i 2 ), as well as phenotypic (CVP) and genetic (CVG) coefficients of variation, were estimated as follows:
h p 2 = σ p 2 σ p 2 + σ e 2 r
h f 2 = σ f 2 σ f 2 + σ e 2 r
h i 2 = 4 σ f 2 σ p h 2 = 4 σ f 2 σ p 2 + σ f 2 + σ e 2
CVP = σ p h 2 X ¯ × 100 %
CVG = 4 h f 2 X ¯ × 100 %
where σ p 2 , σ f 2 , σ e 2 and σ P h 2 are the variance components for provenance, family within provenance, residual error and phenotype, respectively; r and X ¯ represent the number of blocks (3 in this study) and overall mean of traits, respectively.
Additive genetic (rA) and phenotypic (rP) correlations between traits were calculated as:
r A = C o v G ( x , y ) σ G 2 ( x ) × σ G 2 ( y )
r P = C o v P ( x , y ) σ P 2 ( x ) × σ P 2 ( y )
where C o v G ( x , y ) and C o v P ( x , y ) are the additive genetic covariance and phenotypic covariance between traits x and y; σ G 2 ( x ) and σ G 2 ( y ) are the additive genetic variances of traits x and y; and σ P 2 ( x ) and σ P 2 ( y ) are the phenotypic variances of traits x and y, respectively. All these variances and covariances were estimated using the mixed linear model described above.
The estimated breeding values of provenances or families were obtained using the method of best linear unbiased prediction (BLUP) and were then used for selection in the following two scenarios:
(i) Selection for each independent trait. The breeding values of SSD were ranked in ascending order (where the top provenances or families showed the lowest values), while the other traits were ranked in descending order (where the provenances or families with the highest values were ranked first). Single-trait selection was then implemented at the levels of provenance and family based on the selection rate.
(ii) Index selection based on SAC and core growth traits (HT and DBH). The centered and scaled breeding values (Z scores) of the provenances or families were calculated. An index was constructed using the Z scores of the traits of SAC, HT and DBH with weights equal to 0.60, 0.15 and 0.25, respectively. The best provenances or families correspond to those whose index value was the highest.
The index used for multi-trait selection was denoted as:
Indexi = Z(i×j) W(j×1)
where Z is a matrix of the Z scores for provenance or family i for each of the j traits, and W is a vector of length j for the weights assigned to each trait.
Genetic gain (ΔG) was quantified as follows:
Δ G = x ¯ X ¯ X ¯ × 100 %
where x ¯ is the mean of traits for selected provenances or families and X ¯ is the mean of traits for all provenances or families.

3. Results

3.1. Trait Variation, Variance Components and Heritability

The number of observations, overall means and ranges, phenotypic (CVP) and genetic (CVG) coefficients of variation, and results of nested ANOVA for each trait are given in Table 2. The mean values of SAC, HT, DBH, VOL, HCB, LC and SSD were 2.03%, 6.30 m, 6.46 cm, 15.32 dm3, 2.17 m, 1.69 and 3.04, respectively. The CVP was higher than the CVG for all traits studied. SSD showed the smallest phenotypic variation (CVP = 21.34%), followed by LC and HT (CVP = 32.69% to 34.90%), while the largest phenotypic variation was observed for VOL (CVP = 101.65%) and SAC (CVP = 104.06%). The genetic variation in these traits presented the same trend, with SSD and SAC having the least (CVG = 10.40%) and the most (CVG = 65.12%), respectively. Differences among provenances and families were statistically significant (p < 0.01) for all target breeding traits (Table 2), indicating a high potential for genetic improvement through deliberate selection at both the provenance and family levels.
An overview of variance components and heritability estimates for each trait is shown in Table 3. Among the different variance components, the contribution of error variance to the total phenotypic variance was always the largest, implying the importance of environmental effects in influencing the expression of these traits. The broad-sense provenance heritability ( h p 2 ) ranged from 0.19 for SSD to 0.57 for HT, while broad-sense family heritability ( h f 2 ) was lower, with a range of 0.16–0.31, mainly attributed to the variance associated with provenance being consistently higher than that related to family. The magnitude of narrow-sense individual heritability ( h i 2 ) varied from 0.17 to 0.39, which was moderate for all traits except VOL, reflecting that most traits of concern were under moderate genetic control. The estimated standard errors of heritability for SAC (0.10–0.15) were higher than those for other traits (0.03–0.09), probably as a result of the fewer samples measured than for other traits (Table 3).

3.2. Genetic and Phenotypic Correlations between Traits

In most cases, the genetic correlations (rA) between the selected traits were markedly higher than their corresponding phenotypic correlations (rP), although both correlations were similar in direction (Table 4). Moderate to strong and positive correlations (rA = 0.705 to 0.982, rP = 0.347 to 0.932) were found between growth traits that included HT, DBH, VOL and HCB. Genetic and phenotypic correlations between LC and growth traits were significantly positive (rA = 0.339 to 0.835, rP = 0.123 to 0.177), suggesting that trees with better growth performance will be more likely to appear red or purple–red in autumn. In contrast, correlations between SAC and growth traits were significantly negative (rA = −0.494 to −0.816, rP = −0.226 to −0.401), reflecting that selection for increased SAC will probably lead to a decrease in growth traits. Furthermore, a strong negative genetic correlation (rA = −0.940) and moderate negative phenotypic correlation (rP = −0.368) was observed between SAC and LC, which indicated that trees with greener leaves in autumn will have higher SAC. In addition, there were weak to moderate negative phenotypic correlations between SSD and growth traits (rP = −0.143 to −0.408), and the genetic correlations between SSD and other traits were not significant.

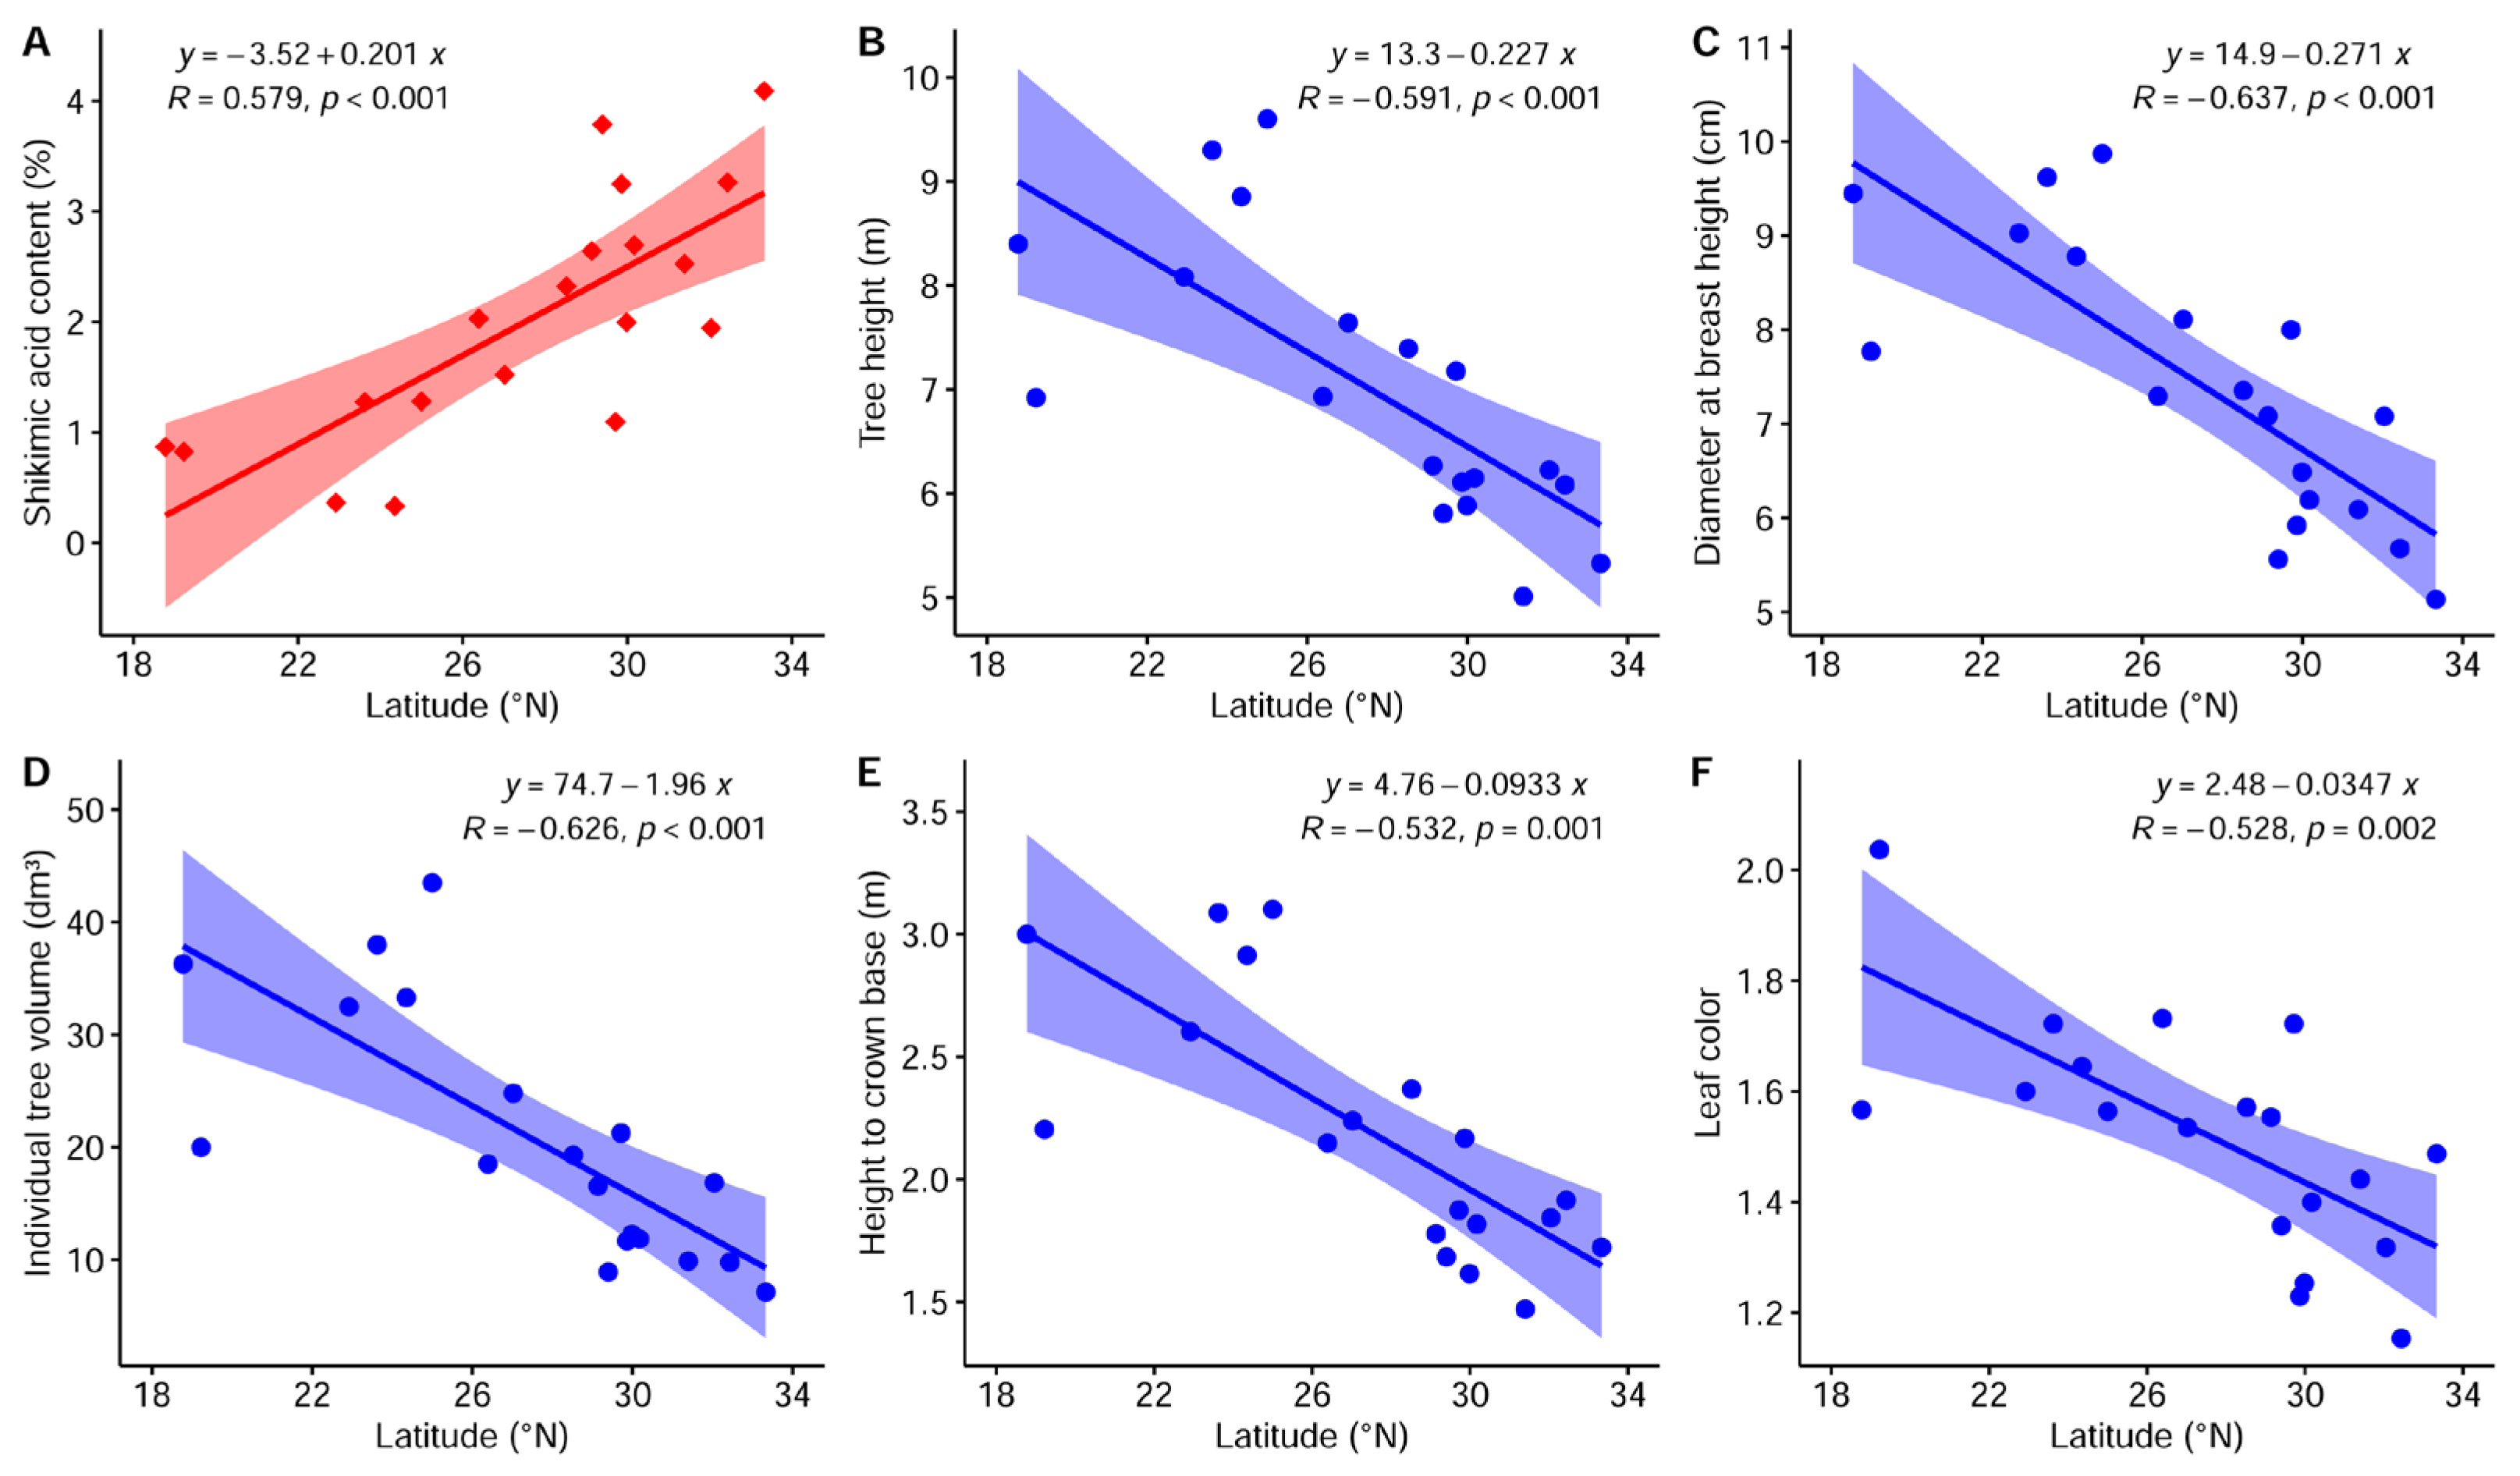
3.3. Geographical Structure of Breeding Traits

Some significant correlations between phenotypic traits and geoclimatic factors, such as longitude, latitude, altitude, annual mean temperature, and annual precipitation, were observed (Figure 2 and Figure S1). Growth traits and LC showed significant and negative correlations with latitude (R = −0.528 to −0.637, p < 0.01). Thus, provenances from higher-latitude regions perhaps had worse growth performance and greener autumn leaves. The same traits were positively correlated with annual mean temperature (R = 0.382 to 0.633, p < 0.05), which implied that trees growing in provenances with higher temperatures tended to possess better growth performance and redder autumn leaves. SAC displayed a significant positive correlation with latitude (R = 0.579, p < 0.01) and a significant negative correlation with annual mean temperature (R = −0.645, p < 0.01), indicating that provenances with higher SAC were mostly derived from higher-latitude and lower-temperature regions. SSD, although different among provenances, was not significantly correlated with any geoclimatic variables in this study. These results preliminarily demonstrated that except for SSD, the breeding target traits exhibited clinal variation in response to latitudinal gradients.
A clustering heatmap demonstrating the classification of 19 provenances was constructed on the basis of seven evaluated traits using Euclidean distance and the complete method (Figure 3). The clustering heatmap clearly distinguished all the provenances and divided them into three main groups. The first group included the provenances KH, NJ, HuoS, SZ, ZS, KX, SangZ, GY and FD with the highest average SAC (2.87%) at the group level, of which KX, SangZ and GY were the top three provenances (Tables S1 and S2). These nine provenances were located in the northern part of the distribution area of this species. The second group contained four provenances from the central region (CB, TG, JO, and HS) and one from the southern region (BWL) with the best SSD (mean: 2.92). The remaining five provenances (FN, TE, WZS, CX and WY), situated in the southern region with the largest average tree size (7.89 m for HT, 8.13 cm for DBH, and 26.98 dm3 for VOL) and the reddest autumn leaves (mean: 1.88), but the lowest SAC (mean: 0.87%), were assigned to the third group.

3.4. Genetic Gains under Different Selection Scenarios

Two selection rates of 5% and 15% were considered for the estimation of genetic gains for each independent trait based on the ranked breeding values of provenances and families (Table 5, Tables S3 and S4). When 5% of the best provenances were selected, the predicted genetic gain could reach 19.94% for SSD to 103.94% for SAC. For other traits, the genetic gains ranged from 20.58% to 96.33%. As expected, the genetic gains decreased for all breeding goal traits at a 15% selection rate. The highest genetic gain could reach 85.14% for SAC, while that for SSD would be the lowest, with a value of 14.41%. Similarly, when the top 5% and 15% of families were screened out, the genetic gains for all traits ranged from 28.34% to 163.57% and 22.71% to 117.71%, respectively.
Weights and standardized breeding values were used to generate a weighted index by which to rank provenances or families and further investigate the changes in genetic gains of SAC and core growth traits (HT and DBH) under different selection rates, aiming to simultaneously improve these traits. At the provenance level, as the gains for SAC decreased from 88.80% to 3.27%, the gains for HT increased from −17.29% to 3.49%, followed by fluctuations within a small range of −3.87% to 1.59% (Figure 4A). Meanwhile, the gains for DBH increased from −23.44% to −0.29%, with a trend similar to that of HT. At the family level, as the gains for SAC decreased from 150.42% to 3.51%, the gains for HT and DBH first increased from −0.45% to 4.92% and −2.04% to 5.11%, and then decreased from 4.22% to 0.90% and 4.93% to 1.13%, respectively (Figure 4B). Specifically, when the selection rate was 25%, SAC, HT and DBH could be improved simultaneously. In this case, the genetic gains at the provenance and family levels for SAC were 36.42% and 73.52%, and those for core growth traits ranged from −2.29% to 3.49% and 4.05% to 4.47%, respectively.

4. Discussion

4.1. Mean, Variation and Heritability

In this study, the SAC in leaves of L. formosana at 12 years of age averaged 2.03%. The value recorded here fell within the broad range previously reported for L. formosana and other tree species. For instance, Wang [13] found that the foliar SAC of randomly selected individuals of L. formosana was 5.16%. In L. styraciflua, the SAC obtained from leaves, seeds, bark, and debarked wood could reach 3.3%–5.7%, 2.4%–3.7%, 0.17% and 0.02%, respectively [11,12]. The SAC in the dried needles of P. sylvestris was 1.60% [34]. The extractable shikimic acid was estimated as 3.79% in Calophyllum brasiliense leaves [35]. The amount of shikimic acid in the fruits of Illicium genus was over 24% on a dry basis [8,36]. Because shikimic acid is a metabolite, the obvious differences in SAC may arise from multiple factors, such as inconsistencies in tree species, individual genotype, plant organ, sampling season, physiological age, genetic variation, soil nutrient and geoclimatic conditions, and extraction method [37,38,39]. Nevertheless, the highest SAC in this trial was 9.2%, which indicated that there was no shortage of individuals rich in shikimic acid, and selective breeding for this trait is both necessary and inevitable. The CVG is used to measure and compare the genetic variability of different quantitative traits [40,41]. The CVG for SAC was the highest (65.12%), and thus, the genetic variability or improvement potential of SAC was higher than that of other traits. Conversely, SSD had the smallest CVG (10.40%), indicating the lowest improvement potential. The values of CVG for growth traits (18.76%–42.28%) were slightly higher than those reported in previous studies on L. formosana at the age of 9 years (10.21%–36.16%) and Castanea sativa at 8 years from seed (11.96%–41.80%) [14,42]. The CVP was consistently higher than the CVG for all studied traits, reflecting the strong influence of the environment on them. This was supported by the fact that the contribution of error variance to the total phenotypic variance was always the largest for each trait.
A higher broad-sense provenance heritability ( h p 2 ) than corresponding family heritability ( h f 2 ) for each trait suggested that provenance selection might be more effective than family selection in the present study. The family heritability for SAC was the highest among the traits, with a value of 0.31, similar to that reported for Pseudotsuga menziesii ( h f 2 = 0.30) [24], but much lower than that for P. massoniana ( h f 2 = 0.90) [43]. In general, all target traits except for VOL of L. formosana possessed moderate narrow-sense individual heritability ( h i 2 = 0.24–0.39). The lowest heritability for VOL might be caused by amplified environmental effects from the joint influence of HT and DBH. The range of individual heritability estimates for growth and SSD was 0.17–0.29, which was higher than that reported for L. formosana at age 14 years ( h i 2 = 0.11–0.20) [19], but lower than that observed in the same tree species at different ages, such as ages 3 ( h i 2 = 0.27–0.43) [17], 6 ( h i 2 = 0.38–0.52) [23], and 9 ( h i 2 = 0.20–0.50) [16] years. The individual heritability values for growth traits recorded in tree species belonging to other taxa were 0.04–0.35 for Eucalyptus cloeziana [44], 0.36–0.49 for P. elliottii [45], 0.40–0.55 for Larix principis-rupprechtii [46] and 0.03–0.55 for Populus tremuloides [47]. Owing to differences in tree species and age, population size and type, experimental design and trial site environment, these estimates cannot be directly compared in a strict sense [15,44]. Nonetheless, the moderate level of heritability in conjunction with high genetic variability indicated that reasonable levels of genetic gain for these traits could be achieved through selection. To save time and cost, SAC was not measured for all individuals within a family like other breeding traits. Extraction and detection of shikimic acid for multiple trees of a family will be deployed to reduce the impact of environment and sampling errors. Moreover, it should be mentioned that only a single-site trial was adopted here, and due to genotype-by-environmental interaction variance, heritability estimates may be biased upward [21]. Therefore, multisite trial data should be collected in future studies. Meanwhile, iterative spatial analysis can be conducted to eliminate the effect of spatial heterogeneity, thereby improving genetic parameter estimates [42,48].

4.2. Genetic and Phenotypic Correlations between Traits

As expected, there were significantly positive genetic and phenotypic correlations (rA = 0.705 to 0.982, rP = 0.347 to 0.932) between growth traits, including HT, DBH, VOL and HCB, because of their inherent attributes and the way they were characterized. Similar relationships between these traits have been extensively observed in L. formosana [16] and other tree species, such as L. kaempferi [49], P. trichocarpa [50], E. cloeziana [44], and Picea mariana [51]. Given the correlations found in this analysis, DBH would be a better indicator for selecting individuals with excellent growth performance due to its moderate level of heritability and easier and more economical measurement. The current study showed strong negative correlations between SAC and growth traits (rA = −0.494 to −0.816). These undesirable correlations imply that genotypes with higher SAC tend to have poorer growth performance. Several studies have been carried out in forest trees to explore the correlation between growth and metabolites. For example, Cao et al. [52] found significant negative correlations between growth (HT and DBH) and foliar flavonoid content (quercetin and kaempferol) in Cyclocarya paliurus. Likewise, marked negative correlations were recorded between zeatin-9-glucoside and HT, crown volume, and acorn production in Quercus acutissima [53]. In contrast, nonsignificant or even positive correlations between growth and metabolic traits have also been reported [39,54]. These results show that the correlations between tree growth and different metabolites are variable in diverse species. In higher plants, shikimic acid acts as a precursor substance for the biosynthesis of aromatic amino acids and flavonoids, including anthocyanins, tannins and flavonols [55]. Previous studies have shown that the ratio of anthocyanins to chlorophyll largely determines the LC of L. formosana in autumn [56,57]. SAC had a very significant genetic association with LC and growth traits (rA = −0.494 to −0.940), indicating that trees with faster growing and redder autumn leaves will have lower SAC. One explanation for the observed genetic relationship is likely that trees with a larger size and redder autumn leaves would have a higher ratio of anthocyanins to chlorophyll, which is mainly caused by the much stronger transformation of shikimic acid into anthocyanins through a series of enzymatic reactions, ultimately leading to an obvious decrease in foliar SAC.
The negative genetic correlations between SAC and growth traits in this tree species are unfavorable and pose a challenge for simultaneously improving these traits. A trade-off between SAC and growth traits should thus be considered according to the objective in the selective breeding program of L. formosana. At the same time, it may be feasible to select some individuals that are correlation breakers [22,44], whose growth is superior and has no adverse influence on the SAC. Breeding studies of L. formosana have only been implemented for several decades. The low level of genetic improvement coupled with a widespread distribution has led to substantial variations in both SAC and growth traits in its natural populations. In addition, the progenies of interspecific hybridization in the genus Liquidambar (such as L. styraciflua × L. formosana) are superior to their parent species in many economic traits, demonstrating obvious heterosis [58]. This may provide a solution to break unfavorable correlations, allowing individuals with the desired combination of traits to be selected from numerous progenies.

4.3. Geographical Variation Patterns of Breeding Traits

In L. formosana, growth traits and LC were significantly correlated with latitude and annual mean temperature. Specifically, trees originating from provenances at lower latitudes (equivalent to higher temperature) tended to have better growth performance and redder autumn leaves than the more northerly individuals (i.e., higher latitudes and lower temperature). Similar findings for growth traits have been recorded in Fraxinus mandshurica [59], Betula platyphylla [60] and P. massoniana [61]. However, He et al. [62] found that the height of one-year-old seedlings of L. formosana presented extremely significant correlations with latitude, longitude, altitude and temperature, and ground diameter was highly correlated with latitude and temperature. The differences in correlations observed here might be associated with inconsistencies in tree ages, trait definitions and provenance trial scales. The correlation patterns between LC and geoclimatic variables for L. formosana were in agreement with the results of Zhang et al. [63], who reported that LC was negatively correlated with latitude and positively correlated with temperature in Schima superba. In contrast, SAC was positively related to latitude and negatively related to temperature in the current study, meaning that provenances derived from higher-latitude and lower-temperature regions perhaps had higher SAC. A similar tendency, but for a different metabolite (myoinositol), was observed in P. trichocarpa [64].
Hu et al. [14] divided 22 provenances into 4 districts based on the growth and quality traits of 9-year-old L. formosana. Provenances included in district I were mainly located in the southeast and southern regions, with the highest HT, DBH and VOL, and provenances classified within district III were situated in the northwest region and had the best SSD. Similarly, 19 provenances deployed in a provenance–family trial of L. formosana were distributed into three main groups using seven breeding traits measured at 12 years of age, and a clear geographic pattern with latitude-based grouping was found in this study. Adjacent provenances with similar ecological characteristics tended to be divided into the same group. As an exception, BWL from the southern region was classified into the central region, which could be attributed to the influence of microclimate, making its phenotype approach that of the central provenances. The results of cluster analysis were in line with the general tendency of correlations between the majority of traits and latitude. Provenance tests are the foundation of selective breeding, and understanding the variation patterns of provenance in forest trees can provide a direction for efficient screening of genetically improved materials [60]. In that sense, the information generated could be utilized to guide the selection process. The provenances included in the southern region have excellent tree productivity and are suitable for wood production, while those belonging to the northern region possess high SAC, making them suitable for screening germplasm rich in shikimic acid.

4.4. Response for Different Selection Scenarios

For single-trait selection at the provenance and family levels under two different selection rates, SAC persistently had the highest genetic gains (85.14%–163.57%), owing to its moderate level of heritability and high genetic variability, as previously mentioned. However, most forest tree breeding programs require simultaneous improvement of several traits [65]. Such concomitant improvement in both SAC and core growth traits is possible using a multi-trait selection method, namely a weighted index based on breeding values. The BLUP breeding values are estimated considering all the genetic relationships among individuals of a pedigree, which can maximize selection accuracy and minimize prediction errors [20]. Meanwhile, the weight for each trait in the constructed index can be reasonably adjusted based on breeding objectives, especially when there are adverse correlations between selection traits. In our study, a general trend was observed where the genetic gains for HT and DBH increased as the genetic gains for SAC decreased at both the provenance and family levels, which was a consequence of the undesirable negative correlations between these traits. Furthermore, the genetic gains for HT and DBH were relatively low at most selection rates (−6.66% to 5.11%). The selection criteria for the groups of top provenances or families were both SAC and core growth traits, but the weight assigned to growth traits was small, with a greater emphasis on SAC. When the selection rate was 25%, SAC, HT and DBH could be improved simultaneously.
Importantly, these results are specific to the population and trial site and cannot be extrapolated to other selection scenarios. The study of shikimic acid in L. formosana is in its early stages, and the economic weight is unclear. Once the economic weight is obtained from market research or breeding objective studies in the future, a more comprehensive selection index can be further applied to the genetic improvement of L. formosana. In addition, leaf biomass is closely related to the total yield of shikimic acid. However, due to limited information and resources, leaf biomass was not included in the present study, and thus, the evaluation of this trait may be required in subsequent trials.

5. Conclusions

A total of 387 families of 19 provenances were evaluated for SAC and other breeding traits at age 12 years in a provenance–family trial of L. formosana. The results showed that differences among provenances and families were significant for all tested traits, indicating a high potential for selective breeding. The heritability estimates of most traits were moderate. Adverse genetic correlations between SAC and growth traits indicated that selection for increased SAC will probably lead to a decrease in growth traits. The target traits, excluding SSD, exhibited clinal variation in response to latitudinal gradients, and 19 provenances were clearly divided into three main groups. Superior provenances and families were screened out under two selection scenarios based on BLUP breeding values. The genetic parameter estimations contribute to a better understanding of the genetic basis of SAC and the superior provenances and families obtained lay a material foundation for the development of new varieties rich in shikimic acid, thereby promoting the in-depth exploitation and utilization of germplasm resources of L. formosana.

Supplementary Materials

The following supporting information can be downloaded at: https://www.mdpi.com/article/10.3390/f14122293/s1, Table S1: Means and standard deviations for each breeding trait among 19 provenances of L. formosana; Table S2: Means and standard deviations for each breeding trait among 3 groups divided by the clustering analysis; Table S3: Breeding values of 7 target traits for 19 L. formosana provenances; Table S4: Breeding values of 7 target traits for 387 L. formosana families; Figure S1: Linear relationship between shikimic acid content (A), tree height (B), diameter at breast height (C), individual tree volume (D), height to crown base (E), or leaf color (F) and annual mean temperature. A scatter plot for stem straightness degree in association with annual mean temperature is not shown due to the nonsignificant correlation between them. Kendall’s rank correlation coefficient (R), the p value, the regression equation and the 95% confidence interval are included for each plot.

Author Contributions

Conceptualization, J.Y., J.S. and S.W.; methodology, J.Y. and J.S.; software, M.D. and L.Z.; validation, N.Y., R.L. and S.W.; formal analysis, M.D., L.Z. and N.Y.; investigation, L.Z. and R.L.; resources, J.Y.; data curation, M.D.; writing—original draft preparation, M.D.; writing—review and editing, M.D., L.Z., N.Y., R.L. and J.S.; visualization, M.D., L.Z. and N.Y.; supervision, J.Y. and J.S.; project administration, J.Y. and J.S.; funding acquisition, J.Y. All authors have read and agreed to the published version of the manuscript.

Funding

This work was supported by Forestry Science and Technology Innovation Project of Guangdong, China (2021KJCX018) and the National Nonprofit Institute Research Grant of Chinese Academy of Forestry, China (CAFYBB2022SY015).

Data Availability Statement

Not applicable.

Conflicts of Interest

The authors declare no conflict of interest.

References

  1. Sun, R.; Lin, F.; Huang, P.; Zheng, Y. Moderate genetic diversity and genetic differentiation in the relict tree Liquidambar formosana Hance revealed by genic simple sequence repeat markers. Front. Plant Sci. 2016, 7, 1411. [Google Scholar] [CrossRef] [PubMed]
  2. Li, Y.; Qi, S.; Chen, S.; Li, H.; Zhang, T.; Bao, F.; Zhan, D.; Pang, Z.; Zhang, J.; Zhao, J. Genome-wide identification and expression analysis of late embryogenesis abundant (LEA) genes reveal their potential roles in somatic embryogenesis in hybrid sweetgum (Liquidambar styraciflua × Liquidambar formosana). For. Res. 2023, 3, 12. [Google Scholar] [CrossRef]
  3. Li, Y.; Gao, Y.; Deng, L.; Lian, H.; Guo, W.; Wu, W.; Xue, B.; Li, B.; Su, Y.; Zhang, H. Volatile profiling and transcriptome sequencing provide insights into the biosynthesis of α-pinene and β-pinene in Liquidambar formosana Hance leaves. Genes 2023, 14, 163. [Google Scholar] [CrossRef] [PubMed]
  4. Lingbeck, J.M.; O’Bryan, C.A.; Martin, E.M.; Adams, J.P.; Crandall, P.G. Sweetgum: An ancient source of beneficial compounds with modern benefits. Pharmacogn. Rev. 2015, 9, 1–11. [Google Scholar]
  5. Zhu, Y.; Guan, Y.J.; Chen, Q.Z.; Yuan, L.H.; Xu, Q.Q.; Zhou, M.L.; Liu, H.; Lin, W.; Zhang, Z.D.; Zhou, Z.L.; et al. Pentacyclic triterpenes from the resin of Liquidambar formosana have anti-angiogenic properties. Phytochemistry 2021, 184, 112676. [Google Scholar] [CrossRef] [PubMed]
  6. Shi, Y.; Chen, G.; Chen, K.; Chen, X.; Hong, Q.; Kan, J. Assessment of fresh star anise (Illicium verum Hook. f.) drying methods for influencing drying characteristics, color, flavor, volatile oil and shikimic acid. Food Chem. 2021, 342, 128359. [Google Scholar] [CrossRef]
  7. Cai, M.; Luo, Y.; Chen, J.; Liang, H.; Sun, P. Optimization and comparison of ultrasound-assisted extraction and microwave-assisted extraction of shikimic acid from Chinese star anise. Sep. Purif. Technol. 2014, 133, 375–379. [Google Scholar] [CrossRef]
  8. Candeias, N.R.; Assoah, B.; Simeonov, S.P. Production and synthetic modifications of shikimic acid. Chem. Rev. 2018, 118, 10458–10550. [Google Scholar] [CrossRef]
  9. Ghosh, S.; Chisti, Y.; Banerjee, U.C. Production of shikimic acid. Biotechnol. Adv. 2012, 30, 1425–1431. [Google Scholar] [CrossRef]
  10. Lai, J.L.; Chen, X.L.; Feng, J.H.; Huang, C.N.; Bei, Y.J. First report of Alternaria tenuissima causing leaf spot on star anise (Illicium verum) in China. Plant Dis. 2020, 105, 229. [Google Scholar] [CrossRef]
  11. Enrich, L.B.; Scheuermann, M.L.; Mohadjer, A.; Matthias, K.R.; Eller, C.F.; Newman, M.S.; Fujinaka, M.; Poon, T. Liquidambar styraciflua: A renewable source of shikimic acid. Tetrahedron Lett. 2008, 49, 2503–2505. [Google Scholar] [CrossRef]
  12. Martin, E.; Duke, J.; Pelkki, M.; Clausen, E.C.; Carrier, D.J. Sweetgum (Liquidambar styraciflua L.): Extraction of shikimic acid coupled to dilute acid pretreatment. Appl. Biochem. Biotechnol. 2010, 162, 1660–1668. [Google Scholar] [CrossRef] [PubMed]
  13. Wang, Z. The Research on New Resources of Shikimic Acid and Its Isolation and Purification. Master’s Thesis, Zhejiang University, Hangzhou, China, 2010. [Google Scholar]
  14. Hu, W.; Pang, H.; Hu, X.; Wang, X.; Lin, F. Variation and selection of Liquidambar formosana based on a nine-year-old provenance test. J. Cent. South Univ. For. Technol. 2019, 39, 40–46. [Google Scholar]
  15. Ismael, A.; Klápštĕ, J.; Stovold, G.T.; Fleet, K.; Dungey, H. Genetic variation for economically important traits in Cupressus lusitanica in New Zealand. Front. Plant Sci. 2021, 12, 651729. [Google Scholar] [CrossRef]
  16. Hu, W.; Pang, H.; Hu, X.; Wang, X.; Zheng, Y. Genetic variation, excellent family and individual selection of 9-year-old Liquidambar formosana. J. Trop. Subtrop. Bot. 2018, 26, 506–514. [Google Scholar]
  17. Fang, L.; Shi, J.; Li, L.; Wu, X.; Shi, T. Analysis of genetic variation of progeny traits in Liquidambar Formosana. Sci. Silvae Sin. 2003, 39, 148–152. [Google Scholar]
  18. Zhou, W.; Xia, W.; Chen, Z.; Zhou, J.; Ni, W.; Ren, J. A new Liquidambar formosana cultivar ‘Fulu Zifeng’. Acta Hortic. Sin. 2019, 46, 2921–2922. [Google Scholar]
  19. Chen, X. Genetic variation and selection of 14-year-old Liquidambar formosana progeny. For. Res. 2015, 28, 183–187. [Google Scholar]
  20. DuVal, A.; Gezan, S.A.; Mustiga, G.; Stack, C.; Marelli, J.P.; Chaparro, J.; Livingstone, D.; Royaert, S.; Motamayor, J.C. Genetic parameters and the impact of off-types for Theobroma cacao L. in a breeding program in Brazil. Front. Plant Sci. 2017, 8, 2059. [Google Scholar] [CrossRef]
  21. Bonilla, J.L.S.; Lopes, U.V.; Colmenero, A.Z.; Valencia, B.B.M.; Arrazate, C.H.A.; Gramacho, K.P. Estimation of genetic parameters associated with frosty pod rot (Moniliophthora roreri) and cacao production in Mexico. Tree Genet. Genomes 2021, 17, 24. [Google Scholar] [CrossRef]
  22. Mustiga, G.M.; Gezan, S.A.; Phillips-Mora, W.; Arciniegas-Leal, A.; Mata-Quirós, A.; Motamayor, J.C. Phenotypic description of Theobroma cacao L. for yield and vigor traits from 34 hybrid families in Costa Rica based on the genetic basis of the parental population. Front. Plant Sci. 2018, 9, 808. [Google Scholar] [CrossRef] [PubMed]
  23. Hu, W.; Wang, X.; Hu, X.; Lin, F.; Pang, H. Early selection of fine families and individuals of Liquidambar formosana. J. Northeast For. Univ. 2017, 45, 5–11. [Google Scholar]
  24. Robinson, A.R.; Ukrainetz, N.K.; Kang, K.Y.; Mansfield, S.D. Metabolite profiling of Douglas-fir (Pseudotsuga menziesii) field trials reveals strong environmental and weak genetic variation. New Phytol. 2007, 174, 762–773. [Google Scholar] [CrossRef] [PubMed]
  25. Nantongo, J.S.; Potts, B.M.; Davies, N.W.; Fitzgerald, H.; Rodemann, T.; O’Reilly-Wapstra, J.M. Additive genetic variation in Pinus radiata bark chemistry and the chemical traits associated with variation in mammalian bark stripping. Heredity 2021, 127, 498–509. [Google Scholar] [CrossRef]
  26. Külheim, C.; Yeoh, S.H.; Wallis, I.R.; Laffan, S.; Moran, G.F.; Foley, W.J. The molecular basis of quantitative variation in foliar secondary metabolites in Eucalyptus globulus. New Phytol. 2011, 191, 1041–1053. [Google Scholar] [CrossRef]
  27. Gosney, B.J.; Potts, B.M.; O’Reilly-Wapstra, J.M.; Vaillancourt, R.E.; Fitzgerald, H.; Davies, N.W.; Freeman, J.S. Genetic control of cuticular wax compounds in Eucalyptus globulus. New Phytol. 2016, 209, 202–215. [Google Scholar] [CrossRef]
  28. Ferrão, L.F.V.; Johnson, T.S.; Benevenuto, J.; Edger, P.P.; Colquhoun, T.A.; Munoz, P.R. Genome-wide association of volatiles reveals candidate loci for blueberry flavor. New Phytol. 2020, 226, 1725–1737. [Google Scholar] [CrossRef]
  29. Ye, D. Open pollination progeny test and excellent family selection of Liquidambar formosana. J. Cent. South Univ. For. Technol. 2011, 31, 79–82. [Google Scholar]
  30. R Core Team. R: A Language and Environment for Statistical Computing; R Foundation for Statistical Computing: Vienna, Austria, 2022. [Google Scholar]
  31. Wickham, H. ggplot2: Elegant Graphics for Data Analysis; Springer: New York, NY, USA, 2016. [Google Scholar]
  32. Kolde, R. Pretty Heatmaps. R Package Version 1.0.12. 2019. Available online: https://CRAN.R-project.org/package=pheatmap (accessed on 1 January 2022).
  33. Butler, D.; Cullis, B.; Gilmour, A.; Gogel, B.; Thompson, R. ASReml-R Reference Manual Version 4; VSN International Ltd.: Hemel Hempstead, UK, 2017. [Google Scholar]
  34. Sui, R. Separation of shikimic acid from pine needles. Chem. Eng. Technol. 2008, 31, 469–473. [Google Scholar] [CrossRef]
  35. Marchiosi, R.; Ferro, A.P.; Ramos, A.V.G.; Baldoqui, D.C.; Constantin, R.P.; Constantin, R.P.; dos Santos, W.D.; Ferrarese-Filho, O. Calophyllum brasiliense Cambess: An alternative and promising source of shikimic acid. Sustain. Chem. Pharm. 2019, 14, 100188. [Google Scholar] [CrossRef]
  36. Avula, B.; Wang, Y.H.; Smillie, T.J.; Khan, I.A. Determination of Shikimic acid in fruits of illicium species and various other plant samples by LC-UV and LC-ESI-MS. Chromatographia 2009, 69, 307–314. [Google Scholar] [CrossRef]
  37. Dong, J.; Liang, Z. Analysis on the factor influencing secondary metabolite accumulation in plants. Acta Bot. Boreal-Occident Sin. 2004, 24, 1979–1983. [Google Scholar]
  38. Bochkov, D.V.; Sysolyatin, S.V.; Kalashnikov, A.I.; Surmacheva, I.A. Shikimic acid: Review of its analytical, isolation, and purification techniques from plant and microbial sources. J. Chem. Biol. 2012, 5, 5–17. [Google Scholar] [CrossRef] [PubMed]
  39. Hai, H.N.T.; Rimbawanto, A.; Prastyono; Kartikawati, N.K.; Wu, H. Genetic improvement for essential oil yield and quality in Melaleuca cajuputi. Ind. Crops Prod. 2019, 137, 681–686. [Google Scholar]
  40. Ofori, A.; Padi, F.K.; Ansah, F.O.; Akpetey, A.; Anin-Kwapong, G. Genetic variation for vigour and yield of cocoa (Theobroma cacao L.) clones in Ghana. Sci. Hortic. 2016, 213, 287–293. [Google Scholar] [CrossRef]
  41. Ghildiyal, V.; Iyiola, E.; Sharma, M.; Apiolaza, L.A.; Altaner, C. Genetic variation in drying collapse and heartwood properties at mid-rotation age of Eucalyptus globoidea. Ind. Crops Prod. 2023, 201, 116891. [Google Scholar] [CrossRef]
  42. Míguez-Soto, B.; Fernández-López, J. Genetic parameters and predicted selection responses for timber production traits in a Castanea sativa progeny trial: Developing a breeding program. Tree Genet. Genomes 2012, 8, 409–423. [Google Scholar] [CrossRef]
  43. Zhao, M.; Yan, C.; Wang, W.; Ye, J.; Zhong, Y.; Ke, Z.; Hao, X.; Ke, X.; Ye, L.; Huang, L. Relationship between selection of Pinus massoniana families and Folium Pini. China J. Chin. Mater. Med. 2015, 40, 1699–1704. [Google Scholar]
  44. Li, C.; Weng, Q.; Chen, J.B.; Li, M.; Zhou, C.; Chen, S.; Zhou, W.; Guo, D.; Lu, C.; Chen, J.C.; et al. Genetic parameters for growth and wood mechanical properties in Eucalyptus cloeziana F. Muell. New For. 2017, 48, 33–49. [Google Scholar] [CrossRef]
  45. Belaber, E.C.; Gauchat, M.E.; Rodríguez, G.H.; Borralho, N.M.; Cappa, E.P. Estimation of genetic parameters using spatial analysis of Pinus elliottii Engelm. var. elliottii second-generation progeny trials in Argentina. New For. 2019, 50, 605–627. [Google Scholar]
  46. Dong, M.; Fan, Y.; Wu, Z.; Lv, F.; Zhang, J. Age–age correlations and early selection for growth traits in 40 half-sib families of Larix principis-rupprechtii. J. For. Res. 2019, 30, 2111–2117. [Google Scholar] [CrossRef]
  47. Ding, C.; Hamann, A.; Yang, R.C.; Brouard, J.S. Genetic parameters of growth and adaptive traits in aspen (Populus tremuloides): Implications for tree breeding in a warming world. PLoS ONE 2020, 15, e0229225. [Google Scholar] [CrossRef] [PubMed]
  48. Díaz, R.; Zas, R.; Fernández-López, J. Genetic variation of Prunus avium in susceptibility to cherry leaf spot (Blumeriella jaapii) in spatially heterogeneous infected seed orchards. Ann. For. Sci. 2007, 64, 21–30. [Google Scholar] [CrossRef]
  49. Lai, M.; Sun, X.; Chen, D.; Xie, Y.; Zhang, S. Age-related trends in genetic parameters for Larix kaempferi and their implications for early selection. BMC Genet. 2014, 15, S10. [Google Scholar] [CrossRef]
  50. Mckown, A.D.; Guy, R.D.; Klápště, J.; Geraldes, A.; Friedmann, M.; Cronk, Q.C.B.; El-Kassaby, Y.A.; Mansfield, S.D.; Douglas, C.J. Geographical and environmental gradients shape phenotypic trait variation and genetic structure in Populus trichocarpa. New Phytol. 2014, 201, 1263–1276. [Google Scholar] [CrossRef] [PubMed]
  51. Wang, J.J.; Weng, Y.H.; Krasowski, M.; Yan, G.H.; Fullarton, M. Genetic parameters of growth and stem forking for black spruce progeny tested in New Brunswick, Canada. New For. 2018, 49, 265–277. [Google Scholar] [CrossRef]
  52. Cao, Y.; Deng, B.; Fang, S.; Shang, X.; Fu, X.; Yang, W. Genotypic variation in tree growth and selected flavonoids in leaves of Cyclocarya paliurus. South. For. 2018, 80, 67–74. [Google Scholar] [CrossRef]
  53. Kang, J.W.; Lee, H.; Lim, H.; Lee, W.Y. Identification of potential metabolic markers for the selection of a high-yield clone of Quercus acutissima in clonal seed orchard. Forests 2018, 9, 116. [Google Scholar] [CrossRef]
  54. King, D.J.; Gleadow, R.M.; Woodrow, I.E. The accumulation of terpenoid oils does not incur a growth cost in Eucalyptus polybractea seedlings. Funct. Plant Biol. 2006, 33, 497–505. [Google Scholar] [CrossRef]
  55. Maeda, H.; Dudareva, N. The shikimate pathway and aromatic amino acid biosynthesis in plants. Annu. Rev. Plant Biol. 2012, 63, 73–105. [Google Scholar] [CrossRef]
  56. Wen, C.H.; Lin, S.S.; Chu, F.H. Transcriptome analysis of a subtropical deciduous tree: Autumn leaf senescence gene expression profile of formosan gum. Plant Cell Physiol. 2015, 56, 163–174. [Google Scholar] [CrossRef] [PubMed]
  57. Tang, S.; Chen, H.; Qin, Y.; Yang, Z.; Wang, T.; Wei, B. Physiological basis of Liquidambar formosana leaves during leaf color transformation in autumn. Guihaia 2021, 41, 2061–2068. [Google Scholar]
  58. Qi, S.; Zhao, R.; Yan, J.; Fan, Y.; Huang, C.; Li, H.; Chen, S.; Zhang, T.; Kong, L.; Zhao, J.; et al. Global transcriptome and coexpression network analyses reveal new insights into somatic embryogenesis in hybrid sweetgum (Liquidambar styraciflua × Liquidambar formosana). Front. Plant Sci. 2021, 12, 751866. [Google Scholar] [CrossRef]
  59. Zhao, X.; Xia, D.; Zeng, F.; Yao, S.; Shang, Y.; Zhang, G.; Wang, Y.; Zhang, T.; Zhan, Y. Provenances by sites interaction of growth traits and provenance selection of Fraxinus mandshurica. Sci. Silvae Sin. 2015, 51, 140–147. [Google Scholar]
  60. Liu, Y.; Xu, H.; Shang, F.; Jiao, H.; Zhang, L.; Luo, J.; Teng, W.; Liu, G. Variation and zoning of 16-year-old Betula platyphylla provenance. Sci. Silvae Sin. 2016, 52, 48–56. [Google Scholar]
  61. Hu, X.; Wu, F.; Sun, X.; Chen, H.; Yin, A.; Ji, K. Joint analysis of growth and wood property of 38-year-old Pinus massoniana from 55 provenance. J. Nanjing For. Univ. 2022, 46, 203–212. [Google Scholar]
  62. He, Q.; Fang, R.; Li, W.; Xia, Y.; Zhang, Y.; Shi, C.; Yang, S. Geographical variation of growth traits of Liquidambar formosana seedlings from different provenances. J. Plant Resour. Environ. 2019, 28, 88–95. [Google Scholar]
  63. Zhang, P.; Jin, G.; Zhou, Z.; Yu, L.; Fan, H. Provenance difference and geographic variation pattern for seedling trait of Schima superba. For. Res. 2004, 17, 192–198. [Google Scholar]
  64. Guerra, F.P.; Richards, J.H.; Fiehn, O.; Famula, R.; Stanton, B.J.; Shuren, R.; Sykes, R.; Davis, M.F.; Neale, D.B. Analysis of the genetic variation in growth, ecophysiology, and chemical and metabolomic composition of wood of Populus trichocarpa provenances. Tree Genet. Genomes 2016, 12, 6. [Google Scholar] [CrossRef]
  65. Chen, Z.Q.; Karlsson, B.; Mörling, T.; Olsson, L.; Mellerowicz, E.J.; Wu, H.X.; Lundqvist, S.O.; Gil, M.R.G. Genetic analysis of fiber dimensions and their correlation with stem diameter and solid-wood properties in Norway spruce. Tree Genet. Genomes 2016, 12, 123. [Google Scholar] [CrossRef]
Figure 1. Geographical distribution of 19 L. formosana provenances. The location of each provenance is indicated by a solid red circle, and the black lines represent administrative divisions among different provinces in China.
Forests 14 02293 g001
Figure 2. Linear relationship between shikimic acid content (A), tree height (B), diameter at breast height (C), individual tree volume (D), height to crown base (E), or leaf color (F) and latitude. A scatter plot for stem straightness degree in association with latitude is not shown due to the nonsignificant correlation between them. Kendall’s rank correlation coefficient (R), the p value, the regression equation and the 95% confidence interval are included for each plot.
Forests 14 02293 g002
Figure 3. A clustering heatmap demonstrating the classification of 19 provenances and 7 evaluated traits of L. formosana. Rows and columns represent provenances and traits, respectively. Each cell with a different color represents a normalized Z score for phenotypic data.
Forests 14 02293 g003
Figure 4. Genetic gains (ΔG) for shikimic acid content (SAC), height (HT) and diameter at breast height (DBH) under different selection rates at the levels of provenance (A) and family (B).
Forests 14 02293 g004
Table 1. Number of families and principal geoclimatic characteristics of 19 L. formosana provenances used in the study.
ProvenanceCodeNo. of FamiliesLongitude (°E)Latitude (°N)Altitude (m)Tmean (°C)Prec
Bawangling, HainanBWL20109.0419.22139021.31657
Cenxi, GuangxiCX16110.9922.9218021.41450
Chengbu, HunanCB17110.3226.39100917.61600
Fengdu, ChongqingFD24107.7329.86104418.31123
Funing, YunnanFN24105.6323.6367919.81103
Guangyuan, SichuanGY21105.8432.44122516.1950
Huangshan, AnhuiHS23118.3429.72186417.91697
Huoshan, AnhuiHuoS17116.3331.3940615.21400
Jianou, FujianJO23118.3127.0260819.31600
Kaihua, ZhejiangKH21118.4229.1450716.41830
Kangxian, GansuKX18105.6133.33118411.5757
Nanjing, JiangsuNJ20118.7732.041716.21106
Sangzhi, HunanSangZ23110.1629.40109216.31447
Songzi, HubeiSZ21111.7730.1714516.51200
Tiane, GuangxiTE17107.1725.0032219.71078
Tonggu, JiangxiTG14114.3728.5243316.41771
Wengyuan, GuangdongWY14114.1324.3514120.61778
Wuzhishan, HainanWZS23109.5218.78186722.41690
Zhoushan, ZhejiangZS31122.2129.99316.71222
Tmean, annual mean temperature; Prec, annual precipitation.
Table 2. Descriptive statistics and variance analysis for the traits investigated in the provenance–family trial of L. formosana.
TraitNMean ± SDMinimumMaximumCVP (%)CVG (%)F Value
ProvenanceFamily
SAC (%)9672.03 ± 2.100.09.2104.0665.1220.43 **1.37 **
HT (m)33426.30 ± 2.231.314.134.9018.8166.87 **1.92 **
DBH (cm)33396.46 ± 2.461.018.438.0818.7657.83 **1.77 **
VOL (dm3)333915.32 ± 15.640.1164.8101.6542.2859.14 **1.55 **
HCB (m)33362.17 ± 1.170.19.052.7628.7551.75 **1.82 **
LC26261.69 ± 0.951.05.032.6917.5915.82 **1.56 **
SSD33383.04 ± 1.151.05.021.3410.4015.28 **1.57 **
N, number of observations; Mean, mean value; SD, stand deviation; CVP (%), phenotypic coefficient of variation; CVG (%), genetic coefficient of variation; SAC, shikimic acid content; HT, tree height; DBH, diameter at breast height; VOL, individual tree volume; HCB, height to crown base; LC, leaf color; SSD, stem straightness degree. ** p < 0.01 of significance.
Table 3. Variance components for provenance ( σ p 2 ), family ( σ f 2 ), residual error ( σ e 2 ), phenotype ( σ P h 2 ), broad-sense heritability of provenance ( h p 2 ), family ( h f 2 ), and narrow-sense individual heritability ( h i 2 ) and their standard errors for studied traits.
Trait
σ p 2
σ f 2
σ e 2
σ P h 2
h p 2
h f 2
h i 2
SAC1.10550.43692.92064.46300.53 (0.11)0.31 (0.10)0.39 (0.15)
HT1.37110.35163.12034.84310.57 (0.09)0.25 (0.04)0.29 (0.06)
DBH1.44770.36664.22816.04240.51 (0.09)0.21 (0.04)0.24 (0.05)
VOL61.700910.4925170.4696242.66300.52 (0.09)0.16 (0.03)0.17 (0.04)
HCB0.29310.09700.91651.30670.49 (0.09)0.24 (0.03)0.30 (0.05)
LC0.00140.00130.01500.01770.22 (0.07)0.20 (0.04)0.29 (0.06)
SSD0.00110.00090.01380.01580.19 (0.06)0.17 (0.03)0.24 (0.05)
SAC, shikimic acid content; HT, tree height; DBH, diameter at breast height; VOL, individual tree volume; HCB, height to crown base; LC, leaf color; SSD, stem straightness degree.
Table 4. Genetic (upper triangle) and phenotypic (lower triangle) correlations between selected traits of L. formosana.
TraitSACHTDBHVOLHCBLCSSD
SAC −0.739 **−0.816 **−0.734 **−0.494 **−0.940 **0.102
HT−0.367 ** 0.942 **0.977 **0.816 **0.731 **−0.177
DBH−0.401 **0.844 ** 0.982 **0.705 **0.835 **0.147
VOL−0.358 **0.870 **0.932 ** 0.772 **0.766 **0.106
HCB−0.226 **0.543 **0.347 **0.400 ** 0.339 *−0.212
LC−0.368 **0.177 **0.167 **0.128 **0.123 ** 0.090
SSD0.032−0.408 **−0.293 **−0.293 **−0.143 **−0.039
SAC, shikimic acid content; HT, tree height; DBH, diameter at breast height; VOL, individual tree volume; HCB, height to crown base; LC, leaf color; SSD, stem straightness degree. * p < 0.05 of significance; ** p < 0.01 of significance.
Table 5. Genetic gains (ΔG) for each independent trait under two different selection rates at the provenance and family levels.
TraitTop 5% ProvenanceTop 15% ProvenanceTop 5% FamilyTop 15% Family
MeanΔG (%)MeanΔG (%)MeanΔG (%)MeanΔG (%)
SAC4.09103.943.7185.145.35163.574.42117.71
HT8.5134.258.2930.838.3132.527.6922.71
DBH8.4730.928.2928.278.5233.157.9624.37
VOL30.4496.3328.6284.5933.22121.5127.5883.90
HCB3.3854.473.1544.043.6971.703.1546.41
LC2.0220.582.0220.262.6156.282.4244.75
SSD a2.4419.942.6014.412.1828.342.3024.32
SAC, shikimic acid content; HT, tree height; DBH, diameter at breast height; VOL, individual tree volume; HCB, height to crown base; LC, leaf color; SSD, stem straightness degree. a Absolute value of genetic gains were taken for SSD, as a low phenotypic value for this trait was favorable.
Disclaimer/Publisher’s Note: The statements, opinions and data contained in all publications are solely those of the individual author(s) and contributor(s) and not of MDPI and/or the editor(s). MDPI and/or the editor(s) disclaim responsibility for any injury to people or property resulting from any ideas, methods, instructions or products referred to in the content.

