Article

Phosphorus Rather than Nitrogen Addition Changed Soil Cyanobacterial Community in a Tropical Secondary Forest of South China

1
Guangdong Energy Group Science and Technology Research Institute Co., Ltd., Guangzhou 510630, China
2
National-Regional Joint Engineering Research Center for Soil Pollution Control and Remediation in South China, Guangdong Key Laboratory of Integrated Agro-Environmental Pollution Control and Management, Institute of Eco-Environmental and Soil Sciences, Guangdong Academy of Sciences, Guangzhou 510650, China
3
Key Laboratory of Low-Grade Energy Utilization Technologies and Systems of Ministry of Education, Chongqing University, Chongqing 400044, China
4
Guangdong Energy Group Co., Ltd., Guangzhou 510630, China
5
Guangdong Provincial Key Laboratory of Environmental Pollution Control and Remediation Technology (Sun Yat-sen University), Guangzhou 510275, China
6
South China National Botanical Garden, Guangzhou 510650, China
*
Author to whom correspondence should be addressed.
These authors contributed equally to this work.
Forests 2023, 14(11), 2216; https://doi.org/10.3390/f14112216
Submission received: 28 September 2023 / Revised: 20 October 2023 / Accepted: 30 October 2023 / Published: 9 November 2023
(This article belongs to the Special Issue Soil Nutrient Cycling and Microbial Dynamics in Forests)

Abstract

:
Soil cyanobacteria in tropical forests is understudied despite its important role in soil biochemical process and plant growth. Under a nitrogen (N) deposition background in tropical forests, it is important to learn how soil cyanobacterial communities respond to N deposition and whether phosphorus (P) mediated this response. A fully two-factor (N and P additions) factorial design with four blocks (replicates), each including a 12 × 12 m plot per treatment (Control, +N, +P, and +NP) were established in a tropical secondary forest in 2009. In July of 2022, soil cyanobacteria at 0–10 cm and 10–20 cm depths in the experimental site were collected and analyzed using a metagenomic method. The impact of N and P additions on soil cyanobacteria remained consistent across the different soil depths, even though there was a significant contrast between the two layers. The effect of N addition on soil cyanobacteria did not significantly interact with P addition. N addition increased soil N availability and decreased soil pH but did not significantly affect the soil cyanobacterial community. In contrast, P addition increased soil P availability and soil pH, but decreased soil N availability and substantially changed the soil cyanobacterial community. P addition significantly decreased the abundance of soil cyanobacteria, especially abundant ones. P addition also increased cyanobacterial species richness and Shannon’s diversity, which might be explained by the decline in dominant species and the emergence of new species as nestedness and indicator species analyses suggest. We concluded that (1) soil cyanobacteria in tropical forests exhibits a greater sensitivity to elevated P availability compared to N; (2) an increase in soil P supply may mitigate the advantage held by dominant species, thus facilitating the growth of other species and leading to alterations in the soil cyanobacterial community. This study improves our understanding on how soil cyanobacterial communities in tropical forest responds to N and P addition.

1. Introduction

Cyanobacteria plays a crucial role in the soil ecosystem. Cyanobacteria includes microbe with a wide range of metabolic capabilities, from the photosynthetic cyanobacteria (class Cyanobacteria), which live in most types of illuminated environments [1], to nonphotosynthetic clades such as Vampirovibrionia and Sericytochromatia [2,3]. In soil environments, cyanobacteria are globally distributed [4,5], with an estimated biomass of up to 54 × 1012 g C [6]. Soil cyanobacteria have an important role in nitrogen (N) fixation and carbon (C) sequestration [7,8], and are also a key part in beneficial plant microbiomes, helping plants to protect against biotic and abiotic stresses [9]. In addition, cyanobacteria represent one of the first communities to colonize bare soil, including volcanic deposits and unfarmed soils from various origins, thereby enabling the subsequent establishment of higher plant communities [10]. The role of cyanobacteria as pioneer organisms is particularly important in bare soils prone to erosion [11,12], as they aggregate soil particles by producing extracellular polysaccharides [13] and forming water-stable aggregates that reduce the impact of wind erosion [14].
Cyanobacteria in tropical forest soils receives significantly less research attention in comparison to those in arid and semiarid regions. Tropical forests cover only 7%–10% of the Earth’s surface, but contain about 40% of global terrestrial biomass carbon [15] and up to 50% of terrestrial productivity [16], as well as possessing huge biodiversity [17], and thus play an important role in providing ecological services globally [16,18]. Soil cyanobacteria are usually abundant in sparsely vegetated and N-poor soils at high elevations and latitudes or arid lands [19,20,21]. Scientists have investigated soil cyanobacteria for centuries in these habitats, but seldomly in closed canopy tropical forests. Nowadays, studies imply that soil cyanobacteria, with diverse metabolic capabilities, might occupy much ecological niches in sunless and N-rich environments [22,23,24]. A few studies suggest that there is a higher soil cyanobacterial diversity in tropical forests than expected [5,25,26]. Studies on soil cyanobacteria in tropical forests will promote our knowledge of biodiversity and the interconnected biochemical processes in the crucial ecosystem.
In the context of elevated N deposition, there is a pressing need to understand how soil cyanobacterial communities in tropical forests react to N deposition and how this response is influenced by P deficiency. Global atmospheric N deposition is accelerating through time due to anthropogenic activities such as fossil fuel burning and agriculture fertilization [27,28]. In tropical forests, chronic elevated N depositions have induced changes in net ecosystem production (NEP) [29], soil respiration [30], plant diversity [31], soil pH [32], and so on. On the other hand, highly weathered soils in tropical forests are frequently regarded as deficient in phosphorus. Thus, an increase in soil P availability in these forests would substantially affect ecosystem structure and function [33,34]. Moreover, imbalanced N and P inputs can have catastrophic consequences, particularly in tropical regions where the soils are predominantly deficient in P due to high weathering [35]. Such imbalances in N and P inputs have the potential to disrupt the structure and functioning of ecosystems, leading to unpredictable impacts on soil biogeochemical cycles [36]. This underscores the pressing need to investigate the individual and interactive effects of N and P additions on tropical forest ecosystems. Though there are studies in tropical forests suggesting that NP addition would affect soil microbial communities through changing soil chemical properties [37,38,39], such studies typically does not discriminate cyanobacteria from other bacteria. Soil cyanobacteria may respond very differently to NP addition because of their distinct physiological characteristics. For example, autotrophic cyanobacteria may be insensitive to plant-derived carbon source changes when NP addition substantially changes soil C inputs. In contrast, light intensity may not affect soil heterotrophic bacteria and fungi but could strongly change the diversity and abundance of photosynthetic cyanobacteria. Moreover, some cyanobacteria are diazotrophs and may exhibit responses to NP addition distinct from other microbial guilds. Nevertheless, empirical evidence in tropical forests supporting these interferences is largely lacking. In addition, soil cyanobacterial community composition may substantially change as soil depth increases [40,41], thus responding differently to environmental changes. At present, studies on the effects of NP addition on soil cyanobacterial communities are almost carried out in farmlands [42,43,44] or in arid and semiarid ecosystems [45], some of which suggest P addition would increase soil cyanobacterial abundance and diversity, while N addition would have minor effects. However, forests and farmlands represent two distinct terrestrial ecosystems with contrasting environmental conditions and distinct composition of soil cyanobacterial communities [46], which may strongly mediate the response to NP addition. Collectively, soil cyanobacterial response to NP addition in tropical forest is still understudied.
We conducted the current experiment during a wet season when there were minimal constraints on soil cyanobacterial growth due to abundant rainfall and sunlight. To discern the composition of soil cyanobacteria, we employed molecular analyses, recognizing that many cyanobacteria cannot be cultivated. Over the years, the addition of nutrients (NP) to the experimental site has not only altered the availability of N and P in the soil but has also influenced various other abiotic and biotic soil conditions, as well as properties of the vegetation [37,47,48,49]. In the present study, we hypothesized that (1) significant alterations in the soil cyanobacterial community would occur with increasing soil depth, particularly characterized by decreases in both abundance and species richness; (2) N addition would exert an adverse impact on the soil cyanobacterial community; (3) conversely, P addition would positively affect the soil cyanobacterial community.

2. Materials and Methods

2.1. Study Site

This study was conducted at the Xiaoliang Tropical Coastal Ecosystem Research Station (110°54′ E, 21°27′ N), Chinese Academy of Sciences, Guangdong Province, China. The climate is tropical, with a mean annual temperature of 23 °C and mean annual precipitation of 1400–1700 mm. More than 70% of the precipitation falls during the wet season from April to September. The soil is classified as lateritic on deeply weathered granite. The NP addition experiment was established in a 60-year-old monsoon tropical forest that was started as a Eucalyptus exserta plantation in 1959, after which 312 species were introduced between 1964 and 1975 [50,51]. Now, the most common tree species are Castanopsis fissa, Cinnamomum camphora, Carallia brachiata, Aphanamixis polystachya, Ternstroemia pseudoverticillata, Acacia auriculiformis, Cassia siamea, Albizia procera, Albizia odoratissima, Leucaena leucocephala, Aquilaria sinensis, and Chukrasia tabularis.

2.2. Experimental Design

The fertilization experiment was set up as a fully randomized two-factor (N and P addition) block design with four blocks (replicates), each including a 12 × 12 m plot per treatment (Control (Ctr), +N, +P, and +NP) [49]. Starting in September 2009, N and P were applied in equal amounts every 2 months at a rate of 100 kg ha−1 year−1. Specifically, in each fertilization treatment, each +N plot received 4766 g NH4NO3 (equal to 1666 g N), each +P plot 808 g NaH2PO4 (equal to 1666 g P), and each +NP plot 4766 g NH4NO3 and 808 g NaH2PO4, while Ctr plots did not receive NH4NO3 or NaH2PO4. In the fertilization, NH4NO3 or/and NaH2PO4 were dissolved in 30 L groundwater and applied to the corresponding plots using a backpack sprayer near the soil surface, spraying as evenly as possible in the plot; 30 L groundwater was applied to each Ctr plot. The amounts of N and P added correspond to studies of experimental N [31] and P [52] additions in neighbor forests. In tropical fertilization experiments, it is common to apply significant amounts of P in excess of the actual N and P requirements of plants, as a substantial portion of the added P tends to become immobilized in forms that are biologically unavailable in many tropical soils [53].

2.3. Soil Sampling

The soil was sampled once in July 2022. Soil cores (5 cm diameter) were taken at 0–10 and 10–20 cm depth from five randomly selected locations in each plot. The litter above each sample area was removed before the soil collection. The five cores from the same plot and same soil layer were combined to form one composite sample.

2.4. Soil Chemical Analysis

Soil ammonium-N and nitrate-N were extracted with 10 g fresh soil by 100 mL 2 M KCl for 30 min within 48 h after soil samplings; extractable P extracted with 5 g dry soil via the Bray 1 method (0.03 M NH4F and 0.025 M HCl, 50 mL) for 5 min; and total P and total N were digested using a micro-Kjeldahl digestion; all the nutrient concentrations were then analyzed with automated discrete analyzers (BluVison™, SKALAR, Breda, The Netherlands). Soil pH was determined in a 1:2.5 soil: water slurry using a glass pH electrode (FiveGO™, METTLER TOLEDO, Zurich, Switzerland). Total soil carbon (C) concentration was determined via dry combustion (Delta V advantage, Thermo Fisher Scientific, Waltham, MA, USA).

2.5. DNA Extraction and Analysis

Total community genomic DNA extraction was performed using a E.Z.N.A. Soil DNA Kit M5635-02, (Omega, Norcross, GA, USA). We measured the concentration of the DNA using a Qubit 4.0 (Thermo, Waltham, MA, USA) to ensure that adequate amounts of high-quality genomic DNA had been extracted.
Fastp 0.36 (Shenzhen Haplox Biotechnology Co. Ltd., Shenzhen, China) was used for evaluating the quality of sequenced data. Raw reads were filtered according to several steps: (1) removing adaptor sequence; (2) removing low quality bases from reads 3′ to 5′ (Q < 20); (3) using a sliding window method to remove the base value less than 20 of reads tail (window size is 4 bp); (4) finding overlap of each pair of reads and properly correct inconsistent bases within the interval; (5) removing reads with reads length less than 35 nt and its pairing reads. The remaining clean data was used for further analysis.
We use Megahit 1.2.9 (Institute of Microbiology, Chinese Academy of Sciences, Beijing, China) to perform multi-sample mixed splicing to obtain preliminary spliced contig sequences. Clean reads were mapped back to the spliced results, while unmapped reads were extracted and spliced again using SPAdes 3.13 (St. Petersburg State University, St. Petersburg, Russia) to obtain low-abundance contigs. MetaWRAP 1.3.2 (Joint Genome Institute, Walnut Creek, CA, USA) was used to perform a series of binning, and bin identification was performed in sequence. After filtering, a draft genome of a single bacteria with high integrity and low contamination was obtained.
We used DIAMOND 0.8.20 (Allegheny-Singer Research Institute, Pittsburgh, PA, USA) to compare the gene set with NR databases to obtain species annotation information of genes. Screening conditions were as follows: e-value < 1 × 10⁻⁵, Score > 60. Based on gene set abundance information and annotation information, species abundance was obtained.

2.6. Statistical Analysis

All statistical analyses were conducted in R version 4.1.2 (R Foundation for Statistical Computing, Vienna, Austria) [54]. The use of metagenomic gene copies as a measure of abundance is still under debate [55], but it is commonly used (e.g., [56,57]). Shannon’s diversity index (H) was calculated as diversity index using the function diversity() in R package ‘vegan’ [58]. Rarefaction curves were drawn with rarecurve() based on non-resampled metagenomic gene.
Univariate analyses of differences in soil cyanobacterial community and soil chemical property were based on a two-way linear mixed effects model using the function lmer() in package ‘lme4’ including N addition, P addition, and soil layer as fixed factors and plots nested within blocks as random effects. All interactions between N addition, P addition, and soil layer were excluded in our statistics as they were not significant (p > 0.050). P-values were generated with cftest() implemented in the package ‘multcomp’. Model assumptions of normality and homogeneity were tested and, if necessary, data were log- or sqrt-transformed. For illustrations of single treatment effects in comparison to Ctr, the described model was applied as one-way analysis.
Multivariate effects of NP addition, soil layer, and soil chemical property on species composition of soil cyanobacteria were illustrated by plotting the ordination structure of a redundancy analysis (RDA). In addition, differences in soil cyanobacterial community structure among each treatment were analyzed with a two-way permutational multivariate analysis of variance (perMANOVA) using the function adonis() with 999 permutations. To identify whether the community composition shifted toward a new species set or rather diminished to a subset of the preexisting species pool, we conducted a nestedness analysis as well as an indicator species analysis. The function nestedtemp() in the package ‘vegan’ was used to calculate a matrix temperature in comparison to three different null models. The position of treatments in the resulting stacked matrix was analyzed using a non-parametric Kruskal–Wallis test, following pairwise comparisons with Wilcoxon signed-rank tests. Potential treatment-related indicator species were identified using the function multipatt() in the package ‘indicspecies’, implementing 999 permutations [59].

3. Results

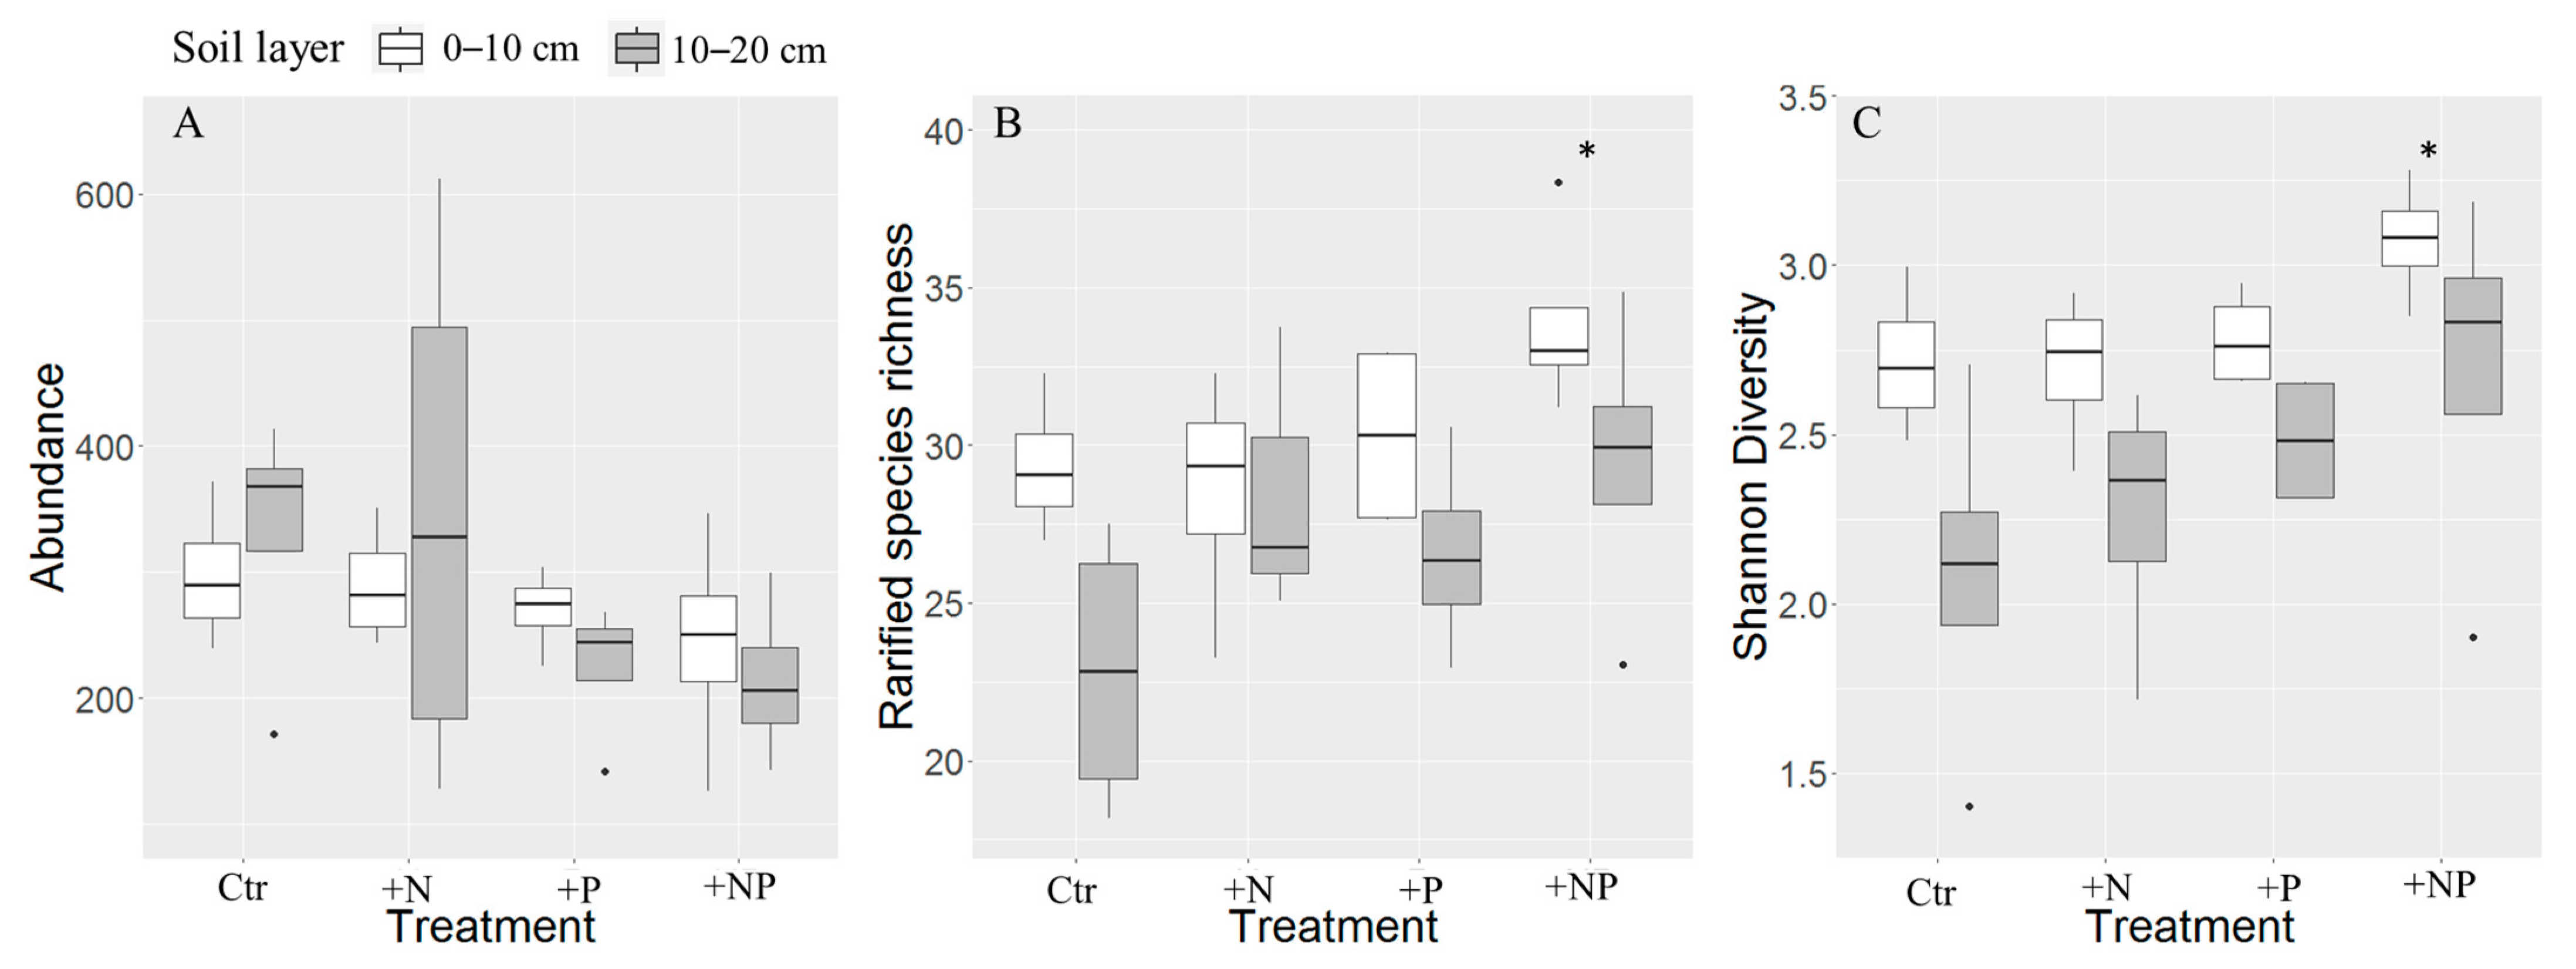
3.1. Soil Cyanobacteria Detected at 0–10 and 10–20 cm Soil Layer

Across all treatments and soil layers, 100 cyanobacteria genes were detected (Figure S1). Among the detected genes, 45 of them belonged to 14 families and 19 genera, while 55 genes could not be classified at the family level. The dominant soil cyanobacteria species was a Nostoc species, accounting for over 30% of all sequenced reads and present in all 32 soil samples. On genus level, Nostoc was the dominant genus, with a relative abundance of 40.8% (Figure S2). Nodularia (3.9%), Oscillatoria (3.8%), Pseudanabaena (2.5%), Scytonema (1.6%), Gloeobacter (1.2%), and Synechococcus (1.1%) also had relatively higher abundances.
Soil cyanobacterial communities were different between 0–10 and 10–20 cm soil layers. The metagenomic reads of soil cyanobacteria (abundance) at the plot level measured 275.1 ± 3.7 in the 0–10 cm layer and 279.5 ± 8.3 in the 10–20 cm layer. (Table 1; p = 0.901). The soil cyanobacterial abundance was 31.3 ± 0.9 at the 0–10 cm, significantly higher than 26.8 ± 1.3 at the 10–20 cm (p = 0.001). Shannon’s diversity in the 0–10 cm layer was 2.707 ± 0.114, which was also significantly higher than 2.535 ± 0.099 in the 10–20 cm layer (p < 0.001). Redundancy analysis (RDA) of soil cyanobacterial community data suggested a clear difference between the 0–10 cm and 10–20 cm layers (Figure 1, Table S1, p = 0.001).

3.2. Effects of NP Addition on Soil Chemical Property

N addition significantly decreased soil pH (p = 0.028), increased nitrite-N (p = 0.004), but only had minor effects on other soil properties (Table 2). P addition effectively increased soil pH (p = 0.028), total P (p < 0.001), and extractable P (p < 0.001), but significantly decreased total soil C (p = 0.007), total N (p < 0.001), ammonium-N (p = 0.018), and nitrite-N (p < 0.001).
Compared to Ctr treatment, +N treatment significantly increased soil nitrite-N (p < 0.001) and tended to increase ammonium-N (p = 0.075), but decreased soil pH (p = 0.055) (Figure S3). +P treatment resulted in a significant reduction in total soil C (p = 0.004) and total soil N (p = 0.002), but a notable increase in total soil P (p < 0.001) and extractable soil P (p < 0.001). Lastly, the +NP treatment led to a significant decrease in total soil N (p = 0.048), accompanied by an increase in total soil P (p < 0.001) and extractable soil P (p < 0.001).

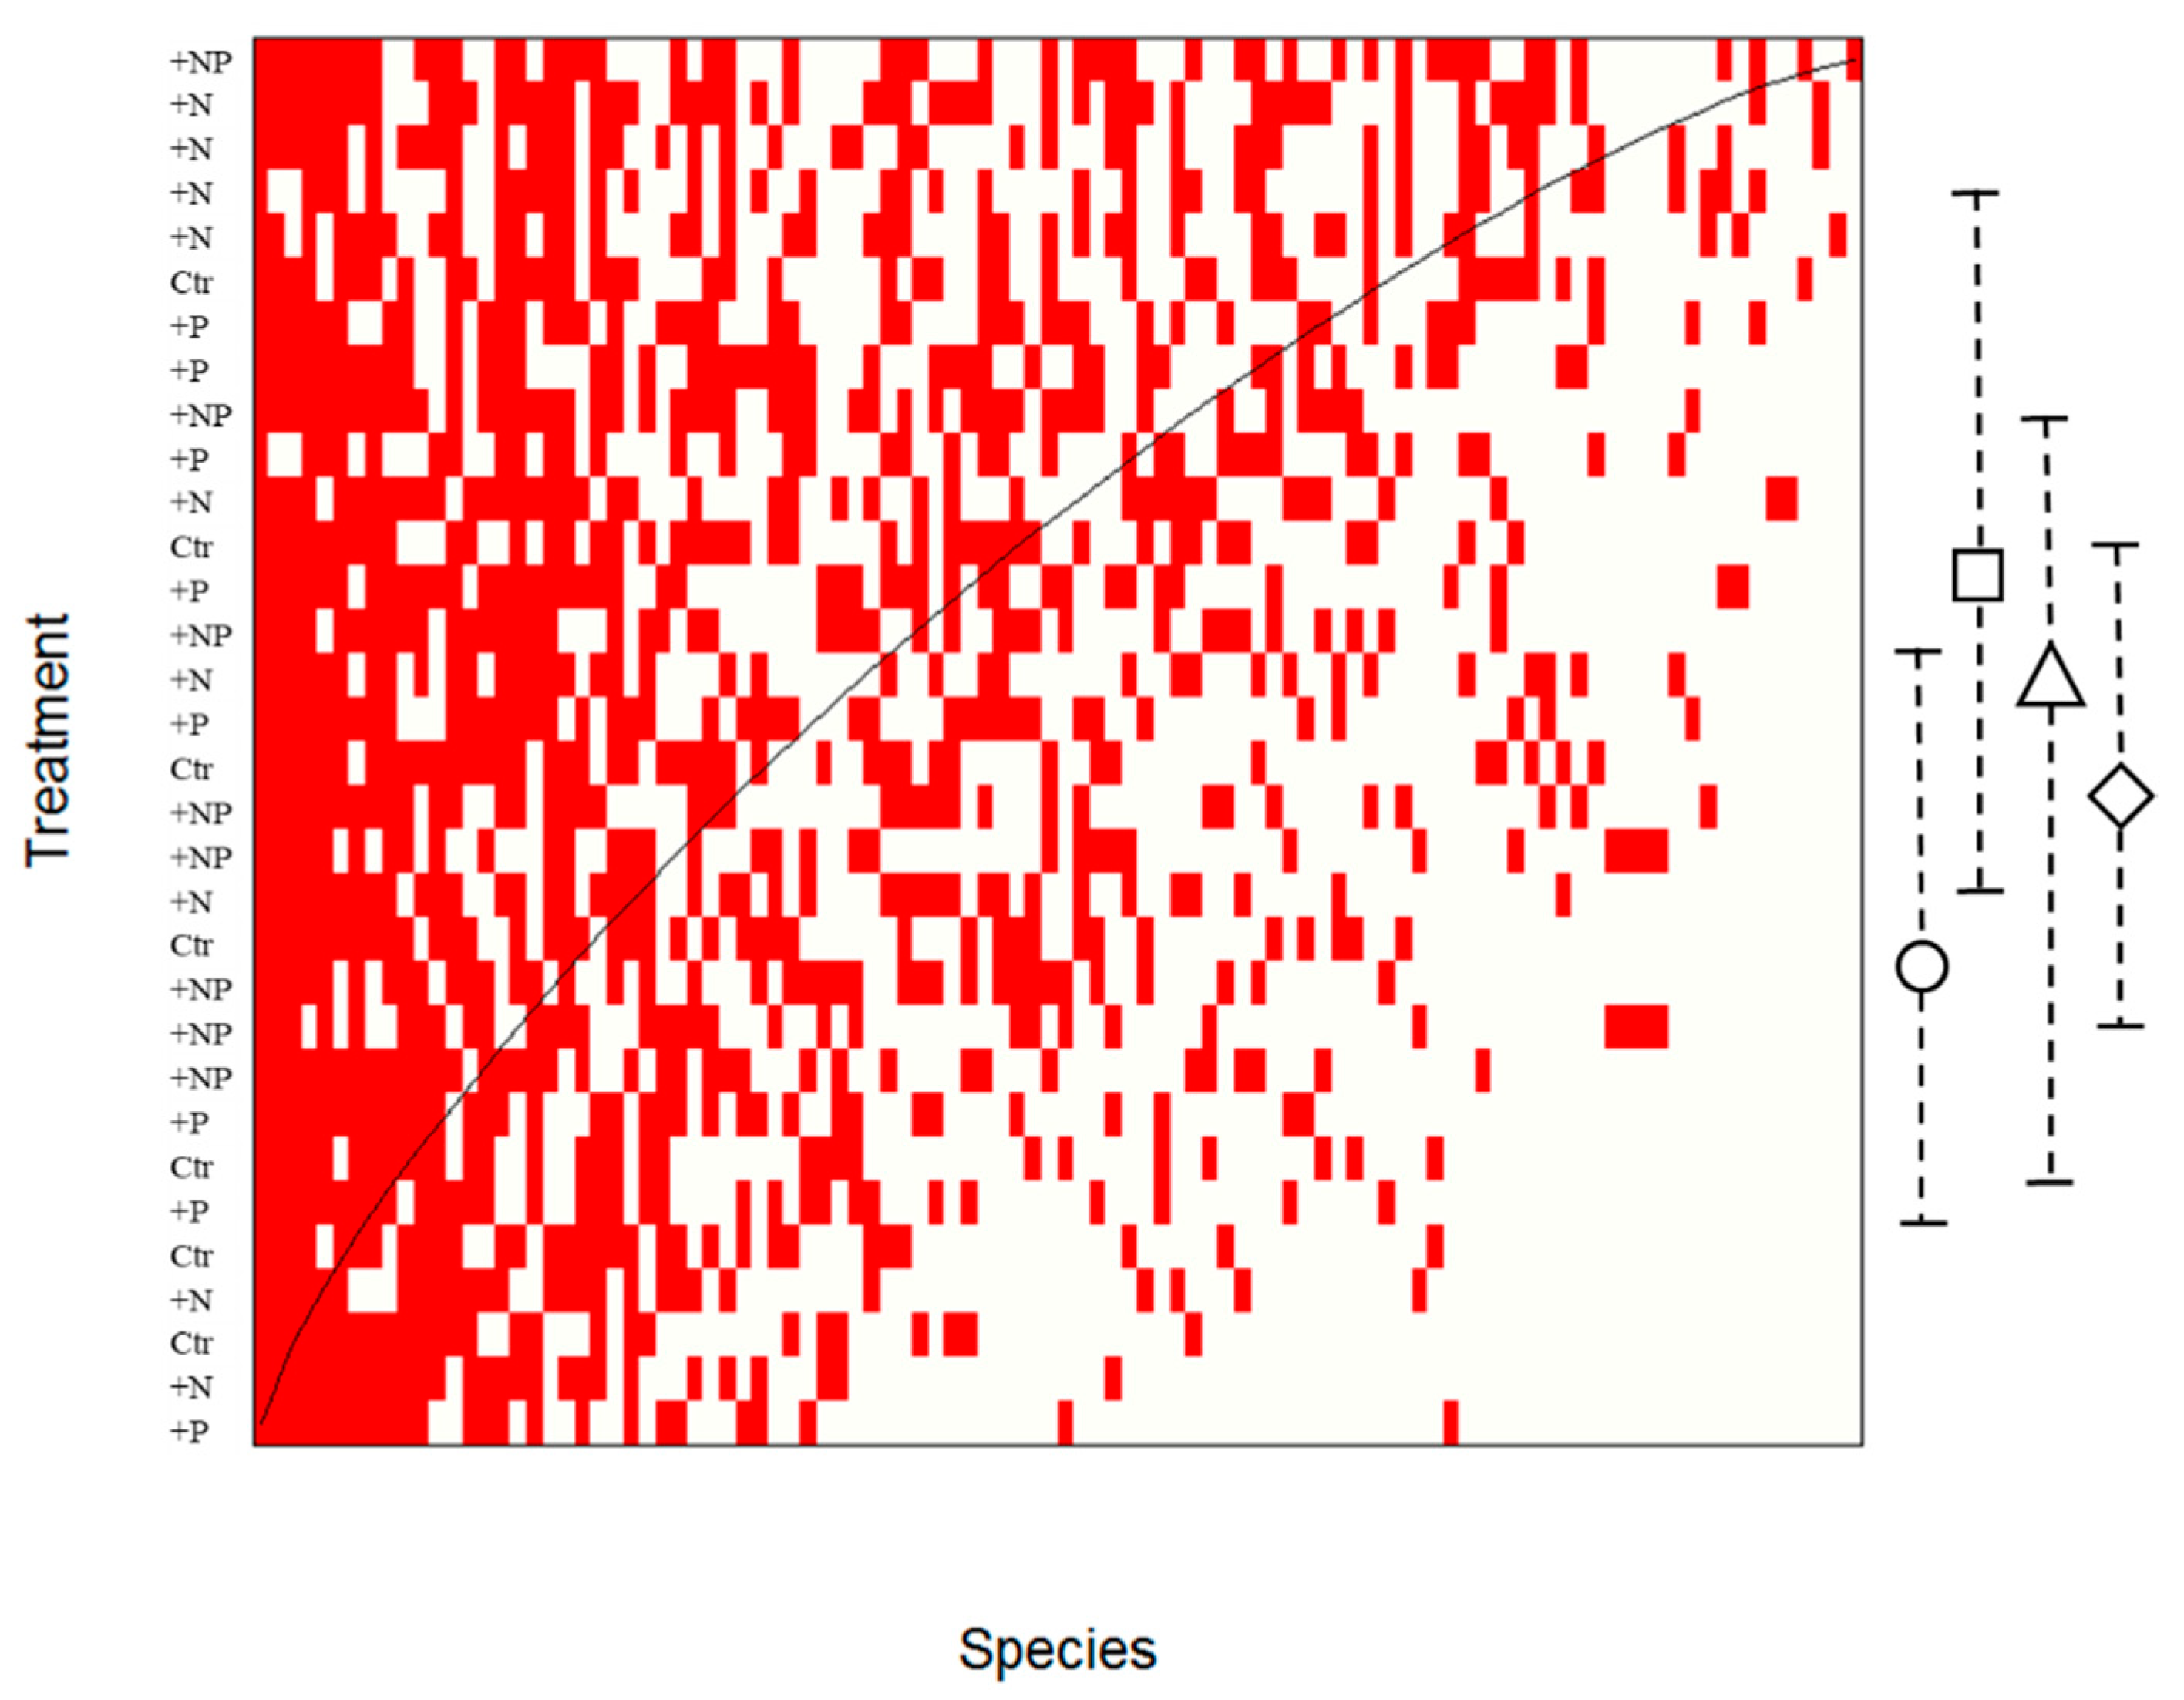
3.3. Effects of NP Addition on Soil Cyanobacterial Community

P addition significantly changed the soil cyanobacterial community, while N addition had minor effects. N addition did not significantly affect soil cyanobacterial abundance (p = 0.851), species richness (p = 0.102), or Shannon’s diversity index (p = 0.136) (Table 1). In contrast, P addition significantly decreased soil cyanobacterial abundance (p = 0.026), but increased species richness (p = 0.011) and Shannon’s diversity (p = 0.005) (Table 1). Although Nostoc sp. remained the dominant species, its abundance tended to decrease under P addition (Tables S2 and S3). Further analysis suggested that among the ten most abundant cyanobacterial genes, P addition significantly decreased two of them (p < 0.050), including the abundant one belonging to Nostoc, and tended to decrease another three (p < 0.100) (Table S4). RDA axes were highly significant (p < 0.001, adjusted R2 = 0.193) when the first two axes explained 22.1% of the variation in gene assemblage (Figure 1). The RDA indicated that soil cyanobacterial community structure separated on the first and second axes along gradients significantly associated with P addition (p = 0.045), soil pH (p = 0.003) and soil depth (p = 0.001), and also tended to correlate to Pextra (p = 0.057) (Figure 1, Table S1).
Compared to Ctr treatment, +NP had the greatest effect on the soil cyanobacteria community. +NP significantly increased species richness (Figure 2B; p = 0.002) and Shannon’s diversity index (Figure 2C; p < 0.001) but tended to decrease soil cyanobacterial abundance by 31% (Figure 2A; p = 0.087). +P treatment had similar effects on the soil cyanobacterial community with +NP, but with no significance. In contrast, +N had minor effects on the soil cyanobacterial community. In addition, PerMANOVA suggested that the soil cyanobacterial community structure under +NP treatment was significantly different from the community in +N (p = 0.037), and also tended to differ from those in Ctr (p = 0.176) and +P (p = 0.076) (Figure 1, Table S5).
Nestedness analysis did not revealed a significant nested community structure (p = 0.601), with a matrix temperature of 43.15 (Figure 3). Comparing the position within the nested matrix, communities of every treatment were not significantly nested within each other (p = 0.560, Kruskal–Wallis test).
The indicator species analysis revealed that two species/genes (Richelia sp. SL21, p = 0.041; unclassified gene 1, p = 0.034) were significantly associated with +NP treatment, one species (Nostoc sp. 3335mG, p = 0.027) with +N and +NP, and one species (unclassified gene 2, p = 0.046) with +P and +NP (Table 3).

4. Discussion

4.1. Cyanobacterial Communities at Different Soil Depths

There were clear differences in soil cyanobacterial community between the 0–10 and 10–20 cm soil layers, while soil cyanobacterial abundance remained consistent. Previous studies on cyanobacterial diversity have predominantly concentrated on the soil surface [25,60]. In this current investigation, our hypothesis posited that the 0–10 cm soil layer will exhibit greater cyanobacterial abundance, taxon richness, and diversity index due to its inclusion of both phototrophic and heterotrophic species, whereas the 10–20 cm layer is likely to predominantly harbor heterotrophic species. This expectation was also rooted in the typical pattern of decreasing microbial abundance and richness with soil depth, as organic substrates and living fine roots tend to diminish [61]. As expected, there were substantial declines in species richness and diversity index as soil depth increasing, and a significant change in soil cyanobacterial community structure between the two soil layers. In contrast, cyanobacteria abundance did not differ between the two soil layers. Though abundance of some species became lower at the 10–20 cm layer, the prevalence of the Nostoc genus grew, primarily due to the increased presence of a dominant Nostoc species.
There was a high diversity in cyanobacteria communities in tropical forest soil. In other tropical forests, Nostoc is found on rocks, barks, soils, and so on, but seldom assumes a dominant role. For example, Nostoc was common but not dominant on rock surface in Orinoco along Guyana [62], and also a frequent taxa, but not a dominant one, on bark and wood in Singapore [63]. In soils, a recent analysis including 16 global soil chronosequences from deserts to tropical forests suggested that soil cyanobacterial communities in most forests were consistently dominated by a nonphotosynthetic cyanobacteria (Vampirovibrionia) [64]. The study did not include any sites in the Chinese mainland, and distinguished cyanobacterial species using 16s RNA analyses, both of which differed from our study, thus probably contributing to the distinct results. Interestingly, our results were in consistent with findings in temperate forests where dominant species of cyanobacteria recorded included two Nostoc spp. [65]. In other temperate forest soils, cyanobacterial communities could be dominated by diverse species, such as Leptolyngbya sp., Phormidium sp., and Kamptonema sp. [66,67]. Soil cyanobacterial diversity in forests, especially in tropics, should be further studied.
Nostoc was the overwhelmingly dominant taxon at both the 0–10 and 10–20 cm soil layers. Nostoc is a filamentous cyanobacteria genus that can form macroscopic or microscopic colonies and is common in terrestrial habitats, as it can survive months or years of desiccation and fully recover metabolic activity within hours to days after rehydration [68]. Most Nostoc spp. are phototrophs and N fixers, and thus are dominant in soil microbial community in early succession of terrestrial ecosystems, high altitudes, and arid regions, where N constraints other organisms and where sunlight is drenched [19,21]. However, some strains of Nostoc are facultatively heterotrophic and are able to grow using organic carbon [68]. The dominant role of Nostoc in this forest recovered from 1930s with a LAI as high as 4.1 [69], indicating that Nostoc could still play an important role in closed-canopy tropical forests.

4.2. N Addition Had Minor Effects on Soil Cyanobacterial Community

Contrasting our hypothesis, the 12 years of N addition had minor effects on soil cyanobacteria community. There are few studies examining the response of soil cyanobacteria to N addition in tropical forests. Studies in farmlands and wetlands usually found that N addition decreased soil cyanobacterial abundance or/and its diversity, mostly because N addition increases soil N availability but decreases soil pH [43,70,71]. The copiotrophic hypothesis suggested that N addition reduced the relative abundance of oligotrophic taxa as a relieved N limitation allows them to be outcompeted by more copiotrophic taxa [72,73]. As a consequence, the competitive advantage of cyanobacteria capable of N fixation is expected to diminish with N supplementation. However, not all cyanobacterial species belong to diazotrophs. As we did not distinguish the specific cyanobacterial species, it remains uncertain whether diazotrophs constituted the majority of the soil cyanobacterial community in this forest, thereby influencing the overall community’s response. Moreover, since tropical forests are N-saturated ecosystems [30,31,74], soil cyanobacteria may resist the increased N availability. Soil pH is another important pathway through which N addition affects soil microbes [75,76]. Soil cyanobacterial abundance and diversity were usually positively correlated with higher pH in undisturbed soils [60,68,77], and some studies in farmlands also found that decreasing soil pH induced by N addition could substantially decrease soil cyanobacterial abundance and diversity [43,70]. In the present study, soil pH played an important role in determining the soil cyanobacterial community, as the RDA analysis suggests. However, our results showed that N addition did not affect the soil cyanobacterial community. Interestingly, a study in the same experimental site suggested that N addition inhibited soil Gram-positive bacterial PLFAs but did not affect Gram-negative bacterial PLFAs [37], which, in some ways, was coincide with ours as soil cyanobacteria accounts for a large part of soil Gram-negative bacteria. The underlying mechanism is still unclear.
Nevertheless, most of our knowledge on the soil cyanobacterial response to inorganic N addition are from studies in farmland (e.g., [43,70,78]) or in forests, which typically did not discriminate cyanobacteria from other bacteria (e.g., [37,38,79]). Our findings may indicate a potential distinction in how soil cyanobacteria in forests and farmland respond to inorganic N addition, possibly linked to their distinct species compositions.

4.3. P Addition Significantly Changed Soil Cyanobacterial Community

The P addition strongly affected the soil cyanobacterial community in the tropical forest, as in other ecosystems. The widespread positive response to P addition appears consistent among cyanobacteria in diverse ecosystems, although it has been less frequently documented in tropical forests. Many studies conducted in various ecosystem types and laboratory settings have consistently suggested that the addition of P is likely to enhance the growth of cyanobacteria, leading to an increase in their overall abundance [80,81], especially for cyanobacterial diazotrophs [82,83], mostly because cyanobacteria in various systems were limited by P availability. The addition of P had a pronounced impact on soil chemical characteristics in this tropical forest, notably resulting in increased soil pH and soil P availability, both of which could potentially lead to shifts in cyanobacterial communities [1,60,77].
In contrast to previous studies, the addition of P did not result in an increase but rather a decrease in soil cyanobacterial abundance. Soil cyanobacterial populations experienced a decline in both the +P and +NP treatments, with a particularly pronounced decrease observed in the case of Nostoc. In some case, fertilization might increase canopy density, decreasing sunlight arriving on the forest floor, thus leading to a rapidly decreasing abundance in the cyanobacterial community [84,85,86]. In tropical forests, where P deficiency is ubiquitous, P addition could easily enhance primary productivity and vegetation canopy cover [53,83]. As most cyanobacteria are phototrophs, a closer canopy above may therefore inhibit their growth. The results indicate that though tropical ecosystems are P-deficient, not all organisms would benefit from P fertilization; species interactions could mediate a species’ response, thus determining the ultimate outcome. In the current study, we inferred that the increase in upper vegetation cover has led to a reduction in the abundance of soil cyanobacteria, particularly photosynthetic cyanobacteria, resulting in an overall decrease in cyanobacterial abundance.
The P addition increased species richness and diversity, which may be attributed to the decreasing dominance of Nostoc and the occurrence of some new species. Nostoc remained the prevailing species despite the addition of P, albeit at reduced levels of abundance. On the contrary, we observed an increase in the populations of certain uncommon species in response to both +P and +NP treatments. Furthermore, nestedness in parallel with indicator species analyses showed that because of P addition, the cyanobacterial community shifted toward a new species set rather than diminishing to a subset of the pre-existing species pool [87]. The augmentation of P availability and soil pH resulting from P supplementation mitigated the inherent advantages of dominant species [56,88], but facilitated some species previously limited by nutrient supply or oppressed by dominant species [89,90], thus resulting in changes in the soil cyanobacterial community. In addition, as discussed above, phototrophic cyanobacteria would be inhibited by increasing canopy density induced by P addition, which may also account for the change. Collectively, P addition changed the soil chemical properties, influencing species interactions among organisms in the forest, and thereby promoting greater species richness and diversity.
In the present study, +NP treatment had the most powerful effects on soil cyanobacterial community among the four treatments. In experimental field studies, N and P fertilization are usually applied together to elucidate the P limitation under N deposition [33,49,91]. We did not find any other studies comparing the effects between +NP treatment and +N or +P treatment on soil cyanobacteria in tropical forests, while studies on bacterial community or other soil organisms revealed conflicting results (e.g., [92,93,94]). For instance, in a subtropical forest, Wang et al. [95] found that +NP treatment had a similar effect to +N treatment on the soil bacterial community, while +P had minor effects. A contrasted example was that in Hainan Island in China, where Ma et al. [96] showed that +NP and +P did not affect the soil bacterial community, while +N induced a significant change. At the same experimental site, Zhao et al. [97] suggested that +NP treatment had a greater effect on soil nematodes than +N or +P, which did not find a reliable mechanism either. Under the +N treatment in the present study, soil nitrite- and ammonium-N increased. However, when the N and P fertilization were applied together, soil nitrite- and ammonium-N did not change, suggesting that P fertilization facilitated soil microbial immobilization or/and plant absorption for N. This mechanism, along with additional N supply, may explain +NP having the strongest effects on the soil cyanobacterial community among the four treatments.

5. Conclusions

The role of soil cyanobacteria in tropical forests’ biochemical processes and plant growth is significant, yet it remains poorly studied. With the background of N deposition in tropical forests, it is crucial to understand how soil cyanobacterial communities respond to N deposition and whether P mediates this response. The present study suggested that there were significant differences in soil cyanobacterial richness and diversity between 0–10 cm and 10–20 cm soil depth, but the impact of NP addition remained consistent across the different soil depths. The effect of N addition on soil cyanobacteria did not significantly interact with P addition. However, it was interesting that +NP, among the four treatments, had the strongest effect on both soil chemical properties and cyanobacterial communities. Nitrogen addition increased soil N availability and decreased soil pH. Though the RDA suggested that soil pH was significantly correlated with soil cyanobacterial community structure, N addition, in contrast to our hypothesis, did not significantly affect the soil cyanobacterial community. In contrast, P addition increased soil P availability and soil pH, but decreased soil N availability and substantially changed the soil cyanobacterial community. As expected, P addition increased cyanobacterial species richness and Shannon’s diversity. Nestedness analysis and indicator species analyses suggested that the changes in the soil cyanobacterial community might be explained by the decline in dominant species and the emergence of new species. To our surprise, P addition did not increase soil cyanobacterial abundance; instead, it significantly reduced soil cyanobacterial abundance, especially those abundant ones. We concluded that (1) soil cyanobacteria in tropical forests exhibit greater sensitivity to elevated P availability compared to N; (2) an increase in soil P supply may mitigate the advantage held by dominant species, thus facilitating the growth of other species and leading to alterations in the soil cyanobacterial community.

Supplementary Materials

The following supporting information can be downloaded at: https://www.mdpi.com/article/10.3390/f14112216/s1; Figure S1: Heatmap of OTUs (operational taxonomic units), representing soil cyanobacterial abundances in samples of the respective treatments; Figure S2: Soil cyanobacteria detected in the experimental site at genus level; Figure S3: Effects of NP addition on soil property; Table S1: Results of redundancy analysis suggesting the significance of each explanatory variable correlated to soil cyanobacterial community; Table S2: Abundance of each soil cyanobacterial genus in each treatment and soil layer; Table S3: Effects of NP addition and soil layer on abundance of each soil cyanobacterial genus; Table S4: Effects of NP addition and soil layer on abundance of the 10 most abundant soil cyanobacterial genes; Table S5: Results of PerMANOVA examining the differences in soil cyanobacterial communities among treatments.

Author Contributions

Conceptualization, C.C., G.L., S.Q. and S.Y.; Methodology, F.W. and J.Y.; Formal analysis, X.Z. and J.Y.; Investigation, X.Z., X.J., S.Q. and C.K.; Writing—original draft, X.Z. and X.J.; Writing—review & editing, X.J., J.Y., S.Q., G.L., F.W. and S.Y.; Supervision, J.C. and C.K.; Project administration, C.C., J.C. and S.Y., X.Z. and X.J. contributed equally to this work. All authors have read and agreed to the published version of the manuscript.

Funding

This research was funded by Key-Area Research and Development Program of Guangdong Province, China (2022B0111130003); National Key R&D Program of China (2021YFF0601001); the Research Fund Program of Guangdong Provincial Key Laboratory of Environmental Pollution Control and Remediation Technology (2020B1212060022); the Science and Technology Program of Guangzhou, China (202102021073) and the National Natural Science Foundation of China (42201057).

Data Availability Statement

Data available within the article or its Supplementary Materials.

Conflicts of Interest

The authors declare no conflict of interest.

References

  1. Whitton, B.A.; Potts, M. Introduction to the Cyanobacteria. In Ecology of Cyanobacteria II; Springer: Dordrecht, The Netherlands, 2012; pp. 1–13. ISBN 978-94-007-3855-3. [Google Scholar]
  2. Shih, P.M.; Hemp, J.; Ward, L.M.; Matzke, N.J.; Fischer, W.W. Crown group Oxyphotobacteria postdate the rise of oxygen. Geobiology 2017, 15, 19–29. [Google Scholar] [CrossRef] [PubMed]
  3. Soo, R.M.; Hemp, J.; Parks, D.H.; Fischer, W.W.; Hugenholtz, P. On the origins of oxygenic photosynthesis and aerobic respiration in Cyanobacteria. Science 2017, 355, 1436–1439. [Google Scholar] [CrossRef] [PubMed]
  4. Moreira, C.; Vasconcelos, V.; Antunes, A. Phylogeny and Biogeography of Cyanobacteria and Their Produced Toxins. Mar. Drugs 2013, 11, 4350–4369. [Google Scholar] [CrossRef] [PubMed]
  5. Cano-Diaz, C.; Maestre, F.T.; Eldridge, D.J.; Singh, B.K.; Bardgett, R.D.; Fierer, N.; Delgado-Baquerizo, M. Contrasting environmental preferences of photosynthetic and non-photosynthetic soil cyanobacteria across the globe. Glob. Ecol. Biogeogr. 2020, 29, 2025–2038. [Google Scholar] [CrossRef]
  6. Garcia-Pichel, F.; Belnap, J.; Neuer, S.; Schanz, F. Estimates of global cyanobacterial biomass and its distribution. Algol. Stud. 1995, 109, 213–227. [Google Scholar] [CrossRef]
  7. Pankratova, E.M. Functioning of cyanobacteria in soil ecosystems. Eurasian Soil Sci. 2006, 39, 118–127. [Google Scholar] [CrossRef]
  8. Jassey, V.E.J.; Walcker, R.; Kardol, P.; Geisen, S.; Heger, T.; Lamentowicz, M.; Hamard, S.; Lara, E. Contribution of soil algae to the global carbon cycle. New Phytol. 2022, 234, 64–76. [Google Scholar] [CrossRef]
  9. Lee, S.-M.; Ryu, C.-M. Algae as New Kids in the Beneficial Plant Microbiome. Front. Plant Sci. 2021, 12, 599742. [Google Scholar] [CrossRef]
  10. Starks, T.L.; Shubert, L.E.; Trainor, F.R. Ecology of soil algae: A review. Phycologia 1981, 20, 65–80. [Google Scholar] [CrossRef]
  11. Seitz, S.; Nebel, M.; Goebes, P.; Kappeler, K.; Schmidt, K.; Shi, X.; Song, Z.; Webber, C.L.; Weber, B.; Scholten, T. Bryophyte-dominated biological soil crusts mitigate soil erosion in an early successional Chinese subtropical forest. Biogeosciences 2017, 14, 5775–5788. [Google Scholar] [CrossRef]
  12. Kuwabara, T.; Iwamoto, K.; Hara, H.; Yamaguchi, T.; Mohamad, S.; Abdullah, N.; Khudzari, J.M.; Othman, F. Prevention of soil erosion using microalgae in Malaysia. IOP Conf. Ser. Mater. Sci. Eng. 2021, 1051, 012047. [Google Scholar] [CrossRef]
  13. Lynch, J.; Bragg, E. Microorganisms and soil aggregate stability. Adv. Soil Sci. 1985, 2, 133–171. [Google Scholar]
  14. Johansen, J.R. Cryptogamic crusts of semiarid and arid lands of north America. J. Phycol. 1993, 29, 140–147. [Google Scholar] [CrossRef]
  15. Dixon, R.K.; Solomon, A.M.; Brown, S.; Houghton, R.A.; Trexier, M.C.; Wisniewski, J. Carbon pools and flux of global forest ecosystems. Science 1994, 263, 185–190. [Google Scholar] [CrossRef]
  16. Grace, J.; Malhi, Y.; Meir, P.; Higuchi, N. Terrestrial Global Productivity; Roy, J., Saugier, B., Mooney, H.A., Eds.; Academic Press: San Diego, CA, USA, 2001; pp. 401–426. ISBN 978-0-12-505290-0. [Google Scholar]
  17. Myers, N.; Mittermeier, R.A.; Mittermeier, C.G.; da Fonseca, G.A.B.; Kent, J. Biodiversity hotspots for conservation priorities. Nature 2000, 403, 853–858. [Google Scholar] [CrossRef]
  18. Bonan, G.B. Forests and Climate Change: Forcings, Feedbacks, and the Climate Benefits of Forests. Science 2008, 320, 1444–1449. [Google Scholar] [CrossRef]
  19. Rehakova, K.; Chlumska, Z.; Dolezal, J. Soil Cyanobacterial and Microalgal Diversity in Dry Mountains of Ladakh, NW Himalaya, as Related to Site, Altitude, and Vegetation. Microb. Ecol. 2011, 62, 337–346. [Google Scholar] [CrossRef]
  20. Rehakova, K.; Chronakova, A.; Kristufek, V.; Kuchtova, B.; Capkova, K.; Scharfen, J.; Capek, P.; Dolezal, J. Bacterial community of cushion plant Thylacospermum ceaspitosum on elevational gradient in the Himalayan cold desert. Front. Microbiol. 2015, 6, 304. [Google Scholar] [CrossRef]
  21. Janatkova, K.; Rehakova, K.; Dolezal, J.; Simek, M.; Chlumska, Z.; Dvorsky, M.; Kopecky, M. Community structure of soil phototrophs along environmental gradients in arid Himalaya. Environ. Microbiol. 2013, 15, 2505–2516. [Google Scholar] [CrossRef]
  22. Lindo, Z.; Nilsson, M.-C.; Gundale, M.J. Bryophyte-cyanobacteria associations as regulators of the northern latitude carbon balance in response to global change. Glob. Chang. Biol. 2013, 19, 2022–2035. [Google Scholar] [CrossRef]
  23. Soo, R.M.; Woodcroft, B.J.; Parks, D.H.; Tyson, G.W.; Hugenholtz, P. Back from the dead; the curious tale of the predatory cyanobacterium Vampirovibrio chlorellavorus. PeerJ 2015, 3, e968. [Google Scholar] [CrossRef] [PubMed]
  24. Benavent-Gonzalez, A.; Raggio, J.; Villagra, J.; Manuel Blanquer, J.; Pintado, A.; Rozzi, R.; Allan Green, T.G.; Sancho, L.G. High nitrogen contribution by Gunnera magellanica and nitrogen transfer by mycorrhizas drive an extraordinarily fast primary succession in sub-Antarctic Chile. New Phytol. 2019, 223, 661–674. [Google Scholar] [CrossRef]
  25. Gaysina, L.A.; Saraf, A.; Singh, P. Cyanobacteria; Mishra, A.K., Tiwari, D.N., Rai, A.N., Eds.; Academic Press: Cambridge, MA, USA, 2019; pp. 1–28. ISBN 978-0-12-814667-5. [Google Scholar]
  26. Mühlsteinová, R.; Hauer, T. Pilot survey of cyanobacterial diversity from the neighborhood of San Gerardo de Rivas, Costa Rica with a brief summary of current knowledge of terrestrial cyanobacteria in Central America. Braz. J. Bot. 2013, 36, 299–307. [Google Scholar] [CrossRef]
  27. Vitousek, P.M.; Aber, J.D.; Howarth, R.W.; Likens, G.E.; Matson, P.A.; Schindler, D.W.; Schlesinger, W.H.; Tilman, D. Human alteration of the global nitrogen cycle: Sources and consequences. Ecol. Appl. 1997, 7, 737–750. [Google Scholar] [CrossRef]
  28. Liu, L.; Xu, W.; Lu, X.; Zhong, B.; Guo, Y.; Lu, X.; Zhao, Y.; He, W.; Wang, S.; Zhang, X.; et al. Exploring global changes in agricultural ammonia emissions and their contribution to nitrogen deposition since 1980. Proc. Natl. Acad. Sci. USA 2022, 119, e2121998119. [Google Scholar] [CrossRef]
  29. LeBauer, D.S.; Treseder, K.K. Nitrogen limitation of net primary productivity in terrestrial ecosystems is globally distributed. Ecology 2008, 89, 371–379. [Google Scholar] [CrossRef]
  30. Mo, J.; Zhang, W.; Zhu, W.; Gundersen, P.; Fang, Y.; Li, D.; Wang, H. Nitrogen addition reduces soil respiration in a mature tropical forest in southern China. Glob. Chang. Biol. 2008, 14, 403–412. [Google Scholar] [CrossRef]
  31. Lu, X.; Mo, J.; Gilliam, F.S.; Zhou, G.; Fang, Y. Effects of experimental nitrogen additions on plant diversity in an old-growth tropical forest. Glob. Chang. Biol. 2010, 16, 2688–2700. [Google Scholar] [CrossRef]
  32. Lu, X.; Mao, Q.; Gilliam, F.S.; Luo, Y.; Mo, J. Nitrogen deposition contributes to soil acidification in tropical ecosystems. Glob. Chang. Biol. 2014, 20, 3790–3801. [Google Scholar] [CrossRef]
  33. Hobbie, S.E.; Vitousek, P.M. Nutrient limitation of decomposition in Hawaiian forests. Ecology 2000, 81, 1867–1877. [Google Scholar] [CrossRef]
  34. Wardle, D.A.; Walker, L.R.; Bardgett, R.D. Ecosystem properties and forest decline in contrasting long-term chronosequences. Science 2004, 305, 509–513. [Google Scholar] [CrossRef] [PubMed]
  35. Camenzind, T.; Haettenschwiler, S.; Treseder, K.K.; Lehmann, A.; Rillig, M.C. Nutrient limitation of soil microbial processes in tropical forests. Ecol. Monogr. 2018, 88, 4–21. [Google Scholar] [CrossRef]
  36. Huang, W.-J.; Zhou, G.-Y.; Liu, J.-X. Nitrogen and phosphorus status and their influence on aboveground production under increasing nitrogen deposition in three successional forests. Acta Oecologica-Int. J. Ecol. 2012, 44, 20–27. [Google Scholar] [CrossRef]
  37. Li, J.; Li, Z.; Wang, F.; Zou, B.; Chen, Y.; Zhao, J.; Mo, Q.; Li, Y.; Li, X.; Xia, H. Effects of nitrogen and phosphorus addition on soil microbial community in a secondary tropical forest of China. Biol. Fertil. Soils 2015, 51, 207–215. [Google Scholar] [CrossRef]
  38. Ma, X.; Zhou, Z.; Chen, J.; Xu, H.; Ma, S.; Dippold, M.A.; Kuzyakov, Y. Long-term nitrogen and phosphorus fertilization reveals that phosphorus limitation shapes the microbial community composition and functions in tropical montane forest soil. Sci. Total Environ. 2023, 854, 158709. [Google Scholar] [CrossRef]
  39. Ma, S.; Chen, X.; Su, H.; Xing, A.; Chen, G.; Zhu, J.; Zhu, B.; Fang, J. Phosphorus addition decreases soil fungal richness and alters fungal guilds in two tropical forests. Soil Biol. Biochem. 2022, 175, 108836. [Google Scholar] [CrossRef]
  40. Viles, H.A. Blue-green algae and terrestrial limestone weathering on Aldabra Atoll: An SEM and light microscope study. Earth Surf. Process. Landf. 1987, 12, 319–330. [Google Scholar] [CrossRef]
  41. Depaivaazevedo, M.T. Edaphic blue-green-algae from the São-Paulo Botanical Graden, Brazil. Arch. Hydrobiol. 1991, 64, 503–526. [Google Scholar]
  42. Liu, L.; Gao, Y.; Yang, W.; Liu, J.; Wang, Z. Community metagenomics reveals the processes of nutrient cycling regulated by microbial functions in soils with P fertilizer input. Plant Soil 2023, 1–16. [Google Scholar] [CrossRef]
  43. Wang, L.; Zhang, H.; Wang, J.; Wang, J.; Zhang, Y. Long-term fertilization with high nitrogen rates decreased diversity and stability of diazotroph communities in soils of sweet potato. Appl. Soil Ecol. 2022, 170, 104266. [Google Scholar] [CrossRef]
  44. Liengen, T. Environmental factors influencing the nitrogen fixation activity of free-living terrestrial cyanobacteria from a high arctic area, Spitsbergen. Can. J. Microbiol. 1999, 45, 573–581. [Google Scholar] [CrossRef]
  45. Wang, J.; Bao, J.T.; Su, J.Q.; Li, X.R.; Chen, G.X.; Ma, X.F. Impact of inorganic nitrogen additions on microbes in biological soil crusts. Soil Biol. Biochem. 2015, 88, 303–313. [Google Scholar] [CrossRef]
  46. Kuske, C.R.; Yeager, C.M.; Johnson, S.; Ticknor, L.O.; Belnap, J. Response and resilience of soil biocrust bacterial communities to chronic physical disturbance in arid shrublands. ISME J. 2012, 6, 886–897. [Google Scholar] [CrossRef]
  47. Zhang, J.; Zhou, J.; Lambers, H.; Li, Y.; Li, Y.; Qin, G.; Wang, M.; Wang, J.; Li, Z.; Wang, F. Nitrogen and phosphorus addition exerted different influences on litter and soil carbon release in a tropical forest. Sci. Total Environ. 2022, 832, 155049. [Google Scholar] [CrossRef] [PubMed]
  48. Chen, Y.; Sayer, E.J.; Li, Z.; Mo, Q.; Li, Y.; Ding, Y.; Wang, J.; Lu, X.; Tang, J.; Wang, F. Nutrient limitation of woody debris decomposition in a tropical forest: Contrasting effects of N and P addition. Funct. Ecol. 2016, 30, 295–304. [Google Scholar] [CrossRef]
  49. Wang, F.; Li, J.; Wang, X.; Zhang, W.; Zou, B.; Neher, D.A.; Li, Z. Nitrogen and phosphorus addition impact soil N2O emission in a secondary tropical forest of South China. Sci. Rep. 2014, 4, 5615. [Google Scholar] [CrossRef]
  50. Ding, M.; Yi, W.; Liao, L.; Martens, R.; Insam, H. Effect of afforestation on microbial biomass and acitivity in soils of tropical China. Soil Biol. Biochem. 1992, 24, 865–872. [Google Scholar] [CrossRef]
  51. Ren, H.; Li, Z.; Shen, W.; Yu, Z.; Peng, S.; Liao, C.; Ding, M.; Wu, J. Changes in biodiversity and ecosystem function during the restoration of a tropical forest in south China. Sci. China Ser. C Life Sci. 2007, 50, 277–284. [Google Scholar] [CrossRef]
  52. Liu, L.; Gundersen, P.; Zhang, T.; Mo, J. Effects of phosphorus addition on soil microbial biomass and community composition in three forest types in tropical China. Soil Biol. Biochem. 2012, 44, 31–38. [Google Scholar] [CrossRef]
  53. Wright, S.J.; Yavitt, J.B.; Wurzburger, N.; Turner, B.L.; Tanner, E.V.J.; Sayer, E.J.; Santiago, L.S.; Kaspari, M.; Hedin, L.O.; Harms, K.E.; et al. Potassium, phosphorus, or nitrogen limit root allocation, tree growth, or litter production in a lowland tropical forest. Ecology 2011, 92, 1616–1625. [Google Scholar] [CrossRef]
  54. R Core Team. R: A Language and Environment for Statistical Computing; R Foundation for Statistical Computing: Vienna, Austria, 2020; Available online: http://www.R-project.org/ (accessed on 1 June 2023).
  55. Amend, A.S.; Seifert, K.A.; Bruns, T.D. Quantifying microbial communities with 454 pyrosequencing: Does read abundance count? Mol. Ecol. 2010, 19, 5555–5565. [Google Scholar] [CrossRef] [PubMed]
  56. Camenzind, T.; Hempel, S.; Homeier, J.; Horn, S.; Velescu, A.; Wilcke, W.; Rillig, M.C. Nitrogen and phosphorus additions impact arbuscular mycorrhizal abundance and molecular diversity in a tropical montane forest. Glob. Chang. Biol. 2014, 20, 3646–3659. [Google Scholar] [CrossRef] [PubMed]
  57. Lu, Y.; Liu, X.; Zhou, S. Nitrogen addition altered the plant-arbuscular mycorrhizal fungi network through reducing redundant interactions in an alpine meadow. Soil Biol. Biochem. 2022, 171, 108727. [Google Scholar] [CrossRef]
  58. Oksanen, J.; Blanchet, F.G.; Kindt, R.; Legendre, P.; O’Hara, R.B. Vegan: Community Ecology Package 2015. Available online: https://cran.r-project.org/web/packages/vegan/vegan.pdf (accessed on 1 September 2019).
  59. De Caceres, M.; Legendre, P. Associations between species and groups of sites: Indices and statistical inference. Ecology 2009, 90, 3566–3574. [Google Scholar] [CrossRef] [PubMed]
  60. Metting, B. The systematics and ecology of soil algae. Bot. Rev. 1981, 47, 195–312. [Google Scholar] [CrossRef]
  61. Fierer, N.; Schimel, J.P.; Holden, P.A. Variations in microbial community composition through two soil depth profiles. Soil Biol. Biochem. 2003, 35, 167–176. [Google Scholar] [CrossRef]
  62. Schultz, M.; Porembski, S.; Budel, B. Diversity of rock-inhabiting cyanobacterial lichens: Studies on granite inselbergs along the Orinoco and in Guyana. Plant Biol. 2000, 2, 482–495. [Google Scholar] [CrossRef]
  63. Neustupa, J.; Skaloud, P. Diversity of subaerial algae and cyanobacteria growing on bark and wood in the lowland tropical forests of Singapore. Plant Ecol. Evol. 2010, 143, 51–62. [Google Scholar] [CrossRef]
  64. Cano-Diaz, C.; Maestre, F.T.; Wang, J.; Li, J.; Singh, B.K.; Ochoa, V.; Gozalo, B.; Delgado-Baquerizo, M. Effects of vegetation on soil cyanobacterial communities through time and space. New Phytol. 2022, 234, 435–448. [Google Scholar] [CrossRef]
  65. Aleksakhina, T.; Shtina, E. Terrestrial Algae of Forest Biogeocoenoses (Pochvennye vodorosli lesnykh Biogeotsenozov); Nauka: Moscow, Russia, 1984; p. 174. [Google Scholar]
  66. Hoffmann, L. Algae of terrestrial habitats. Bot. Rev. 1989, 55, 77–105. [Google Scholar] [CrossRef]
  67. Khaybullina, L.S.; Gaysina, L.A.; Johansen, J.R.; Krautová, M. Examination of the terrestrial algae of the Great Smoky Mountains National Park, USA. Fottea 2010, 10, 201–215. [Google Scholar] [CrossRef]
  68. Dodds, W.K.; Gudder, D.A.; Mollenhauer, D. The ecology of Nostoc. J. Phycol. 1995, 31, 2–18. [Google Scholar] [CrossRef]
  69. Yu, S.; Mo, Q.; Chen, Y.; Li, Y.; Li, Y.; Zou, B.; Xia, H.; Jun, W.; Li, Z.; Wang, F. Effects of seasonal precipitation change on soil respiration processes in a seasonally dry tropical forest. Ecol. Evol. 2020, 10, 467–479. [Google Scholar] [CrossRef] [PubMed]
  70. Sun, R.; Zhang, P.; Riggins, C.W.; Zabaloy, M.C.; Rodriguez-Zas, S.; Villami, M.B. Long-Term N Fertilization Decreased Diversity and Altered the Composition of Soil Bacterial and Archaeal Communities. Agronomy 2019, 9, 574. [Google Scholar] [CrossRef]
  71. Rejmankova, E.; Komarkova, J. Response of cyanobacterial mats to nutrient and salinity changes. Aquat. Bot. 2005, 83, 87–107. [Google Scholar] [CrossRef]
  72. Ramirez, K.S.; Lauber, C.L.; Knight, R.; Bradford, M.A.; Fierer, N. Consistent effects of nitrogen fertilization on soil bacterial communities in contrasting systems. Ecology 2010, 91, 3463–3470. [Google Scholar] [CrossRef]
  73. Ramirez, K.S.; Craine, J.M.; Fierer, N. Consistent effects of nitrogen amendments on soil microbial communities and processes across biomes. Glob. Chang. Biol. 2012, 18, 1918–1927. [Google Scholar] [CrossRef]
  74. Hall, S.J.; Matson, P.A. Nitrogen oxide emissions after nitrogen additions in tropical forests. Nature 1999, 400, 152–155. [Google Scholar] [CrossRef]
  75. Zhang, Y.; Shen, H.; He, X.; Thomas, B.W.; Lupwayi, N.Z.; Hao, X.; Thomas, M.C.; Shi, X. Fertilization Shapes Bacterial Community Structure by Alteration of Soil pH. Front. Microbiol. 2017, 8, 1325. [Google Scholar] [CrossRef]
  76. Chen, D.; Lan, Z.; Hu, S.; Bai, Y. Effects of nitrogen enrichment on belowground communities in grassland: Relative role of soil nitrogen availability vs. soil acidification. Soil Biol. Biochem. 2015, 89, 99–108. [Google Scholar] [CrossRef]
  77. Reynaud, P.A. Ecology of nitrogen-fixing cyanobacteria in dry tropical habitats of West Africa: A multivariate analysis. Plant Soil 1987, 98, 203–220. [Google Scholar] [CrossRef]
  78. Sun, Q.; Zheng, Y.; Yu, T.; Wu, Y.; Yang, J.; Wu, Z.; Wu, J.; Li, S. Responses of soil diazotrophic diversity and community composition of nodulating and non-nodulating peanuts (Arachis hypogaea L.) to nitrogen fertilization. Acta Agron. Sin. 2022, 48, 2575–2587. [Google Scholar]
  79. Duah-Yentumi, S.; Ronn, R.; Christensen, S. Nutrients limiting microbial growth in a tropical forest soil of Ghana under different management. Appl. Soil Ecol. 1998, 8, 19–24. [Google Scholar] [CrossRef]
  80. Yanni, Y.G.; Abdelrahman, A.A.M. Assessing phosphorus fertilization of rice in the nile delta involving nitrogen and cyanobacteria. Soil Biol. Biochem. 1993, 25, 289–293. [Google Scholar] [CrossRef]
  81. Roger, P.A.; Kulasooriya, S.A. Biue-Green Algae and Rice; The International Rice Research Institute: Manila, Philippines, 1980; pp. 29–30. [Google Scholar]
  82. Chapin, D.M.; Bliss, L.C.; Bledsoe, L.J. Environmental-regulation of nitrogen-fixation in a high artic lowland ecosystem. Can. J. Bot.-Rev. Can. Bot. 1991, 69, 2744–2755. [Google Scholar] [CrossRef]
  83. Benner, J.W.; Vitousek, P.M. Development of a diverse epiphyte community in response to phosphorus fertilization. Ecol. Lett. 2007, 10, 628–636. [Google Scholar] [CrossRef]
  84. Cerna, B.; Rejmankova, E.; Snyder, J.M.; Santruckova, H. Heterotrophic nitrogen fixation in oligotrophic tropical marshes: Changes after phosphorus addition. Hydrobiologia 2009, 627, 55–65. [Google Scholar] [CrossRef]
  85. Rejmankova, E.; Macek, P.; Epps, K. Wetland ecosystem changes after three years of phosphorus addition. Wetlands 2008, 28, 914–927. [Google Scholar] [CrossRef]
  86. Santruckova, H.; Rejmankova, E.; Pivnickova, B.; Snyder, J.M. Nutrient enrichment in tropical wetlands: Shifts from autotrophic to heterotrophic nitrogen fixation. Biogeochemistry 2010, 101, 295–310. [Google Scholar] [CrossRef]
  87. Verbruggen, E.; van der Heijden, M.G.A.; Weedon, J.T.; Kowalchuk, G.A.; Roling, W.F.M. Community assembly, species richness and nestedness of arbuscular mycorrhizal fungi in agricultural soils. Mol. Ecol. 2012, 21, 2341–2353. [Google Scholar] [CrossRef]
  88. Hillebrand, H.; Bennett, D.M.; Cadotte, M.W. Consequences of dominance: A review of evenness effects on local and regional ecosystem processes. Ecology 2008, 89, 1510–1520. [Google Scholar] [CrossRef] [PubMed]
  89. Song, M.-H.; Zong, N.; Jiang, J.; Shi, P.-L.; Zhang, X.-Z.; Gao, J.-Q.; Zhou, H.-K.; Li, Y.-K.; Loreau, M. Nutrient-induced shifts of dominant species reduce ecosystem stability via increases in species synchrony and population variability. Sci. Total Environ. 2019, 692, 441–449. [Google Scholar] [CrossRef] [PubMed]
  90. Siddique, I.; Guimaraes Vieira, I.C.; Schmidt, S.; Lamb, D.; Reis Carvalho, C.J.; Figueiredo, R.D.O.; Blomberg, S.; Davidson, E.A. Nitrogen and phosphorus additions negatively affect tree species diversity in tropical forest regrowth trajectories. Ecology 2010, 91, 2121–2131. [Google Scholar] [CrossRef] [PubMed]
  91. Matson, P.A.; McDowell, W.H.; Townsend, A.R.; Vitousek, P.M. The globalization of N deposition: Ecosystem consequences in tropical environments. Biogeochemistry 1999, 46, 67–83. [Google Scholar] [CrossRef]
  92. Ma, S.; Chen, G.; Tang, W.; Xing, A.; Chen, X.; Xiao, W.; Zhou, L.; Zhu, J.; Li, Y.; Zhu, B.; et al. Inconsistent responses of soil microbial community structure and enzyme activity to nitrogen and phosphorus additions in two tropical forests. Plant Soil 2021, 460, 453–468. [Google Scholar] [CrossRef]
  93. Turner, B.L.; Wright, S.J. The response of microbial biomass and hydrolytic enzymes to a decade of nitrogen, phosphorus, and potassium addition in a lowland tropical rain forest. Biogeochemistry 2014, 117, 115–130. [Google Scholar] [CrossRef]
  94. Zhao, M.; Cong, J.; Cheng, J.; Qi, Q.; Sheng, Y.; Ning, D.; Lu, H.; Wyckoff, K.N.; Deng, Y.; Li, D.; et al. Soil Microbial Community Assembly and Interactions Are Constrained by Nitrogen and Phosphorus in Broadleaf Forests of Southern China. Forests 2020, 11, 285. [Google Scholar] [CrossRef]
  95. Wang, Q.; Wang, C.; Yu, W.W.; Turak, A.; Chen, D.W.; Huang, Y.; Ao, J.H.; Jiang, Y.; Huang, Z.R. Effects of Nitrogen and Phosphorus Inputs on Soil Bacterial Abundance, Diversity, and Community Composition in Chinese Fir Plantations. Front. Microbiol. 2018, 9, 1543. [Google Scholar] [CrossRef]
  96. Ma, S.; Chen, G.; Tian, D.; Du, E.; Xiao, W.; Jiang, L.; Zhou, Z.; Zhu, J.; He, H.; Zhu, B.; et al. Effects of seven-year nitrogen and phosphorus additions on soil microbial community structures and residues in a tropical forest in Hainan Island, China. Geoderma 2020, 361, 114034. [Google Scholar] [CrossRef]
  97. Zhao, J.; Wang, F.; Li, J.; Zou, B.; Wang, X.; Li, Z.; Fu, S. Effects of experimental nitrogen and/or phosphorus additions on soil nematode communities in a secondary tropical forest. Soil Biol. Biochem. 2014, 75, 1–10. [Google Scholar] [CrossRef]
Figure 1. Ordination plot of a redundancy analysis (RDA), modeling the effect of NP addition, soil layer, and soil chemical property on the cyanobacterial gene abundance matrix. Samples from 0–10 cm were represented by open patterns, samples from 10–20 cm by closed patterns. Ctr samples are represented by circles, +N treatment by squares, +P treatment by triangles, and +NP treatment by diamonds. Adjusted R2 and p values of the RDA model were showed on the left-top. TC is total soil carbon determined via dry combustion. TN is total soil N. TP is total soil P. NO3-N is soil nitrate-N. NH4+-N is soil ammonium-N. Pextrac is soil extractable P. Explanatory factors significantly correlated to the soil cyanobacterial community data are highlighted in bold (p < 0.050). Please see Table S1 for the significance of each explanatory variable.
Forests 14 02216 g001
Figure 2. Soil cyanobacterial (A) abundance, (B) species richness, and (C) Shannon’s diversity index under different treatments. Abundance is gene copy number (g−1 soil); Rarified species richness is estimated species number calculated with function rarecurve() (R package ‘vegan’); Shannon diversity is Shannon’s H index calculated as diversity index using the function diversity() in R package ‘vegan’. The * indicates there is a significant difference compared to the Ctr treatment at 0–20 cm soil layer (p < 0.050).
Forests 14 02216 g002
Figure 3. Reordered cyanobacterial metagenomic gene matrix based on minimum matrix temperature under the assumption of nestedness (matrix temperature = 43.15). Rows represent single samples, columns genes. Red/white matrix fillings indicate presence/absence of genes, respectively. Symbols on the right indicate the median position of treatments within the matrix with the respective upper and lower quartiles. There were not significant differences among treatments (p > 0.050; Wilcoxon signed-rank tests).
Forests 14 02216 g003
Table 1. Results of linear mixed effects model examining NP addition and soil layer effects on soil cyanobacterial abundance, species richness, and Shannon’s diversity.
AbundanceSpecies RichnessShannon’s Diversity
CoefficientpCoefficientpCoefficientp
N addition−6.500.8512.180.1020.170.136
P addition−78.750.0233.390.0110.310.005
10–20 cm0.440.900−0.440.001−0.04<0.001
Notes: Data used for fitting the model include values from both 0–10 and 10–20 cm (n = 32). Coefficients given in the table are estimated slopes of each explanatory variable in the model. P-values for the effects of NP addition and soil layer effects are presented; significant effects (p < 0.050) are printed in bold.
Table 2. Results of linear mixed effects model examining NP addition and soil layer effects on soil chemical properties.
Soil Property N AdditionP Addition10–20 cm
pHcoefficient−0.1910.2510.034
p0.0290.004<0.001
TCcoefficient0.054−0.336−0.061
p0.6800.007<0.001
TNcoefficient0.127−0.339−0.068
p0.080<0.001<0.001
TPcoefficient−0.0130.284−0.011
p0.708<0.0010.009
NH4+-Ncoefficient0.653−0.970−0.102
p0.1140.0180.016
NO3-Ncoefficient4.708−7.4120.047
p0.004<0.0010.741
Pextraccoefficient−0.80220.601−0.065
p0.106<0.0010.160
Notes: coefficients of each fixed effect and their p values are showed. Significant values at the α = 0.050 level are highlighted in bold. Soil chemical properties at 0–10 cm had been reported by Zhang et al. [47].
Table 3. Indicator species associated with treatment.
SpeciesTreatmentp
Richelia sp. SL21 +NP0.041
unclassified gene 1+NP0.034
Nostoc sp. 3335mG +N and +NP0.027
unclassified gene 2+P and +NP0.046
Notes: Indicator species were identified by the function multipatt() in the package ‘indicspecies’, implementing 999 permutations.
Disclaimer/Publisher’s Note: The statements, opinions and data contained in all publications are solely those of the individual author(s) and contributor(s) and not of MDPI and/or the editor(s). MDPI and/or the editor(s) disclaim responsibility for any injury to people or property resulting from any ideas, methods, instructions or products referred to in the content.

