Abstract
The uneven rainfall distribution, limited soil nutrients, and continuous cropping effect in the Loess Plateau restrict the sustainable development of fruit tree/crop (soybean and maize) intercropping systems. A two-year field experiment was conducted to investigate the effects of different water and fertilizer regimes on the soil nutrients and growth of intercropping systems during the crop replacement period. The experiment involved three irrigation levels (0% (I0), 50% (I1), and 80% (I2) of field capacity), two irrigation methods (drip irrigation (DI) and flood irrigation (FI)), and three fertilizer application rates (0 (F0), 375 (F1), and 750 (F2) kg/hm2). The results showed that in 2020 and 2021, the soil water contents increased with increasing irrigation and fertilization. The soil ammonium nitrogen, nitrate nitrogen, and soil organic matter contents in 2021 were 21.0%–68.4% higher than those in 2020. Increasing the fertilizer application rate improved the photosynthesis rate and transpiration rate of apples and maize in 2020 but had a reverse U-shape effect on soybeans in 2021. Irrigation and fertilization increased soybean and maize yields by 2.9%–30.5% compared with the I0F0 treatment. The maize root indicators generally showed an increasing trend followed by a decreasing trend with increasing fertilizer application in 2020, while soybean exhibited an opposite pattern in 2021. The FI1F1 and DI2F2 treatments yielded the optimal economic benefit in 2020 and 2021, respectively. Therefore, from an economic standpoint, FI and DI would have been recommended in 2020 and 2021, respectively. Factor analysis suggested that the DI2F2 treatments had the highest comprehensive benefits over the two years studied. Therefore, we recommend using DI combined with 80% field capacity irrigation and 750 kg/hm2 fertilization to maximize the comprehensive benefits of intercropping systems during the crop replacement period.
1. Introduction
For decades, agroforestry systems have been essential in optimizing land resource utilization [1], improving the ecological environment [2], and boosting farmers’ incomes [3]. Since 2019, the Loess Plateau has become a significant apple production area in China, accounting for over half of the nation’s apple planting area and output [4]. To tackle the challenge of balancing young apple tree growth with consistent returns per acre, local farmers commonly employ an intercropping strategy whereby high-stem and low-stem crops are underplanted within the orchard. However, the region’s uneven rainfall distribution and limited soil nutrient resources can intensify interspecific competition between these crops, resulting in significant decreases in yield [5].
Furthermore, intercropping of maize and apple trees for three consecutive years is a common practice in the region, starting from the first year of three consecutive years. Continuous cropping of the same crop for multiple years in intercropping systems can generate self-toxic effects and lead to severe imbalances of soil nutrients [6], further exacerbating interspecific competition for water and fertilizer. A previous study has found that, compared with no fertilization or nitrogen-only fertilization treatments, only the N/P/K compound fertilizer treatment can maintain the yield of consecutive rice crops without reduction [7]. This continuous cropping effect is particularly pronounced in maize in the third year of intercropping. To mitigate this effect, local farmers switch to soybeans as intercrops in the fourth year. However, the impacts on soybean growth of self-toxic effects and soil nutrient imbalances in the fourth year, due to the previous maize crop, remain unclear. Moreover, the coupling of interspecific interactions between crops and the continuous cropping effect also remains poorly understood and can introduce greater uncertainty in plant growth characteristics and soil quality [5]. To alleviate water and fertilizer competition in intercropping systems, particularly during crop replacement periods, and to promote sustainable development, the provision of supplementary water and fertilizer resources is essential during critical crop growth phases.
The growth characteristics of plants are significantly influenced by soil nutrients [8]. When soybeans are intercropped with flax under unfertilized, rain-fed conditions, the yield and plant height are reduced compared with monocultured soybeans, due to interspecific competition for water and nutrients [9]. However, under fertilized, rain-fed conditions, intercropped soybeans are suppressed by the shade from high-stem crops, although supplementary fertilization can increase the biomass of soybean leaves, thus enhancing the complementary effects by capturing more light [10]. A significant interaction exists between irrigation and fertilization [11], with irrigation increasing fertilizer utilization efficiency in intercropping systems, thereby achieving the goal of using less fertilizer [12]. Additionally, irrigation and fertilizer input can increase soil moisture and nutrient content, as well as root density, which in turn increases the niche overlap of the roots and the intensity of competition for water and fertilizer [13]. Therefore, to maximize the positive effects of irrigation and fertilization, it is important to consider the potential negative impacts of excessive application, such as excessive vegetative growth and soil nutrient leaching [14,15], and use reasonable amounts of both to increase plant photosynthesis, growth, and root system development.
Different irrigation methods can lead to diverse soil moisture and nutrient conditions, resulting in varied effects on the regulation of plant growth characteristics. Drip irrigation, with its linear water distribution, can deliver water directly to the crop roots. The uneven distribution of water and fertilizer between irrigated and non-irrigated areas in drip irrigation can lead to changes in plant interactions in intercropping systems [16]. Previous studies on intercropping with drip irrigation have indicated that crop root density and volume are positively correlated with irrigation levels, and that irrigation can affect the overlap of soil surface roots in tomatoes and maize [17]. Another study has shown that applying drip irrigation to a raspberry/grass intercropping system reduced nitrogen leaching and improved soil fertility compared with a monoculture [10]. Currently, flood irrigation is a commonly used method for water replenishment in the Loess Plateau region. Flood irrigation and fertilization can alter the photosynthetic rate and transpiration rate of intercropped fruit trees and crops during critical growth stages, ultimately affecting plant biomass and yield [18]. Provision of water by flood irrigation can also reduce soil bulk density and increase soil porosity, improving the root environment of intercropped alfalfa and wheat [19].
Our team has previously conducted research on water and nutrient regulation in flood and drip irrigation systems in the Loess Plateau region, and the results showed that both irrigation methods can improve productivity under suitable water and nutrient input levels [20,21]. However, our previous studies were carried out on continuous cropping systems, and it remains unclear how best to regulate water and fertilizer inputs during the crop replacement period because crop replacement may create more uncertainty in soil water and nutrient changes [22].
We chose an apple/maize system in the third year of intercropping and an apple/soybean system in the fourth year of intercropping for our study in the Loess Plateau region of west Shanxi, China. Our primary objectives were twofold: (1) to assess the impacts of various water and fertilizer management strategies on the soil moisture, nutrients, and growth indicators of the intercropped plants; and (2) to determine the optimal water and fertilizer management strategies during the crop replacement period. The results from this investigation are critical for enhancing the benefits of the apple tree/maize and apple tree/soybean intercropping systems.
2. Materials and Methods
2.1. Experimental Site
The study area is located in Shishanwan, Ji County, Linfen City, Shanxi Province, China, and is a typical hilly loess region with elevations ranging from 383 to 1812 m (Figure 1). The annual sunshine duration is 2550 h, and the accumulated temperature above 10 °C is 3366 °C. The climate is classified as temperate continental, with an annual mean temperature of 11 °C, an annual precipitation of 522 mm, and an annual potential evaporation of 1724 mm. The average bulk density of the top 0–60 cm of soil in the orchard was 1.35 g/cm3, and the average field capacity was 24.7% (g/g). The soil nutrient values for the top 0–100 cm of soil were: soil organic matter 4.45 g/kg, ammonium nitrogen 5.17 mg/kg, nitrate nitrogen 17.03 mg/kg, and total phosphorus 0.62 g/kg. The average temperature and precipitation at the experimental site during the crop growing season in 2020 were 16.64 °C and 209 mm, respectively, with 81.6% of the precipitation concentrated during the maize seeding stage (171 mm). In 2021, the average temperature and precipitation during the growing season were 20.78 °C and 635.9 mm, respectively, with 56.0% of the precipitation (356 mm) concentrated during the soybean maturation stage (Figure 2). A heavy rainfall event occurred on 17 September 2021 (soybean maturation stage), with 24-h rainfall reaching 63.40 mm.
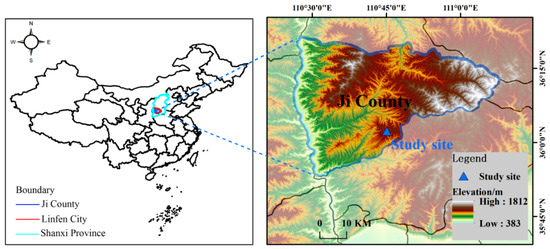
Figure 1.
Geographical location of the study area. The map of China is from a standard map service website (http://bzdt.ch.mnr.gov.cn/, accessed on 1 March 2020).
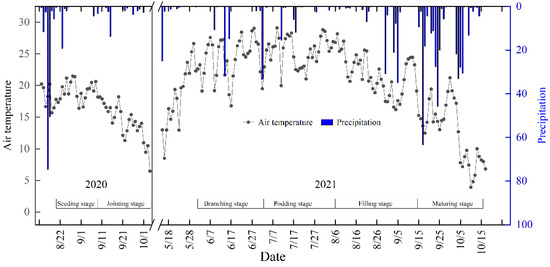
Figure 2.
Precipitation and temperature during the co-growth period of the apple trees and crops in 2020 and 2021.
2.2. Experimental Design
The field experiment was conducted in 2020 and 2021. A three-factor randomized block design was used based on irrigation amount (I), irrigation method (M), and fertilizer application rate (F). Based on the soil moisture range suitable for growing apples and crops [23,24], three irrigation levels were set: rain-fed (I0), 50% of the average field capacity (after irrigation) (I1), and 80% of the average field capacity (upper limit of irrigation) (I2), respectively. There were not many days during the crop growing season when the average soil moisture content at 0–60 cm depth in the area was below 50% of the field capacity [20,23]. We used two irrigation methods, drip irrigation (DI) and flood irrigation (FI), and tested three fertilizer application rates: no fertilizer (F0), 50% of the locally applied fertilizer rate (375 kg/hm2 (F1)), and 100% of the locally applied fertilizer rate (750 kg/hm2 (F2)). The determination of fertilizer application rate was based on local practical experience [23]. Before plowing, 75 kg/hm2 of N/P/K compound fertilizer (N-P2O5-K2O, 20/8/12) was applied evenly to all treatments as base fertilizer. The top dressing type used in the treatments was consistent with basal fertilization. The numbers 1 and 2 in the bottom right corner of the letters FI or DI (e.g., FI1 and DI2) represent the I1 and I2 levels, respectively. In total, the experiment had 15 treatments (drip irrigation treatments (DI1F0, DI1F1, DI1F2, DI2F0, DI2F1, and DI2F2), flood irrigation treatments (FI1F0, FI1F1, FI1F2, FI2F0, FI2F1, and FI2F2), and rain-fed treatments (I0F1, I0F2, and I0F0)) with three replicates each, to make 45 14 m2 plots (Table 1). Each plot was covered with 0.6 m wide white polyethylene film strips, with two rows of crops under each film strip and 40 cm spaces between strips.

Table 1.
Irrigation and fertilizer amounts of different treatments in 2020 and 2021.
The apple/maize and apple/soybean intercropping systems typical of the region were selected for the research. The experiments were conducted using the same treatments on the same plots for two consecutive years. The apple trees (short branch Red Fuji) were planted in 2018 in rows oriented east–west, and had a tree spacing of 3.5 m × 5.0 m, a south–north canopy width of 1.8 m, an east–west canopy width of 1.3 m, and a canopy height of 2.7 m. Maize monoculture (Xianyu 335) had been implemented at this experimental site for ten years prior to 2020. In 2020 and 2021, the crop row spacing was 0.3 m × 0.5 m for both maize (2020) and soybean (2021). The crop rows were spaced 0.6 m from the apple rows, and all rows were oriented east–west. Maize (Xianyu 335) and soybean (Jindou No.35) were sown on 13 August 2020 and 27 April 2021, respectively. Each experimental plot consisted of one apple tree and eight rows of crops, with a total area of 14 m2 (Figure 3).
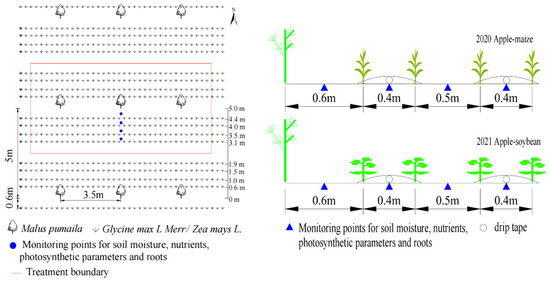
Figure 3.
Experiment plot and indicator monitoring points in 2020 and 2021.
The phenological periods of the two crops are shown in Figure 2. The maize was irrigated once during the jointing stage and the soybeans were irrigated three times, once each during the branching, podding, and filling stages (Table 1). The experiment used the established fixed irrigation quotas for dryland crops to calculate the amount of irrigation water, as follows [23,24]:
where M is the irrigation amount (mm); H is the depth of the target soil layer (0–60 cm); θw is the target gravimetric water content of the soil; θ0 is the measured gravimetric water content of the soil; and γ is the soil bulk density.
Drip tapes were placed under the plastic film along the crop rows with 0.3 m spaces between the emitters and a flow rate of 2.0 L/h. The two drip tapes were spaced 0.9 m apart (hence two rows of crops per drip tape), and the water came from the domestic water supply of a nearby household. Drip irrigation pipes were installed in the crop area, but not in the apple area across two years. The different treatments were spaced 5.0 m apart with a 5–20 cm high ridge at the treatment boundaries to prevent water loss. The total fertilizer was divided into multiple parts and applied multiple times with irrigation to each treatment. For the experiments, fertilizer was applied to the drip irrigation treatments using a venturi fertilizer applicator, while for the flood irrigation treatment, the fertilizer was evenly applied to the plot before irrigation. The irrigation and fertilization rates of each treatment in 2020 and 2021 are shown in Table 1.
2.3. Data Collection and Measurements
2.3.1. Soil Moisture
Soil water content testing was conducted at the seeding and jointing stages for maize in 2020, and the podding and mature stages for soybean in 2021 (Figure 4). Soil water content was measured 0.3 m, 0.8 m, 1.25 m, and 1.7 m away from the adjacent tree (Figure 3). Soil samples were collected using a soil auger (10 cm in diameter) from eight soil layers (0–10, 10–20, 20–30, 30–40, 40–50, 50–60, 60–80, and 80–100 cm) at four sampling points.
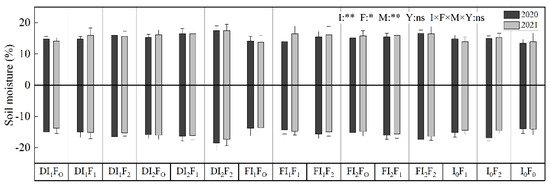
Figure 4.
Soil moisture of each treatment in 2020 and 2021. I, F, M, and Y indicate the irrigation amount, fertilizer application rate, irrigation method, and year (n = 45), respectively. The absolute values of vertical axis data represent soil water content, where positive and negative values represent the first and second soil samples in a year, respectively. ** indicates significant at the 0.01 level, * indicates significant at the 0.05 level, and ns indicates not significant (p < 0.05).
2.3.2. Soil Nutrients
Soil nutrient testing was conducted at the seeding and jointing stages for maize in 2020, and the podding and mature stages for soybean in 2021 (Figure 5). Soil nutrients were measured 0.3 m, 0.8 m, 1.25 m, and 1.7 m away from the adjacent tree (Figure 3). Soil samples were collected using a soil auger (10 cm in diameter) from four soil layers (0–20, 20–40, 40–60, and 60–100 cm) at four sampling points. The soil nutrient indicators tested comprised ammonium nitrogen (AN), nitrate nitrogen (NN), total phosphorus (TP), and soil organic matter (SOM). Mineral nitrogen (AN and NN) and TP were quantified using KCl solution extraction and H2SO4-HClO4 digestion [25], respectively, followed by analysis using a Smartchem 450 automatic chemical analyzer (AMS-Alliance, Rome, Italy). SOM was determined using the concentrated sulfuric acid–potassium dichromate heating oxidation method [26].
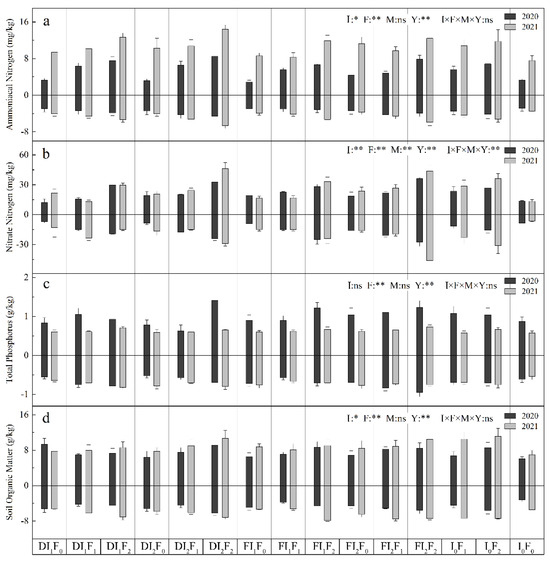
Figure 5.
Soil nutrients of each treatment in 2020 and 2021. I, F, M, and Y indicate the irrigation amount, fertilizer application rate, irrigation method, and year (n = 60), respectively. The absolute values of vertical axis data represent soil nutrient content, where positive and negative values represent the first and second soil samples in a year, respectively. ** indicates significant at the 0.01 level, * indicates significant at the 0.05 level, and ns indicates not significant (p < 0.05).
2.3.3. Photosynthetic Characteristics
On a sunny day during the maize jointing stage (17 September 2020) and soybean podding stage (25 July 2021), two Li-6400 photosynthesis analyzers (LI-COR, Inc., Lincoln, NE, USA) were used to measure the photosynthetic parameters and transpiration rates of the plant leaves. The photosynthetic indicators measured included leaf photosynthetic rate (Pn, μmol CO2·m−2·s−1) and transpiration rate (Tr, mmol H2O·m−2·s−1) (Figure 6). For the apple trees, leaf photosynthetic parameters were measured on a newly developed branch, and each leaf was measured three times. Crop plant photosynthetic parameters were sampled at the same sites used for measuring soil nutrients. Healthy soybean leaves closest to the measuring points were selected for marking and measurement. Measurements were taken every two hours from 9:00 a.m. to 5:00 p.m.
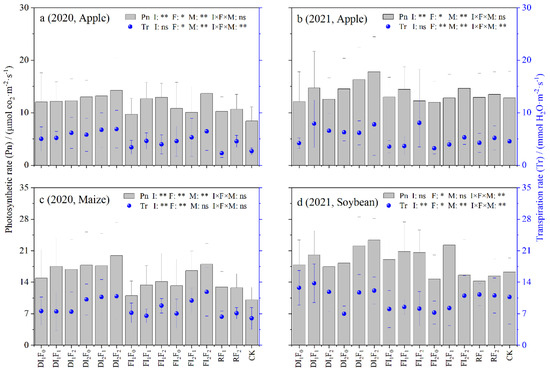
Figure 6.
Photosynthetic characteristics for each treatment of apples (a,b) and crops (c,d). I, F, and M indicate the irrigation amount, fertilizer application rate, and irrigation method (n = 60), respectively. ** indicates significant at the 0.01 level, * indicates significant at the 0.05 level, and ns indicates not significant (p < 0.05).
2.3.4. Growth Characteristics
For each plot, the plant heights of maize (seeding and jointing stages) and soybean (branching, podding, and filling stages) were measured for three plants per row using a measuring tape (Figure 7). The numbers of rows and plants for dry biomass measurement at jointing (maize) and maturity (soybean) corresponded to those used for plant height measurements. In late September 2020, the maize crops suffered from frost damage, resulting in failure to produce any yield. The maize yield values used in this study were derived from previously published empirical models (R2 = 0.80, p < 0.01), which had been developed under the same climatic conditions in the same location [27]. In 2021, at the soybean mature stage, one plot was randomly selected from each soybean treatment, and this yield measurement was taken as the yield for that treatment. Both yield and dry biomass were determined by oven-drying to constant weight.
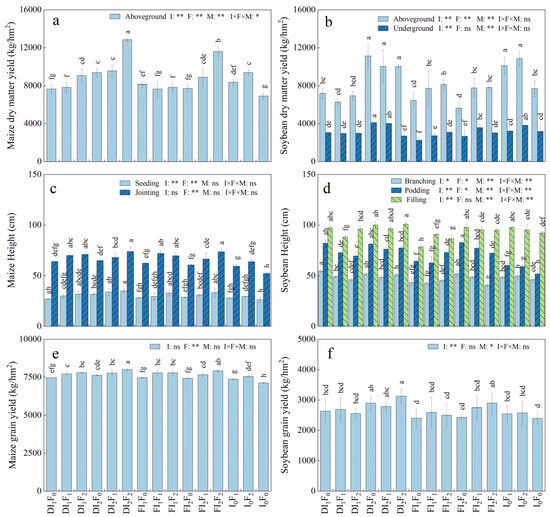
Figure 7.
The growth indices (a–d) and crops yield (e,f) for the apple–crop intercropping system in 2020 and 2021. I, F, and M indicate the irrigation amount, fertilizer application rate, and irrigation method (n = 45), respectively. ** indicates significant at the 0.01 level, * indicates significant at the 0.05 level, and ns indicates not significant (p < 0.05). Different lowercase letters indicate significant differences between the treatments (p < 0.05)
2.3.5. Root Characteristics
Root samples were taken at the same sampling points and depths as those used for measuring soil nutrients. Root samples were collected using a root auger (10 cm diameter, 1570 cm3 volume) at the maize jointing stage in 2020 and the soybean mature stage in 2021. The roots of apple trees and crops were distinguished by their different color: apple tree roots were red whereas the two crops’ roots were yellowish. After washing away the soil, apple tree and crop roots were separated using a 2 mm sieve and scanned using the WinRHIZO software (v. 2007, Reagent Instruments Inc., Quebec, QC, Canada) to measure total root length (mm), total root surface area (cm2), average root diameter (cm), and total root volume (cm3) (Figure 8).
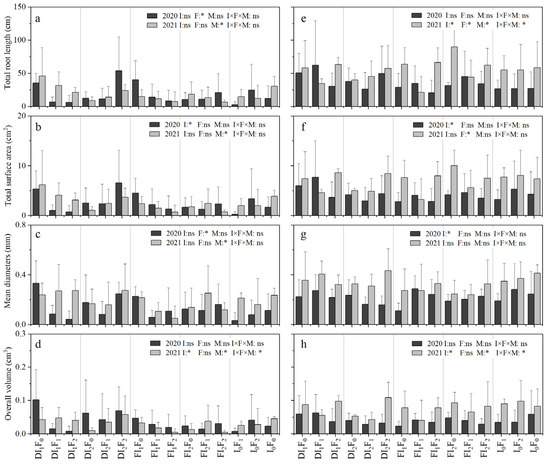
Figure 8.
Root characteristics of intercropping plants of each treatment in 2020 and 2021. (a–d) and (e–h) represent the apple and crop root characteristics. I, F, and M indicate the irrigation amount, fertilizer application rate, and irrigation method (n = 60), respectively. * indicates significant at the 0.05 level; ns indicates not significant (p > 0.05).
2.4. Data Processing
2.4.1. Linear and Quadratic Curve Fitting of Soil Nutrients and Photosynthesis
We used linear regression analyses and quadratic function fitting (Q) between crop photosynthetic parameters and soil nutrient values at four distances from the trees to investigate the interactions between apple trees and crops, and crop distances from the trees [20]. The linear regression coefficients of each treatment were calculated to characterize the effects of each treatment on interspecific competition. The larger the regression coefficient, the more unbalanced the value of the indicator in the horizontal direction (Table 2).
Table 2.
Relationship between soil nutrients and physiological characteristics and distance from trees.
2.4.2. Underground Interspecific Competition Intensity
Calculation of the interspecific competition intensity (UICII) between the apple and crop root systems was based on the degree of niche overlap between the two intercropping components (Table 3) [28], using the following formula [29]:
where UICII, PAi, and PSj represent the interspecific competition intensity (0 ≤ UICII ≤ 1), and the proportions of apple root length and crop fine root length, respectively. i and n are the identification number and the total number of soil layers, respectively.
Table 3.
Underground interspecific competition intensity for each treatment at different distances from the tree.
2.4.3. Economic Benefits
Three economic indicators were selected to evaluate the economic benefits of each treatment, namely, net income per hectare (NI), net income per unit of labor (NL), and production value per hectare (gross income per hectare, PV) [30]. The estimate of economic cost was based on actual expenses, determined by interviews with local farmers. The fuzzy analytic hierarchy process approach (fuzzy AHP) was used to calculate the weighted values of NI, NL, and PV [31], which were 0.58, 0.23, and 0.18, respectively. The economic benefit scores of each treatment were obtained by multiplying the weights by the standardized (min–max normalized) raw data for the three indexes (Table 4).
Table 4.
Score of economic benefits and ranking for all treatments in 2020 and 2021.
2.4.4. Comprehensive Score
Factor analysis can replace a large number of variables with a small number of composite factors, thus reducing the dimensions in complex relationships. In this study, a total of 14 apple and crop photosynthesis indicators (Pn and Tr), apple and crop root indicators (total root length, total root surface area), crop growth indicators (above-ground dry matter, yield), soil moisture, and soil nutrient levels (NN, TP, SOM) were selected to calculate the comprehensive benefit of each treatment in 2020 and 2021 (Figure 9). A factorial orthogonal rotation was performed using the principal component method to maximize the variance. In 2020 and 2021, the total contribution of the top four factors (Factors 1–4) exceeded 80% of the variance (see Section 3.6 for details). The comprehensive score was used to evaluate the ranking of each treatment in any one year [32], using the following formula:
where Fx is the total factor score for a treatment, Fi is the factor score for the ith factor, and ai is the contribution rate for the corresponding factor (n = 4).
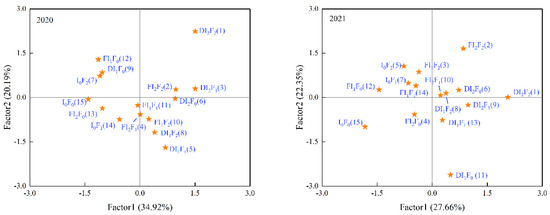
Figure 9.
Factor analysis of physiological characteristics, growth, and soil nutrients for water and fertilizer treatments in 2020 and 2021. Numbers in parentheses are the rankings of the combined scores for each treatment (n = 15). Factors 1 and 2 represent the first principal component and the second principal component, respectively. The X and Y coordinates of orange stars are the scores of this processing on the first and second principal components.
2.5. Statistical Analyses
Data processing and normalization were performed using Excel 2010 (Microsoft Corp., Redmond, WA, USA); linear regressions, quadratic fitting, and graphing were conducted using Origin 2019 (Origin Lab, Northampton, MA, USA); one-way and multi-way ANOVA and fuzzy AHP comprehensive evaluation analyses were performed using SPSS20 (SPSS Corp, Chicago, IL, USA); and factor analyses were conducted using R (v. 3.3.1, R Foundation for Statistical Computing, Vienna, Austria). The least significant difference method was used to compare the mean underground competition intensities and plant growth parameters at the 5% significance level. The F1 group represents the average of five treatments (DI1F1, DI2F1, FI1F1, FI2F1, and I0F1), while the I1 group represents the average of six treatments (DI1F0, DI1F1, DI1F2, FI1F0, FI1F1, and FI1F2). The same calculation method was applied to the F2 and I2 groups.
3. Results
3.1. Soil Moisture
In 2020 and 2021, the soil water contents increased with the increasing irrigation and fertilization (Figure 4). In 2020 and 2021, the maximum values of soil water content appeared in DI2F2, and the treatment increased by 23.8%–33.1% compared to the I0F0 treatment. The soil water contents of treatments in 2021 overall decreased by 0.7% compared with 2020. In 2020, the soil water contents of treatments in the second sampling overall increased by 2.8% compared with the first sampling. In 2021, the soil water contents of treatments in the second sampling overall decreased by 3.0% compared with the first sampling. Over the two years, the soil water content of the drip irrigation group was 1.4%–5.4% higher than that of the flood irrigation group.
3.2. Soil Nutrients
In 2020 and 2021, the overall AN, NN, TP, and SOM contents were positively correlated with irrigation and fertilization rates (Figure 5). Except for TP, the AN, NN, and SOM contents in 2021 increased by 21.0%–68.4% compared with 2020. Except for TP in 2021, the AN, NN, TP, and SOM contents in the second sampling decreased in both years by 29.4%–126.4% compared with the first sampling. For the AN and NN contents in 2021, and TP in 2020, the FI2F2 treatment showed the greatest difference between the two soil samples. Over the two years, except for AN, the NN, TP, and SOM contents of the flood irrigation group were 1.2%–13.9% higher than those of the drip irrigation group. This indicated that drip irrigation can increase the AN content, while flood irrigation can increase the NN, SOM, and TP contents.
3.3. Photosynthetic and Growth Characteristics
3.3.1. Photosynthetic Characteristics
In 2020 and 2021, the Pn and Tr of apples increased with increases in irrigation and fertilization levels (Figure 6). In 2020, the Pn and Tr increased in every treatment by 15.0%–157.1% compared with I0F0, except for Tr in the I0F1 treatment. In 2021, the Pn and Tr increased in every treatment by an average of 17.2% and 9.3%, respectively, compared with 2020.
In 2020, the trends in maize Pn and Tr with increasing irrigation and fertilizer application were consistent with those of apples. The Pn and Tr of maize increased by 5.9%–98.7% in all treatments compared with I0F0. In 2021, soybean Pn and Tr generally increased and then decreased with increasing fertilizer application under the same irrigation conditions (reverse U-shape).
In 2020 and 2021, the maximum values of Pn for apples and the two crops occurred in DI2F2, and were 4.6%–97.5% higher than in the other treatments. Compared with I0F0, the photosynthetic parameters in the different irrigation and fertilization groups for apples and crops in 2020 and 2021 increased by 61.9% and 12.1%, respectively. In summary, the increases in the photosynthetic parameters due to irrigation and fertilization were greater for the apple/maize intercropping system than for the apple/soybean intercropping system. On average over the two years, the photosynthetic parameters of apples and the two crops were higher in the drip irrigation group than in the flood irrigation group by 11.6%–25.0%; the F2 group was higher than the F1 group and I0F0 treatment by 0.5%–11.5% and 29.7%–34.7%, respectively; and the I2 group was higher than the I1 group and I0F0 treatment by 7.9%–9.3% and 29.8%–33.9%, respectively.
3.3.2. Growth Characteristics
In general, the growth indexes (dry matter, plant height, yield) of maize increased with increasing irrigation and fertilization (Figure 7). For soybeans, the three growth indicators increased with increasing irrigation at the same fertilizer level but showed no consistent trends with changes in nutrient levels. In 2020, the maximum and minimum values of above-ground dry matter and plant height of maize appeared in the DI2F2 and I0F0 treatments, respectively. Compared with the I0F0 treatment, the above-ground dry matter and plant height of maize increased by 1.6%–85.8% in all treatments. In 2021, the maximum value of above-ground and below-ground dry matter of soybeans both occurred in DI2F0, while the minimum values occurred in FI2F0 and FI1F0, respectively. The maximum values of soybean plant height were observed in treatments DI1F0, FI2F0, and DI2F2 during the three growth stages of branching, podding, and filling, respectively, while the minimum values were observed in treatments FI2F2, I0F0, and FI1F2 during the same three growth stages. The maximum and minimum yield values for maize and soybean both occurred in the DI2F2 and I0F0 treatments, respectively. Compared with the I0F0 treatment, the yield of maize and soybean increased by 0.3%–30.5% in all treatments. The three growth indexes for maize in 2020 and soybean in 2021 for the different irrigation and fertilization treatments showed average increases of 20.7% and 9.8%, respectively, compared to the I0F0 treatment.
Over the two years, drip irrigation increased the three growth indicators of maize and soybean by 0.7%–25.1% compared with flood irrigation. Treatments in the F2 group increased these indicators by 0.6%–19.9% and 0.7%–46.8% compared with the F1 group and I0F0 treatment, respectively, and the I2 group treatments increased them by 0.8%–24.5% and 5.4%–50.1% compared with the I1 group and I0F0 treatment, respectively. In 2020 and 2021, with the exception of the maize yield, the I significantly affected the growth indicators of both maize and soybean (p < 0.05). The F had a significant effect on the three growth indicators of maize and the above-ground dry matter and early plant height of soybean (p < 0.05), and the M had a significant effect on the three soybean growth indicators and maize dry matter.
3.4. Root Characteristics
In 2020 and 2021, there were no obvious trends in the four apple root indicators with changing nutrient levels in the I2 treatments, while at the I1 level, these indicators decreased with increasing fertilization (Figure 8). Over the two years, the four root indicators of apples in the I0F0 treatment increased by 0.7%–4.8% and 2.2%–24.2% compared with the I1 and I2 groups, respectively; the I0F0 treatment increased by 12.2%–15.6% and 25.8%–62.8% compared with the F2 and F1 groups, respectively; and the drip irrigation group increased by 40.3%–94.5% compared with the flood irrigation group. In 2021, except for the total root volume, the apple root indicators in each treatment increased by 1.5%–44.9% on average compared with 2020.
In 2020, the four maize root parameters increased first and then decreased with increasing fertilization under the same irrigation amount. In 2020, the drip irrigation group showed an average increase of 0.9%–31.7% in the four maize root parameters compared with the flood irrigation group. In 2020, except for the average root diameter of maize, the other root parameters of the F1 group were higher than those of the F2 group by 15.1%–23.2%. In 2020, the I1 group showed an average increase of 1.4%–18.3% in the maize root parameters compared with the I2 group.
In 2021, the four soybean root parameters decreased first and then increased with increasing fertilization. In 2021, the soybean average root diameter and total root volume in the drip irrigation group increased by 27.4% and 1.7%, respectively, compared with the flood irrigation group. In 2021, the four soybean root parameters in the F2 group were higher than those in the F1 group by 13.0%–58.1%. In 2021, except for the average root diameter, the other soybean root parameters in the I2 group showed an average increase of 1.7%–10.3% compared with the I1 group.
3.5. Interspecific Competition in the Above- and Below-Ground Plant Parts
The variations in the imbalance of crop photosynthetic parameters and soil nutrients with distance from the tree in the plot are shown in Table 2. These indicators all showed an overall upward trend with increasing distance from the tree, although the linear and quadratic fitting curves of some treatments were not significant (p > 0.05). In 2020, the linear regression coefficients of the photosynthetic index and mineral nitrogen content in the second sampling of each treatment increased by 0.8%–359.6% compared with I0F0. In 2021, the linear regression coefficients of the NN and SOM contents of each treatment increased by 3.4%–402.8% compared with I0F0. Except for AN and TP in 2021, the linear regression coefficients of the other soil nutrients in the first sampling increased by 26.6%–225.2% compared with the second sampling. In 2021, the linear regression coefficients of AN, NN, and SOM increased by 1.2%–40.7% compared with 2020.
Overall, the UICII decreased with the increasing distance from the tree (Table 3). The maximum values of UIUII occurred in DI1F1 in 2020 and DI2F0 in 2021. The minimum values of UIUII occurred in I0F0 in 2020 and in FI1F1 in 2021. In 2021, the mean UICII of all treatments increased by an average of 4.9% compared with 2020. Over the two years, the UICII in the I2 and F2 groups increased by an average of 4.2%–59.2% compared with the I1 and F1 groups. The UICII of the drip irrigation group increased by 12.3%–68.7% on average compared with the flood irrigation group over both years. These results indicate that the degree of niche overlap between the apple and crop root systems was positively correlated with crop distance from the tree, intercropping years, irrigation amount, and fertilization amount.
3.6. Economic Benefit and Comprehensive Scores of Intercropping Systems
In 2020 and 2021, the trends in maize and soybean PV and NL with changes in irrigation and fertilizer were consistent with their yields (Figure 7). The highest NI was observed in FI1F1 in 2020 and DI2F2 in 2021, with increases of 3.5% and 13.6%, respectively, compared with I0F0 (Table 4). The NI of all treatments increased by 47.6%–93.8% in 2020 compared with 2021. Over the two years, the drip irrigation method provided higher economic benefits than flood irrigation, with a 5.8% increase in net income. However, the treatments that ranked highest in economic benefit were FI1F1 in 2020 and DI2F2 in 2021.
The comprehensive benefits of each treatment were evaluated based on 14 indicators (Figure 9). In 2020, under the same irrigation conditions, the comprehensive ranking decreased and then increased with increasing fertilizer application, with the maximum values occurring in the F2 group. In 2021, the comprehensive ranking increased with increasing fertilizer application under the same irrigation conditions. Under the same fertilization conditions, the comprehensive ranking increased with increasing irrigation in 2020 and 2021. In both years, the treatments with the highest and lowest factor scores were DI2F2 and I0F0, respectively. This suggests that the treatment with the highest comprehensive benefit in the apple/crop intercropping system did not necessarily result in the maximum economic benefit.
4. Discussion
4.1. Effect of Water and Fertilizer Regulation on Soil Moisture and Nutrients
The soil moisture and nutrient conditions serve as the foundation for promoting healthy plant growth and high productivity. Over the two years of study, the soil moisture and four soil nutrient indexes increased with increasing irrigation and fertilization rates (Figure 4 and Figure 5), indicating that these practices can increase soil water and nutrient content and reduce water and nutrient stress. In 2021 and 2020, the soil water content of the drip irrigation group was 1.4%–5.4% higher than that of the flood irrigation group. This indicated that drip irrigation was more beneficial for improving soil moisture content compared to flood irrigation. In the present study, the AN, NN, and SOM contents in 2021 increased by 21.0%–68.4% compared with 2020. This may be due to increased SOM and mineral nitrogen content from the maize straw returned to the soil in 2020 and nitrogen fixation by the intercropped soybean roots in 2021 [33,34]. Another possibility is that the two years of continuous water and fertilizer input had activated the soil microbial community and improved the nutrient conversion rate [35], especially after changing the intercropped crops in 2021. This also indirectly confirmed the nutrient complementarity of intercropping systems. Except for AN, the amounts of the other nutrient indicators increased to varying degrees in the flood irrigation group compared with the drip irrigation group over the two years. This may be because soil nutrient transport and conversion are water-mediated, and the higher soil moisture content in the drip irrigation group increased plant root biomass and hence nutrient uptake and transport efficiency, ultimately resulting in lower soil nutrient reserves in the drip irrigation group. In addition, the soil nutrients in the drip irrigation treatments were concentrated near the drip nozzles inside the plastic film, which may prevent AN volatilization and loss, compared with the uniform distribution of nutrients under flood irrigation [36].
4.2. Effect of Water and Fertilizer Regulation on Photosynthetic and Growth Characteristics
Improving the soil water and nutrient environment is beneficial for increasing leaf chlorophyll content and stomatal conductance [37,38]. In 2020, the Pn and Tr of apples and maize increased in every treatment by 5.9%–157.1% compared with I0F0, except for apple Tr in the I0F1 treatment (Figure 6). This was consistent with a previous study conducted in an apple and maize intercropping system [27]. In 2021, under the same irrigation conditions, the overall Pn and Tr of soybeans initially increased and then decreased with increasing fertilization. This was inconsistent with a previous study of a rain-fed soybean monoculture, which showed that crop Pn and Tr increased with increasing fertilization [39]. One possible reason for this discrepancy is the nutrient complementarity effect in intercropping systems, which leads to higher fertilizer utilization efficiency compared with monocultures [40]. A previous study showed that deep-rooted tree species can act as nutrient pumps to bring deep-soil water and nutrients to the surface for crop utilization [41].
In the present study, the yield of maize increased with increasing irrigation and fertilization (Figure 7). This was inconsistent with a previous study [27], which showed that maize yield decreased as fertilization increased and the maize height in the low-fertilization-level group was greater than in the high-fertilization-level group. One possible reason for this discrepancy is that the treatments in our study had plastic film covering the soil, creating a physical barrier between the soil surface and the air, thus reducing soil water evaporation and increasing soil water content [42]. Therefore, the nutrient tolerance of the soil in a non-covered treatment may be affected by the lower soil water content, and the absorption of nutrients by apple and crop roots may inhibited due to an increase in fertilization, thereby suppressing photosynthesis and growth. Appropriate soil coverings can therefore improve the efficiency of water and fertilizer use by plants. The three growth indicators (dry matter, plant height, yield) for maize and soybean increased with increasing irrigation levels. This result was consistent with a previous study, which also revealed that the yield of intercropped soybean decreases instead of increasing when the irrigation amount exceeds 80% of the field capacity. The study provided possible explanations for this phenomenon, including a decrease in soil porosity, leaching of nutrients, and increased ecological niche overlap between the surface crop roots and deep tree roots due to excessive irrigation [20]. We also found that the maximum values of soybean plant height were observed in treatments DI1F0, FI2F0, and DI2F2 during the three growth stages of branching, podding, and filling, respectively. This indicated that the nutrient requirement of soybeans increased with the growth stages. Therefore, when regulating irrigation and fertilization, it is important to consider the water and nutrient requirements of crops at different growth stages. Consistent with photosynthesis, irrigation and fertilization also showed that intercropping in the third year outperformed intercropping in the fourth year in terms of enhancing crop growth parameters (Figure 6 and Figure 7). This could be because the continuous cropping of maize before 2020 caused a serious imbalance in soil water and nutrients, which eased after crop replacement in 2021 [43], resulting in a higher increase in intercropped apple and maize photosynthetic parameters following irrigation and fertilization compared with apple/soybean intercropping. The photosynthesis of soybean and maize was closely related to their growth, and both photosynthesis and growth exhibited a similar trend in response to irrigation and fertilization management. Different degrees of improvement in photosynthetic characteristics and growth indicators were observed in both intercrops under drip irrigation, I2-level irrigation, and the F2-fertilizer-level groups over two years. The growth indicators of the drip irrigation group for both intercrops were better than those of the flood irrigation group. This may be due to the slower water infiltration rate of the drip irrigation treatment in contrast to the flood irrigation treatment, which delivers a large amount of water in a short period, leading to deep water leakage [44]. Soil water evaporation was also higher in the flood irrigation treatments than in the drip irrigation group, leading to higher soil water content and greater photosynthetic parameters in the drip-irrigated plants.
4.3. Effect of Water and Fertilizer Regulation on Root Characteristics and Interspecific Competition
Plant roots serve as mediators for underground interactions in intercropping systems. The four apple root indicators in the I0F0 treatment were generally higher than those in the fertilization or irrigation groups (Figure 8), possibly due to poor soil water and nutrient conditions in the I0F0 treatment forcing the fruit trees to develop greater root biomass to absorb sufficient nutrients [45]. The effects of irrigation and fertilization regulation on maize and soybean roots exhibited some heterogeneity. Under the same irrigation conditions, the four maize root indicators increased and then decreased with increasing fertilization, while the four soybean root indicators first decreased and then increased with increasing nutrient input. This may be due to the shorter symbiotic period between maize and fruit trees compared with intercropped soybeans. The F1 irrigation level can meet the early growth requirements of intercropped maize, but during the symbiotic period of soybeans, it may enhance their competition for nutrients with apples. Therefore, F2-level irrigation was excessive for intercropped maize but could alleviate nutrient competition in intercropped soybeans. In contrast to maize in 2020, the four soybean root parameters in the I2 group were higher than those in the I1 group in 2021. This may be due to differences in the physiological characteristics of the crops. The nutrient absorption capacity of maize roots is greater than that of soybeans [46], so under the same irrigation and fertilization conditions, the efficiency of water and fertilizer use by intercropped maize is higher than that of intercropped soybeans [20,27]. Therefore, maize was more susceptible to the effects of excessive irrigation and fertilization.
Intercropping systems involve interactions between above-ground light availability and below-ground soil water and nutrients [47]. Over the two years of study, both the crop photosynthesis and soil nutrient content increased with increasing distance from the tree (Table 2). This was inconsistent with previous studies on apples and maize [27], which found that maize photosynthetic parameters decreased with increasing distance from the tree. This may be because the intercropping period of maize and apples was short, and the height of maize and soybean plants was less than that of the apple trees. The apples always had a dominant position regarding light interception, resulting in negative marginal benefits for the growth of maize and soybeans near the tree row. In 2020, the linear regression coefficient between the photosynthetic parameters and mineral nitrogen in the second sampling of each treatment increased by an average of 0.8%–359.6% compared with I0F0. This may be due to the increased leaf area of the fruit trees resulting from irrigation and fertilization, which increased shading near the tree row while also reducing the near-surface temperature and crop transpiration nearest to the tree row [38]. The linear regression coefficients of AN, NN, and SOM were higher in 2021 than in 2020. This indicates that as the years of intercropping and crop replacement increased, the horizontal imbalance of soil nutrients also increased. This could be attributed to increased competition in the fruit tree rows from 2020 to 2021, as the apple root systems grew. In addition, when switching from maize to soybean as an intercrop, the soybean root system was not as developed as the maize [48], resulting in a less competitive crop band. Over the two years, the overall intensity of root competition in the intercropping system decreased with increasing distance from the tree row, which indirectly explains the positive regression coefficients of the soil nutrients (Table 2). Over the two years, the intensity of interspecific competition in the drip irrigation group was 46.4% higher than in the flood irrigation group, on average. This may be because drip irrigation delivered most of the water and fertilizer resources directly into the crop zone, so the apple root system was more likely to grow towards the crop zone to absorb nutrients [49], thereby increasing the overlap between the apple and intercrop root systems (Table 3). Therefore, in future intercropping system management, drip tapes should be added to the apple rows, or appropriate intercrop row spacing should be selected to alleviate competition.
4.4. Economic Benefit and Comprehensive Scores of Intercropping Systems
The economic analysis indicated that the net income of each treatment in 2020 increased by 47.6%–93.8% compared with 2021, and that the drip irrigation treatments were ranked higher than the flood irrigation treatments overall. This suggests that under equivalent irrigation and fertilization conditions, intercropping maize gave higher economic benefits than intercropping soybeans. This conclusion is consistent with the current local agricultural planting pattern. The comprehensive factor analysis ranking increased with increasing irrigation [38], with the maximum comprehensive score occurring in DI2F2 in both years. However, the maximum economic benefit rankings occurred in FI1F1 in 2020 and DI2F2 in 2021. This was probably because factor analysis considers not only the crop yield but also apple tree growth and soil nutrient conditions (Figure 9). Currently, the water supply facilities in the Loess Plateau region remain poorly equipped, and the cost of using drip irrigation equipment is higher than for providing flood irrigation. Therefore, from an economic perspective, we recommend the use of flood irrigation combined with 50% of the recommended fertilization rate for apple/maize intercropping systems, and drip irrigation combined with 100% of the recommended fertilization rate for apple/soybean intercropping systems. However, due to the growth of apple tree roots and canopy, the temporal limitation of this irrigation and fertilization scheme is inevitable. In future studies, it will be necessary to integrate the economic yield of apples after fruit set into the optimization of irrigation and fertilization regimes.
5. Conclusions
In 2020 and 2021, the overall soil nutrient contents were positively correlated with irrigation and fertilization rates. Drip irrigation was more beneficial for improving soil moisture content compared to flood irrigation. The mineral nitrogen and SOM contents in intercropping systems increased with crop replacement. The enhancement effect of irrigation and fertilization on the photosynthetic and growth parameters of the intercropping systems studied decreased as intercropped soybean replaced intercropped maize. The growth indicators of the drip irrigation group for both intercrops were better than those of the flood irrigation group. The I1 and F1 groups gave the best results for intercropped maize root growth, whereas the I2 and F2 groups were best for intercropped soybean root growth. With increasing years of intercropping and crop replacement, the horizontal imbalance of soil nutrients intensified. In addition, the intensity of interspecific competition was higher in the drip irrigation group compared with the flood irrigation group. Therefore, adding drip tapes to apple rows or selecting appropriate crop row spacing to reduce the degree of niche overlap of the root systems can alleviate competition in intercropping systems. Optimal economic benefits were observed in FI1F1 in 2020 and DI2F2 in 2021. Therefore, flood irrigation is recommended for apple/maize alley systems in the third year of intercropping, while drip irrigation is suggested for apple/soybean alley systems in the fourth year. Factor analysis demonstrated that increasing irrigation was positively associated with comprehensive benefit ranking, with the highest score obtained from the DI2F2 treatment in both years. Based on comprehensive benefits, drip irrigation with a 750 kg/hm2 fertilization rate and 80% field capacity irrigation is recommended in the third and fourth years of young apple/crop intercropping systems.
Author Contributions
Conceptualization, R.W. and X.D.; methodology, C.Z.; software, C.L.; validation, C.L.; formal analysis, C.L.; investigation, C.L.; resources, C.L.; data curation, C.L.; writing—original draft preparation, C.L.; writing—review and editing, C.L.; visualization, C.L.; supervision, C.L.; project administration, R.W.; funding acquisition, R.W. All authors have read and agreed to the published version of the manuscript.
Funding
This work was financially supported by the National Key Research and Development Program of China (2022YFE0115300) and the National Natural Science Fund (32271960).
Data Availability Statement
Data available on request due to restrictions, e.g., privacy or ethical considerations.
Acknowledgments
The authors would like to thank Xiong Chang for their efforts in collecting and preprocessing the data.
Conflicts of Interest
The authors declare no conflict of interest.
References
- Jia, J.; Xu, M.; Bei, S.; Zhang, H.; Xiao, L.; Gao, Y.; Zhang, Y.; Sai, L.; Xue, L.; Lei, J.; et al. Impact of reduced light intensity on wheat yield and quality: Implications for agroforestry systems. Agrofor. Syst. 2021, 95, 1689–1701. [Google Scholar] [CrossRef]
- Alarcón-Segura, V.; Grass, I.; Breustedt, G.; Rohlfs, M.; Tscharntke, T. Strip intercropping of wheat and oilseed rape enhances biodiversity and biological pest control in a conventionally managed farm scenario. J. Appl. Ecol. 2022, 59, 1513–1523. [Google Scholar] [CrossRef]
- Cao, F.; Kimmins, J.; Wang, J. Competitive interactions in Ginkgo and crop species mixed agroforestry systems in Jiangsu, China. Agrofor. Syst. 2012, 84, 401–415. [Google Scholar] [CrossRef]
- Tian, J.; Dang, X.; Yang, Z.; Li, P.; Cao, X.; Fan, L.; Li, L. Analysis of water security risk of cash forest expansion in the Loess Plateau in terms of water footprint: A case study of apple planting. J. Nat. Resour. 2022, 37, 2750–2762. (In Chinese) [Google Scholar]
- Gao, L.; Xu, H.; Bi, H.; Xi, W.; Bao, B.; Wang, X.; Bi, C.; Chang, Y. Intercropping Competition between Apple Trees and Crops in Agroforestry Systems on the Loess Plateau of China. PLoS ONE 2013, 8, e70739. [Google Scholar] [CrossRef]
- Chen, S.; Qi, G.; Luo, T.; Zhang, H.; Jiang, Q.; Wang, R.; Zhao, X. Continuous-cropping tobacco caused variance of chemical properties and structure of bacterial network in soils. Land Degrad. Dev. 2018, 29, 4106–4120. [Google Scholar] [CrossRef]
- Bado, B.; Aw, A.; Ndiaye, M. Long-term effect of continuous cropping of irrigated rice on soil and yield trends in the Sahel of West Africa. Nutr. Cycl. Agroecosystems 2010, 88, 133–141. [Google Scholar] [CrossRef]
- Liu, H.; Jiang, S.; Ou, J.; Tang, J.; Lu, Y.; Wei, Y. Investigation of soil microbiota reveals variable dominant species at different land areas in China. Biotechnol. Biotechnol. Equip. 2022, 36, 245–255. [Google Scholar] [CrossRef]
- Jo, S.; Kang, Y.; Om, K.; Cha, Y.; Ri, S. Growth, photosynthesis and yield of soybean in ridge-furrow intercropping system of soybean and flax. Field Crop Res. 2022, 275, 108329. [Google Scholar] [CrossRef]
- Suárez, J.; Anzola, J.; Contreras, A.; Salas, D.; Vanegas, J.; Urban, M.; Beebe, S.; Rao, I. Photosynthetic and grain yield responses to intercropping of two common bean lines with maize under two types of fertilizer applications in the Colombian Amazon region. Sci. Hortic. 2022, 301, 111108. [Google Scholar] [CrossRef]
- Gao, F.; Wang, G.; Muhammad, I.; Tung, S.; Zhou, X. Interactive effect of water and nitrogen fertilization improve chlorophyll fluorescence and yield of maize. Agron. J. 2023, 115, 325–339. [Google Scholar] [CrossRef]
- Li, Y.; Xu, X.; Chen, Z.; Xiong, Y.; Huang, Q.; Huang, G. A process simulation-based framework for resource, food, and ecology trade-off by optimizing irrigation and N management. J. Hydrol. 2023, 617, 129035. [Google Scholar] [CrossRef]
- Li, Y.; Ma, L.; Wu, P.; Zhao, X.; Chen, X.; Gao, X. Impacts of Interspecific Interactions on Crop Growth and Yield in Wheat (Triticum aestivum L.)/Maize (Zea mays L.) Strip Intercropping under Different Water and Nitrogen Levels. Agronomy 2022, 12, 951. [Google Scholar] [CrossRef]
- Abdoun, K.; Altahir, O.; Alsagan, A.; Alsaiady, M.; Alshaikhi, A.; Alshamiry, F.; Al-Haidary, A. Effect of irrigation frequency and selenium fertilization on the vegetative growth and biomass yield of Moringa oleifera and Moringa peregrina. Sci. Rep. 2022, 12, 22379. [Google Scholar] [CrossRef] [PubMed]
- Sieczko, A.; van de Vlasakker, P.; Tonderski, K.; Metson, G. Seasonal nitrogen and phosphorus leaching in urban agriculture: Dominance of non-growing season losses in a Southern Swedish case study. Urban For. Urban Green. 2023, 79, 127823. [Google Scholar] [CrossRef]
- Da Silva, G.; Da Cunha, F.; de Brito, L. Advance time to determine injection and flushing times in drip fertigation. Horticulturae 2022, 8, 1103. [Google Scholar] [CrossRef]
- Li, X.; Šimůnek, J.; Shi, H.; Yan, J.; Peng, Z.; Gong, X. Spatial distribution of soil water, soil temperature, and plant roots in a drip-irrigated intercropping field with plastic mulch. Eur. J. Agron. 2017, 83, 47–56. [Google Scholar] [CrossRef]
- He, H.; Wang, Q.; Wang, L.; Yang, K.; Yang, R.; You, C.; Ke, J.; Wu, L. Photosynthetic physiological response of water-saving and drought-resistant rice to severe drought under wetting-drying alternation irrigation. Physiol. Plant. 2021, 173, 2191–2206. [Google Scholar] [CrossRef] [PubMed]
- Su, K.; Mu, L.; Zhou, T.; Kamran, M.; Yang, H. Intercropped alfalfa and spring wheat reduces soil alkali-salinity in the arid area of northwestern China. Plant Soil 2022. [Google Scholar] [CrossRef]
- Dou, X.; Wang, R.; Zhou, X.; Gao, F.; Yu, Y.; Li, C.; Zheng, C. Soil water, nutrient distribution and use efficiencies under different water and fertilizer coupling in an apple-maize alley cropping system in the Loess Plateau, China. Soil Tillage Res. 2022, 218, 105308. [Google Scholar] [CrossRef]
- Luo, C.; Wang, R.; Li, C.; Zheng, C.; Dou, X. Photosynthetic characteristics, soil nutrients, and their interspecific competitions in an apple-soybean alley cropping system subjected to different drip fertilizer regimes on the Loess Plateau, China. Agric. Water Manag. 2023, 275, 108001. [Google Scholar] [CrossRef]
- Manalil, S.; Flower, K. Soil water conservation and nitrous oxide emissions from different crop sequences and fallow under Mediterranean conditions. Soil Tillage Res. 2014, 143, 123–129. [Google Scholar] [CrossRef]
- Dou, X.; Wang, R.; Li, C.; Zheng, C.; Zhou, X. Spatial distribution of soil water, plant roots, and water use pattern under different drip fertigation regimes in an apple-soybean intercropping system on the Loess Plateau, China. Agric. Water Manag. 2022, 269, 107718. [Google Scholar] [CrossRef]
- Man, J.; Yu, J.; White, P.; Gu, S.; Zhang, Y.; Guo, Q.; Shi, Y.; Wang, D. Effects of supplemental irrigation with micro-sprinkling hoses on water distribution in soil and grain yield of winter wheat. Field Crop Res. 2014, 161, 26–37. [Google Scholar] [CrossRef]
- Fraser, L.; Carty, S.; Steer, D. A test of four plant species to reduce total nitrogen and total phosphorus from soil leachate in subsurface wetland microcosms. Bioresour. Technol. 2004, 94, 185–192. [Google Scholar] [CrossRef]
- Parton, W.; Scurlock, J.; Ojima, D.; Gilmanov, T.; Scholes, R.; Schimel, D.; Kirchner, T.; Menaut, J.; Seastedt, T.; Moya, E. Observations and modeling of biomass and soil organic matter dynamics for the grassland biome worldwide. Glob. Biogeochem. Cycles 1993, 7, 785–809. [Google Scholar] [CrossRef]
- Zhou, X.; Wang, R.; Gao, F.; Xiao, H.; Xu, H.; Wang, D. Apple and maize physiological characteristics and water-use efficiency in an alley cropping system under water and fertilizer coupling in Loess Plateau, China. Agric. Water Manag. 2019, 221, 1–12. [Google Scholar] [CrossRef]
- Levins, R. Evolution in Changing Environments: Some Theoretical Explorations; PUP: Princeton, NJ, USA, 1968. [Google Scholar]
- Pianka, E. The structure of lizard communities. Annu. Rev. Ecol. Evol. Syst. 1973, 4, 53–74. [Google Scholar] [CrossRef]
- Zheng, Q.; Cheng, T.; Liu, G. Economic benefit evaluation of the grain-cotton-fruit intercropping in three regions of southern xinjiang. Xinjiang Agric. Sci. 2015, 52, 759–766. (In Chinese) [Google Scholar]
- Lee, S. Determination of Priority Weights under Multiattribute Decision-Making Situations: AHP versus Fuzzy AHP. J. Constr. Eng. Manag. 2015, 141, 05014015. [Google Scholar] [CrossRef]
- Zhou, Y.; Xu, A.; Jiang, R. Comprehensive Evaluation of Air Quality based on Factor Analysis. Environ. Sci. Surv. 2021, 40, 65–69. (In Chinese) [Google Scholar]
- Liyanage, D.; Torkamaneh, D.; Belzile, F.; Balasubramanian, P.; Hill, B.; Thilakarathna, M. The Genotypic Variability among Short-Season Soybean Cultivars for Nitrogen Fixation under Drought Stress. Plants 2023, 12, 1004. [Google Scholar] [CrossRef] [PubMed]
- Yang, X.; He, P.; Zhang, Z.; You, M.; Wu, X.; Li, L. Straw return, rather than warming, alleviates microbial phosphorus limitation in a cultivated Mollisol. Appl. Soil Ecol. 2023, 186, 104821. [Google Scholar] [CrossRef]
- Chomsang, K.; Morokuma, M.; Agarie, S.; Toyota, M. Effect of using drip irrigation on the growth, yield and its components of soybean grown in a low rainfall region in Japan. Plant Prod. Sci. 2021, 24, 466–480. [Google Scholar] [CrossRef]
- Pinheiro, P.; Recous, S.; Dietrich, G.; Weiler, D.; Giovelli, R.; Mezzalira, A.; Giacominia, S. Straw removal reduces the mulch physical barrier and ammonia volatilization after urea application in sugarcane. Atmos. Environ. 2018, 194, 179–187. [Google Scholar] [CrossRef]
- Zhao, L.; Tang, Q.; Song, Z.; Yin, Y.; Wang, G.; Li, Y. Increasing the yield of drip-irrigated rice by improving photosynthetic performance and enhancing nitrogen metabolism through optimizing water and nitrogen management. Front. Plant Sci. 2023, 14, 1075625. [Google Scholar] [CrossRef] [PubMed]
- Zheng, C.; Wang, S.; Zhou, X.; Li, C.; Dou, X. Photosynthetic and growth characteristics of apple and soybean in an intercropping system under different mulch and irrigation regimes in the Loess Plateau of China. Agric. Water Manag. 2022, 266, 107595. [Google Scholar] [CrossRef]
- Tan, C.; Zhu, X.; Chen, J.; Yang, C.; Lou, L.; Xu, X.; Gong, X. Effects of different nitrogen and potassium levels on photosynthetic physiology and yield of soybean. Guizhou Agric. Sci. 2018, 48, 5–9. (In Chinese) [Google Scholar]
- Zhu, S.; Cheng, Z.; Wang, J.; Gong, D.; Ullah, F.; Tao, H.; Zhu, H.; Duan, H.; Yang, Y.; Xiong, Y. Soil phosphorus availability and utilization are mediated by plant facilitation via rhizosphere interactions in an intercropping system. Eur. J. Agron. 2023, 142, 126679. [Google Scholar] [CrossRef]
- Pirhoferwalzl, K.; Eriksen, J.; Rasmussen, J.; Soegaard, K.; Høghjensen, H.; Rasmussen, J. Effect of deep-rooted plant species on 15Nitrogen uptake and herbage yield in temporary agricultural grasslands. Plant Soil 2013, 371, 313–325. [Google Scholar] [CrossRef]
- Li, Z.; Zou, H.; Lai, Z.; Zhang, F.; Fan, J. Optimal drip fertigation regimes improved soil Micro-Environment, root growth and grain yield of spring maize in arid northwest china. Agronomy 2023, 13, 227. [Google Scholar] [CrossRef]
- Cheng, F.; Ali, M.; Liu, C.; Deng, R.; Cheng, Z. Garlic allelochemical diallyl disulfide alleviates autotoxicity in the root exudates caused by Long-Term continuous cropping of tomato. J. Agric. Food Chem. 2020, 68, 11684–11693. [Google Scholar] [CrossRef] [PubMed]
- Yan, L.; Chen, M.; Hu, P.; Li, D.; Wang, Y. An analysis on the influence of precipitation infiltration on groundwater under different irrigation conditions in the semi-arid area. Water Supply 2021, 21, 1111–1118. [Google Scholar] [CrossRef]
- Sun, C.; Cao, H.; Shao, H.; Lei, X.; Xiao, Y. Growth and physiological responses to water and nutrient stress in oil palm. Afr. J. Biotechnol. 2011, 10, 10465–10471. [Google Scholar]
- Abaidoo, R.; van Kessel, C. 15N-uptake, N2-fixation and rhizobial interstrain competition in soybean and bean, intercropped with maize. Soil Biol. Biochem. 1989, 21, 155–159. [Google Scholar] [CrossRef]
- Jiao, N.; Wang, J.; Ma, C.; Zhang, C.; Guo, D.; Zhang, F.; Jensen, E. The importance of aboveground and belowground interspecific interactions in determining crop growth and advantages of peanut/maize intercropping. Crop J. 2021, 9, 1460–1469. [Google Scholar] [CrossRef]
- Raza, M.; Cui, L.; Khan, I.; Din, A.; Chen, G.; Ansar, M.; Ahmed, M.; Ahmad, S.; Manaf, A.; Titriku, J.; et al. Compact maize canopy improves radiation use efficiency and grain yield of maize/soybean relay intercropping system. Environ. Sci. Pollut. Res. 2021, 28, 41135–41148. [Google Scholar] [CrossRef] [PubMed]
- Chen, N.; Li, X.; Šimůnek, J.; Shi, H.; Hu, Q.; Zhang, Y. Evaluating soil nitrate dynamics in an intercropping dripped ecosystem using HYDRUS-2D. Sci. Total Environ. 2020, 718, 137314. [Google Scholar] [CrossRef]
Disclaimer/Publisher’s Note: The statements, opinions and data contained in all publications are solely those of the individual author(s) and contributor(s) and not of MDPI and/or the editor(s). MDPI and/or the editor(s) disclaim responsibility for any injury to people or property resulting from any ideas, methods, instructions or products referred to in the content. |
© 2023 by the authors. Licensee MDPI, Basel, Switzerland. This article is an open access article distributed under the terms and conditions of the Creative Commons Attribution (CC BY) license (https://creativecommons.org/licenses/by/4.0/).