Abstract
The tea leafhopper (Empoasca (Matsumurasca) onukii Matsuda, 1952) is the predominant pest infesting tea and causes significant losses in yield. Plants have evolved multiple defense responses to protect themselves from insect herbivores. Camellia tetracocca, a kind of ancient tea with local popularity, is unique to southwest China. This ancient tea is often attacked by the tea leafhopper. However, there are no relevant reports on changes in volatile components and defense signaling pathways after Camellia tetracocca has been attacked by E. onukii. To reveal changes in the responses of the volatile components of C. tetracocca to E. onukii, the headspace sampling technique and GC-MS were adopted to determine and analyze the volatiles. Furthermore, to unveil the defense mechanisms of C. tetracocca in response to E. onukii, transcriptome analysis was applied to damaged tea leaves and healthy leaves. The GC-MS analysis showed significant increases in the linalool and (E)-2-hexenal contents. The transcriptome analysis revealed a set of core pest-responsive genes (3074 upregulated and 5098 downregulated). Most of the enriched pest-responsive genes are mainly involved in plant hormone signal transduction photosynthesis, terpenoid backbone biosynthesis, alpha-linolenic acid metabolism, and the NF-κB signaling pathway. A conjoint analysis of the transcriptome and metabolome indicated that N2-acetylornithine, D-malic acid, theogallin, fucosyllactose, 5-caffeoylquinic acid, fumarprotocetraric acid, and arabinogalactose have a significant correlation with LOC114279735, LOC114317534, LOC114282078, LOC114317768, and LOC114263181. This study lays a foundation for further research on the breeding and cultivation of insect-resistant germplasm resources for C. tetracocca and on the promotion and development of the plant.
1. Introduction
Tea is the most popular and extensively consumed beverage worldwide and is one of the three popular non-alcoholic drinks [1]. Camellia tetracocca Zhang is a singular tea variety discovered in Guizhou by Mr. Hongda Zhang in 1981 [2] and distributed in Majiaping Village, Pubai Forest Farm, and other areas [3,4]. Empoasca (Matsumurasca) onukii Matsuda, 1952 (Hemiptera, Cicadellidae) is the most destructive pest in the tea field, and up to 50% of economic losses in tea production annually are caused by these pests [5]. Both nymphs and adults pierce and suck the sap of young tea shoots. In addition, adult females lay their eggs in these young shoots, causing unrecoverable damage [5,6]. C. tetracocca, being planted and consumed locally, is inevitably damaged by E. onukii, thus resulting in a significant reduction in yield or even death of C. tetracocca [7].
Plants have generated sophisticated defense mechanisms to protect themselves from insect herbivores, including direct responses and indirect responses [8]. Direct responses, including various secondary metabolites, play an important part in defending against insect invasion [9,10]. Indirect responses also play a crucial role in resistance to pathogen and insect attacks, relying on the jasmonic acid (JA), salicylic acid (SA), and the ethylene (ET) signaling pathway [11,12].
Headspace solid-phase microextraction (HS-SPME), coupled with the gas chromatography with mass spectrometry detection (GC-MS) technique, have been widely applied to identify and determine the volatile constituents of various plants. For example, volatile organic compounds were identified using SPEM-GC-MS to detect Aspergillus flavus infection in pistachios [13]. Differences in volatile emissions between healthy and gall-induced branches of Haplopappus foliosus (Asteraceae) were studied using GC-MS [14]. Transcriptome analysis has proven to be an accessible tool for plant defenses against insects [15,16,17]. Rice leaves were investigated after 0, 1, 6, 12, and 24 h of being fed on by the rice leaf folder Cnaphalocrocis medinalis, and those results showed that the most remarkable transcriptional changes occurred within 6 h after the initiation of feeding [18]. Similarly, the transcriptome was used to investigate the change in Gossypium barbadense leaves after Helicoverpa armigera infestation, which indicated that catalytic products of GbTPS1 were significantly elevated [19]. In addition, this means was adopted to understand the defense mechanisms of spinach, by comparing the transcriptome of spinach leaves exposed to beet armyworm (Spodoptera exigua) larvae with that of unexposed control leaves [16].
Although there has been some research on the response of tea plants to biotic factors [20,21] and abiotic factors [22,23], there are few reports on changes in volatile components and the molecular mechanism analysis of the response of C. tetracocca trees to E. onukii based on the uniqueness of C. tetracocca. Therefore, in the current study, we compared the differences in C. tetracocca after feeding by E. onukii via HS-SPEM-GC-MS and transcriptome analysis. Moreover, based on previous research [7], we will further explore the defense mechanisms of the transcriptome and metabolome. Our findings will provide an essential basic knowledge for further research and development of prevention and control strategies for E. onukii.
2. Materials and Methods
2.1. Collection of C. tetracocca Leaves
C. tetracocca was planted in the field of the state-owned Pubai Forest Farm, Pu’an (25°25′57″ N, 104°59′36″ E), Guizhou, and all plants were derived from seeds with a consistent genetic background. The identical C. tetracocca branch was collected, and the tea plant cutting and seedling raising were performed from June to September 2020. After cutting, the tea branch was maintained and watered. Light, temperature, and other conditions were fully utilized to ensure the normal growth of tea seedlings in the natural environment. All the plants are biennial tea trees. Adult E. onukii were obtained from the C. tetracocca cultivation base at a distant greater than 5 km away from the experimental center. After propagation for four generations, vigorous third-instar nymphs were collected and applied in this experiment. These E. onukii were reared on a fresh shoot of C. tetracocca after starvation for 2 h, and then the fresh shoots were cut from the tea branches of the C. tetracocca cultivation base. Every separate plant was surrounded and isolated by adopting insect-rearing cages (35 cm × 50 cm) in the field to avoid interference from other pests. Each plant shroud in an insect cage enjoyed the same light intensity, temperature (monthly average high and low temperature: 18~27 °C), and rainfall (monthly precipitation: 327.7 mm). The leafhopper feeding (E1, E2, E3) group and leafhopper not feeding (N1, N2, N3) control group were set up, and three biological replicates were obtained from each group. Each replicate was placed with 100 individuals of E. onukii, and 10 individuals were replenished every other day. We observed the tips of the leaves every day, and gathered the leaves when the blade tip was about to turn fire-like (Figure 1). In each treatment, six leaves of three tender shoots per plant were collected, and the leaves of different treatments were merged and placed in self-sealing bags and immediately brought back to the laboratory for further testing. The remaining leaves were immediately wrapped in an aluminum foil and stored in liquid nitrogen until sample collection was achieved. Then, they were stored at −80 °C for subsequent transcriptome detection.
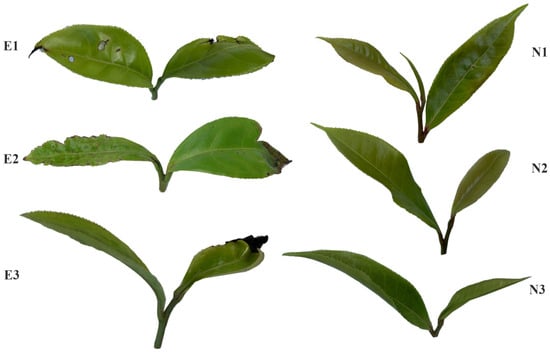
Figure 1.
The tea plant leaves of C. tetracocca attacked by E. onukii are represented as E1, E2, E3 and the healthy leaves of C. tetracocca are represented as N1, N2, N3.
2.2. Volatile Component Analysis Using the Leaves of C. tetracocca Attacked by E. onukii and Healthy Leaves
The leaves were cut into small pieces, and 2 g of the samples were weighed and mixed. The samples were placed in the sampling bottle of a solid-phase microextraction instrument, and the manual sampler for the 2 cm–50/30 µm DVB/CAR/PDMS StableFlex fiber head was used to insert the sample bottle. After 60 min of headspace extraction under flat plate heating conditions at 80 °C, the extraction head was removed and immediately inserted into the gas chromatography inlet (at 250 °C) for thermal analysis injection.
Gas chromatography-mass spectrometry (GC-MS) (HP6890/5975C, Agilent, Santa Clara, CA, USA) was used to analyze the volatile component. The HP-5MS (60 m × 0.25 mm × 0.25 μm) elastic quartz capillary column was used as a chromatographic column. The specific detected conditions were as follows: the injection volume was 0.2 µL, the initial temperature of the chromatographic column was 40 °C (2 min retention), the temperature was raised to 208 °C (3.5 °C/min) and then to 308 °C (10 °C/min), the running time was 62 min, the temperature of vaporization chamber was 250 °C, and the high-purity He (99.999%) was used as the carrier gas. The pre-column pressure was 15.98 psi, the flow rate of carrier gas was 1.0 mL/min, and the solvent delay time was 3 min. The electron ionization ion source temperature was 230 °C, the quadrupole temperature was 150 °C, the electron energy was 70 eV, the emission current was 34.6 μA, the multiplier voltage was 1718 V, the interface temperature was 240 °C, and the mass range was 29–500 amu. The peaks in the total ion chromatogram were searched using a mass spectrometry computer data system, and the Nist20 and Wiley275 standard mass spectra were checked to determine the volatile chemical constituents. The relative quality percentage of each chemical component was measured utilizing the peak area normalization method.
2.3. RNA Extraction, Library Construction, Sequencing, and Validation
Total RNA from C. tetracocca leaf samples was extracted by applying the TRIzol reagent (Invitrogen, Carlsbad, CA, USA), following the protocol provided by the manufacturer. RNA purity and quantification were checked using the NanoDrop 2000 spectrophotometer (Thermo Scientific, Waltham, MA, USA). The Agilent 2100 Bioanalyzer (Agilent Technologies, Santa Clara, CA, USA) was used to evaluate RNA integrity. According to the manufacturer’s instructions, the VAHTS Universal V6 RNA-Seq Library Prep Kit was adopted to construct the libraries. OE Biotech Co., Ltd. (Shanghai, China) carried out the transcriptome sequencing and analysis. The libraries were sequenced on an Illumina sequencing platform (Illumina Novaseq 6000, Illumina, San Diego, CA, USA) and yielded 150 bp paired-end reads.
2.4. RNA-Sequencing Data Analysis
To obtain high-quality reads, raw reads in fastq format were processed for the first time [24] and low-quality reads were removed as clean reads. The clean reads were aligned to the Camellia sinensis reference genome (https://www.ncbi.nlm.nih.gov/genome/?term=txid4442, accessed on 6 September 2022) using HISAT2 [25]. The htseq-count software was adopted to calculate the FPKM and read counts of each gene [26,27].
2.5. Gene Ontology and Clustering Analysis
Differential expression analysis was conducted by using the DESeq2 (version: 1.20.0) [28]. Q-value < 0.05 and fold change > 2 or fold change < 0.5 were set as the threshold for significantly differential expression genes (DEGs). R (v 3.2.0) was used to carry out the hierarchical cluster analysis of DEGs to visualize the expression pattern of genes in different groups and samples.
On the basis of the hypergeometric distribution, GO [29], KEGG pathway [30], Reactome, and WikiPathways enrichment analyses of DEGs were applied to screen the significantly enriched term using R (v 3.2.0), respectively. The column diagram and bubble diagram of the significant enrichment term were drawn using R (v 3.2.0).
2.6. qPCR Validation
In order to verify the results of the DEGs analysis, qPCR was performed on the detection genes, using tea plant Camellia sinensis GAPDH (GE651107) as the reference gene. All C. tetracocca samples for qPCR validation were prepared as described above. Each qPCR reaction was performed using a LightCycler® 480 II Real-time PCR Instrument (Roche, Basel, Switzerland) with 10 μL PCR reaction mixture. The PCR reaction mixture consisted of cDNA (1 μL), 2×PerfectStartTM Green qPCR SuperMix (5 μL), forward primer (0.2 μL), reverse primer (0.2 μL), and nuclease-free water (3.6 μL). Reactions were incubated in a 384-well optical plate (Roche, Basel, Switzerland) at 94 °C for 30 s, followed by 45 cycles of 94 °C for 5 s, and 60 °C for 30 s. Each sample was run in triplicate for analysis. At the end of the PCR cycles, a melting curve analysis was performed to verify the specification of the expected PCR product. The primer sequences were designed and synthesized by TsingKe Biotech according to the mRNA sequences obtained from the NCBI database as follows: The expression levels of mRNAs were calculated with the 2−ΔΔCt method using GAPDH: GE651107 as standard [31]. Nine genes from differentially expressed genes were randomly selected as validation genes, and the gene primer information is shown in Table 1.

Table 1.
qPCR validation primer.
2.7. Joint Analysis of the Transcriptome and Metabolome
Based on the relative content data of the transcriptome and metabolome [7], the top 20 differential metabolites and differential genes were selected by default, respectively, and the correlation between the expression level of differential genes and the response intensity data of differential metabolites was calculated using the Pearson algorithm.
3. Results
3.1. Volatile Component Analysis of the Leaves of C. tetracocca Attacked by E. onukii and Healthy Leaves
The volatile chemical components in the headspace samples from the healthy leaves mainly included 3-hexenal (1.128%), (E)-2-hexenal (2.841%), (E)-3-hexen-1-ol (22.523%), (Z)-2-hexen-1-ol (1.941%), 1-hexanol (1.685%), (Z)-3-hexen-1-ol-acetate (6.694%), linalool (14.021%), (Z)-butanoic acid, 3-hexenyl ester (4.379%), methyl salicylate (18.568%), and α-farnesene (6.75%) (Table 2). However, the volatile components changed, with a significant increase or decrease, when C. tetracocca was damaged by E. onukii. These volatile components mainly included (Z)-2-penten-1-ol (1.546%), (E)-2-hexenal (12.653%), (E)-3-hexen-1-ol (21.076%), (Z)-2-hexen-1-ol (1.699%), 1-hexanol (1.931%), (E)-3-hexen-1-ol-acetate (1.337%), β-ocimene (1.077%), 2-furanmethanol, cis-5-ethenyltetrahydro-α,α,5-trimethyl-, (1.333%), Ethyl 2-(5-methyl-5-vinyltetrahydrofuran-2-yl)propan-2-yl carbonate (1.89%), linalool (17.472%), (Z)-butanoic acid, 3-hexenyl ester (1.001), methyl salicylate (7.649%), (Z)-hexanoic acid, 3-hexenyl ester (1.053%), 1H-3a,7-Methanoazulene, octahydro-3,8,8-trimethyl-6-methylene-, [3R-(3α,3aβ,7β,8aα)]- (2.433%), α-farnesene (4.254%), and cedrol (1.311%) (Table 2). In conclusion, (E)-2-Hexenal emitted by damaged leaves was four times that by healthy leaves. Linalool emitted by damaged leaves is about 3% higher than that for healthy leaves. In addition, (Z)-3-hexen-1-ol-acetate, (Z)-butanoic acid, 3-hexenyl ester, and methyl salicylate had a certain degree of reduction compared to damaged leaves. The other detected volatile compounds are shown in Table S1.
Table 2.
The volatile components emitted by leaves of C. tetracocca damaged by E. onukii and healthy leaves.
3.2. Sequencing and Assembly
In order to compare the transcriptomic differences between leaves of C. tetracocca damaged and undamaged by E. onukii, six RNA-Seq libraries of three biological replicates for N (N1, N2, N3) and E (E1, E2, E3) were prepared, and then paired-end sequencing was performed. Overall, 23.67 Gb and 23.5 Gb raw reads with an average length of 150 bp were obtained from undamaged and damaged leaves of C. tetracocca (Table 3). After dislodging low-quality sequences and short reads, 22.8 Gb and 22.65 Gb clean data were generated from the N group and E group, respectively (Table 3). High-quality reads from all samples were merged and the transcriptome assembly program was conducted [32]. The Q30 base percentage ranged from 91.73% to 92.33%. In total, >78.72% of sequences were aligned to the genome of Camellia sinensis. The mapped rates were from 78.72 to 82.66% (Table 4). Principal component analysis (PCA) was used to generalize the similarities and differences between leaves damaged by E. onukii and the healthy leaves of C. tetracocca. The PCA score plot showed that the first four components explained 89.62% of the total variation at transcription levels (Figure 2A). The correlation coefficients of different samples are shown in Figure 2B.
Table 3.
Summary for RNA-Seq datasets of C. tetracocca.
Table 4.
Results of the quality evaluation of RNA-Seq data for the six libraries.
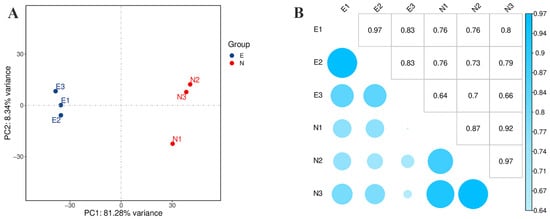
Figure 2.
Data analysis of the transcription in the damaged leaves (E) of E. onukii and healthy leaves (N). (A) Principal component analysis (PCA). (B) Pearson correlation between samples.
3.3. Differential Expression of C. tetracocca Genes in Response to E. onukii
To identify differentially expressed genes (DEGs) in damaged leaves of C. tetracocca, the htseq-count software was used to map the reads of six generated libraries to unigenes, and the expression level was calculated [27]. The gene expressions from each sample were 33,889 (E1), 34,312 (E2), 33,271 (E3), 34,144 (N1), 34,333 (N2), and 34,389 (N3). The adjusted q-value < 0.05 and Log2FC > 1.0 were used as the standard for screening DEGs, and compared to undamaged leaves of C. tetracocca, 8172 genes were differentially expressed (3074 upregulated and 5098 downregulated) upon E. onukii damage.
3.4. DEGs Associated with Phytohormones Biosynthesis and Signal Transduction
JA, SA, ET, and ABA pathways play crucial roles in inducing the defense responses of tea green leafhoppers, which can transmit signals to trigger the expression of downstream defense genes and defense-related genes. Different DEGs in phytohormones synthesis and signal transduction were produced by the tea green leafhopper infestation of C. tetracocca. There were six genes upregulated and three genes downregulated in the JA synthetic pathway, among which the genes with the highest expression levels were 12-oxophytodienoate reductase and acyl-coenzyme A oxidase. One downregulated gene occurred in isochorismate synthase (ICS) of the SA synthetic pathway. For the ET signaling pathway, E. onukii induced the regulation of four genes. The ERF1B genes (LOC114277384, LOC114283936) had very high fold-change levels (FC > 20). For the ABA synthetic pathway, there were 13 upregulated genes and 1 downregulated gene (Table S2).
3.5. DEGs Associated with Secondary Metabolites
Secondary metabolites of plants are chemicals with different important biological functions produced by plants to adapt to the environment and resist various biological stresses. Alkaloid biosynthesis-related genes mainly included perakine reductase, polyneuridine-aldehyde esterase, salutaridinol 7-O-acetyltransferase, and vinorine synthase. Among them, the expression level of perakine reductase from leaves damaged by E. onukii was more than twice that of healthy leaves. All genes related to flavonoid biosynthesis pathways were downregulated.
Plants release a specific set of compounds after being attacked by herbivorous insects, and these compounds are called herbivore-induced plant volatiles (HIPVs) [33]. Terpenoids are the main components of HIPVs, including monoterpenes, sesquiterpene, and derivatives, and they play an important role in the indirect defense reaction of plants. The relative content of terpenoids in most pest-induced plant volatiles was significantly higher than that in healthy plant volatiles. Genes related to terpenoids, including 4-hydroxy-3-methylbut-2-en-1-yl diphosphate synthase (ferredoxin), chloroplastic, cytochrome P450 82G1, (E,E)-α-farnesene synthase, and (E,E)-geranyllinalool synthase were upregulated. In particular, the expression level of (E,E)-α-farnesene synthase from leaves damaged by E. onukii was 70 times higher than in healthy leaves (Table S2).
3.6. DEGs Associated with Plant–Pathogen Interaction and Defense Response to Insect
E. onukii feeding on leaves from C. tetracocca induced significantly different expressions of genes related to the plant response to insects. Sixteen genes, seven of which were upregulated and nine of which were downregulated, are involved in the plant response to insects. Two upregulated genes had FC > 2 and five upregulated genes had FC > 5. The two genes encoding pathogen-related proteins were all upregulated, and one gene had FC > 5. The findings demonstrated that the upregulation of a greater number of genes with a high fold change (FC > 2 and FC > 5) was involved in C. tetracocca’s response to E. onukii. Most enriched pest-responsive genes are mainly involved in plant hormone signal transduction photosynthesis (CoI1, MYC2), terpenoid backbone biosynthesis (VIP1), alpha-linolenic acid metabolism (AOC), and the NF-κB signaling pathway (CRPK1) (Table S2).
3.7. DEGs Associated with Transcription Factors
Transcription factors (TFs) actively participate in the regulation of plant stress; therefore, the expression analysis of transcription factors is crucial. A total of 600 TFs genes were identified. Most of the transcription factors, including MYB, MYC, AP2, NAC, WRKY, BZIP, and bHLH, were involved in the response of C. tetracocca leaves to the feeding of E. onukii. MYB genes were upregulated, including MYB108, MYB62, MYB36, MYB48, MYB14, MYB15, MYB6, MYB58, MYB5, MYB3R4, MYB20, MYBS3, MYB4, and MYB72. In particular, most of these genes can respond to salicylic acid, abscisic acid, salicylic acid, and sucrose. Two genes encoding MYC2 were upregulated. AP2, as a floral homeotic protein, is upregulated. NAC genes encompass NAC100, NAC021, NAC096, NAC098, NAC083, NAC104, NAC71, NAC075, and NAC056, and these genes were upregulated. NAC096 is mainly involved in the positive regulation of the abscisic acid-activated signaling pathway. NAC083 participates in the response to abscisic acid. Most of the WRKY (WRKY22, WRKY6, WRKY28, WRKY71) and BZIP (BZIP23, BZIP19, BZIP53, BZIP11, BZIP44, BZIP4) genes were upregulated. Among them, the WRKY22 transcription factor is mainly involved in defense responses. Ten bHLH transcription factors, including bHLH10, bHLH51, bHLH30, bHLH137, bHLH72, bHLH112, bHLH162, bHLH120, bHLH118, and bHLH140, were upregulated. The results showed that these subfamilies may play more important roles in stress response (Table S2).
3.8. DEGs Associated with Protease Inhibitor, Chitinase, and MAPK
Three Glu-specific Streptomyces griseus protease inhibitor genes were all upregulated and responded to wounds. Moreover, there were nine (three upregulated and six downregulated) chitinase activity genes expressed in damaged leaves. The genes encoding chitinase 4 were downregulated, while the genes encoding chitinase 1 were upregulated. MAPK signaling plays a critical role in regulating the induced defense responses of C. tetracocca to E. onukii, and the expression of several MAPKs was significantly upregulated, including mitogen-activated protein kinase kinase MKK1 (LOC114295503), MKK5 (LOC114278743), MKK6 (LOC114322094), MKK9 (LOC114288490), and mitogen-activated protein kinase kinase kinase MEKK1 (LOC114315690), MAPKKK5 (LOC114271130), and MAPKKK17 (LOC114304498, LOC114311515, LOC114315690) (Table S2).
3.9. Functional Classification of DEGs
To provide the biological significance of RNA-Seq data, Go categorization analysis was performed to determine the enrichment of biological functions associated with genes. Many enriched categories were identified, including “biological process”, “cellular component”, and “molecular function” (Figure 3). KEGG enrichment analyses showed four main parts (cellular processes, environmental information processing, genetic information processing, metabolism) containing twenty-three KEGG pathway categories (Figure 4). We further screened pathway entries with a corresponding number of differentially expressed genes greater than 2, and ranked the top 20 in terms of the −log10 of the p-value corresponding to each entry in descending order, as shown in the bubble chart below. The upregulated genes were enriched in plant hormone signal transduction, metabolism of xenobiotics by cytochrome P450, the drug metabolism—cytochrome P450, glutathione metabolism, phenylpropanoid biosynthesis, and starch and sucrose metabolism (Figure 5A). The downregulated genes were enriched in amino sugar and nucleotide sugar metabolism, starch and sucrose metabolism, and flavonoid biosynthesis (Figure 5B).
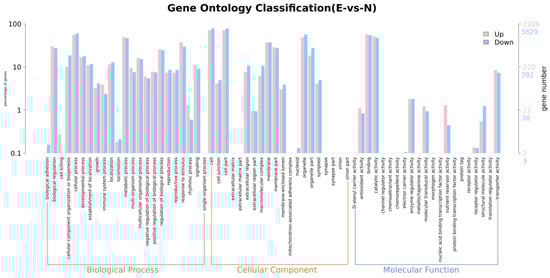
Figure 3.
Diagrams of gene ontology database annotations. Note: Pink refers to GO level 2 entries with upregulation of differentially expressed genes, light blue refers to GO level 2 entries with downregulation of differentially expressed genes, the horizontal axis refers to the entry name, and the vertical axis refers to the number and percentage of genes corresponding to the entry.
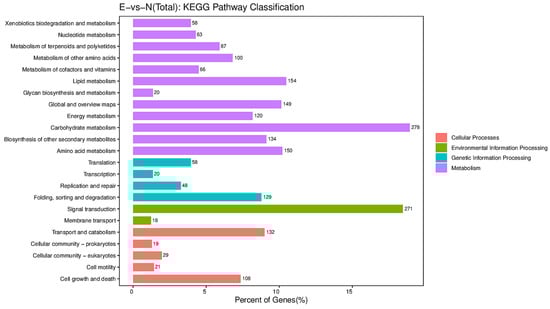
Figure 4.
Diagram of Kyoto Encyclopedia of Genes and Genomes database annotations.
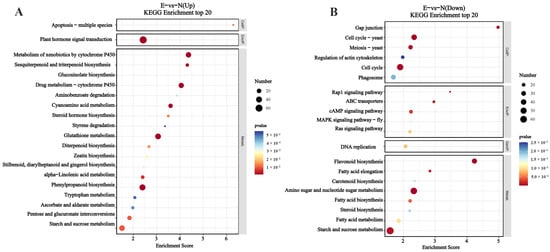
Figure 5.
Enrichment bubble diagram of differentially expressed genes of C. tetracocca leaves feeding by E. onukii vs. healthy leaves. (A) The upregulated gene KEGG enrichment pathway and (B) the downregulated gene KEGG enrichment pathway. Note: The Enrichment Score on the horizontal axis in the figure represents the enrichment score. The larger the bubble, the more differential protein-coding genes it contains. The color of the bubble changes from blue to white to yellow to red, and the smaller the enrichment p-value, the greater the significance.
3.10. Validation of DEGs by qPCR
A total of nine DEGs were used to validate the data from the RNA-Seq analyses. Compared with the healthy leaves, six genes were upregulated and three genes were downregulated after C. tetracocca leaves were fed on by E. onukii. We further analyzed the correlation between RNA-Seq and qPCR, and the results were consistent (Figure 6A,B).
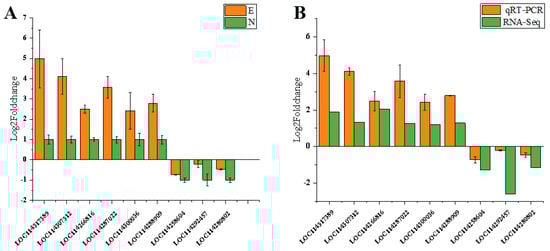
Figure 6.
(A) Quantitative real-time PCR validation of C. tetracocca leaves feeding by E. onukii and healthy leaves. (B) Quantitative real-time PCR validation of transcriptome sequencing results.
3.11. Joint Analysis of the Transcriptom
The correlation enrichment heatmaps of the top 20 DEGs and DEMs discovered between the transcriptome and metabolome with the associated correlation coefficient (different colors) are shown in Figure 7. The top 20 DEGs and DEMs with absolute correlation coefficient values larger than 0.5 were filtered in order to create the network diagram with all metabolites since the correlation network diagram placed the genes or metabolites in significantly associated positions (Figure 7). We also plotted the correlation network of the top 20 DEGs and DEMs. N2-acetylornithine had a significant positive correlation with LOC114287676 (DNAJ1) and LOC114275037 (GOS2). The DNAJ1 gene was significantly upregulated and its expression level was approximately five times that of healthy leaves. The GOS2 gene was also significantly upregulated and its expression level was approximately six times that of healthy leaves. D-malic acid has a remarkable effect with LOC114282078. However, LOC114282078 encoding chalcone synthase 2 was significantly downregulated. Seven secondary metabolites, including N2-acetylornithine, D-malic acid, theogallin, fucosyllactose, 5-caffeoylquinic acid, fumarprotocetraric acid, and arabinogalactose, were located at the center of the network and had a significant correlation with genes (Figure 8).
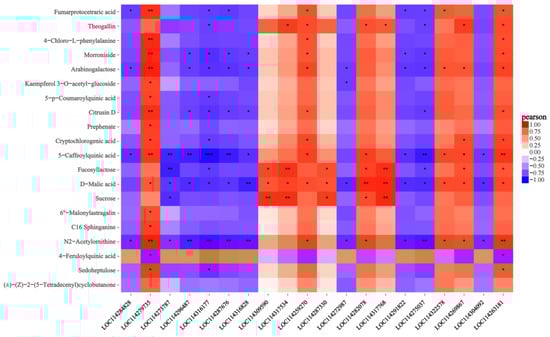
Figure 7.
A correlation heatmap based on the results of analyzing the association between the top 20 differentially expressed genes and differentially expressed metabolites. Note: Each line represents a different gene and each column is the corresponding metabolite. Jacinth is a positive correlation and blue is a negative correlation. The darker the color, the greater the correlation, and white is zero. The *** in the figure represents a correlation p-value less than 0.001, the ** in the figure represents a correlation p-value less than 0.01, and the * in the figure represents a correlation p-value less than 0.05.
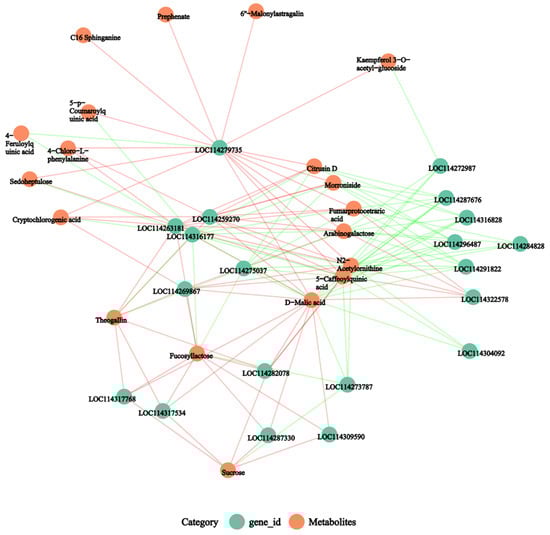
Figure 8.
An association network diagram based on the association analysis results of differential genes and differential metabolites, the p-value < 0.05 was used. Note: The red line represents a positive correlation and the green line represents a negative correlation. The thickness of the line represents the correlation coefficient.
4. Discussion
Plants release a series of volatile organic compounds into the environment, and these compounds are highly responsive to biotic and abiotic factors [34,35]. Since the reactions of O3 molecules with VOCs contribute to non-stomatal flux, plants’ exposure to high concentrations of ozone can be damaged to a certain extent [36]. Therefore, when studying plant volatiles, we also need to consider their impact on the environment. Our results indicated a variation in damaged leaves and healthy leaves. (E)-2-hexenal and linalool, emitted by damaged leaves, were significantly increased compared to healthy leaves. Contrarily, (Z)-3-hexen-1-ol-acetate, (Z)-butanoic acid, 3-hexenyl ester, and methyl salicylate had a certain degree of reduction compared to damaged leaves. (E)-2-hexenal is a potentially natural antifungal compound and a female-attracting pheromone produced by disturbed Megacopta cribraria [37,38].
Phytohormones are produced or increased within plants that govern multiple physiological processes. JA, SA, ET, and ABA are major defense-related phytohormones [39]. JA plays a central role in regulating plant defenses against insect herbivore attacks [40] as shown in the current study. In the JA pathway, six genes were regulated, including 12-oxophytodie reductase (OPR) and acyl-coenzyme A oxidase, which showed higher expression levels. The 12-oxophytodienoate reductase (OPR) gene is a key gene for jasmonic acid synthesis in plants [41]. Similar results have also been demonstrated in Haloxylon ammodendron responses to osmotic stress [42]. These genes encoding OPR are involved in the response of cucumber (Cucumis sativus L.) to aphid infestation [43]. Additionally, the ERF family is a major subfamily of the plant-specific APETALA2/ethylene-responsive factor (AP2/ERF) transcription factor, which participates in the signaling pathway of ET hormones and enhances resistance to biotic and abiotic stresses by positively regulating the expression of plant pathogen-related genes [44]. ERF transcription factor enhances Chinese cabbage resistance to Myzus persicae and Spodoptera litura [45], and ERF1B was significantly upregulated when C. tetracocca was damaged by E. onukii in that work. The results indicated that ERF transcription factors actively participated in the process of insects feeding on plants. ABA and JA signals modulate plant defenses against herbivorous insects, and 13 genes were upregulated in the study. The results were consistent with the ABA and JA signaling pathways in rice-mediated defenses against Nilaparvata lugens [46].
Herbivorous insects share the potential to induce chemical changes for the plants they feed on, and plants produce or increase the contents of secondary metabolites, which reduces herbivore feeding [47,48]. Terpene synthases (TPSs), as key enzymes for terpene biosynthesis, catalyze the formation of terpenes from isoprenyl diphosphate substrates of assorted chain lengths [49]. The expression level of (E,E)-alpha-farnesene synthase from leaves damaged by E. onukii was higher than in healthy leaves. This indicated that (E,E)-alpha-farnesene has a role in the defense against E. onukii. An (E,E)-α-farnesene synthase gene of soybean also plays a defense role against nematodes [50], and is involved in synthesizing insect-induced volatiles.
Transcription factors (TFs) play key roles in plant responses to biotic stress. Under E. onukii stress, many upregulated TFs include MYB, AP2, NAC, WRKY, BZIP, and bHLH. The results are consistent with former studies [50]. Camellia sinensis was damaged by Ectropis oblique, and these TFs including AP2, bHLH, MYB, NAC, and WRKY were upregulated [51]. Rice plants’ responses to Cnaphalocrocis medinalis caterpillar damage and WRKY TFs were involved in regulating the induced defense response to this pest [16]. MYB is one of the largest families of TFs in plants and is characterized by a highly conserved DNA-binding domain: the MYB domain. Numerous MYB-related genes were upregulated, and a similar finding was reported in the Nicotiana benthamiana response to Bemisia tabaci [52]. MYC TFs are well-known regulators of plant defense against insects. MYC2 is considered to be the master regulator of most aspects of JA signaling transduction. In our work, MYC2 was upregulated when leaves of C. tetracocca were damaged by E. onukii, and this result confirms the contribution of MYC2 to Arabidopsis [53].
Our transcriptome analysis indicated that upregulated genes were enriched in plant hormone signal transduction in KEGG terms. Similar results were also identified showing that Ectropis oblique stress led to the ABA and JA signaling genes being enriched in plant hormone signal transduction [51]. Combined with our previous study, the top 20 DEGs and DEMs were screened with absolute correlation coefficient values greater than 0.5. Here, N2-acetylornithine, D-malic acid, theogallin, fucosyllactose, 5-caffeoylquinic acid, fumarprotocetraric acid, and arabinogalactose had a significant correlation with genes. In addition, 4-feruloylquinic acid had a significant negative correlation with LOC1142799735 (−0.85622) and LOC114263171 (−0.84108); therefore, we can lower the expression of these two genes and increase the content of this compound by feeding E. onukii on ancient tea leaves. Overall, our results suggest that when C. tetracocca is attacked by E. onukii, a defense mechanism based on plant hormone signal transduction and transcription factors is activated.
5. Conclusions
E. onukii feeds on young shoots of tea leaves and causes serious damage to tea production and quality. C. tetracocca is a unique and ancient tea tree variety. There is a poor understanding of the response of C. tetracocca’s volatile components to E. onukii infestation, and the molecular mechanisms by which C. tetracocca perceives, responds to, and defends against E. onukii damage are unclear. Therefore, volatiles were determined using a headspace sampling technique and analyzed using GC-MS. Linalool and (E)-2-hexenal were identified to have increased levels. (E)-2-hexenal could be considered as female-attracting pheromones of E. onukii, so that E. onukii could be better attracted to achieve more efficient, green, and environmentally friendly prevention and control. Meanwhile, the transcriptome was applied to analyze the recognition and initiation of defense responses upon damage by E. onukii. We identified the key genes, metabolites, and metabolic pathways related to C. tetracocca’s response to E. onukii. This provided a total of 8172 DEGs including 3074 upregulated genes and 5098 downregulated genes. The OPR gene, (E,E)-α-farnesene synthase gene, and MYC2 gene could be considered as strong candidates for adapting to E. onukii damage. Therefore, these candidate genes could be used for future genetic improvements of C. tetracocca to improve insect resistance. Further analysis of these DAMs and DEGs demonstrated that N2-acetylornithine, D-malic acid, theogallin, fucosyllactose, 5-caffeoylquinic acid, fumarprotocetraric acid, and arabinogalactose might be involved in the complex response to E. onukii. Our research sheds light on the molecular mechanisms involved in the resistance of C. tetracocca to E. onukii stress. Future research will identify and evaluate the appropriate candidates and metabolites among response genes that confer single stress tolerance to ancient tea plants, and will provide a theoretical basis for the development and utilization of ancient tea trees.
Supplementary Materials
The following supporting information can be downloaded at: https://www.mdpi.com/article/10.3390/f14102059/s1, Table S1: Volatile compounds detected in leaves of C. tetracocca fed by E. onukii and healthy leaves; Table S2: Differentially expressed genes from leaves of C. tetracocca fed by E. onukii (E) vs. healthy leaves (N).
Author Contributions
Conceptualization, N.Z. and Y.S.; methodology, J.W.; software, T.P.; validation, W.T. and J.W.; formal analysis, Z.Z.; investigation, J.W.; resources, N.Z.; data curation, Z.Z.; writing—original draft preparation, N.Z.; writing—review and editing, Y.S.; visualization, Z.Y.; supervision, Y.S.; project administration, Y.S.; funding acquisition, Y.S. All authors have read and agreed to the published version of the manuscript.
Funding
This research was funded by the World Top Discipline Program of Guizhou Province: Karst Ecoenvironment Sciences (No. 125 2019 Qianjiao Keyan Fa), the Science and Technology Project of Guiyang City ([2020]7-18), the Innovation Group Project of Education Department of Guizhou Province ([2021]013), the National Natural Science Foundation of China (32260120), the Natural Science Foundation of Guizhou Province (Qiankehejichu-ZK [2023] General 257), the Training Program for High-level Innovative Talents of Guizhou Province (Qiankehepingtairencai-GCC [2023]032) and the Natural Science Research Project of Guizhou Provincial Department of Education (Qianjiaoji [2022] 009). The APC was funded by 32260120.
Data Availability Statement
The original contributions presented in the study are publicly available. These data can be found at the National Center for Biotechnology Information (NCBI) BioProjrct database under accession number PRJNA1010984.
Conflicts of Interest
The authors declare no conflict of interest.
References
- Zhao, Q.; Shi, L.Q.; He, W.Y.; Li, J.Y.; You, S.J.; Chen, S.; Lin, J.; Wang, Y.B.; Zhang, L.W.; Yang, G.; et al. Genomic variations in the tea leafhopper reveal the basis of its adaptive evolution. Genom. Proteom. Bioinf. 2022, 20, 1092–1105. [Google Scholar] [CrossRef] [PubMed]
- Zhang, H.D. Systematic classification of tea plants. Acta Sci. Nat. Univ. Sunyatseni 1981, 1, 87–99. [Google Scholar]
- Yuan, M.Q.; Qian, C.J. Study on endemic plant Camellia tetracocca in Pu’an county, Guizhou. Guizhou Sci. 2009, 2, 80–85. [Google Scholar]
- Duan, X.Y.; Hu, H.J.; Wang, J.L.; Cao, Y.; Zhao, H.F. Present situation, protection and utilization of big tea tree Resources in southwest Guizhou. Agric. Technol. Serv. 2011, 28, 1736–1737. [Google Scholar]
- Chen, L.L.; Yuan, P.; Pozsgai, G.; Chen, P.; Zhu, H.P.; You, M.S. The impact of cover crops on the predatory mite Anystis baccarum (Acari, Anystidae) and the leafhopper pest Empoasca onukii (Hemiptera, Cicadellidae) in a tea plantation. Pest Manag. Sci. 2019, 75, 3371–3380. [Google Scholar] [CrossRef]
- Qin, D.; Zhang, L.; Xiao, Q.; Dietrich, C.; Matsumura, M. Clarification of the identity of the tea green leafhopper based on morphological comparison between Chinese and Japanese specimens. PLoS ONE 2015, 10, e0139202. [Google Scholar] [CrossRef]
- Zhang, N.; Tan, W.W.; Luo, G.M.; Pu, T.Y.; Wang, J.Q.; Zhang, X.H.; Song, Y.H. Untargeted metabolite profiling of Camellia tetracocca’s response to an Empoasca onukii attack using GC-MS and LC-MS. Agronomy 2023, 13, 791. [Google Scholar] [CrossRef]
- Mumm, R.; Hilker, M. Direct and indirect chemical defense of pine against folivorous insects. Trends Plant Sci. 2006, 11, 351–358. [Google Scholar] [CrossRef]
- Degenhardt, J. Indirect defense responses to herbivory in grasses. Plant Physiol. 2009, 149, 96–102. [Google Scholar] [CrossRef]
- Tamiru, A.; Bruce, T.J.A.; Woodcock, C.M.; Caulfield, J.C.; Midega, C.A.O.; Ogol, C.K.P.O.; Mayon, P.; Birkett, M.A.; Pickett, J.A.; Khan, Z.R. Maize landraces recruit egg and larval parasitoids in response to egg deposition by a herbivore. Ecol. Lett. 2011, 14, 1075–1083. [Google Scholar] [CrossRef]
- Bai, Y.C.; Yang, C.; Halitschke, R.; Paetz, C.; Kessler, D.; Burkard, K.; Gaquerel, E.; Baldwin, I.T.; Li, D. Natural history-guided omics reveals plant defensive chemistry against leafhopper pests. Science 2022, 375, eabm2948. [Google Scholar] [CrossRef] [PubMed]
- Xue, N.; Zhan, C.; Song, J.; Li, Y.; Zhang, J.; Qi, J.; Wu, J. The glutamate receptor-like 3.3 and 3.6 mediate systemic resistance to insect herbivores in Arabidopsis. J. Exp. Bot. 2022, 73, 7611–7627. [Google Scholar] [CrossRef] [PubMed]
- Afsah-Hejri, L.; Rajaram, P.; O’Leary, J.; McGivern, J.; Baxter, R.; Mesbah, A.; Maboudian, R.; Ehsani, R. Identification of volatile organic compounds (VOCs) by SPME-GC-MS to detect Aspergillus flavus infection in pistachios. Food Control 2023, 154, 110033. [Google Scholar] [CrossRef]
- Villagra, C.; Vera, W.; Lenitz, S.; Bergmann, J. Differences in volatile emissions between healthy and gall-induced branches of Haplopappus foliosus (Asteraceae). Biochem. Syst. Ecol. 2021, 98, 104309. [Google Scholar] [CrossRef]
- Chesnais, Q.; Golyaev, V.; Velt, A.; Rustenholz, C.; Brault, V.; Pooggin, M.M.; Drucker, M. Comparative plant transcriptome profiling of Arabidopsis thaliana Col-0 and Camelina sativa var. Celine infested with Myzus persicae aphids acquiring circulative and noncirculative viruses reveals virus- and plant-specific alterations relevant to aphid feeding behavior and transmission. Microbiol. Spectr. 2022, 10, 00136. [Google Scholar]
- Pamplona, R.S.; Kim, J.; Lee, J.W.; Kim, C.S.; Boo, K.H. Comparative transcriptome analysis of spinach in response to insect herbivory. Plant Biotechnol. Rep. 2022, 16, 43–55. [Google Scholar] [CrossRef]
- Wang, D.D.; Li, P.; Chen, Q.Y.; Chen, X.Y.; Yan, Z.W.; Wang, M.Y.; Mao, Y.B. Differential contributions of MYCs to insect defense reveals flavonoids alleviating growth inhibition caused by wounding in Arabidopsis. Front. Plant Sci. 2021, 12, 700555. [Google Scholar] [CrossRef]
- Wang, Y.Q.; Liu, Q.S.; Du, L.X.; Hallerman, E.M.; Li, Y.H. Transcriptomic and metabolomic responses of rice plants to Cnaphalocrocis medinalis Caterpillar infestation. Insects 2022, 11, 705. [Google Scholar] [CrossRef]
- Zhang, H.; Liu, E.L.; Huang, X.Z.; Kou, J.F.; Teng, D.; LV, B.B.; Han, X.Q.; Zhang, Y.J. Characterization of a novel insect-Induced sesquiterpene synthase GbTPS1 based on the transcriptome of Gossypium barbadense feeding by cotton bollworm. Front. Plant Sci. 2022, 13, 898541. [Google Scholar] [CrossRef]
- Zhao, X.M.; Chen, S.; Wang, W.N.; Wang, X.X.; Lin, Y.Z.; Su, F.; Yang, Z.B.; Yu, X.M. Defensive responses of tea plants (Camellia sinensis) against tea green leafhopper attack: A multi-omics study. Front. Plant Sci. 2020, 10, 1705. [Google Scholar] [CrossRef]
- Liu, H.F.; Li, S.F.; Xiao, G.S.; Wang, Q. Formation of volatiles in response to tea green leafhopper (Empoasca onukii Matsuda) herbivory in tea plants: A multi-omics study. Plant Cell Rep. 2021, 40, 753–766. [Google Scholar] [CrossRef] [PubMed]
- Xiang, P.; Wilson, I.W.; Huang, J.; Zhu, Q.; Tan, M.; Lu, J.; Gao, S.; Zheng, S.; Lin, D.; Zhang, Y.; et al. Co-regulation of catechins biosynthesis responses to temperature changes by shoot growth and catechin related gene expression in tea plants (Camellia sinensis L.). J. Hortic. Sci. Biotechnol. 2021, 96, 228–238. [Google Scholar] [CrossRef]
- Fu, X.; Chen, Y.; Mei, X.; Katsuno, T.; Kobayashi, E.; Dong, F.; Watanabe, N.; Yang, Z. Regulation of formation of volatile compounds of tea (Camellia sinensis) leaves by single light wavelength. Sci. Rep. 2015, 5, 16858. [Google Scholar] [CrossRef] [PubMed]
- Chen, S.F.; Zhou, Y.P.; Chen, Y.R.; Gu, J. fastp: An ultra-fast all-in-one FASTQ preprocessor. Bioinformatics 2018, 34, i884–i890. [Google Scholar] [CrossRef]
- Kim, D.; Langmead, B.; Salzberg, S.L. HISAT: A fast spliced aligner with low memory requirements. Nat. Methods 2015, 12, 357–360. [Google Scholar] [CrossRef]
- Roberts, A.; Trapnell, C.; Donaghey, J.; Rinn, J.L.; Pachter, L. Improving RNA-Seq expression estimates by correcting for fragment bias. Genome Biol. 2011, 12, R22. [Google Scholar] [CrossRef]
- Anders, S.; Pyl, P.T.; Huber, W. HTSeq—A Python framework to work with high-throughput sequencing data. Bioinformatics 2015, 31, 166–169. [Google Scholar] [CrossRef]
- Love, M.I.; Huber, W.; Anders, S. Moderated estimation of fold change and dispersion for RNA-seq data with DESeq2. Genome Biol. 2014, 15, 550. [Google Scholar] [CrossRef]
- The Gene Ontology Consortium. The Gene Ontology Resource: 20 years and still GOing strong. Nucleic Acids Res. 2019, 47, D330–D338. [Google Scholar] [CrossRef]
- Kanehisa, M.; Araki, M.; Goto, S.; Hattori, M.; Hirakawa, M.; Itoh, M.; Katayama, T.; Kawashima, S.; Okuda, S.; Tokimatsu, T.; et al. KEGG for linking genomes to life and the environment. Nucleic Acids Res. 2008, 36, D480–D484. [Google Scholar] [CrossRef]
- Livak, K.J.; Schmittgen, T.D. Analysis of relative gene expression data using real-time quantitative PCR and the 2−ΔΔCt method. Methods 2001, 25, 402–408. [Google Scholar] [CrossRef] [PubMed]
- Pertea, M.; Kim, D.; Pertea, G.M.; Leek, J.T.; Salzberg, S.L. Transcript-level expression analysis of RNA-seq experiments with HISAT, StringTie and Ballgown. Nat. Protoc. 2016, 11, 1650–1667. [Google Scholar] [CrossRef] [PubMed]
- Ye, M.; Glauser, G.; Lou, Y.G.; Erb, M.; Hu, L.F. Molecular dissection of early defense signaling underlying volatile-mediated defense regulation and herbivore resistance in rice. Plant Cell 2019, 31, 687–698. [Google Scholar] [CrossRef]
- Clavijo McCormick, A. Can plant–natural enemy communication withstand disruption by biotic and abiotic factors? Ecol. Evol. 2016, 6, 8569–8582. [Google Scholar] [CrossRef] [PubMed]
- Vivaldo, G.; Masi, E.; Taiti, C.; Caldarelli, G.; Mancuso, S. The network of plants volatile organic compounds. Sci. Rep. 2017, 7, 11050. [Google Scholar] [CrossRef]
- Juráň, S.; Grace, J.; Urban, O. Temporal changes in ozone concentrations and their impact on vegetation. Atmosphere 2021, 12, 82. [Google Scholar] [CrossRef]
- Ma, W.B.; Zhao, L.L.; Zhao, W.H.; Xie, Y.L. (E)-2-Hexenal, as a potential natural antifungal compound, inhibits Aspergillus flavus Spore germination by disrupting mitochondria! Energy metabolism. J. Agric. Food Chem. 2019, 67, 1138–1145. [Google Scholar] [CrossRef]
- Onnink, C.M.; Williams, A.A.; Williams, J.S. Electrophysiological and behavioral evidence for (E)-2-Hexenal as a female-attracting pheromone produced by disturbed Megacopta cribraria (Hemiptera: Plataspidae). J. Entomol. Sci. 2017, 52, 39–51. [Google Scholar]
- Berens, M.L.; Berry, H.M.; Mine, A.; Argueso, C.T.; Tsuda, K. Evolution of hormone signaling networks in plant defense. Annu. Rev. Phytopathol. 2017, 55, 401–425. [Google Scholar] [CrossRef]
- Liu, Z.; Zhang, S.; Sun, N.; Liu, H.; Zhao, Y.; Liang, Y.; Zhang, L.; Han, Y. Functional diversity of jasmonates in rice. Rice 2015, 8, 42. [Google Scholar] [CrossRef]
- Sun, Y.H.; Hung, C.Y.; Qiu, J.; Chen, J.J.; Kittur, F.S.; Oldham, C.E.; Henny, R.J.; Burkey, K.O.; Fan, L.J.; Xie, J.H. Accumulation of high OPDA level correlates with reduced ROS and elevated GSH benefiting white cell survival in variegated leaves. Sci. Rep. 2017, 7, 44158. [Google Scholar] [CrossRef] [PubMed]
- Gao, H.J.; Lü, X.P.; Zhang, L.; Qiao, Y.; Zhao, Q.; Wang, Y.P.; Li, M.F.; Zhang, J.L. Transcriptomic profiling and physiological analysis of Haloxylon ammodendron in response to osmotic stress. Int. J. Mol. Sci. 2018, 19, 84. [Google Scholar] [CrossRef]
- Qi, X.H.; Chen, M.Y.; Liang, D.N.; Xu, Q.; Zhou, F.C.; Chen, X.H. Jasmonic acid, ethylene and ROS are involved in the response of cucumber (Cucumis sativus L.) to aphid infestation. Sci. Hortic. 2020, 269, 109421. [Google Scholar] [CrossRef]
- Zhang, J.Y.; Wang, Q.J.; Guo, Z.R. Progresses on plant AP2/ERF transcription factors. Yi Chuan 2012, 34, 835–847. [Google Scholar] [CrossRef]
- Wu, J.; Gao, H.; Zhu, X.W.; Li, D.F. An ERF transcription factor enhances plant resistance to Myzus persicae and Spodoptera litura. Biotechnol. Biotechnol. Equip. 2020, 34, 946–954. [Google Scholar] [CrossRef]
- Li, J.T.; Chen, L.; Ding, X.; Fan, W.Y.; Liu, J.L. Transcriptome analysis reveals crosstalk between the Abscisic Acid and Jasmonic Acid signaling pathways in rice-mediated defense against Nilaparvata lugens. Int. J. Mol. Sci. 2022, 23, 6319. [Google Scholar] [CrossRef] [PubMed]
- Karban, R.; Agrawal, A.A.; Mangel, M. The benefits of induced defenses against herbivores. Ecology 1997, 78, 1351–1355. [Google Scholar] [CrossRef]
- Arimura, G.; Kost, C.; Boland, W. Herbivore-induced, indirect plant defenses. Biochim. Biophys. Acta (BBA)-Mol. Cell Biol. Lipids 2005, 1734, 91–111. [Google Scholar]
- Degenhardt, J.; Kollner, T.; Gershenzon, J. Monoterpene and sesquiterpene synthases and the origin of terpene skeletal diversity in plants. Phytochemistry 2009, 70, 1621–1637. [Google Scholar] [CrossRef]
- Lin, J.Y.; Wang, D.; Chen, X.L.; Köllner, T.G.; Mazarei, M.; Guo, H.; Pantalone, V.R.; Arelli, P.; Stewart, C.N., Jr.; Wang, N. An (E, E)-a-farnesene synthase gene of soybean has a role in defense against nematodes and is involved in synthesizing insect-induced volatiles. Plant Biotechnol. J. 2017, 15, 510–519. [Google Scholar] [CrossRef]
- Zhang, Z.B.; Liu, Z.X.; Li, S.R.; Xiong, T.; Ye, F.; Han, Y.T.; Sun, M.K.; Cao, J.J.; Luo, T.; Zhang, C.; et al. Effect of prior drought and heat stress on Camellia sinensis transcriptome changes to Ectropis oblique (Lepidoptera: Geometridae) resistance. Genomics 2022, 114, 110506. [Google Scholar] [CrossRef] [PubMed]
- Zhang, F.B.; Ji, S.X.; Yang, J.G.; Wang, X.W.; Han, W.H. Genome-wide analysis of MYB family in Nicotiana benthamiana and the functional role of the key members in resistance to Bemisia tabaci. Int. J. Biol. Macromol. 2023, 235, 123759. [Google Scholar] [CrossRef] [PubMed]
- Wang, H.P.; Li, Y.; Pan, J.J.; Lou, D.J.; Hu, Y.R.; Yu, D.Q. The bHLH transcription factors MYC2, MYC3 and MYC4 are required for jasmonate-mediated inhibition of flowering in Arabidopsis. Mol. Plant 2017, 10, 1461–1464. [Google Scholar] [CrossRef] [PubMed]
Disclaimer/Publisher’s Note: The statements, opinions and data contained in all publications are solely those of the individual author(s) and contributor(s) and not of MDPI and/or the editor(s). MDPI and/or the editor(s) disclaim responsibility for any injury to people or property resulting from any ideas, methods, instructions or products referred to in the content. |
© 2023 by the authors. Licensee MDPI, Basel, Switzerland. This article is an open access article distributed under the terms and conditions of the Creative Commons Attribution (CC BY) license (https://creativecommons.org/licenses/by/4.0/).