
The Status, Trend, and Global Position of China’s Forestry Industry: An Anatomy Based on the Global Value Chain Paradigm

Abstract
:1. Introduction
2. Materials and Methods
2.1. Data
2.2. Decomposition of Industry Value-Added
2.3. Upstream and Downstream Measures of the Industry
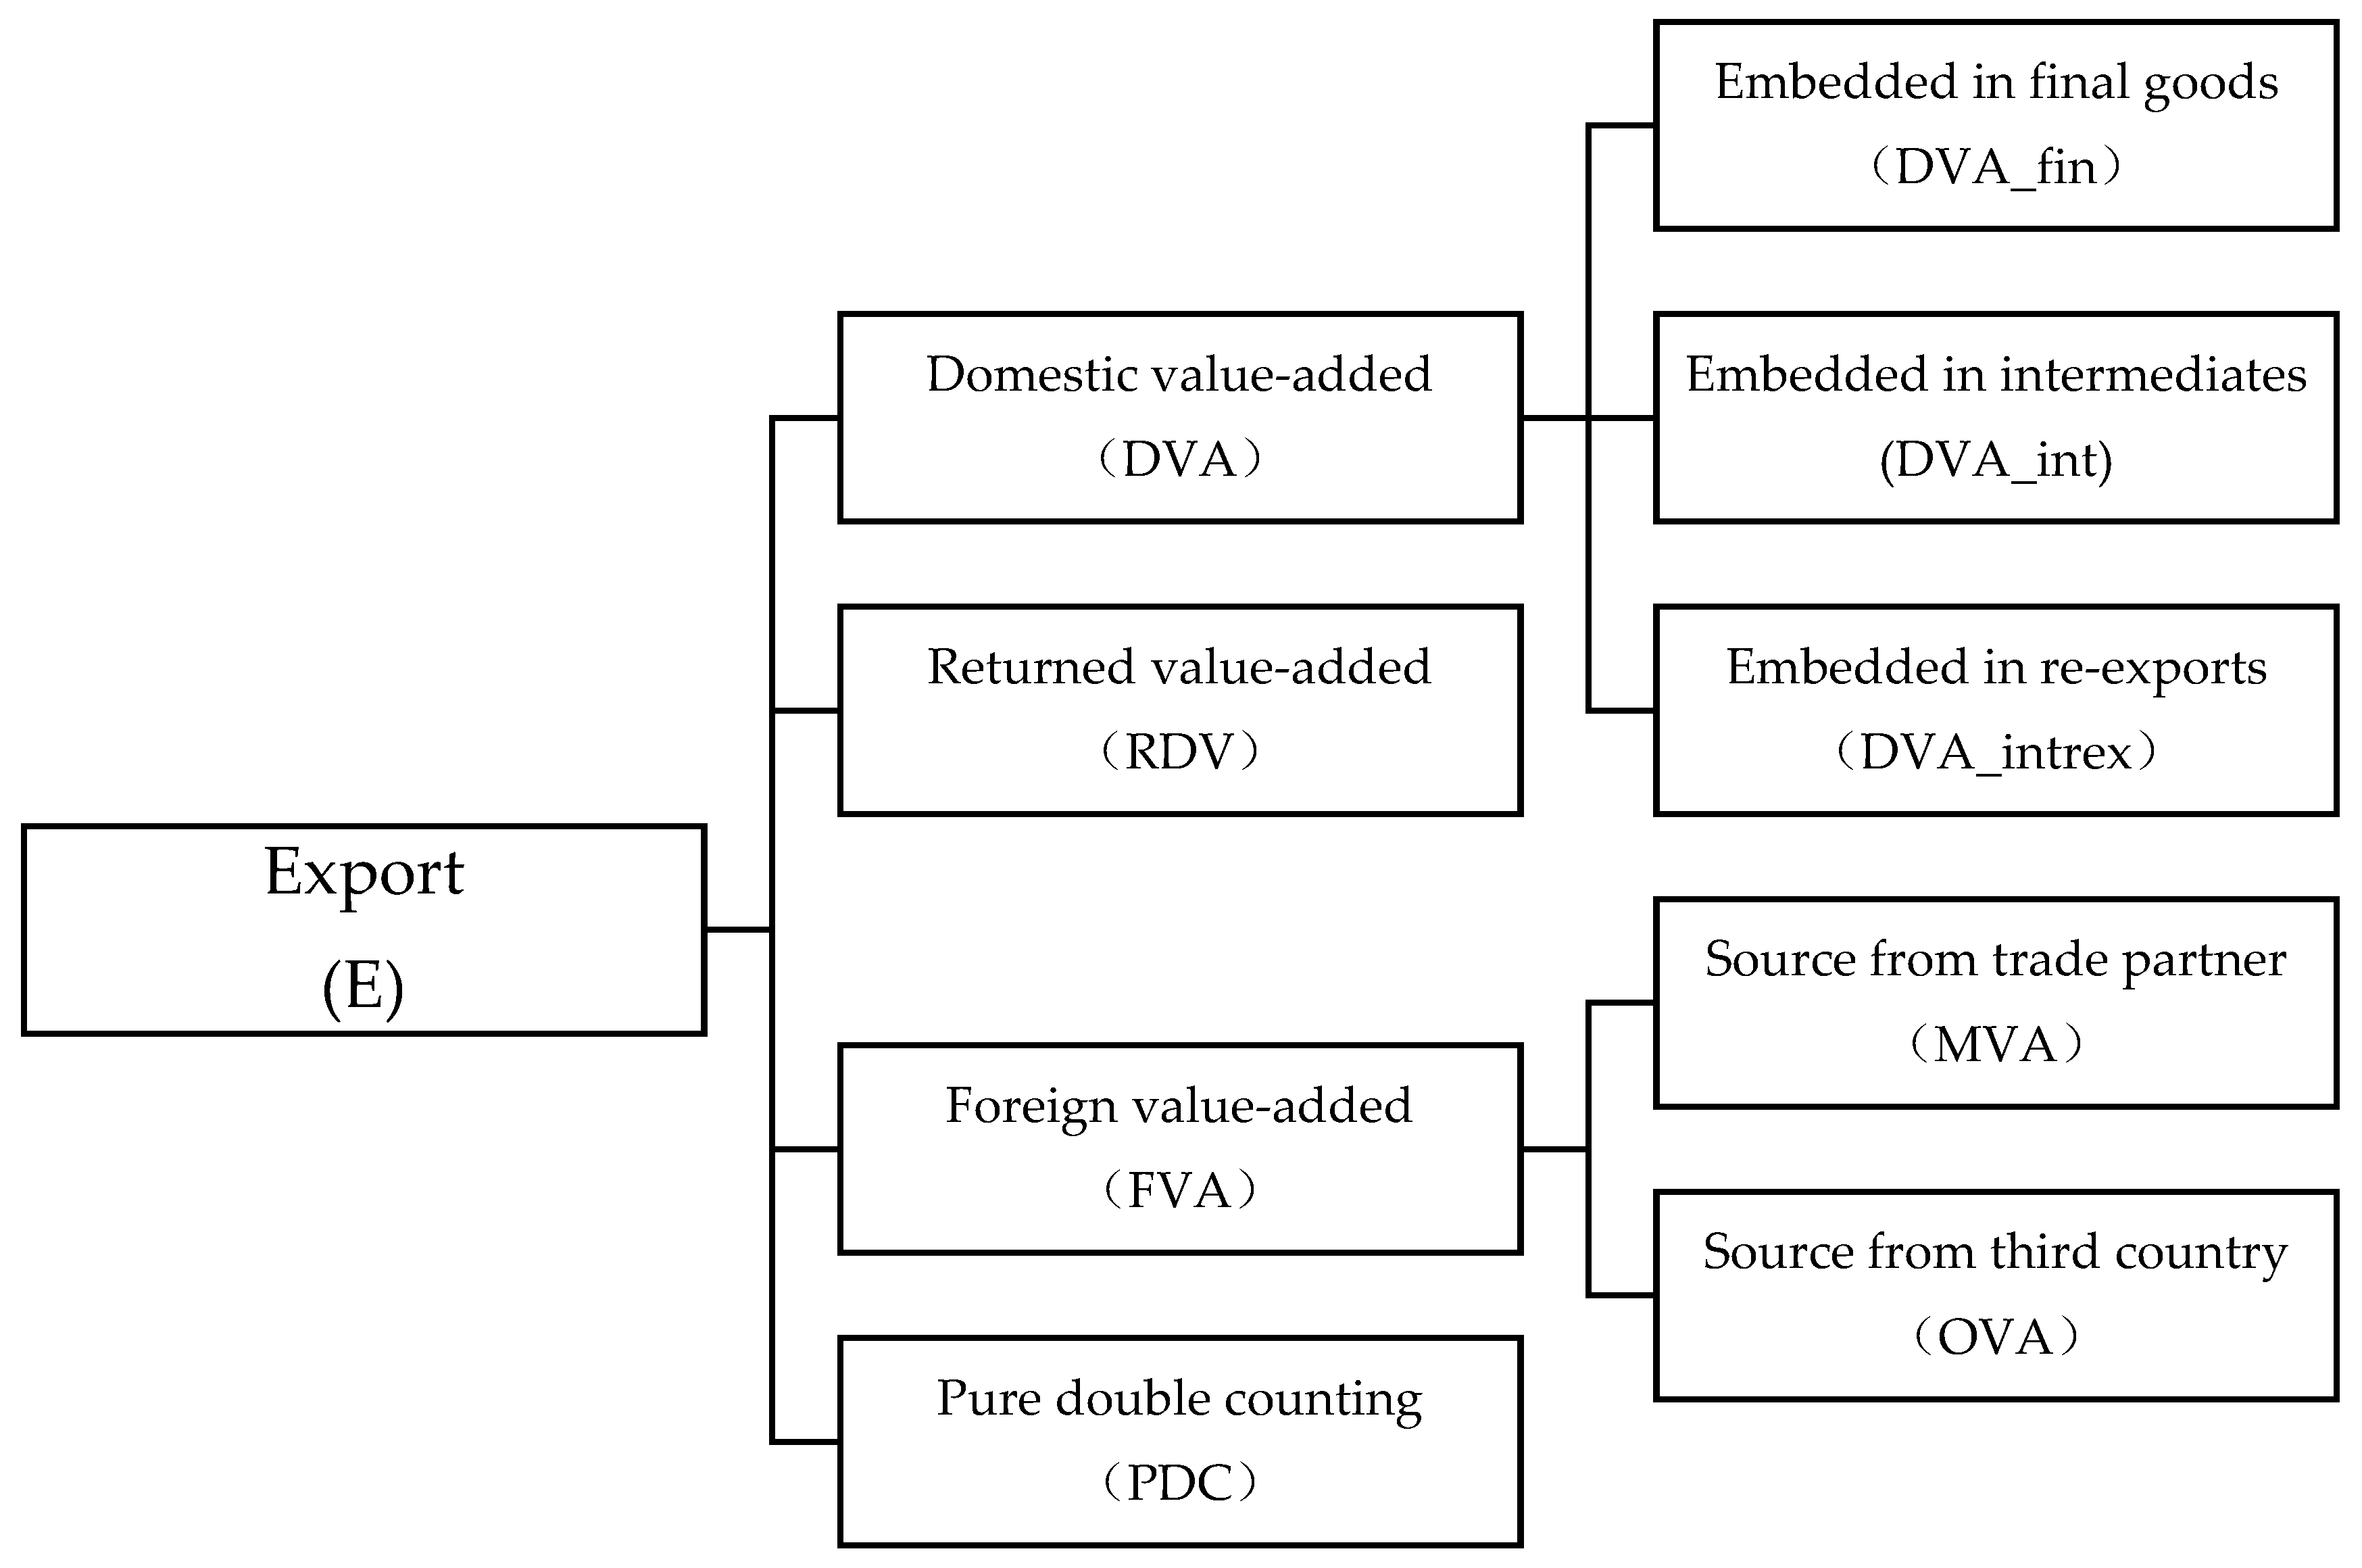
2.4. Decomposition of Industry Export Value
2.5. International Competitiveness Indicators
3. Results
3.1. Destination of China’s Forestry Industry Value-Added
3.2. Upstream and Downstream Degrees of China’s Forestry Industry
3.3. Decomposition of China’s Forestry Industry Gross Export
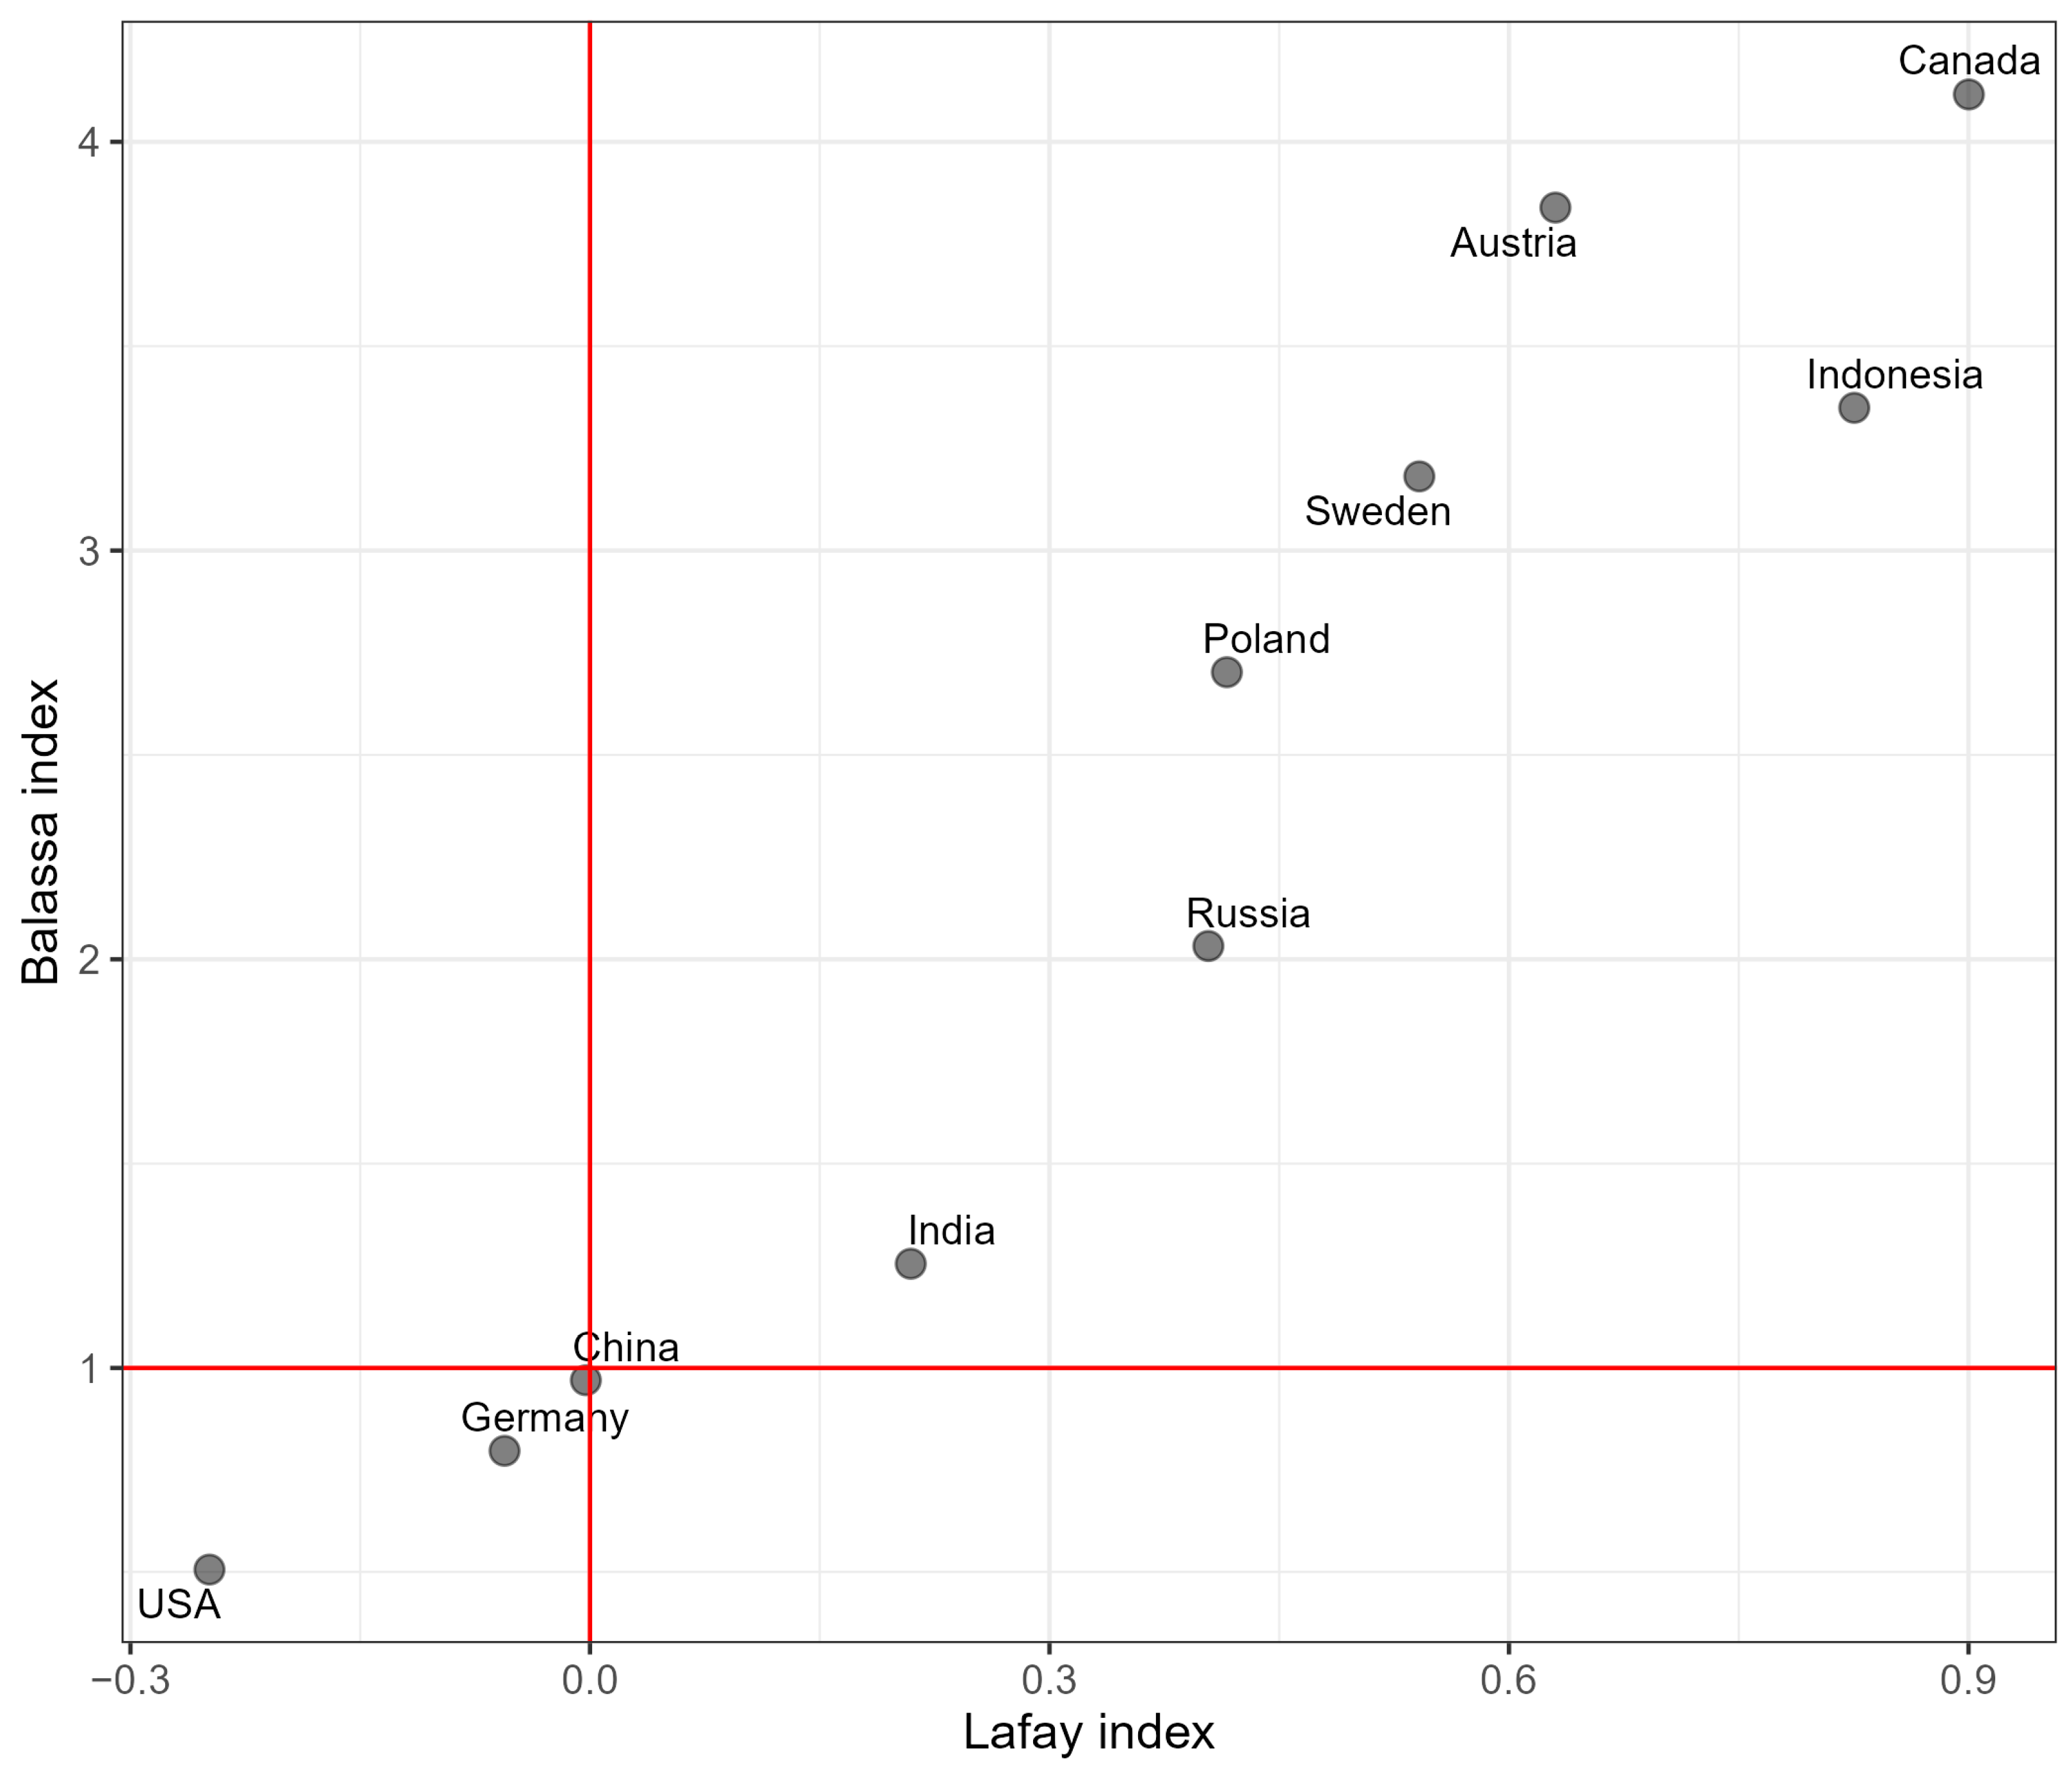
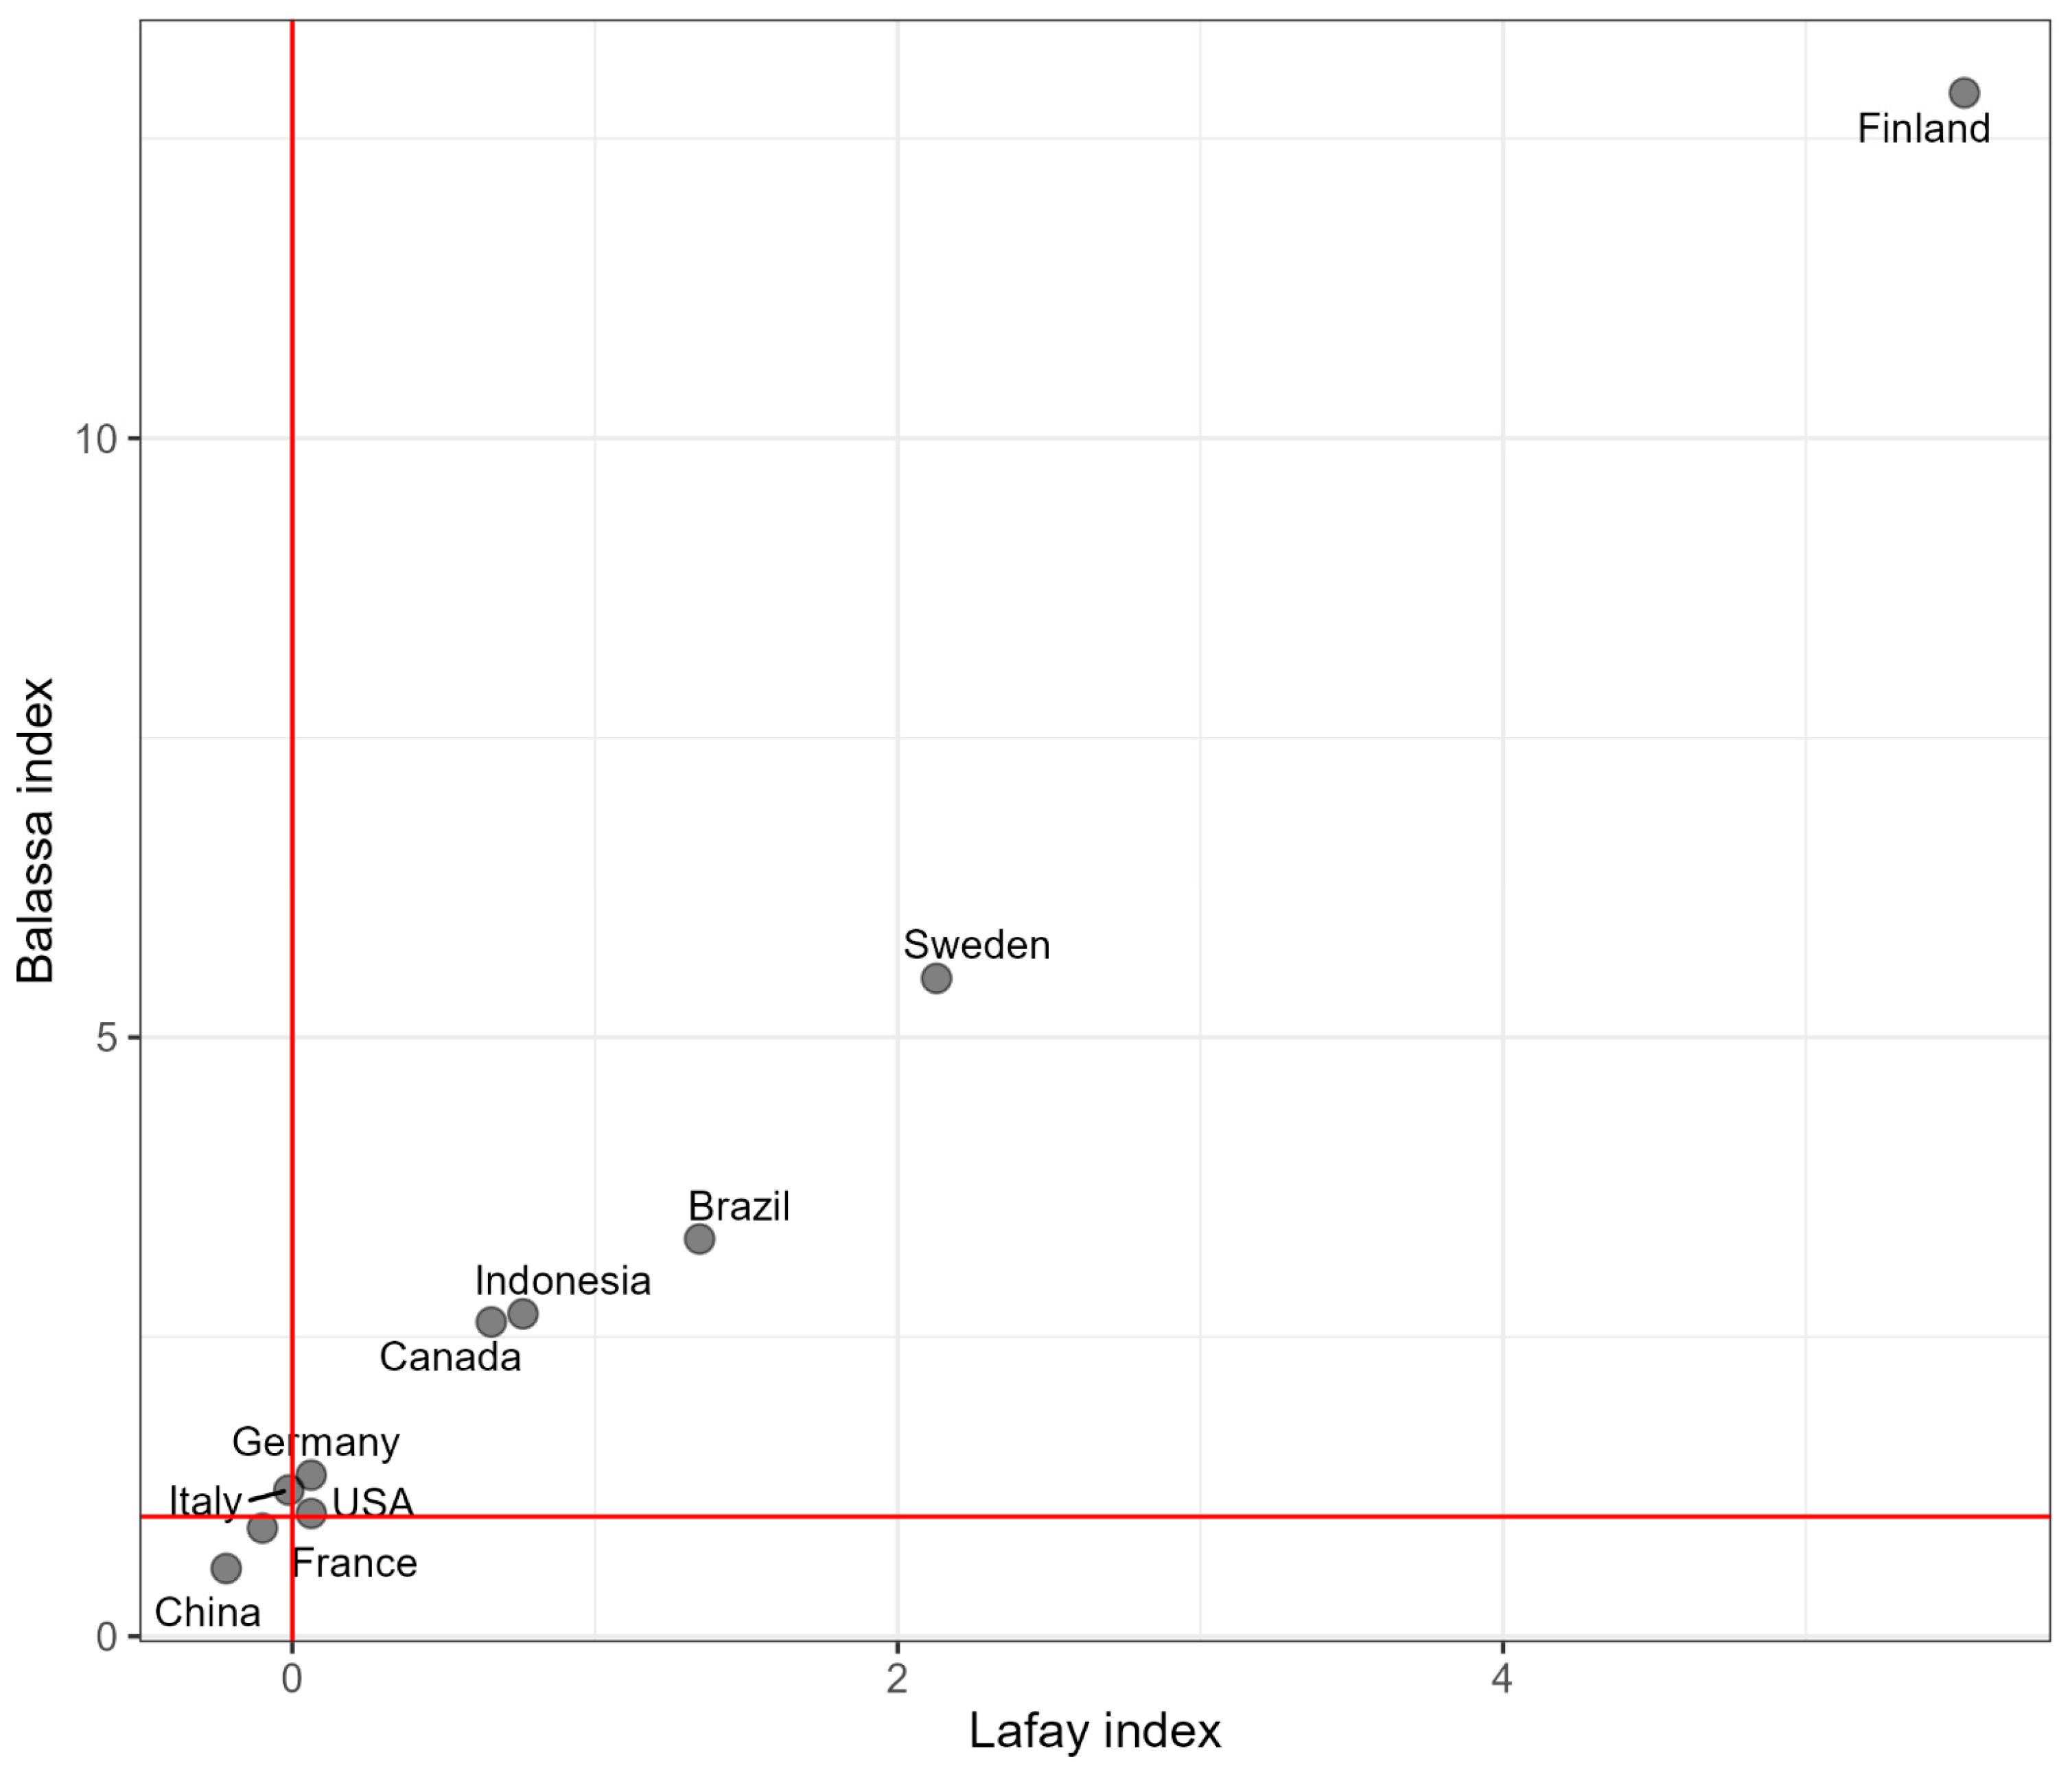
3.4. Trade Competitiveness of China’s Forestry Industry
4. Discussion
4.1. What Drives Inward Orientation of China’s Forestry Industry
4.2. The Important Role of Being Both GVC Input Supplier and Output Demander
4.3. “Big Yet Not Strong” Is Still the Issue for China’s Forestry Industry
4.4. Implications
5. Conclusions
Author Contributions
Funding
Data Availability Statement
Conflicts of Interest
References
- Hummels, D.; Ishii, J.; Yi, K.M. The nature and growth of vertical specialization in world trade. J. Int. Econ. 2001, 54, 75–96. [Google Scholar] [CrossRef]
- Baldwin, R.; Lopez-Gonzalez, J. Supply-chain trade: A portrait of global patterns and several testable hypotheses. World Econ. 2015, 38, 1682–1721. [Google Scholar] [CrossRef]
- Gereffi, G.; Humphrey, J.; Sturgeon, T. The governance of global value chains. Rev. Int. Polit. Econ. 2005, 12, 78–104. [Google Scholar] [CrossRef]
- Daudin, G.; Rifflart, C.; Schweisguth, D. Who produces for whom in the world economy? Can. J. Econ. 2011, 44, 1403–1437. [Google Scholar] [CrossRef]
- Koopman, R.; Wang, Z.; Wei, S.J. Estimating domestic content in exports when processing trade is pervasive. J. Dev. Econ. 2012, 99, 178–189. [Google Scholar] [CrossRef]
- Johnson, R.; Noguera, G. Accounting for intermediates: Production sharing and trade in value added. J. Int. Econ. 2012, 86, 224–236. [Google Scholar] [CrossRef]
- Timmer, M.P.; Erumban, A.; Los, B.; Stehrer, R.; de Vries, G.J. Slicing Up Global Value Chains. J. Econ. Perspect. 2014, 28, 99–118. [Google Scholar] [CrossRef]
- World Input-Output Database. Available online: https://www.rug.nl/ggdc/valuechain/wiod/wiod-2016-release?lang=en (accessed on 4 May 2022).
- OECD Inter-Country Input-Output Database. Available online: http://oe.cd/icio (accessed on 20 April 2022).
- ADB Multiregional Input-Output Tables. Available online: https://mrio.adbx.online/ (accessed on 7 May 2022).
- Aguiar, A.; Chepeliev, M.; Corong, E.; van der Mensbrugghe, D. The GTAP Data Base: Version 11. J. Glob. Econ. Anal. 2022, 7, 1–37. [Google Scholar] [CrossRef]
- Taglioni, D.; Winkler, D. Making Global Value Chains Work for Development; The World Bank Group: Washington, DC, USA, 2016; pp. 237–254. [Google Scholar]
- Koopman, R.; Wang, Z.; Wei, S.J. Tracing value-added and double counting in gross exports. Am. Econ. Rev. 2014, 104, 459–494. [Google Scholar] [CrossRef]
- Wang, Z.; Wei, S.J.; Zhu, K.F. Quantifying International Production Sharing at the Bilateral and Sector Levels; NBER Working Paper NO. 19677; National Bureau of Economic Research: Cambridge, MA, USA, 2013. [Google Scholar]
- Wang, Z.; Wei, S.J.; Yu, X.D.; Zhu, K.F. Global value chains over business cycles. J. Int. Money Financ. 2022, 126, 102643. [Google Scholar] [CrossRef]
- Miroudot, S.; Ye, M. Decomposing value added in gross exports. Econ. Syst. Res. 2021, 33, 67–87. [Google Scholar] [CrossRef]
- Borin, A.; Mancini, M. Measuring what matters in value-added trade. Econ. Syst. Res. 2023. [Google Scholar] [CrossRef]
- Sun, C.J.; Chen, L.Q.; Chen, L.J.; Bass, S. Global Forest Product Chains: Identifying Challenges and Opportunities for China through a Global Commodity Chain Sustainability Analysis. IISD Report 2009. Available online: https://www.iisd.org/publications/report/global-forest-product-chains-identifying-challenges-and-opportunities-china (accessed on 20 February 2022).
- Kaplinsky, R.; Terheggen, A.; Tijaja, J. China as a final market: The Gabon timber and Thai cassava value chains. World Dev. 2011, 39, 1177–1190. [Google Scholar] [CrossRef]
- Jiang, Y.H.; Chen, S.Z. Trade competitiveness of China’s forest products manufacturing analysis based on domestic value added. For. Econ. 2016, 7, 54–61. (In Chinese) [Google Scholar]
- Jiang, Y.H.; Chen, Y.; Zhang, X. Analysis on the Development and Change of China’s Forest Products Industry. For. Econ. 2018, 40, 44–49. (In Chinese) [Google Scholar]
- Su, H.Y.; Hou, F.M.; Yang, Y.X.; Han, Z.; Liu, C. An assessment of the international competitiveness of China’s forest products industry. For. Policy Econ. 2020, 119, 102256. [Google Scholar] [CrossRef]
- Xiong, L.C. Research on the Dynamic Mechanism and Path Choice of the Global Value Chain Rising of China’s Timber Industry. Ph.D. Thesis, Beijing Forestry University, Beijing, China, 13 June 2019. (In Chinese). [Google Scholar]
- Hou, F.M.; Wang, Y.P.; Wang, B.X. Influence of Global Value Chain Embedment and Industrial Agglomeration on Total Factor Productivity of Timber Industry in Ten Southern Provinces. J. Agr. Econ. Manag. 2023, 22, 507–515. (In Chinese) [Google Scholar]
- Antràs, P.; Chor, D.; Fally, T.; Hillberry, R. Measuring the upstreamness of production and trade Flows. Am. Econ. Rev. 2012, 102, 412–416. [Google Scholar] [CrossRef]
- Miller, R.E.; Temurshoev, U. Output upstreamness and Input downstreamness of industries/countries in world production. Int. Reg. Sci. Rev. 2017, 40, 443–475. [Google Scholar] [CrossRef]
- Timmer, M.P.; Los, B.; Stehrer, R.; de Vries, G.J. Fragmentation, incomes and jobs: An analysis of European competitiveness. Econ. Policy 2013, 28, 613–661. [Google Scholar] [CrossRef]
- Sturgeon, T.; Van Biesebroeck, J. Global value chains in the automotive industry: An enhanced role for developing countries? Int. J. Technol. Learn. Innov. Dev. 2011, 4, 181–205. [Google Scholar] [CrossRef]
- Xing, Y. How the iphone widens the U.S. trade deficit with China: The case of the iphone x. Front. Econ. China 2020, 15, 642–658. [Google Scholar]
- Xing, Y. Decoding China’s Export Miracle: A Global Value Chain Analysis; World Scientific: Singapore, 2021. [Google Scholar]
- Ye, M.; Meng, B.; Wei, S. Measuring Smile Curves in Global Value Chains; IDE Discussion Papers NO. 530; IDE: Chiba, Japan, 2015. [Google Scholar]
- Kaplinsky, R.; Readman, J. Globalization and upgrading: What can (and cannot) be learnt from international trade statistics in the wood furniture sector? Ind. Corp. Chang. 2005, 14, 679–703. [Google Scholar] [CrossRef]
- Jiang, B.; Dai, Y. A comparison of the international competitiveness of forest products in top exporting Countries using the deviation maximization method with increasing uncertainty in trading. Forests 2023, 14, 812. [Google Scholar] [CrossRef]
- Epede, M.; Wang, D. Competitiveness and upgrading in global value chains: A multiple-country analysis of the wooden furniture industry. For. Policy Econ. 2022, 140, 102737. [Google Scholar] [CrossRef]
- Han, X.; Wen, Y.; Kant, S. The global competitiveness of the Chinese wooden furniture industry. For. Policy Econ. 2009, 11, 561–569. [Google Scholar] [CrossRef]
- Xiong, L.; Zhao, H.; Wang, F.; Cheng, B. Genuine performance of China’s forest products trade: An evaluation from the perspective of global value chains. For. Policy Econ. 2022, 144, 102823. [Google Scholar] [CrossRef]
- Gereffi, G.; Luo, X. Risks and opportunities of participation in global value chains. J. Bank. Financ. Econ. 2005, 2, 51–63. [Google Scholar] [CrossRef]


| 0 ≤ RCA ≤ 1 | RCA > 1 | |
|---|---|---|
| Lafay > 0 | Minor specialization advantage | International competitive advantage |
| Lafay ≤ 0 | International competitive disadvantage | Minor comparative advantage |
| Wood Processing and Wood Products | Papermaking and Paper Products | |||||
|---|---|---|---|---|---|---|
| Year | Value-Added, bn USD | Domestic, bn USD | Foreign, bn USD | Value-Added, bn USD | Domestic, bn USD | Foreign, bn USD |
| 2012 | 44.032 | 30.211 | 13.821 | 77.461 | 58.952 | 18.509 |
| 2014 | 52.415 | 38.167 | 14.248 | 91.829 | 71.86 | 19.969 |
| 2016 | 48.266 | 36.690 | 11.576 | 94.775 | 77.308 | 17.467 |
| 2018 | 54.204 | 41.343 | 12.861 | 124.683 | 101.83 | 22.853 |
| Wood Processing and Wood Products | Papermaking and Paper Products | ||||
|---|---|---|---|---|---|
| Economy | Value-Added, bn USD | Foreign Demand, % | Economy | Value-Added, bn USD | Foreign Demand, % |
| China | 54.204 | 23.73% | China | 124.683 | 18.33% |
| USA | 41.784 | 11.90% | USA | 103.13 | 18.21% |
| Canada | 9.132 | 52.27% | Germany | 23.346 | 54.32% |
| Germany | 8.786 | 42.53% | Brazil | 12.987 | 38.40% |
| India | 7.39 | 38.45% | Italy | 12.853 | 40.04% |
| Indonesia | 5.119 | 31.97% | France | 11.486 | 43.76% |
| Russia | 4.441 | 55.25% | Canada | 11.163 | 56.43% |
| Poland | 3.926 | 60.01% | Indonesia | 9.408 | 42.87% |
| Austria | 3.424 | 60.75% | Sweden | 7.047 | 75.35% |
| Sweden | 3.184 | 51.78% | Finland | 5.42 | 77.96% |
| All Industry Average | Wood Products | Paper Products | ||||
|---|---|---|---|---|---|---|
| Year | Up | Down | Up | Down | Up | Down |
| 2012 | 2.64 | 2.61 | 3.29 | 3.05 | 3.73 | 3.09 |
| 2014 | 2.76 | 2.67 | 3.27 | 3.15 | 3.72 | 3.20 |
| 2016 | 2.73 | 2.62 | 3.24 | 3.09 | 3.59 | 3.18 |
| 2018 | 2.62 | 2.52 | 3.16 | 3.08 | 3.50 | 3.04 |
| Wood Products | Paper Products | ||||
|---|---|---|---|---|---|
| Economy | Up | Down | Economy | Up | Down |
| China | 3.16 | 3.08 | China | 3.50 | 3.04 |
| Poland | 2.83 | 2.57 | Indonesia | 3.19 | 2.39 |
| Russia | 2.74 | 2.34 | Finland | 2.96 | 2.60 |
| Sweden | 2.73 | 2.56 | Italy | 2.91 | 2.53 |
| Canada | 2.65 | 2.43 | Brazil | 2.90 | 2.31 |
| Austria | 2.62 | 2.55 | France | 2.85 | 2.35 |
| Germany | 2.55 | 2.50 | Germany | 2.77 | 2.40 |
| Indonesia | 2.51 | 2.28 | Sweden | 2.76 | 2.30 |
| USA | 2.50 | 2.37 | Canada | 2.72 | 2.35 |
| India | 2.35 | 2.16 | USA | 2.64 | 2.30 |
| Industry | Export Decomposition | 2012 | 2014 | 2016 | 2018 |
|---|---|---|---|---|---|
| Wood processing and wood products | Export value, bn USD | 12.635 | 10.756 | 9.216 | 12.260 |
| Domestic value-added, % | 85.09% | 85.10% | 86.86% | 84.56% | |
| Returned value-added, % | 1.22% | 1.63% | 1.48% | 1.59% | |
| Foreign value-added, % | 11.15% | 10.80% | 9.64% | 11.37% | |
| Double counting, % | 2.54% | 2.47% | 2.01% | 2.48% | |
| Papermaking and paper products | Export value, bn USD | 9.640 | 10.085 | 9.718 | 12.643 |
| Domestic value-added, % | 81.47% | 80.31% | 82.80% | 82.91% | |
| Returned value-added, % | 3.62% | 4.97% | 4.32% | 2.95% | |
| Foreign value-added, % | 10.86% | 10.61% | 9.46% | 10.66% | |
| Double counting, % | 4.05% | 4.11% | 3.41% | 3.49% |
| Economy | Export Value, bn USD | Domestic Value-Added, % | Returned Value-Added, % | Foreign Value-Added, % | Double Counting, % |
|---|---|---|---|---|---|
| China | 12.260 | 84.56% | 1.59% | 11.37% | 2.48% |
| Canada | 10.743 | 80.66% | 0.62% | 16.79% | 1.93% |
| Germany | 6.901 | 72.48% | 2.62% | 17.52% | 7.37% |
| USA | 6.547 | 80.02% | 6.56% | 10.17% | 3.24% |
| Russia | 5.957 | 86.50% | 0.45% | 10.24% | 2.81% |
| Austria | 4.858 | 68.08% | 0.53% | 22.74% | 8.65% |
| Poland | 4.065 | 72.76% | 0.50% | 19.65% | 7.09% |
| Indonesia | 3.930 | 86.74% | 0.22% | 10.83% | 2.22% |
| Sweden | 3.883 | 72.87% | 0.38% | 21.85% | 4.91% |
| India | 3.530 | 83.18% | 0.22% | 15.38% | 1.22% |
| Economy | Export Value, bn USD | Domestic Value-Added, % | Returned Value-Added, % | Foreign Value-Added, % | Double Counting, % |
|---|---|---|---|---|---|
| USA | 23.111 | 79.62% | 8.05% | 8.74% | 3.59% |
| Germany | 20.582 | 71.10% | 3.00% | 16.79% | 9.11% |
| Canada | 12.943 | 73.89% | 0.77% | 21.19% | 4.16% |
| China | 12.643 | 82.91% | 2.95% | 10.66% | 3.49% |
| Finland | 11.665 | 72.76% | 0.18% | 19.47% | 7.59% |
| Sweden | 11.349 | 74.50% | 0.47% | 17.23% | 7.80% |
| Brazil | 8.596 | 85.68% | 0.31% | 10.98% | 3.04% |
| Italy | 7.436 | 75.40% | 1.20% | 16.24% | 7.16% |
| France | 6.986 | 72.64% | 1.93% | 17.11% | 8.31% |
| Austria | 6.419 | 65.52% | 0.54% | 22.65% | 11.28% |
| Wood Processing and Wood Products | Papermaking and Paper Products | |||||
|---|---|---|---|---|---|---|
| Year | World Share, % | Balassa Index | Lafay Index | World Share, % | Balassa Index | Lafay Index |
| 2012 | 13.92% | 1.39 | 0.18 | 5.37% | 0.53 | −0.07 |
| 2014 | 11.18% | 0.99 | 0.03 | 5.38% | 0.48 | −0.19 |
| 2016 | 10.58% | 0.90 | −0.01 | 5.94% | 0.50 | −0.20 |
| 2018 | 11.50% | 0.97 | 0.00 | 6.72% | 0.57 | −0.22 |
| Wood Products | Paper Products | ||||||
|---|---|---|---|---|---|---|---|
| Economy | Market Share, % | Balassa | Lafay | Economy | Market Share, % | Balassa | Lafay |
| China | 11.50% | 0.97 | 0.00 | USA | 11.79% | 1.03 | 0.06 |
| Canada | 9.61% | 4.12 | 0.90 | Germany | 9.38% | 1.35 | 0.06 |
| USA | 5.81% | 0.51 | −0.25 | China | 6.72% | 0.57 | −0.22 |
| Russia | 5.71% | 2.03 | 0.40 | Canada | 6.13% | 2.62 | 0.66 |
| Germany | 5.55% | 0.80 | −0.06 | Finland | 5.44% | 12.88 | 5.52 |
| Indonesia | 3.78% | 3.35 | 0.83 | Sweden | 5.42% | 5.49 | 2.13 |
| Austria | 3.67% | 3.84 | 0.63 | Brazil | 4.72% | 3.32 | 1.35 |
| Poland | 3.28% | 2.70 | 0.42 | Italy | 3.59% | 1.22 | −0.01 |
| India | 3.26% | 1.26 | 0.21 | France | 3.25% | 0.90 | −0.10 |
| Sweden | 3.14% | 3.18 | 0.54 | Indonesia | 3.04% | 2.69 | 0.76 |
Disclaimer/Publisher’s Note: The statements, opinions and data contained in all publications are solely those of the individual author(s) and contributor(s) and not of MDPI and/or the editor(s). MDPI and/or the editor(s) disclaim responsibility for any injury to people or property resulting from any ideas, methods, instructions or products referred to in the content. |
© 2023 by the authors. Licensee MDPI, Basel, Switzerland. This article is an open access article distributed under the terms and conditions of the Creative Commons Attribution (CC BY) license (https://creativecommons.org/licenses/by/4.0/).
Share and Cite
Jiang, Y.; Su, H. The Status, Trend, and Global Position of China’s Forestry Industry: An Anatomy Based on the Global Value Chain Paradigm. Forests 2023, 14, 2040. https://doi.org/10.3390/f14102040
Jiang Y, Su H. The Status, Trend, and Global Position of China’s Forestry Industry: An Anatomy Based on the Global Value Chain Paradigm. Forests. 2023; 14(10):2040. https://doi.org/10.3390/f14102040
Chicago/Turabian StyleJiang, Yeheng, and Haiying Su. 2023. "The Status, Trend, and Global Position of China’s Forestry Industry: An Anatomy Based on the Global Value Chain Paradigm" Forests 14, no. 10: 2040. https://doi.org/10.3390/f14102040
APA StyleJiang, Y., & Su, H. (2023). The Status, Trend, and Global Position of China’s Forestry Industry: An Anatomy Based on the Global Value Chain Paradigm. Forests, 14(10), 2040. https://doi.org/10.3390/f14102040