Abstract
Acacia mearnsii, an invasive alien species, is the main resource identified for the energy transition initiated on Reunion Island. It is, therefore, critical to identify the existent forest stands within the island’s large tropical forest area and to determine which of these stands are accessible for logging operations. In this study, a very high-spatial-resolution image was used to map forest (Acacia mearnsii, Acacia heterophylla, Cryptomeria japonica) and non-forest land cover. To identify the accessible forest stands, we developed a geographic information system (GIS) processing chain, accounting for barriers, the distribution of slopes, and the location of forest roads. User-defined parameters, such as the slope threshold and maximal distance to forest roads, allow different scenarios to be explored. The classification yields an overall accuracy of 88% and a Kappa index of 0.86 and highlights the areas occupied by the different types of Acacia. By applying the GIS processing chain for a standard scenario, the results show that only 19% of the initial study area of 637 ha of Acacia mearnsii patches is suitable for exploitation. In conclusion, our results demonstrate how remote sensing (RS) and GIS can be combined to provide valuable tools for forest managers to design management plans for invasive alien forest species.
1. Introduction
There is a growing demand for wood resources [1], which are used to meet both household and industrial needs. The harvesting of wood impacts forest landscapes while also affecting habitats and biodiversity. For invasive alien forest species, exploitation is one form of management that is a means to preserve forest habitats while valorizing a fast-growing resource for energy uses, such as firewood, wood chips, or charcoal [2,3]. However, this involves identifying whether the resource meets the biophysical and geographical criteria for exploitation.
On Reunion Island (2512 km2), a French volcanic overseas department located in the Indian Ocean (Figure 1A), forest and woodland areas cover 48% of the entire altitudinal gradient of the territory, from the coast to the high mountains [4]. The wide gradients of temperature and rainfall lead to very diverse ecosystems, ranging from tropical lowland forest to subalpine vegetation [5]. Native and exotic forests are mainly located in Reunion National Park, which covers 42% of the area of the island. Outside the National Park’s limits, some endemic and exotic species are developing. Particular attention has been paid to Acacia mearnsii for several years, which is at the center of different forest management issues [6]. Acacia mearnsii (black wattle), native to Australia, was introduced several decades ago to the mid-altitude regions (600–1700 m) of Reunion Island. It is a Fabaceae, characterized by a nitrogen-retaining root system, rapid growth dynamics, and interesting firewood properties, promoting its spread [6,7]. Classified as an invasive alien species (IAS) [8], the black wattle establishes itself in a dominant way following fires or clearings, and it is practically impossible to eliminate, competing with other indigenous forest species. Since its introduction, Acacia mearnsii has spread over large areas of Reunion Island, not only across agricultural land but also in managed forests [4,9]. It, therefore, represents a potential risk for protected areas if an adapted control or forestry management strategy is not applied. While control measures are necessary along the borders of the protected areas to avoid further dissemination, several future forest management plans expect to manage and exploit Acacia mearnsii in other areas. The National Forestry Office has identified Acacia mearnsii, in addition to other forest resources, such as Cryptomeria japonica, as a key resource to supply a future wood energy sector, which is of major importance regarding the island’s energy transition planned by the Reunion Island regulatory authorities [10,11]. However, to guide decisions on sustainable supply chain strategies, methods have to be developed to assess the resource potential, specifically its spatial distribution and accessibility for wood energy-compliant harvesting, taking into consideration specific local topographic constraints [12,13,14].
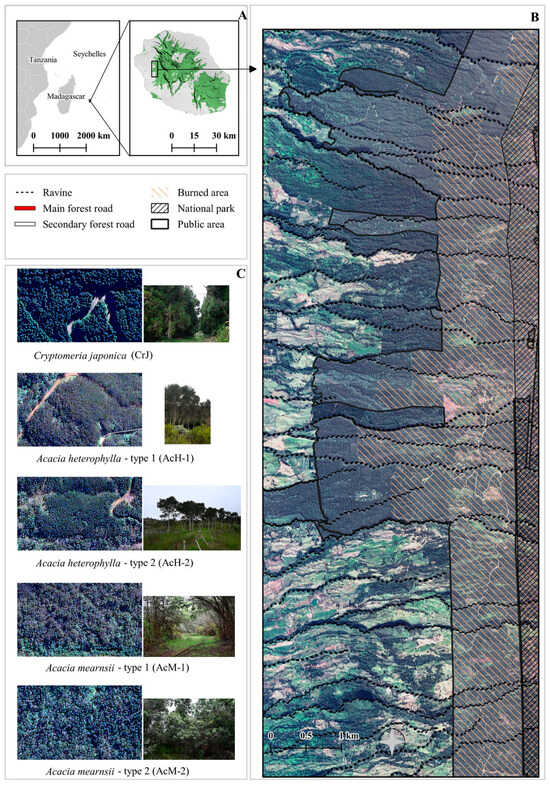
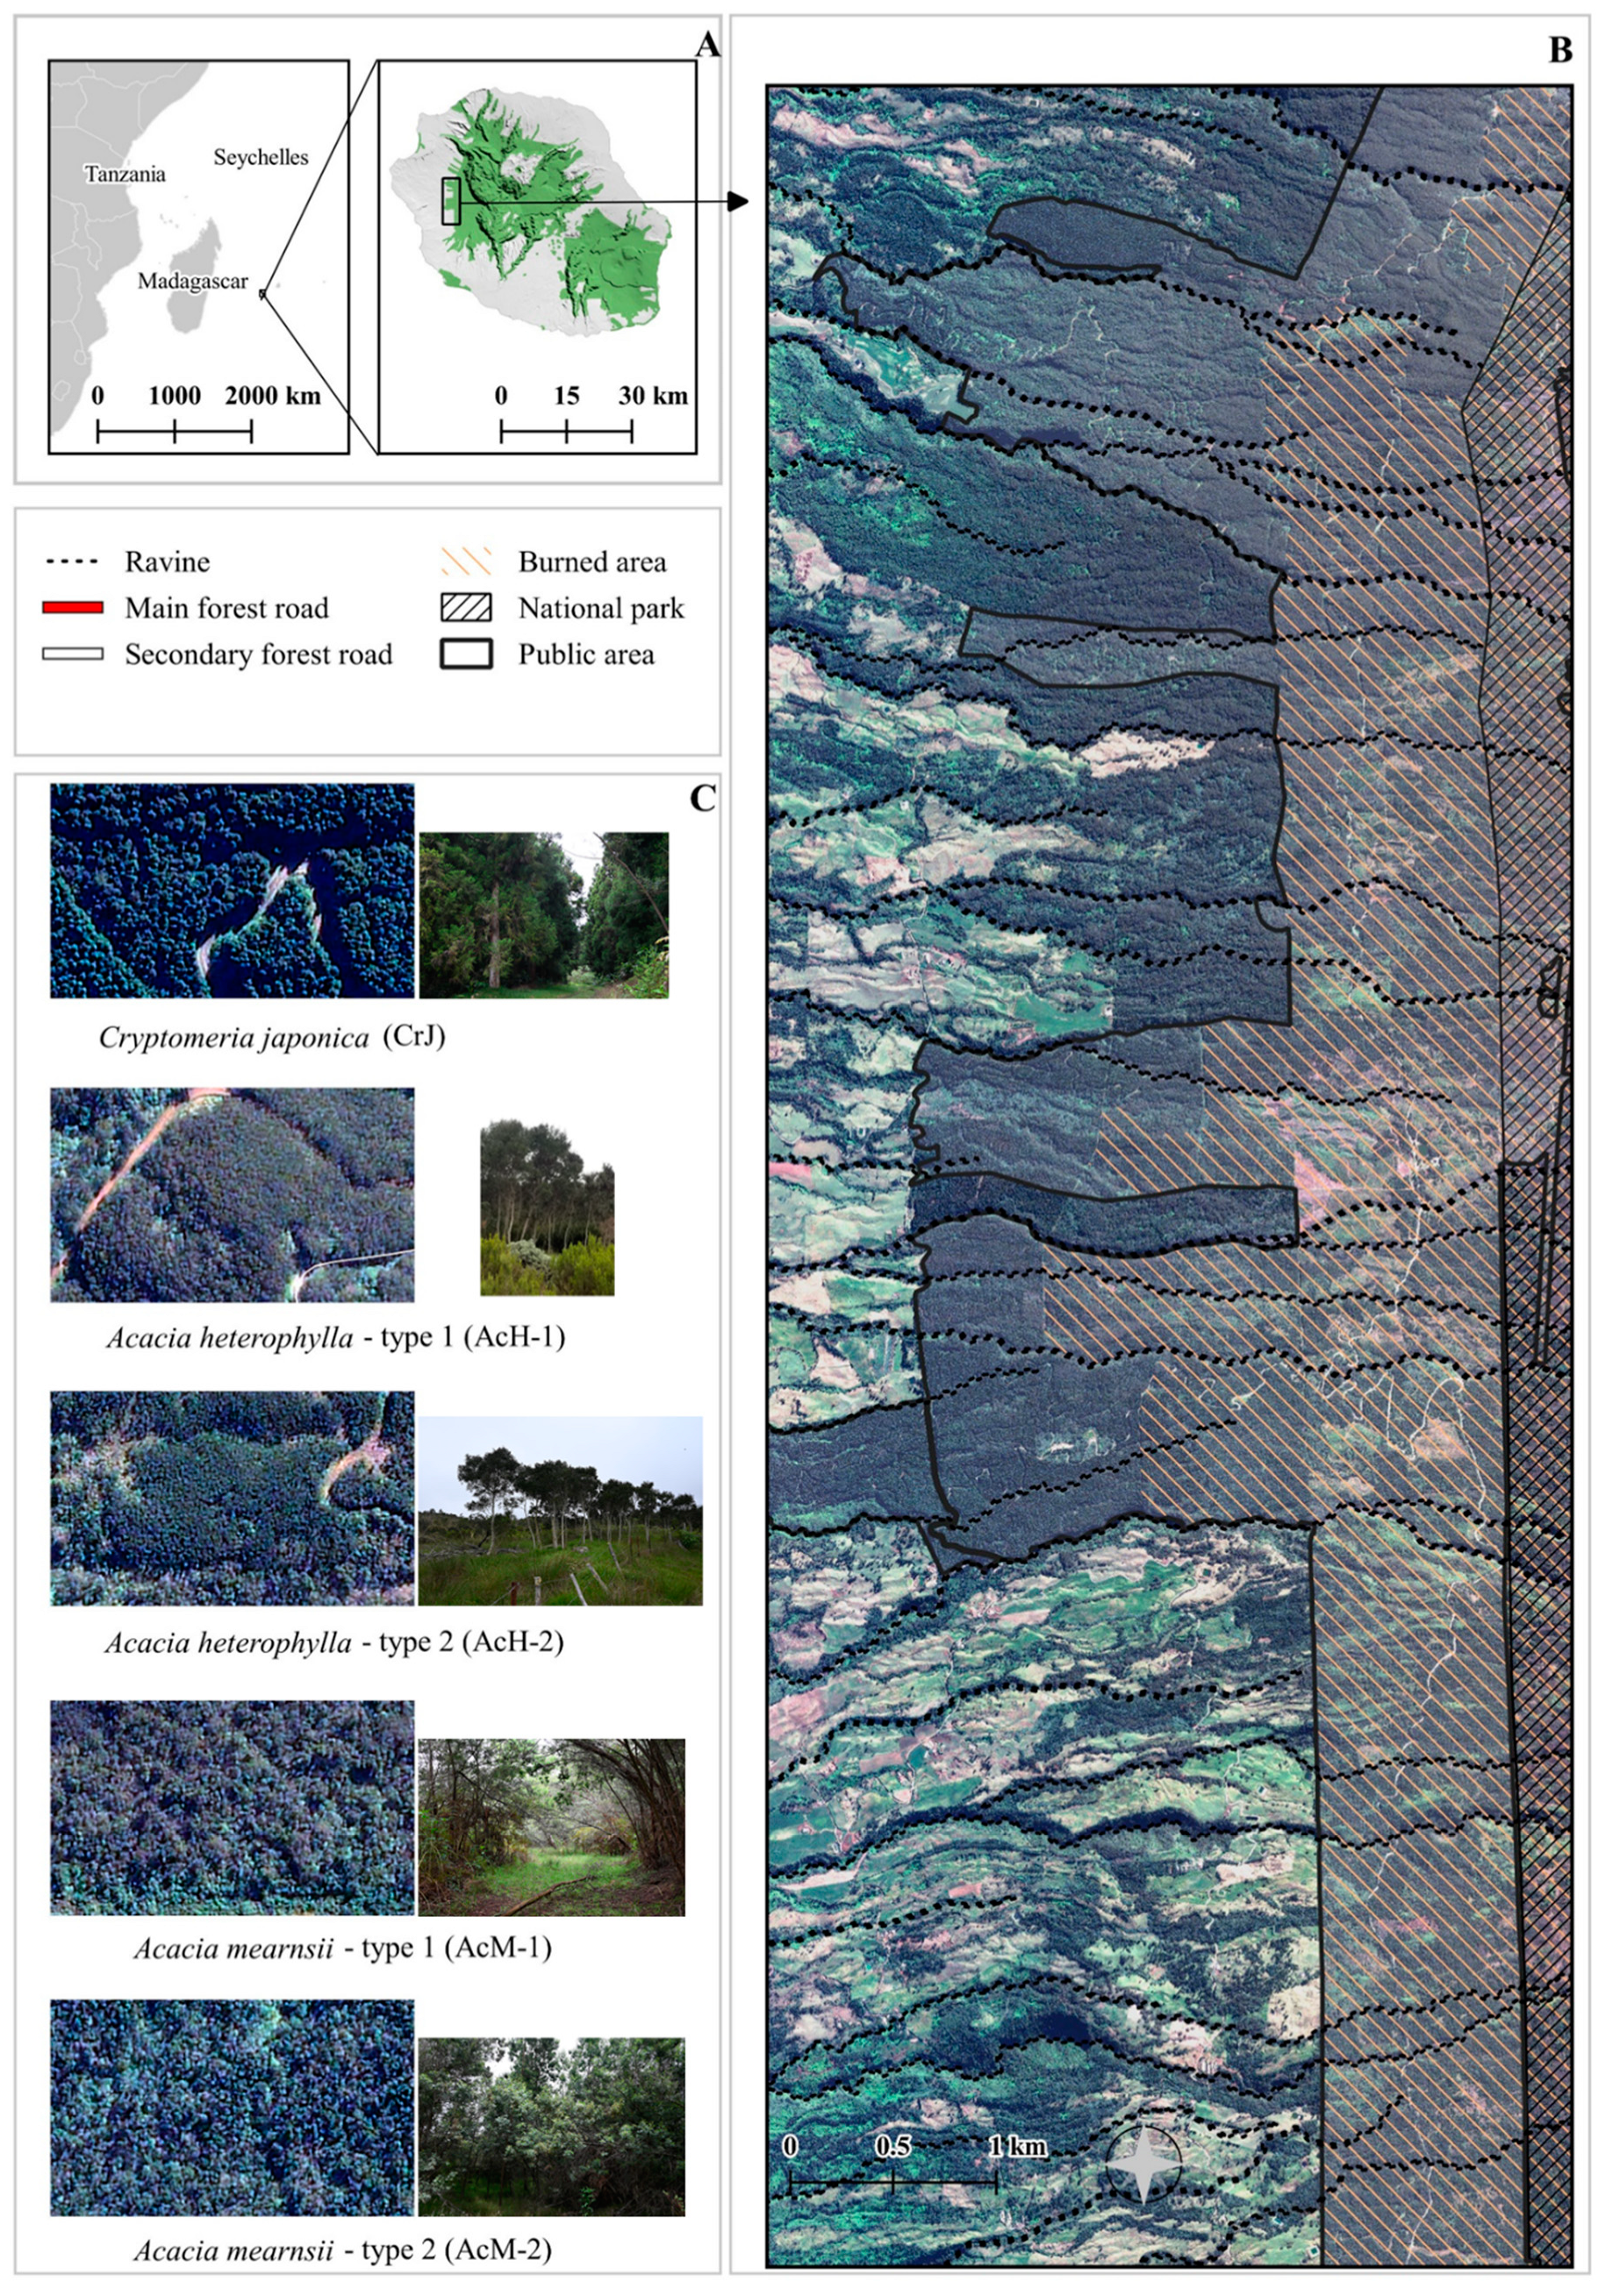
Figure 1.
Location of Reunion Island (A) and the study area (B), with examples of the three main forest stands in the study area (C). Map background: Pleiades image acquired in May 2020. Pictures of the main forest stands were taken in October 2020 and February 2021.
Remote sensing (RS) offers a wide range of relevant techniques for locating and characterizing forest stands [15,16]. Airborne light detection and ranging techniques can be used to estimate forestry characteristics, such as the tree crown or diameter at breast height [17]. When applied to IAS, RS- and GIS-based spatial analysis techniques can be used to map and monitor species distribution [6], determine invasion factors [4,18], and assess abundance or diversity [19]. Several studies have stressed the importance of RS image characteristics, such as the spatial resolution and acquisition date, for the accuracy of the mapping process [19,20]. In order to locate forest stands, multispectral satellite images can be used, which enable large areas to be covered at low cost, and the resulting maps can be updated easily due to frequent image acquisition [19,21,22]. Regarding the invasive species Acacia mearnsii, different studies have shown that supervised classification techniques applied to multispectral images give satisfactory results with regard to discriminating Acacia mearnsii from other forest stands [17,18,19,20,23]. For instance, overall accuracy greater than 85% was obtained using a classification model based on a single multispectral Landsat 8 image [23,24]. Similar results were obtained using multitemporal analysis or a combination of optical data with lidar or radar data, with overall accuracies between 70 and 85% [25,26,27]. In a previous study, we used the pixel-based classification of a very high-spatial-resolution Pleiades image to detect Acacia mearnsii forest stands on Reunion Island [28]. The developed methodology, combining the original spectral bands with vegetation and textural indices, highlighted the potential of very high spatial imagery to distinguish Acacia mearnsii from other land cover types. However, confusion among classes with similar spectral signatures (e.g., between Acacia mearnsii stands and Acacia heterophylla, both belonging to the Fabaceae family) remained in the resulting map, which also showed a lot of noise (“salt and pepper effect”) due to the spatial resolution of the image [29]. The object-based supervised classification approach has been proven effective in overcoming this effect [30]. By assigning a class to groups of pixels that share common spectral and spatial characteristics, the object-oriented approach allows for assigning a unique spectral value to each object [31], which leads to taking advantage of an image with fine spatial resolution and improving the discrimination of forest stands developing in heterogeneous environments or characterized by high species diversity.
Geographic information systems (GIS) are useful tools to address forestry issues. By providing an infrastructure for visualizing, managing, and combining spatial data, they are used to locate and evaluate available biomass, assess their accessibility, and determine the spatial organization of different harvesting sites [32]. To assess the accessibility of harvesting areas, models have been developed or interoperated with GIS to consider user choices and parameters essential for their identification. The slope and distance to the nearest road are the two main criteria used to assess suitable areas for exploitation [1]. Some methods have been made available as operational tools, such as the Free and Open Source Software for Geospatial applications (FOSS4G) framework, developed to assess biomass availability (https://sourceforge.net/projects/biomasfor/, accessed on 31 October 2021) [1], and Sylvaccess [33]. It should be noted that most of these applications were developed for temperate forests and their corresponding harvesting techniques. Moreover, even though the impact of data quality, particularly the spatial resolution, on the final result is recognized [33], few studies have used very high-spatial-resolution data as model inputs.
This paper aims to develop a methodology for mapping alien invasive forest species and assessing suitable areas for exploitation for wood energy use in tropical contexts. The originality of the approach consists of the combination of remote sensing and GIS spatial techniques, which have often been used individually or with only limited functionalities (visualization) but have rarely been combined to answer forest stand management and exploitation questions. As a case study, the methodology was applied to Acacia mearnsii, which is seen as a potential source of wood energy on Reunion Island. First, an object-based supervised classification was applied to very high-spatial-resolution satellite imagery to map different types of forest stands. Second, a GIS spatial tool was developed to investigate which forest stands would be suitable for exploitation, using the topographic and accessibility characteristics as the selection criteria.
2. Materials and Methods
2.1. Study Area
The study area (Figure 1B) lies in the forests of the Western Highland Region of Reunion Island, where the main Acacia mearnsii stands are reported. In this region, the elevation ranges from 640 to 2900 m above sea level, and the average annual precipitation ranges from 700 to 1600 mm. The rugged terrain is crisscrossed by steep ravines (120% inclination) and slopes, with an average gradient of 20% [4]. The road network consists of almost 300 km of roads.
Our study area (Figure 1B) is divided into public and privately owned areas, with protected areas included in the public area. It is covered by three main forest stands—endemic Acacia heterophylla, planted stands of exotic Cryptomeria japonica (managed for timber), and Acacia mearnsii (Figure 1C). Since the 1970s, large parts of these areas have been regularly affected by fires. The most recent fires (2010–2011) severely affected the Acacia heterophylla forest and some stands of Cryptomeria japonica. Reforestation campaigns have been tested on several plots, with varying results. However, the fires have mostly benefited Acacia mearnsii expansion over the entire area due to the pyrophilous properties of this species, despite complex control measures along the forest borders. In this paper, special attention is, therefore, paid to this burned area (mentioned below as the “test area”), where various stands of Acacia mearnsii are present.
2.2. Data
2.2.1. Remote Sensing Data
A cloudless, very high-spatial-resolution Pleiades image covering our study area was acquired on 31 May 2020 (Figure 1B). It is composed of a panchromatic image acquired at a spatial resolution of 0.70 m, bundled with a multispectral image acquired at a spatial resolution of 2.70 m in four spectral bands: blue (430–550 nm), green (500–620 nm), red (590–710 nm), and near-infrared (740–940 nm). The image was obtained from the CNES Kalideos spatial database (https://www.kalideos.fr, accessed on 31 October 2021), after radiometric, atmospheric, and geometric corrections.
2.2.2. Land Cover Reference Dataset
Three surveys were conducted between October 2020 and February 2021 with the assistance of the French National Forestry Office [10]. During these campaigns, a global navigation satellite system (GNSS) receiver was used to locate several plots of the main forest stands with the following procedure: we recorded the geographic coordinates (GNSS point) at the center of a 5 m radius circle of a homogeneous plot. Each GNSS point was associated with a numerical identifier, which we used to record the stand characteristics, i.e., the species name, maturity, physical characteristics, and location.
The main forest stands were Cryptomeria japonica (CrJ), Acacia heterophylla (AcH), and Acacia mearnsii (AcM) (Figure 1C). For the latter two stands, we observed biophysical differences, globally related to the crown cover, tree height, and trunk inclination. For the Acacia heterophylla, we distinguished mature stands, either managed or natural forest, characterized by a high stand density (AcH-1), and recent plantations, characterized by a low stand density (AcH-2). For the Acacia mearnsii, we distinguished older stands, characterized by entangled trunks that render it difficult to access and progress through the forest stand, and thus, to harvest (AcM-1), and stands characterized by their rather straight trunks and easier harvesting potential (AcM-2).
We then collected the other main land cover samples (shrub and herbaceous areas, bare soils, roads and impervious surfaces, shaded areas) using photointerpretation of the Pleiades image. In total, our land cover dataset, therefore, consisted of nine classes (Table 1 and Table S1).

Table 1.
Land cover categories retained for the classification of the Pleiades image.
2.2.3. GIS Dataset
To define obstacles to exploitation, we acquired a hydrographic network dataset. Produced by the National Institute of Geographic and Forest Information, this dataset is a vector layer that inventories ravines with permanent or temporary water flow (the ravines are represented in Figure 1B) and provides information on their potential width (https://geoservices.ign.fr/eau, accessed on 31 October 2021). The protected conservation area was also identified as an element that renders exploitation impossible. We, therefore, acquired the delineation of the National Park coverage available on OpenStreetMap, which takes the form of a vector layer (Figure 1B).
To assess areas suitable for exploitation, we based our analysis on slopes. We acquired a 1 m spatial-resolution digital elevation model (DEM, https://geoservices.ign.fr/rgealti, accessed on 31 October 2021) produced by the French National Geographic Institute (IGN). This DEM, which represents the terrain created from elevation data, was used to compute the slope information. The output was a 1 m spatial-resolution raster layer, where each cell represented the slope inclination, i.e., the rate of elevation change.
Finally, we assessed the accessibility of suitable areas using the road network. Taking the form of a vector layer, this dataset, updated by the National Forestry Office [10], regroups a large forest road network extending over the Western Highland Region. This dataset inventories two types of forest roads (Figure 1B). There is the main road, which is a concrete road open to private traffic and, therefore, unsuitable for forestry use or the frequent passage of forestry machines. Then there is the secondary forest road network, which is connected to the main road, but unpaved and more suitable for forestry and logging access. Therefore, a filter was applied to the dataset in order to consider only the secondary roads as possible access to the forest areas suitable for exploitation.
2.3. Mapping Forest Land Cover
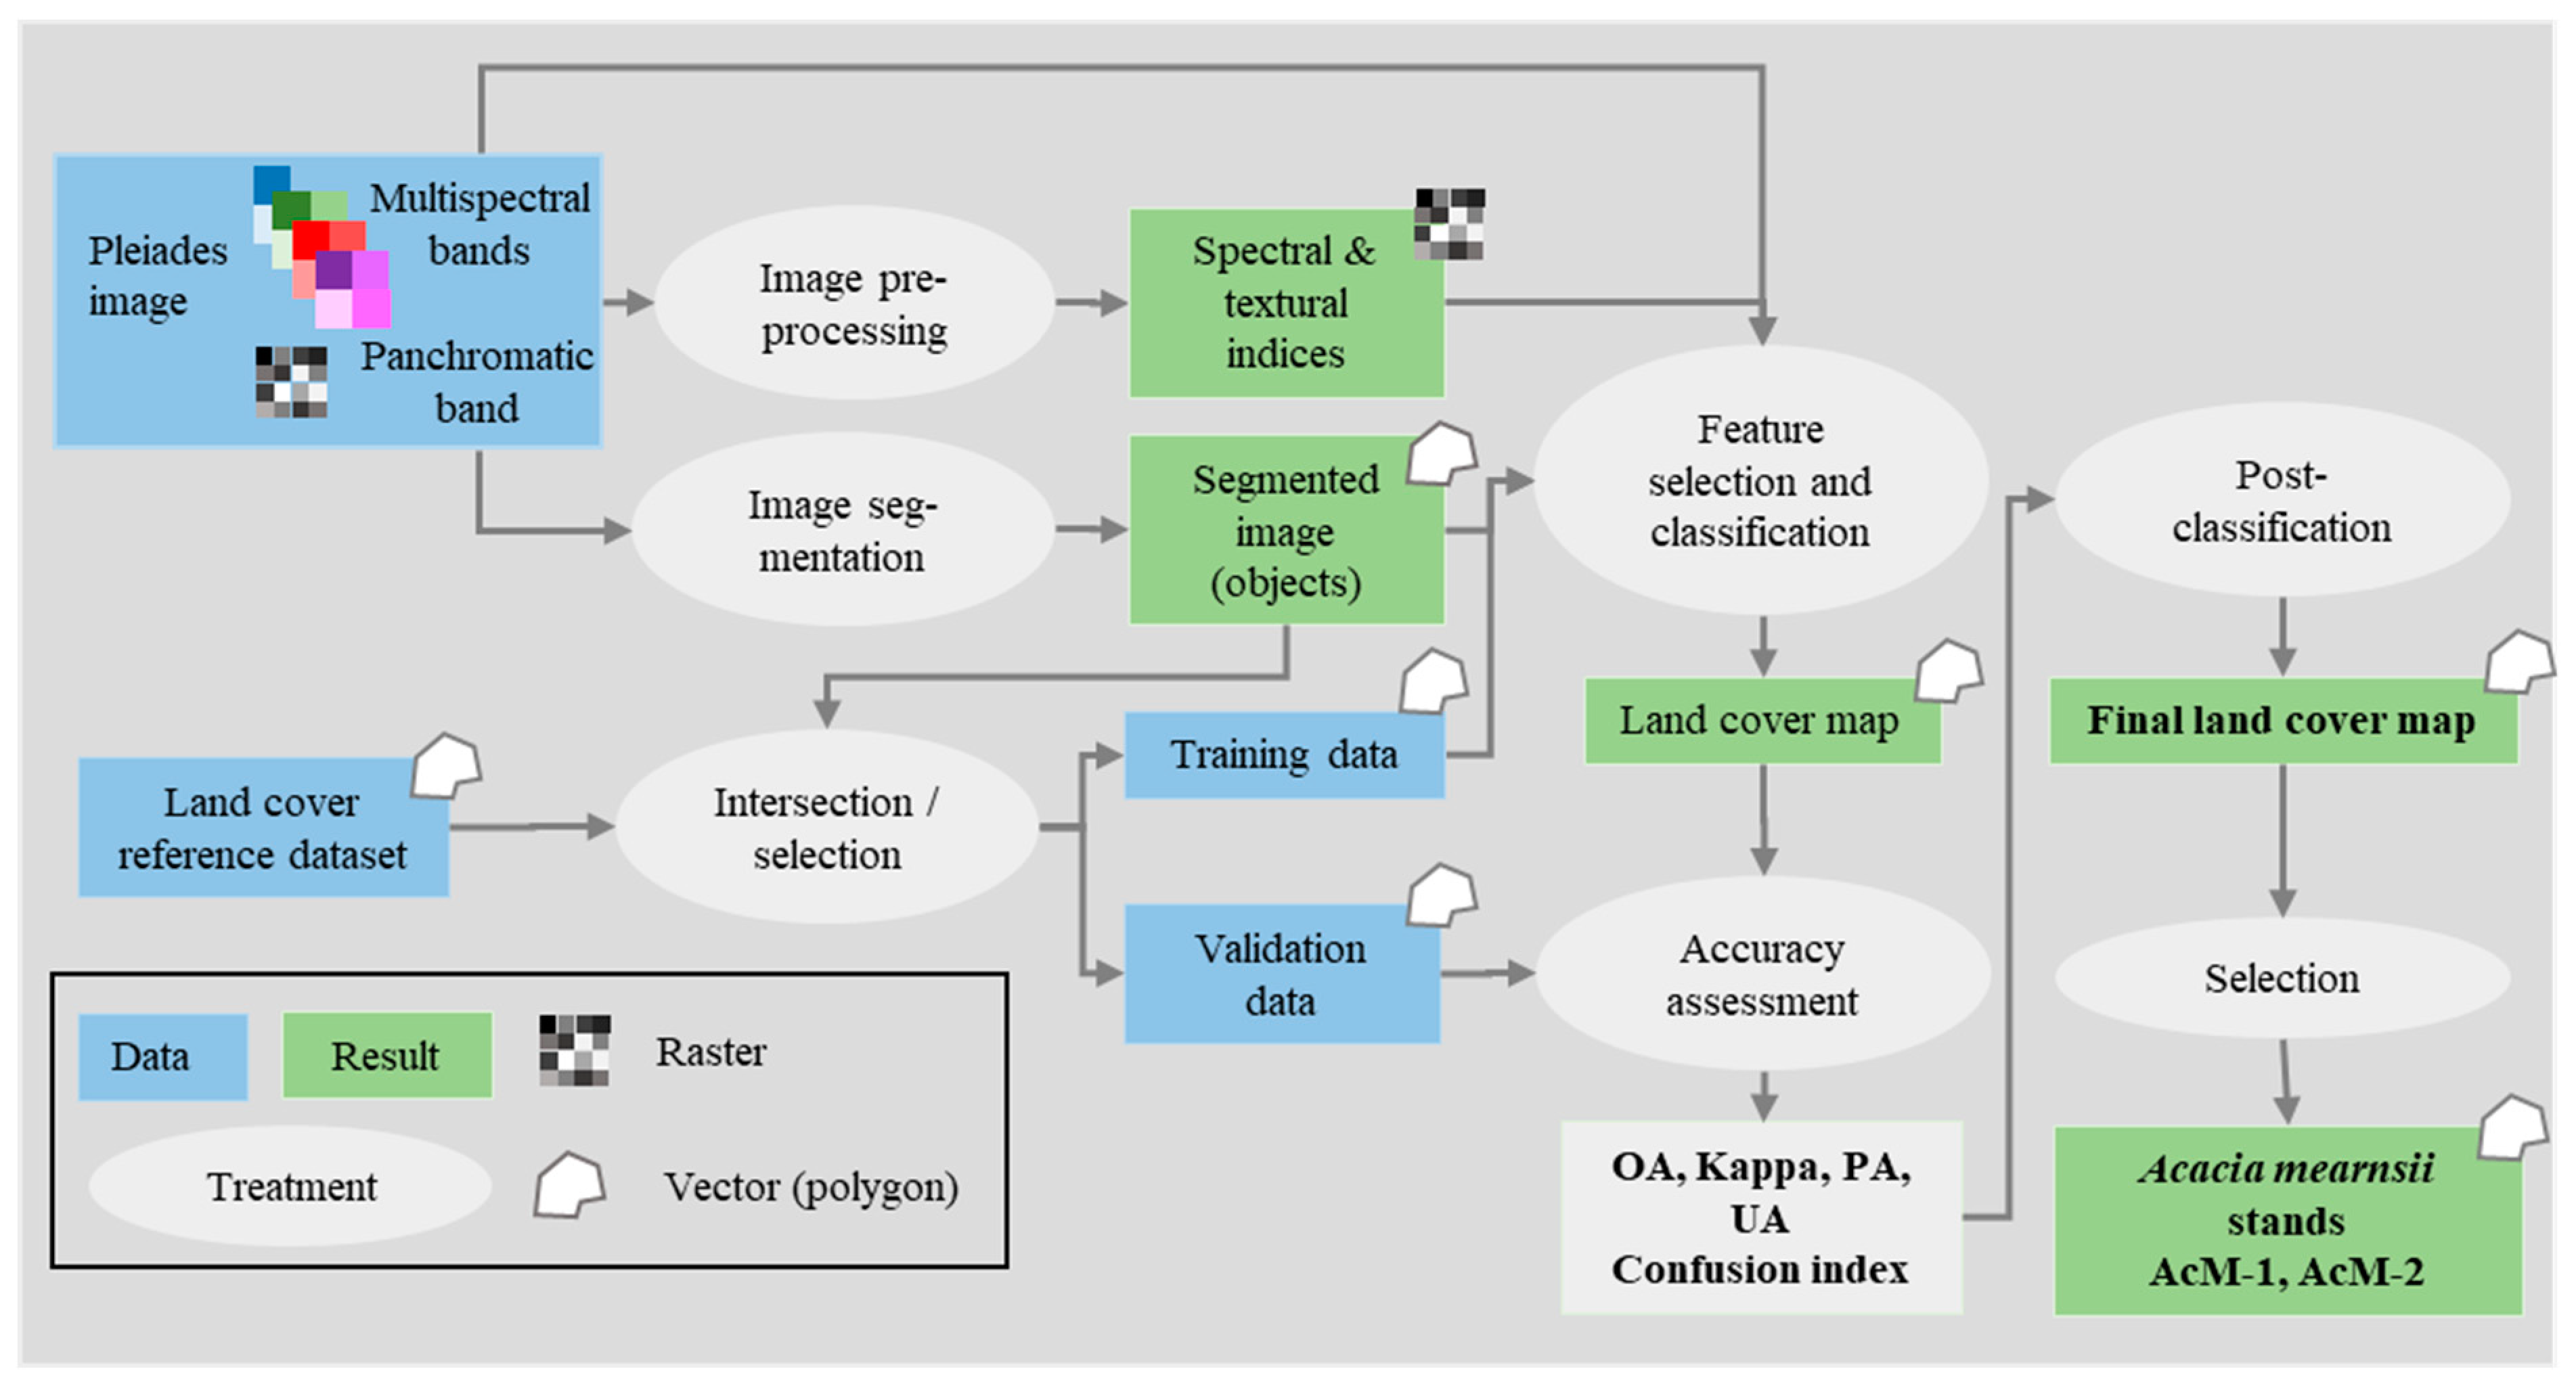
In this section, we describe the methodology developed for mapping forest land cover in our study area (Figure 2). OrfeoToolBox (OTB) tools were used for image pre-processing and segmentation (OrfeoToolbox version 6.6.1, CNES, https://www.orfeo-toolbox.org (accessed on 15 November 2021)), R packages for the classification process (https://cran.r-project.org, accessed on 15 November 2021), and QGIS for the preparation of the training and validation datasets and post-classification treatments (QGIS version 3.16, https://qgis.org, accessed on 15 November 2021).

Figure 2.
Workflow diagram for mapping forest land cover from the Pleiades image. Final results, in bold, are presented in Section 3.1.
2.3.1. Image Pre-Processing
The multispectral image was merged with the panchromatic image from the “Pansharpening” OTB algorithm to derive a multispectral pansharpened image at a resolution of 0.70 m. The radiometric indices were then computed from the Pleiades spectral bands to increase the discrimination of forest land cover using the “RadiometricIndices” OTB algorithm (Table 2).
Table 2.
Radiometric indices computed with OTB (NIR: near-infrared, R: red; G: green).
In addition to these radiometric indices, we computed eight textural indices from the panchromatic band [39] using the “HaralickTextureExtraction” OTB algorithm on a sliding window of 51 × 51 pixels. This window size was identified as optimal for classifying forest cover in our study, according to [28].
2.3.2. Image Segmentation
The pansharpened Pleiades image was then segmented into objects using the “GenericRegionMerging” OTB algorithm with the Baatz and Shape criterion [40,41]. The segmentation parameters included (i) the threshold, which defines the segmentation scale; (ii) the weight of spatial homogeneity; and (iii) the weight of spectral homogeneity. We tested a series of parameter values on a small test area (~1/4 of the study area). A scale parameter of 50, spatial homogeneity of 0.9, and spectral homogeneity of 0.2 were finally retained, and the corresponding segmentation was applied to the entire study area, resulting in 704,005 objects, with a mean size of 61.249 m2 (Table S1).
2.3.3. Feature Selection and Classification
For each delineated object obtained after image segmentation, the average and variance values of the multispectral bands (n = 4) and the spectral (n = 5) and textural (n = 8) indices were computed. The number of classification variables was, thus, increased to 34. We intersected the initial dataset with the classification variables. The resulting dataset was composed of 3281 objects, corresponding to 410,420 pixels. We then made a random selection, allocating 70% of the objects to training and 30% to validation.
We developed the classification model based on a random forest [42] classifier with repeated k-fold cross-validation (k-folds = 10 and r = 5), and the recursive feature elimination (RFE) function on the reference dataset using the “caret” package (https://github.com/topepo/caret, accessed on 15 November 2021). Random forest is an algorithm that aims to predict the membership of objects to a class [42,43]. In principle, it first constructs several decision trees from randomly selected subsets of the training data and randomly selected subsets of the classification variables. Then, it proceeds to build the training model, which is based on the majority voting method. Applied to classification, this method consists of defining the class of an object on the basis of the number of times that object has been associated with a class in the set of decision trees constructed by the algorithm. Therefore, the RF algorithm computes rules based on variable values and assigns a class to each object. Then, the RFE function ranks the variables by order of importance. We considered the Kappa index, which assesses the concordance rate between the predicted and actual classes of the reference objects, considering the possibility of agreement occurring by chance, as an indicator of the best-performing classification model. The latter was chosen for the object prediction of the segmentation (n = 704,005). A membership probability to a class was also computed for each object, and the highest probability was retained to assign a class membership to an object.
2.3.4. Accuracy Assessment
To assess the performance of the object-based classification, a confusion matrix was computed using the validation dataset. This matrix expresses the number of sample units (i.e., objects) assigned to a particular class relative to the actual class verified on the ground [44]. In order to compare the accuracy indices to those of the pixel-based classification, we converted the confusion matrix units into pixels. Then, we derived several indicators from the confusion matrix. The overall accuracy (OA), defined as the ratio of the number of correctly classified pixels (i.e., the sum of the major diagonal) to the total number of pixels in the confusion matrix, and the Kappa index were computed as global accuracy indicators. In addition, the producer accuracy (PA) and the user accuracy (UA) were computed for each class. The PA corresponds to the number of correctly classified samples of a given class divided by the total number of reference samples for that class. The UA was calculated as the number of correctly classified samples of a given class divided by the total number of samples assigned to that class by the classifier.
2.3.5. Post-Classification
The post-classification treatments consisted of (i) merging the “bare soil” and “road” categories into a single “soil” class, and (ii) possibly reclassifying the objects that had a low probability of being a member of the class to which they were assigned. To conduct the latter operation, for each object j, we first identified the highest class membership ( and ) and then calculated the value of the confusion index (CI), as defined in Equation (1) [45]:
Ranging from 0 to 1, the CI values express the minimal to maximal uncertainty related to the classification. The objects with high CI values (CI > 0.9) were reclassified first according to the majority class of the neighboring objects for the entire study area. A secondary reclassification was carried out based on the field knowledge of the public area: (i) in the test (burned) area presented in Section 2.1, “Acacia heterophylla” was reclassified as “Acacia mearnsii”; (ii) in the rest (unburned) of the public area, “Acacia mearnsii” objects were reclassified as “other forest” (presence of other wood species but no Acacia mearnsii).
2.4. Assessment of Accessible Forest Stands
In this section, we describe the methodology developed to assess the accessibility of areas suitable for exploitation, considering topography and distance as the main criteria of our analysis [1]. Our method is based on a processing chain composed of three modules (Figure 3), which may be replicable with other GIS software or freeware. The first module consists of excluding obstacles (natural barriers, restricted areas, steepest slopes) and classifying the remaining areas according to their slope in order to locate the areas suitable for exploitation. The second module measures the accessibility of these areas, considering their connectivity to the road network. Finally, in the third module, information on the slope and distance to roads is combined with the information on the forest species of interest (in our case, Acacia mearnsii AcM-1 and AcM-2) to map the accessible forest stands.
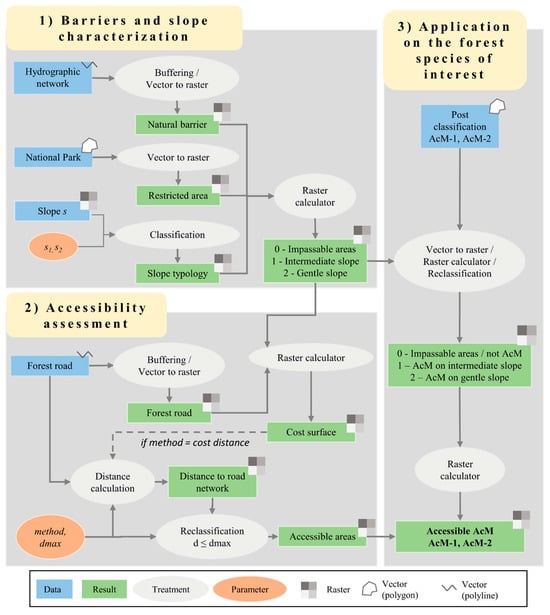
Figure 3.
Workflow diagram for assessing the accessibility of forest stands. Step 1: Obstacles (including natural barriers, restricted areas) and slopes were the main criteria for the identification of areas suitable for exploitation. Step 2: The accessibility was assessed from the calculation of the distance to the nearest road, with different computation methods (Euclidean or cost distance). Step 3: Mapping of accessible forest stands.
2.4.1. Barriers and Slope Characterization
To identify areas suitable for exploitation (Figure 3(1)), we first defined the obstacles. Protected areas (areas located within the National Park) and natural barriers (ravines, delineated as a buffer zone with a radius of 3.5 m around the hydrographic network) were considered as areas unsuitable for exploitation (“impassable areas”). Secondly, we considered the slope gradient as the main determinant of the suitability of an area, accounting for the types (mechanizable or non-mechanizable) of felling techniques. The requirements for these two felling types differ in effect: mechanizable felling can only take place in areas with low slope values (gentle slopes), whereas non-mechanizable felling is possible in areas with higher slope values. Therefore, a slope threshold was defined for each felling type, and the areas were classified into three categories according to their maximum slope s:
- Impassable areas correspond to areas with the highest slope values (s ≥ s1), where no felling is possible, protected areas, or natural barriers;
- “Gentle slope” areas are defined as the areas with the lowest slope values (s ≤ s2), where mechanized felling and skidding are possible;
- “Intermediate slope” areas are defined as areas with intermediate slope values (s2 < s < s1); in these areas, only non-mechanizable felling techniques can be considered.
2.4.2. Accessibility Assessment
The distance from a non-metaled road was considered the main determinant of accessibility (Figure 3(2)). Two different methods were tested: the calculation of the Euclidean distance (“as the crow flies” distance) and a cost analysis method. In the latter method, the distance to the road was calculated by considering the costs associated with crossing spatial features. We considered that the “gentle slope” areas (as defined in the previous sub-section) and areas located within a buffer (the size of which can be parametrized—in our case, 5 m) around the road network can be easily moved across (cost = 1), whereas all other areas act as “barriers” for harvesting equipment (cost = 1000). For both methods, we implemented a dmax modulable parameter, allowing for the consideration of the distance traveled by forestry machines between the road and the felling area.
2.4.3. Application to Acacia mearnsii Forest Stands
The accessibility of forest stands was assessed by combining information on the slope and distance to roads with the information on the location of the forest stands, in our case Acacia mearnsii AcM-1 and AcM-2 (Figure 3(3)).
In our case study, we applied this module in the test area. We used the data from the post-classification, extracting AcM-1 and AcM-2 objects. We ran a standard scenario, with s1 = 50%, s2 = 25% (maximum slope for mechanized felling and skidder according to forest expertise), and dmax = 1000 m (empirically set in order to assess the maximum accessible surfaces). Then, we ran different scenarios with different values of the slope threshold (s2) and distance threshold (dmax) to assess the impact of these two parameters on the accessible surface areas of Acacia mearnsii stands.
3. Results
3.1. Map of Forest Land Cover
The following subsections present our classification and post-classification results, allowing the forest land cover to be mapped.
3.1.1. Importance of Spectral and Textural Information to Map Forest Stands
The results of the RF classifier and the RFE analysis show that the combined use of spectral and textural indices provided the classification with the best performance (Figures S1 and S2). The top five features include the mean variables of two vegetation indices (RV, RVI), the red reflectance band, and two textural indices (contrast and inverse difference moment).
3.1.2. Accuracy Assessment
The confusion matrix expressing object assessment is given in Table S3. Here, we present the results obtained with the confusion matrix, expressing the conversion of the objects to pixels, in order to compare the accuracy of our model to a previous one [28], based on a pixel-based approach (Table 3). The overall accuracy and the Cohen Kappa index were respectively 88% and 0.86, indicating very good agreement between the predicted and observed land cover classes. In detail, the PA values ranged between 0.71 and 1, and the UA values ranged between 0.40 and 1 (Table 3). Both accuracy indicators for the non-forest classes (road and bare soil, shade), herbaceous areas (Herb), and the Cryptomeria japonica (CrJ) stands were greater than 0.90, indicating that the classifier had an excellent discrimination ability and was reliable for these classes. According to the confusion matrix (Table 3), the classifier was slightly less performant for the Acacia mearnsii and Acacia heterophylla stands, with PA values between 0.71 and 0.87. The reliability of the classifier was high (UA > 0.8) for the AcH-1 and AcM-2 stands but less reliable for the AcH-2 (UA = 0.73) and AcM-1 (UA = 0.40) classes, likely due to the small number of samples.
Table 3.
Confusion matrix computed from the random forest classifier, expressed in pixel units.
The global indicators show only a slightly higher performance of the object-based classification compared to the pixel-based classification (Table S2). However, regarding the UA and PA indices for the forest classes, the object-based classification performed better, specifically for the AcM and AcH classes (Table 3).
3.1.3. Spatial Distribution of Forest Stands
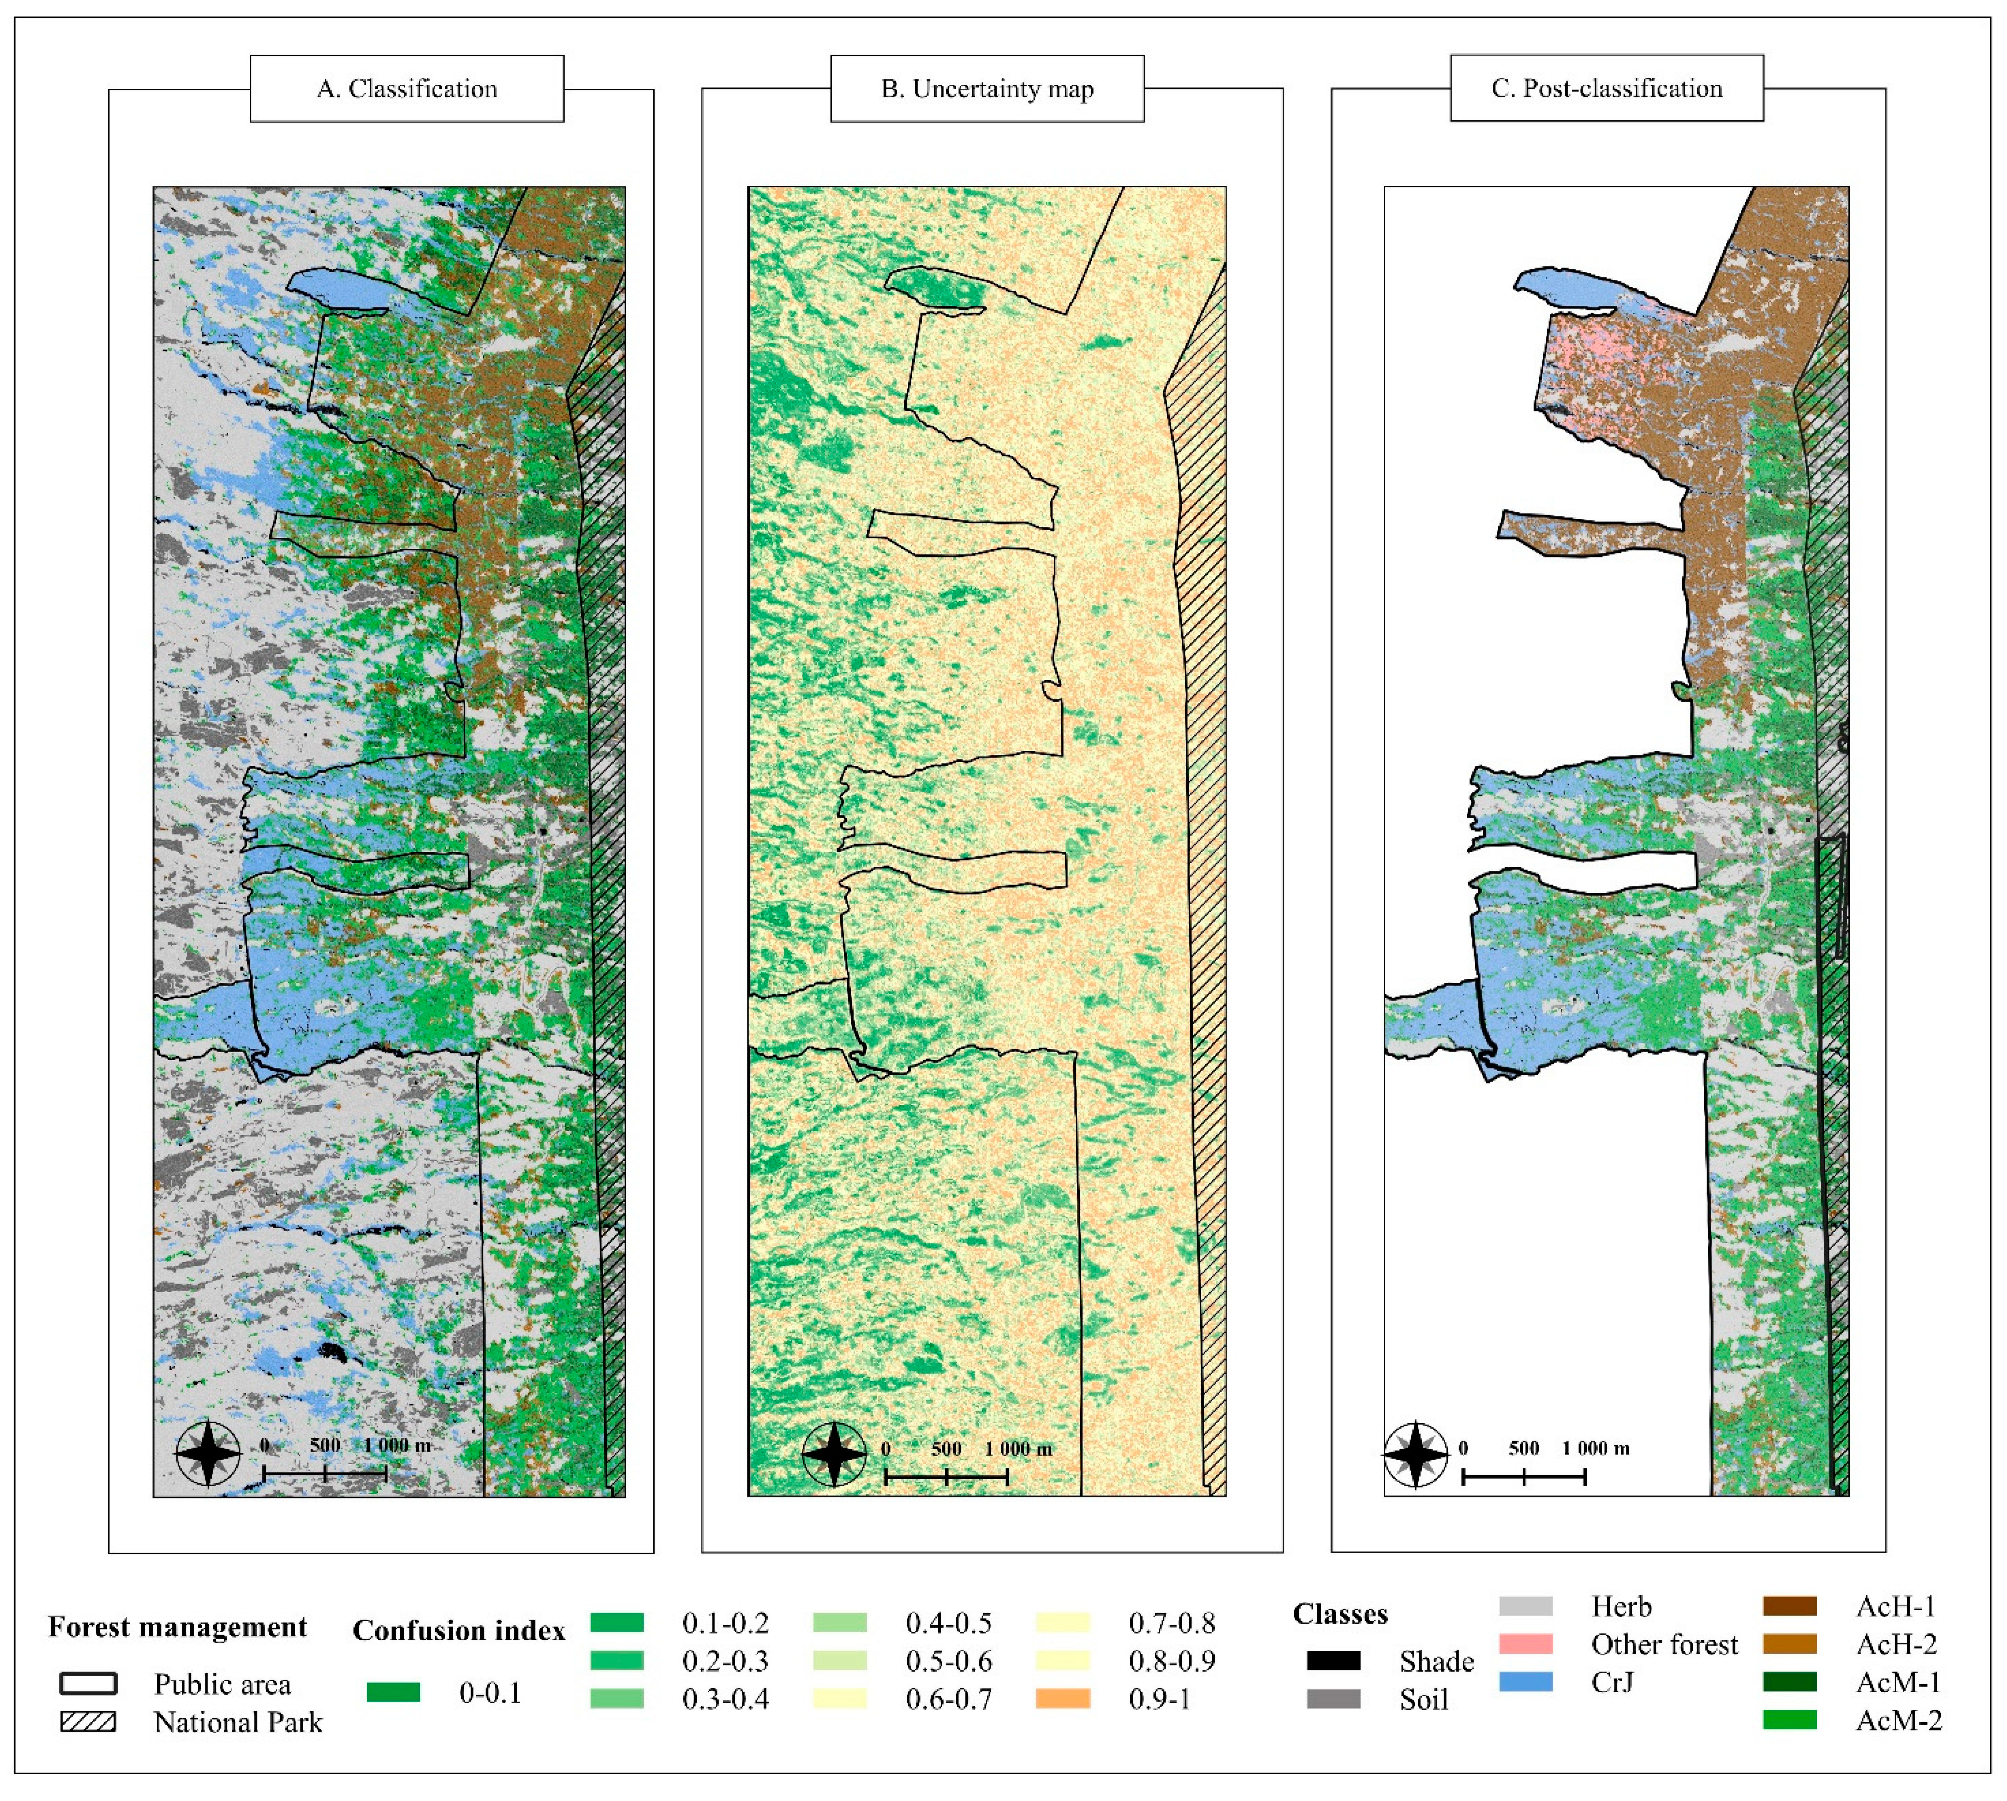
The classification results of the entire study area are presented in Figure 4A. Most of the Acacia mearnsii stands are located in the public area. The results show that the AcM class covers almost 50% of the National Park area. The rest of the public area has a balanced distribution among the CrJ (18%), AcH (21%), and AcM (31%). These forest stands occupy distinct areas. In the western parts of the public area, at lower elevations, the resulting forest map shows large homogeneous patches of CrJ surrounded by AcM-1 or AcM-2 spots, while at higher altitudes (in the burned area), these patches tend to be mixed with AcM or AcH forest stands. The map also locates AcH replanting by illustrating the small isolated patches of AcH-2 and the high presence of herbaceous areas in the frequently burned area. It also confirms the strong presence of Acacia mearnsii in this area by illustrating both the strong presence of AcM-2 compared to AcM-1 but also the tendency for the former to be located in the south compared to the latter.
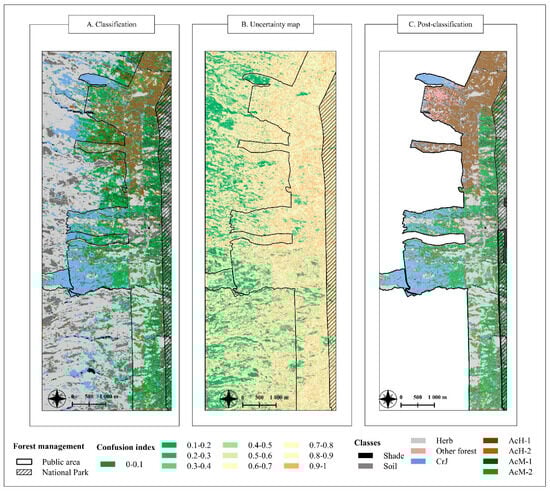
Figure 4.
Confusion index (A) and forest land cover maps obtained from the classification (B) and post-classification (C) steps.
Regarding the private areas, the soil and herbaceous classes cover large areas due to the presence of agricultural land, meadows, and pastures. The spatial distribution of forest (mainly located near the border of the public area) and non-forest objects is globally relevant and confirmed by the accuracy indicators. Patches of CrJ may be representative of small private plantations, and patches of AcM close to herbaceous areas may be representative of Acacia mearnsii dissemination by the agricultural lands. However, the detailed distribution of the forest stand from the classification should be considered with caution since there has been no field validation of the private domain.
3.1.4. Uncertainty Map and Post Classification
Figure 4B shows the uncertainty map, as defined by the calculation of the CI. As identified in the confusion matrix, the AcM and AcH classes have the highest CI values in both the private and public areas, whereas the non-forest classes and the CrJ class have low CI values. Objects classified with high uncertainty (CI > 0.9) represent 5% of the classification objects. They are mainly located in the northern part of the public area (Figure 4B), where the absence of Acacia mearnsii forest stands was confirmed by foresters. Acacia mearnsii objects with high uncertainty (CI > 0.9) in this area, therefore, were reclassified as “other forest” (Figure 4C). For the AcM-2 class in the public area, objects with high uncertainty (CI > 0.9) were also present in the western part of the public area, where confusion with the CrJ class occurred.
The post-classification map (Figure 4C) is linked to the uncertainty map since the decisions were made (see Section 2.3.5) according to the confusion indices. The rules used to reclass the objects with high CI values allowed us to better distinguish the sectors dominated by Acacia heterophylla (in the northern part of the public area), Cryptomeria japonica (in the western part of the area), and Acacia mearnsii (in the eastern and southern parts of the area).
3.2. Accessibility of Acacia mearnsii Forest Stands
In this section, we present the results obtained by applying the processing chain on a single test area where the main Acacia mearnsii stands were confirmed (AcM-1 and AcM-2), first according to a standard scenario, then with different values of the slope threshold (s2) and distance threshold (dmax) for defining the accessible areas suitable for exploitation.
3.2.1. Acacia mearnsii Accessible Areas According to a Standard Scenario
The results allow one to measure the distribution of areas occupied by AcM in the burned area, according to a standard scenario that refers to the conventional technical operating constraints (Table 4). Among the 637 ha of AcM patches located in the burned area, 34% are located in areas that are not suitable for exploitation, namely in the National Park, in ravines, or on steep slopes (i.e., greater than 30%). The remaining areas are equally divided between intermediate slope and gentle slope areas. The latter areas (Acacia mearnsii on gentle slope, i.e., suitable areas with slopes under 25%) represent 204 ha (32% of the initial area) and are all considered accessible (at a distance dmax less than 1 km from forest tracks) when the distance calculation was based on the Euclidean distance method. However, when the cost distance calculation method that considers ground obstacles (barriers, high slopes) was applied, only 121 ha (19% of the initial surface), mostly composed of AcM-2 stands, are considered accessible for forestry operations. This difference in the results between the two distance calculation methods is discussed further in the next section.
Table 4.
Estimation of Acacia mearnsii surface areas according to stand types, location of barriers, slope, and accessibility.
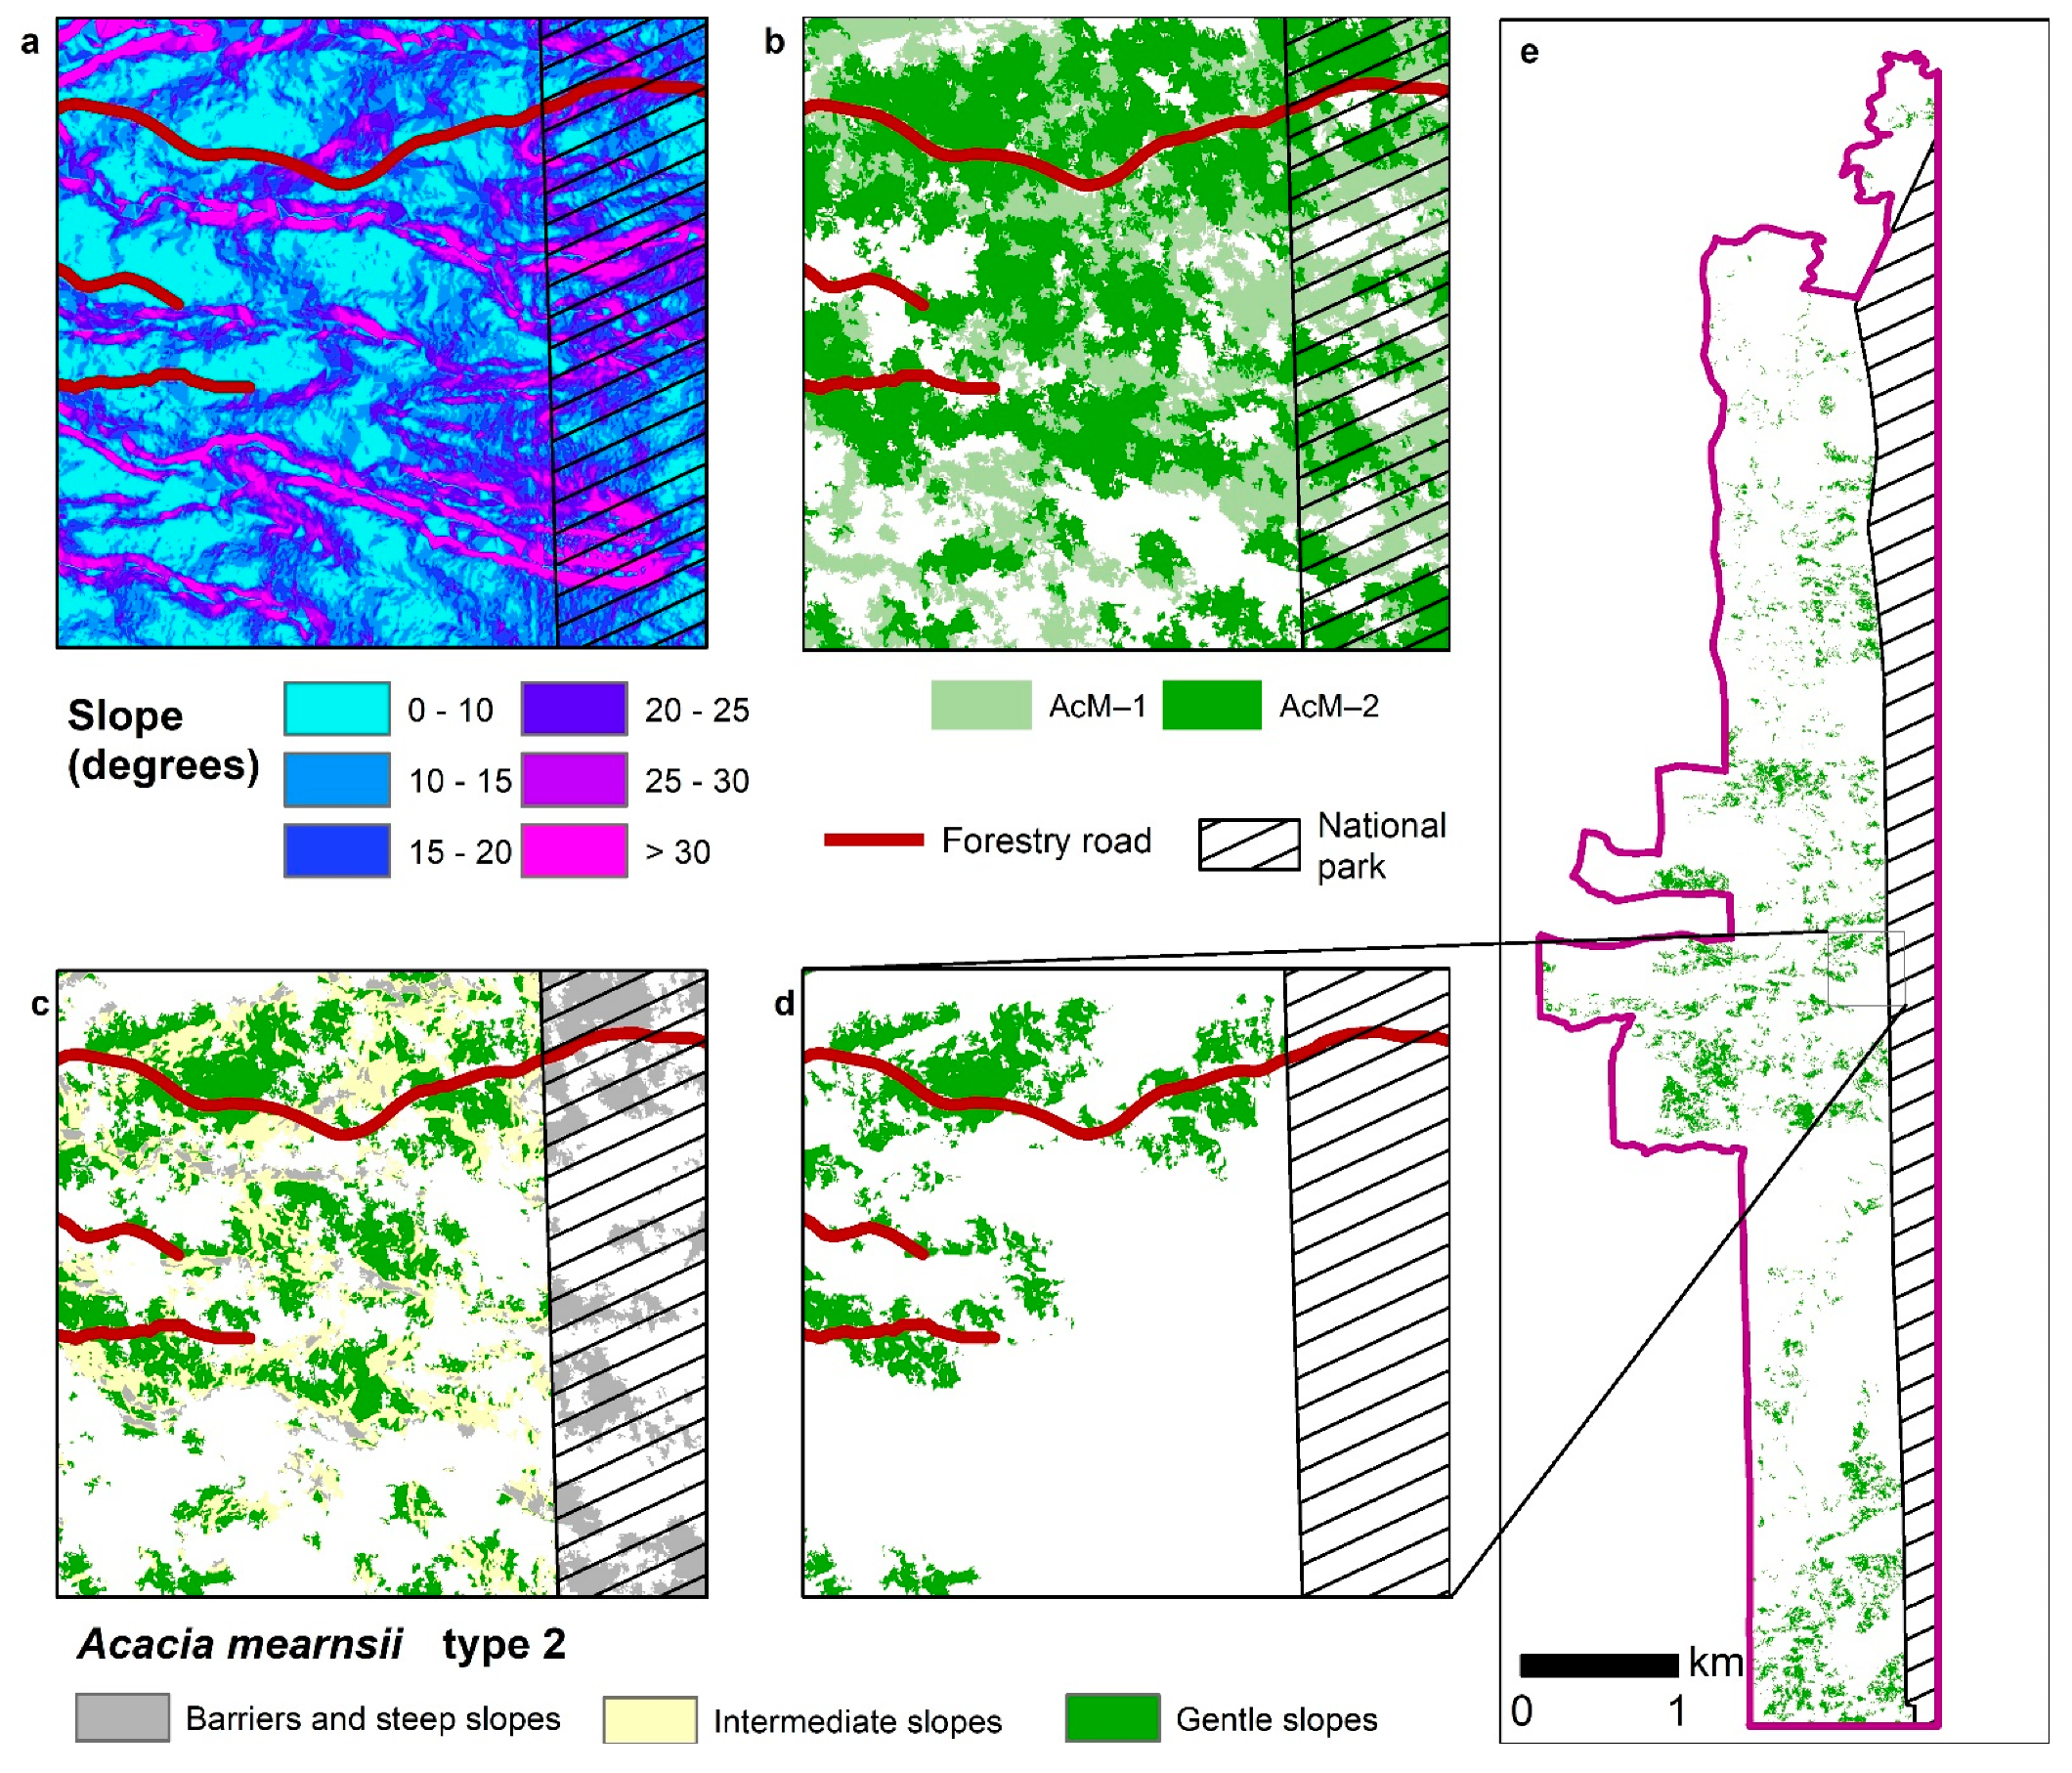
The different steps followed to assess the accessibility are illustrated in Figure 5. When applying the Euclidian distance method, all areas appear as accessible for exploitation. When applying the cost distance method, the topographic constraints (barriers and steep slopes) result in increased distances separating the suitable areas for exploitation from the forest roads. Consequently, the difference in the areas assessed by these two methods (as illustrated in Table 4) corresponds to areas potentially suitable for exploitation but isolated due to the topographic constraints. At the end of the process, the map obtained allows for Acacia mearnsii stands accessible for mechanized exploitation to be located. In the test zone, the distribution of these stands is heterogeneous, with the most important stands being located in the south and in the central part of the zone.
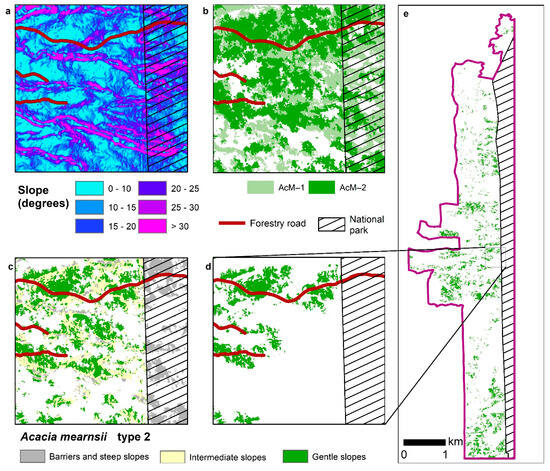
Figure 5.
Mapping Acacia mearnsii areas suitable for mechanized exploitation. Based on barriers and slope values (a), Acacia mearnsii stands (b) are classified to identify AcM-2 stands on gentle slopes (c), and accessible from forestry roads (d). In the entire test zone (e), Acacia mearnsii suitable for mechanized exploitation represents 15.5% of the original forest surface areas.
3.2.2. Assessment of Mechanizable Areas: Distance to Existing Roads and Sensitivity to Slope Threshold
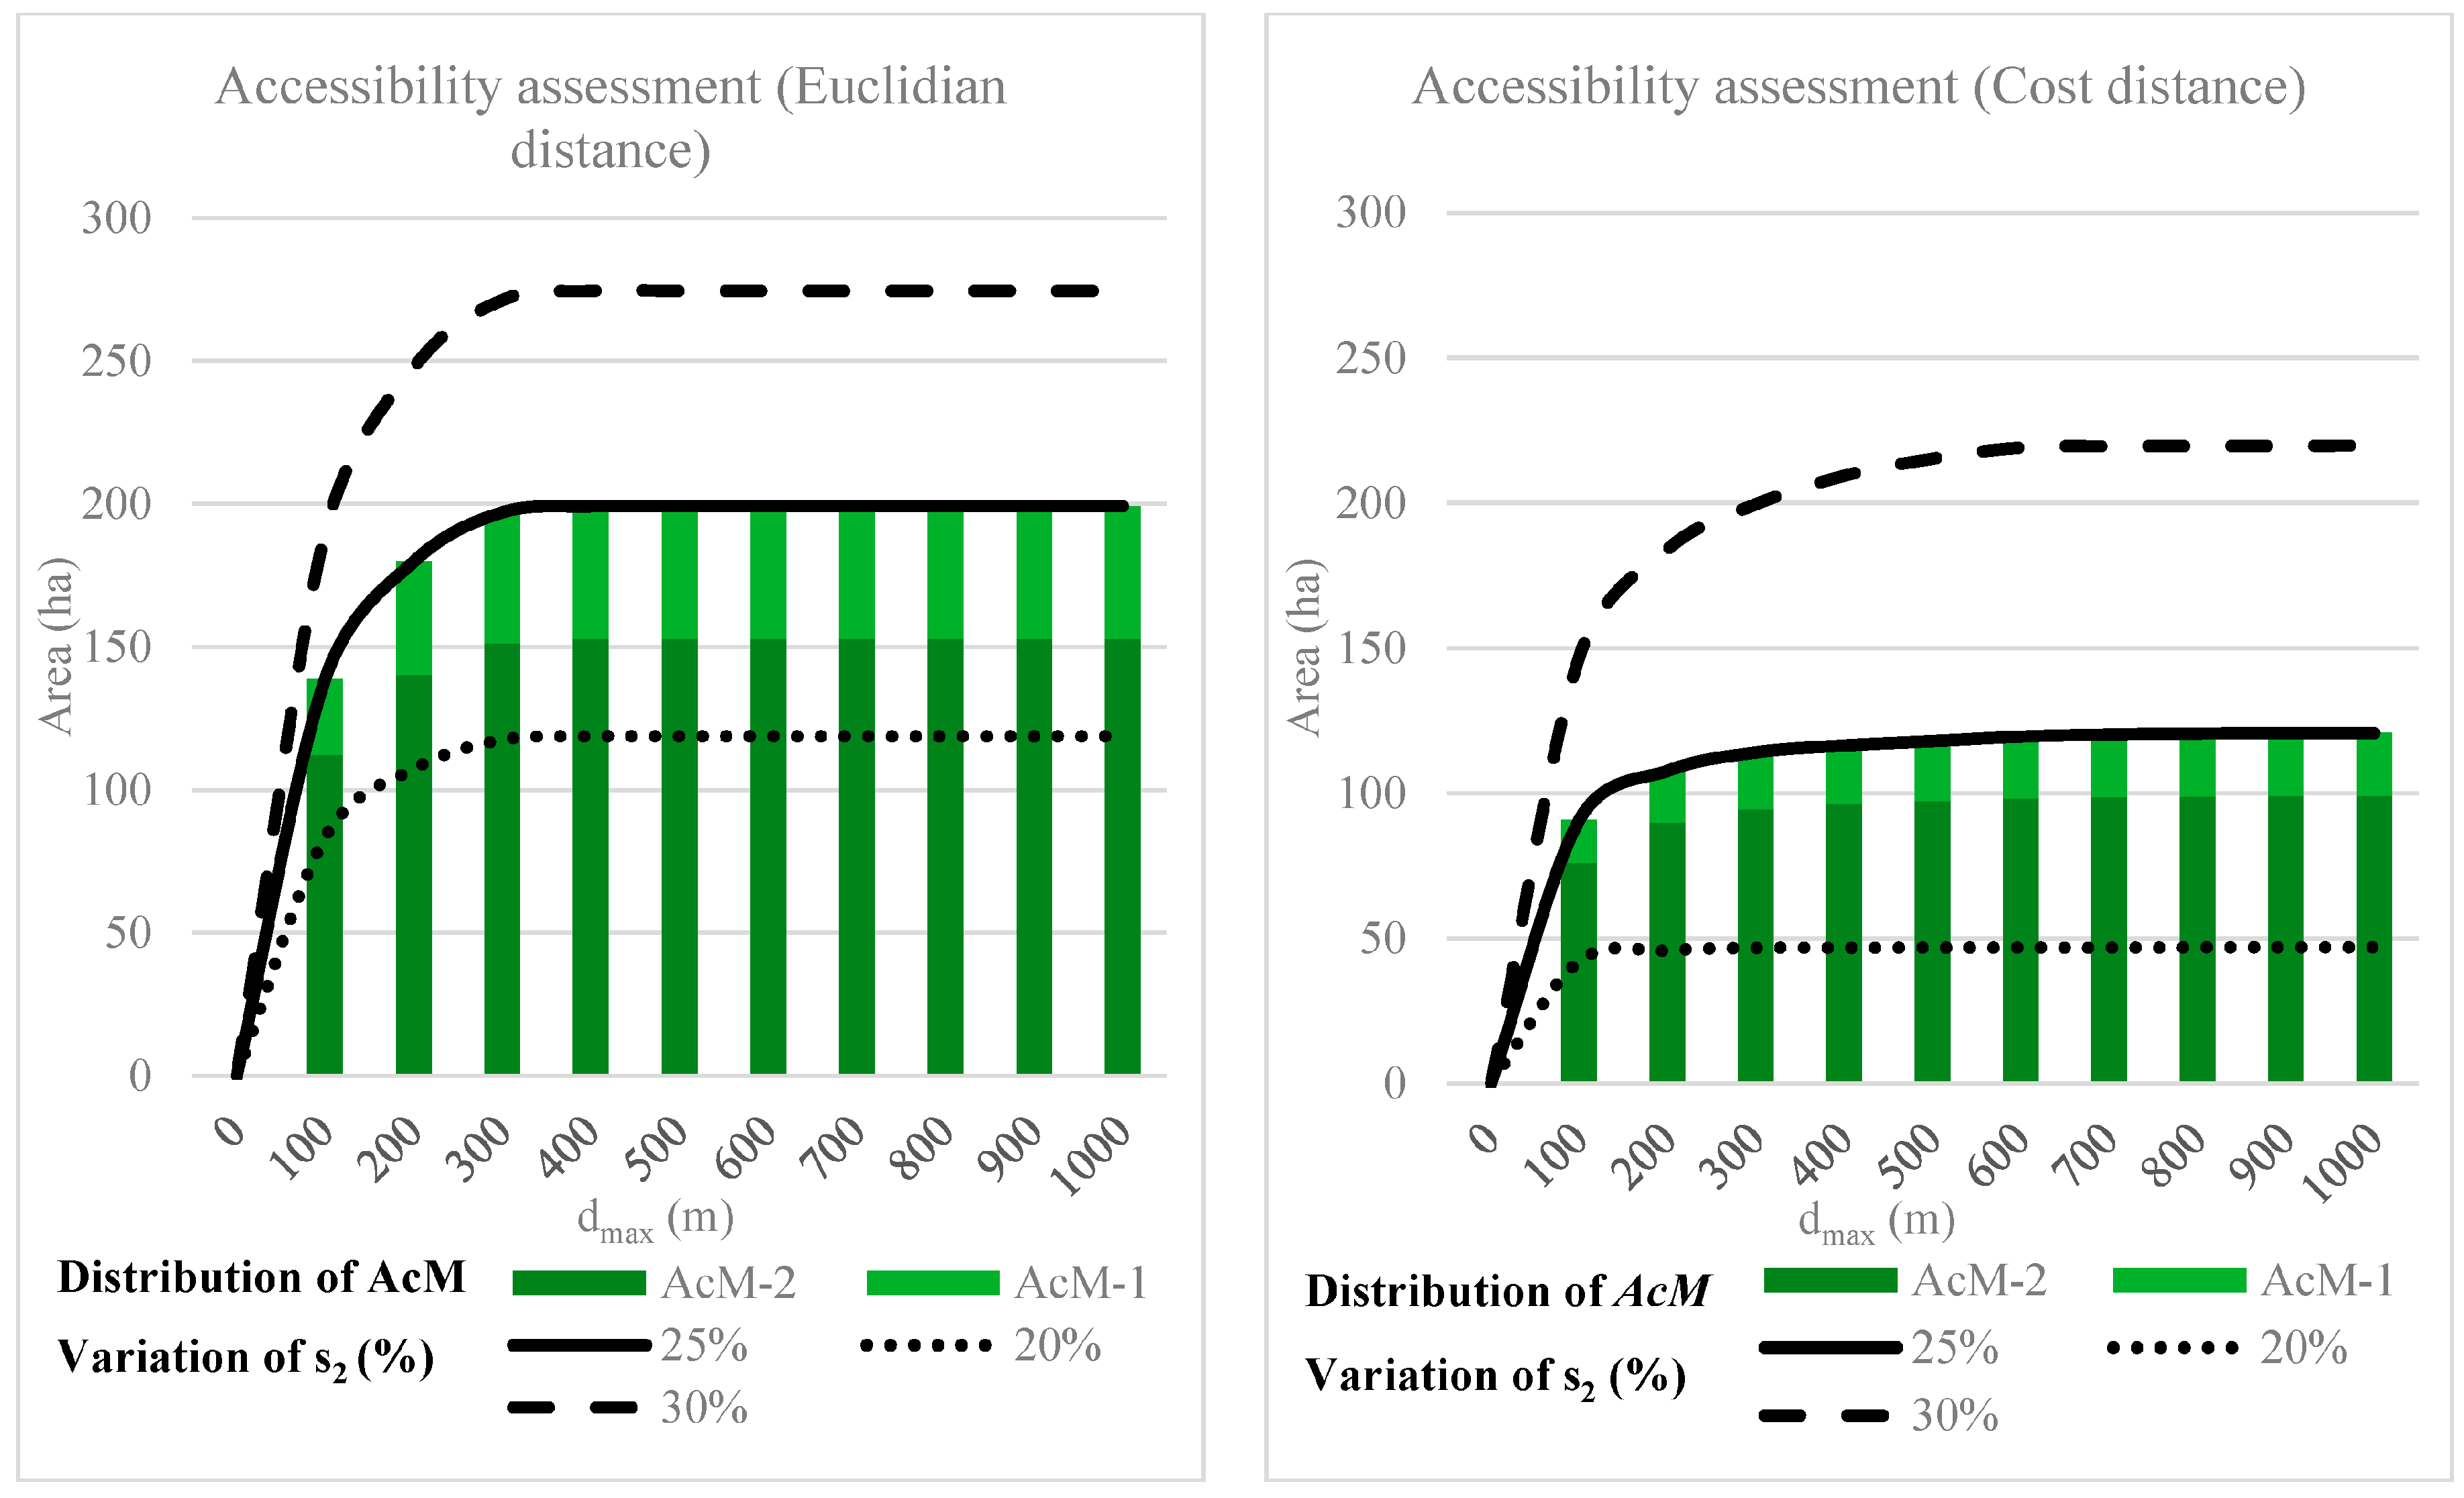
Depending on economic constraints, the maximum distance over which forest stands can be harvested may vary. The developed processing chain allows one to evaluate the areas occupied by Acacia mearnsii stands by considering different exploitation scenarios, namely with different values of dmax. It also highlights the impact of the distance calculation method (Euclidean or cost distance) on the estimations of the surface areas, as illustrated in Figure 6.
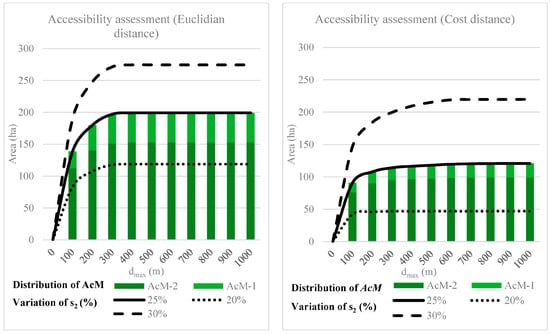
Figure 6.
Accessibility of Acacia mearnsii stands estimated by the GIS processing chain, with as slope parameters s1 = 50% and the variation of s2 between 20 and 30%. The accessible areas were assessed using the Euclidian distance calculation method (left panel) and the cost distance method (right panel).
The Euclidian distance assessment located almost all of the Acacia mearnsii stands within 400 m of the forest road. It also identified 90% of these forests stands within 200 m of the road. At this distance, 86% of the suitable area with AcM-1 and 92% of the suitable area with AcM-2 are accessible. For a given dmax, the surface areas of AcM (d < dmax) calculated with the cost distance method are logically lower than those calculated with Euclidean distance, since obstacles were taken into account and increased the real distance to roads. The difference observed (as mentioned in the previous section) is significant. This proves that, in such a rugged terrain context, the Euclidian distance method is not relevant and may result in assessment errors. With the Euclidian method, 58% of the suitable area with AcM is accessible within 400 m, and the entire accessible forest stand is located within 700 m of the forest road.
Figure 6 also shows the sensitivity of the accessibility assessment, using either the Euclidian or cost distance approach, to the s2 slope parameter. With the Euclidian approach, all of the AcM-1 and AcM-2 stands are accessible within 400 m of the roads, while there are almost half as many with the cost method. With the latter, the variation of s2 from 20% to 30% changes the accessibility assessment. With s2 = 20%, 39% of the areas suitable for exploitation are located at a cost distance of less than 400 m from the secondary roads. With s2 = 30%, this concerns 76% of the area suitable for exploitation, and the maximum accessible area is 600 m from the secondary roads.
4. Discussion
In order to adapt forest stand management strategies, it is necessary to have precise knowledge of their spatial distribution [24]. In our study, we proposed a general framework to generate this knowledge by combining remote sensing and GIS techniques. Often used but rarely combined to assess the accessibility of deposits and answer management and exploitation questions, our approach aims to use these techniques to locate and characterize the exploitable cover of Acacia mearnsii in the Western Highland Region.
4.1. Detection of Acacia mearnsii Using Remote Sensing
Among the remote sensing techniques available, we chose to use object-oriented classification of a Pleiades image using the RF method and performed a post-classification based on an uncertainty indicator. In addition to mapping the main forest stands, the objective was to highlight the existing areas occupied by Acacia mearnsii.
In our study, we used an image captured by the Pleiades 1B satellite. This choice has the advantage of developing methods for very high-spatial-resolution remote sensing. However, various disadvantages also arise. These may include acquisition costs, the image swath, or the dimensionality of the spectral bands. Other sources of satellite imagery can help overcome these limitations. Sensors such as the Landsat 8 and Sentinel 2 have the advantage of providing open and freely available data for various regions of the world. However, their spatial and temporal resolution may also be inadequate, especially in tropical environments where cloud cover can hinder the quality of image acquisition. Therefore, we can say that the choice of image relies on compromises between the costs and acquisition conditions, and it is particularly important to develop protocols tailored to input data to create relevant and reliable classification models.
The classification model gave satisfactory results, both statistically and cartographically. The model effectively produced an overall accuracy of 88% and gave rise to a spatial distribution of the different classes that is broadly in line with reality. The RFE algorithm played an essential role in the classification. By analyzing the weight of each of the variables used in the classification model, it identified the most relevant ones. From the different groups of indices, this selection of channels raised the importance of combining spectral and textural information in the classification of the different objects in our study area.
However, the object-oriented approach contributed to the performance of the classification model. Although the segmentation involved a division of the study area into four sub-areas and required a long computation time, it made it possible to delimit homogeneous and small pixel groups while avoiding the noise induced by a pixel-oriented approach. When compared to a pixel-oriented approach carried out in the same study area [28], the object-oriented approach gave better results both globally and locally.
In addition to producing a classification of the main forest stands, we also produced a classification uncertainty map. Although rarely highlighted in the literature [45], this intermediate step to classification and post-classification provided the opportunity to identify features that were unlikely to be classified, and by extension, to visualize the areas where uncertainties are most pronounced. By facilitating the correction of the classification, this approach also presented the advantage of identifying points of uncertainty between the field and the maps generated.
By enabling us to locate the main forest stands, our protocol lays the foundations for monitoring the evolution of different land uses, and in particular, Acacia mearnsii. Identified as the main resource for a future wood energy industry, straight stands (AcM-2) are more easily managed by foresters than tangled stands (AcM-1). The main challenge was, therefore, to distinguish these two types of stands. The object-oriented method, supplemented by post-classification, thus, gave interesting results in distinguishing these classes faithfully locating their spatial distribution and giving a total area close to that quantified by the foresters. However, these maps are perfectible and might be improved, with adequate data, by testing other classification schemes based on multi-temporal analysis [20,41] or classification algorithms as deep learning methods [46].
4.2. Assessing the Accessibility of an Invasive Alien Species to Be Exploited in a Wood Energy Chain
In order to distinguish forest stands suitable for exploitation from existing stands, it is necessary to consider factors related to accessibility. Hence, there is a need to use several data sources and process them in a GIS.
In our study, we identified two constraints of exploitation. First, exploitation is prohibited in biodiversity conservation areas, i.e., the National Park. For Acacia mearnsii in particular, other management methods are envisaged in order to prevent invasion and preserve the surrounding endemic forests. However, these management methods do not apply to the public domain outside of the National Park. In this area, where exploitation is allowed, the main limitation is the topography of the terrain. Exploitation of forest stands located in ravines or on steep slopes requires special forestry equipment for cutting and skidding [47]. In order to distinguish existing stands from those located in areas unsuitable for exploitation, we, therefore, considered constraints related to forest management and topography. However, other exploitation constraints, and in particular, constraints related to IAS, could have been considered, such as the presence of private domains, watercourses, or urban or agricultural objects.
To cope with the variability in the data reflecting the exploitation factors, we developed a processing chain that can be modulated by users. In our applications, the hydrographic network and forest roads are datasets whose entities take the form of polylines. To consider the width of these spatial objects, we implemented a buffer zone tool whose distance is parameterizable by users of the processing chain. In this way, users can set a value according to their knowledge of the terrain and use their own study data in the place of ours. This approach is also essential for slope characterization. In the processing chain, we implemented the scalable parameters s1 and s2, differentiating among steep, intermediate, and gentle slopes. In this way, it was possible to characterize the exploitation areas and their access, depending on the values assigned to s1 and s2. We carried out two applications of our processing chain. With the parameterization set out in Table 4, we observed an additional 21 ha of AcM distributed on gentle slopes. Figure 6 shows that these patches follow a linear trend and that they are mostly distributed on slopes with gradients between 20 and 25%. These results, therefore, highlight the importance of observing the spatial distribution of the forest stand in order to measure the areas suitable for exploitation.
Our approach also aimed to assess the accessibility of areas suitable for exploitation. Instead of choosing time as a measure of proximity, we opted for distance, and compared two calculation methods. Our results show, first, that the amount of accessible surface stabilizes at 500 m, regardless of the calculation method. Second, the surface areas calculated by the cost-based calculation approach the surface areas reached by the Euclidean calculation when s2 was fixed at 30%. These results raise the question of the quality of the data sources since they are sensitive to the slope data, as shown by Dupire et al. [33] in their study. From a spatial resolution of 1 m, the cartographic precision allowed us to test the slope values corresponding to the capacity of the exploitation equipment, whereas data with less fine spatial resolution would have led us to decrease the slope values tested to assess the areas suitable for exploitation. The results also show that the majority of the accessible areas are close to forest roads, despite the obstacles to exploitation, and that the remaining accessible areas are small. They also indicate that the slope and the constraints applied to the processing chain are sufficient to identify the areas accessible for exploitation. In particular, the processing chain developed in GIS offers the possibility of simply varying the values of the parameters. Other accessibility criteria linked to topography and/or forest management could also be integrated to provide other elements for characterizing accessible areas.
Our approach led us to evaluate the accessibility of areas occupied by AcM-1 and AcM-2. These forest stands respond to two distinct exploitation methods. Manual exploitation is recommended for AcM-1 stands, as their structure is so entangled that it requires gradual penetration of the stand to implement exploitation procedures. On the other hand, mechanized exploitation is recommended for AcM-2 stands, whose structure facilitates the movement and stabilization of forestry machines. By enabling the accessibility of these two types of stands to be assessed, our processing chain can thus locate and quantify the accessible areas according to the parameters given by the user.
5. Conclusions
This article presents the results obtained to (i) highlight the existing forest stands in the Western Highland Region and (ii) distinguish these forest stands from the accessible forest stands within the framework of the development of a wood energy sector. Our methodology consisted of mapping the main forest stands using object-oriented remote sensing techniques, and then mapping the accessible forest stands while taking into account the criteria favorable and unfavorable for their exploitation, i.e., restrictions, ravines, slopes, and proximity to the road, using techniques developed under GIS. In particular, we focused on the forest stands of Acacia mearnsii, an invasive alien species, spread over private, public, and protected areas. The originality of our methodology is combining remote sensing and GIS techniques to locate and quantify existing and accessible Acacia mearnsii forest stands for the implementation of a wood energy chain. The main challenge was processing spatial data from different sources. Particular attention was paid to the cartographic accuracy of the classification and post-classification products, as well as the spatial resolution of the input and output data of the processing chain we developed. In the future, the availability of satellite images with very high spatial resolution and the integration of other spatial data characteristic of the exploitation could contribute to the identification of accessible forest stands in a wood sector, alongside the learning and evaluation models developed in this study.
Supplementary Materials
The following supporting information can be downloaded at: https://www.mdpi.com/article/10.3390/f14102030/s1, Table S1: Characteristics of training and validation datasets; Table S2: Confusion matrix of the pixel-based classification (source: 2021 [28]); Table S3: Accuracy indicators of the post-classification; Figure S1: Accuracy for n selected variables of the classification model; Figure S2: Variables of the classification model ranked by importance.
Author Contributions
H.B.D.: Methodology, software, validation, formal analysis, investigation, writing—original draft, writing—review and editing, visualization. F.B.: Methodology, investigation, writing—review and editing, supervision. A.T.: Methodology, investigation, writing—review and editing, supervision. All authors have read and agreed to the published version of the manuscript.
Funding
We thank the Conseil Départemental de La Réunion, the Conseil Régional de La Réunion, the French Ministry of Agriculture and Food, the European Union (FEADER program, grant n°AG/974/DAAF/2016-00096, and FEDER program, grant n°GURTDI 20151501-0000735), and Cirad for funding the present work within the framework of the project “Services et impacts des activités agricoles en milieu tropical” (Siaam/CAPTerre).
Data Availability Statement
All data (georeferenced database, forest maps, confusion matrix) can be accessed via the Dataverse data repository (http://dataverse.cirad.fr, accessed on 26 September 2023).
Acknowledgments
The work was based on Pleiades images provided by the Kalideos program (funded by CNES) and DEM data provided by the AWARE web platform of CIRAD. We would like to express our gratitude to the National Forestry Office and CIRAD unit teams (BioWooEB, TETIS) for their contributions to the methods and results presented in this article.
Conflicts of Interest
The authors declare no conflict of interest. The funders had no role in the design of the study; in the collection, analyses, or interpretation of data; in the writing of the manuscript; or in the decision to publish the results.
References
- Zambelli, P.; Lora, C.; Spinelli, R.; Tattoni, C.; Vitti, A.; Zatelli, P.; Ciolli, M. A GIS decision support system for regional forest management to assess biomass availability for renewable energy production. Environ. Model. Softw. 2012, 38, 203–213. [Google Scholar] [CrossRef]
- UICN. La Valorisation Socio-Économique Des Espèces Exotiques Envahissantes Établies en Milieux Naturels: Un Moyen de Régulation Adapté? Première Analyse et Identification de Points de Vigilance; UICN: Fontainebleau, France, 2018; p. 84. [Google Scholar]
- FAO. Le Bois-Énergie Dans la Région de la CEE: Données, Tendances et Perspectives en Europe, Dans la Communauté d’États Indépendants et en Amérique du Nord; Etudes de Genève sur le Bois et la Forêt de la CEE/FAO; Nations Unies: Genève, Switzerland, 2019. [Google Scholar]
- Tassin, J. Dynamique et Conséquences de l’Invasion des Paysages Agricoles des Hauts de la Réunion par Acacia mearnsii de Wild; Université Toulouse III—Paul Sabatier: Toulouse, France, 2002. [Google Scholar]
- Cadet, T.; Quézel, P. La Végétation de l’île de la Réunion: Étude Phytoécologique et Phytosociologique; University of Aix-Marseille: Marseille, France, 1977; 147p. [Google Scholar]
- Souza-Alonso, P.; Rodríguez, J.; González, L.; Lorenzo, P. Here to stay. Recent advances and perspectives about Acacia invasion in Mediterranean areas. Ann. For. Sci. 2017, 74, 55. [Google Scholar] [CrossRef]
- Searle, S.D. Acacia mearnsii de Wild (Black Wattle) in Australia. In Black Wattle and Its Utilisation; Rural Industries Research and Development Corporation: Canberra, Australia, 1997. [Google Scholar]
- Benoist, A.; van de Steene, L.; Broust, F.; Helias, A. Enjeux environnementaux du développement des biocarburants liquides pour le transport. Sci. Eaux Territ. 2012, 7, 66–73. [Google Scholar] [CrossRef]
- Tassin, J.; Balent, G. Le Diagnostic d’invasion d’une essence forestière en milieu rural: Acacia mearnsii à la Réunion. Rev. For. Française 2004, 56, 132–142. [Google Scholar] [CrossRef]
- ONF. Evaluation de la ressource mobilisable en bois energie. In Le Bois Energie sur l’île de la Réunion; Albioma, Office Nationale des Forets: Saint-Denis, Reunion, France, 2018. [Google Scholar]
- PPE. Programmation Pluriannuelle de l’Energie Pour la Réunion; Region Reunion, Prefecture de la Réunion: Saint-Denis, Reunion, France, 2016. [Google Scholar]
- Frombo, F.; Robba, M.; Rosso, F.; Sacile, R. Planning woody biomass logistics for energy production: A strategic decision model. Biomass Bioenergy 2009, 33, 372–383. [Google Scholar] [CrossRef]
- Vis, M.; Berg, D. Harmonization of Biomass Resource Assessments, Volume I, Best Practices and Methods Handbook; Biomass Energy Europe: Friburg, Germany, 2010. [Google Scholar]
- Woo, H.; Acuna, M.; Cho, S.J.; Park, J. Assessment Techniques in Forest Biomass along the Timber Supply Chain. Forests 2019, 10, 1018. [Google Scholar] [CrossRef]
- White, J.C.; Coops, N.C.; Wulder, M.A.; Vastaranta, M.; Hilker, T.; Tompalski, P. Remote Sensing Technologies for Enhancing Forest Inventories: A Review. Can. J. Remote Sens. 2016, 42, 619–641. [Google Scholar] [CrossRef]
- Kumar, L.; Sinha, P.; Taylor, S.; Alqurashi, A. Review of the use of remote sensing for biomass estimation to support renewable energy generation. J. Appl. Remote Sens. 2015, 9, 097696. [Google Scholar] [CrossRef]
- Piiroinen, R.; Heiskanen, J.; Maeda, E.; Viinikka, A.; Pellikka, P. Classification of Tree Species in a Diverse African Agroforestry Landscape Using Imaging Spectroscopy and Laser Scanning. Remote Sens. 2017, 9, 875. [Google Scholar] [CrossRef]
- Paz-Kagan, T.; Silver, M.; Panov, N.; Karnieli, A. Multispectral Approach for Identifying Invasive Plant Species Based on Flowering Phenology Characteristics. Remote Sens. 2019, 11, 953. [Google Scholar] [CrossRef]
- Joshi, C.; De Leeuw, J.; Van Duren, I. Remote sensing and GIS applications for mapping and spatial modeling of invasive species. Proc. ISPRS 2004, 35, B7. [Google Scholar]
- Masemola, C.; Cho, M.A.; Ramoelo, A. Sentinel-2 time series based optimal features and time window for mapping invasive Australian native Acacia species in KwaZulu Natal, South Africa. Int. J. Appl. Earth Obs. Geoinf. 2020, 93, 102207. [Google Scholar] [CrossRef]
- Anaya, J.A.; Chuvieco, E.; Palacios-Orueta, A. Aboveground biomass assessment in Colombia: A remote sensing approach. For. Ecol. Manag. 2009, 257, 1237–1246. [Google Scholar] [CrossRef]
- Helmer, E.H.; Ruzycki, T.S.; Benner, J.; Voggesser, S.M.; Scobie, B.P.; Park, C.; Fanning, D.W.; Ramnarine, S. Detailed maps of tropical forest types are within reach: Forest tree communities for Trinidad and Tobago mapped with multiseason Landsat and multiseason fine-resolution imagery. For. Ecol. Manag. 2012, 279, 147–166. [Google Scholar] [CrossRef]
- Oumar, M.S.; Peerbhay, K.Y.; Germishuizen, I.; Mutanga, O.; Oumar, Z. Detecting canopy damage caused by Uromycladium acaciae on South African Black Wattle forest compartments using moderate resolution satellite imagery. S. Afr. J. Geomat. 2019, 8, 69–83. [Google Scholar] [CrossRef]
- Chekchaki, S.; Beddiar, A.; Djalil Zaafour, M. Cartographie par télédétection des milieux envahis par Acacia mearnsii de Wild. dans l’extrême Nord-Est algérien. Bois For. Trop. 2020, 343, 5–16. [Google Scholar] [CrossRef]
- Masemola, C.; Cho, M.A.; Ramoelo, A. Assessing the Effect of Seasonality on Leaf and Canopy Spectra for the Discrimination of an Alien Tree Species, Acacia mearnsii, From Co-Occurring Native Species Using Parametric and Nonparametric Classifiers. IEEE Trans. Geosci. Remote Sens. 2019, 57, 5853–5867. [Google Scholar] [CrossRef]
- Arasumani, M.; Singh, A.; Bunyan, M.; Robin, V.V. Testing the efficacy of hyperspectral (AVIRIS-NG), multispectral (Sentinel-2) and radar (Sentinel-1) remote sensing images to detect native and invasive non-native trees. Biol. Invasions 2021, 23, 2863–2879. [Google Scholar] [CrossRef]
- Peerbhay, K.Y.; Mutanga, O.; Ismail, R. Investigating the Capability of Few Strategically Placed Worldview-2 Multispectral Bands to Discriminate Forest Species in KwaZulu-Natal, South Africa. IEEE J. Sel. Top. Appl. Earth Obs. Remote Sens. 2014, 7, 307–316. [Google Scholar] [CrossRef]
- Bley-Dalouman, H.; Broust, F.; Prevost, J.; Tran, A. Use of very high spatial resolution imagery for mapping wood energy potential from tropical managed forest stands, Reunion Island. Int. Arch. Photogramm. Remote Sens. Spat. Inf. Sci. 2021, XLIII-B3-2021, 189–194. [Google Scholar] [CrossRef]
- Wang, D.; Wan, B.; Qiu, P.; Su, Y.; Guo, Q.; Wu, X. Artificial Mangrove Species Mapping Using Pléiades-1: An Evaluation of Pixel-Based and Object-Based Classifications with Selected Machine Learning Algorithms. Remote Sens. 2018, 10, 294. [Google Scholar] [CrossRef]
- Blaschke, T. Object based image analysis for remote sensing. ISPRS J. Photogramm. Remote Sens. 2010, 65, 2–16. [Google Scholar] [CrossRef]
- Massetti, A.; Sequeira, M.M.; Pupo, A.; Figueiredo, A.; Guiomar, N.; Gil, A. Assessing the effectiveness of RapidEye multispectral imagery for vegetation mapping in Madeira Island (Portugal). Eur. J. Remote Sens. 2017, 49, 643–672. [Google Scholar] [CrossRef]
- Vainio, P.; Tokola, T.; Palander, T.; Kangas, A. A GIS-based stand management system for estimating local energy wood supplies. Biomass Bioenergy 2009, 33, 1278–1288. [Google Scholar] [CrossRef]
- Dupire, S.; Bourrier, F.; Monnet, J.-M.; Berger, F. Sylvaccess : Un modèle pour cartographier automatiquement l’accessibilité des forêts. Rev. For. Française 2015, 70, 111–126. [Google Scholar] [CrossRef]
- Tucker, C.J. Red and photographic infrared linear combinations for monitoring vegetation. Remote Sens. Environ. 1979, 8, 127–150. [Google Scholar] [CrossRef]
- Kriegler, F.J.; Malila, W.A.; Nalepka, R.F.; Richardson, W. Preprocessing Transformations and Their Effects on Multispectral Recognition. Proc. VI Int. Symp. Remote Sens. Environ. 1969, 2, 97. [Google Scholar]
- McFeeters, S.K. The use of the Normalized Difference Water Index (NDWI) in the delineation of open water features. Int. J. Remote Sens. 1996, 17, 1425–1432. [Google Scholar] [CrossRef]
- Gamon, J.A.; Surfus, J.S. Assessing leaf pigment content and activity with a reflectometer. New Phytol. 1999, 143, 105–117. [Google Scholar] [CrossRef]
- Huete, A.R. A soil-adjusted vegetation index (SAVI). Remote Sens. Environ. 1988, 25, 295–309. [Google Scholar] [CrossRef]
- Haralick, R.M.; Shanmugam, K.; Dinstein, I. Textural Features for Image Classification. IEEE Trans. Syst. Man Cybern. 1973, SMC-3, 610–621. [Google Scholar] [CrossRef]
- Crespin-Boucaud, A.L.V.; Lo Seen, D.; Castets, M.; Bégué, A. Agriculturally consistent mapping of smallholder farming systems using remote sensing and spatial modelling. Int. Arch. Photogramm. Remote Sens. Spat. Inf. Sci. 2020, XLII-3/W11, 35–42. [Google Scholar] [CrossRef]
- Dupuy, S.; Gaetano, R.; Le Mezo, L. Mapping land cover on Reunion Island in 2017 using satellite imagery and geospatial ground data. Data Brief 2020, 28, 104934. [Google Scholar] [CrossRef]
- Breiman, L. Random Forests. Mach. Learn. 2001, 45, 5–32. [Google Scholar] [CrossRef]
- Cutler, A.; Cutler, D.; Stevens, J.R. Random forests. Mach. Learn 2011, 45, 157–176. [Google Scholar]
- Congalton, R.G. A review of assessing the accuracy of classifications of remotely sensed data. Remote Sens. Environ. 1991, 37, 35–46. [Google Scholar] [CrossRef]
- Prasad, M.S.G.; Arora, M.K. Representing Uncertainty in Fuzzy Land Cover Classification: A Comparative Assessment. J. Remote Sens. Technol. 2015, 3, 34–45. [Google Scholar] [CrossRef]
- Ienco, D.; Gaetano, R.; Dupaquier, C.; Maurel, P. Land cover classification via multitemporal spatial data by deep recurrent neural networks. IEEE Geosci. Remote Sens. Lett. 2017, 14, 1685–1689. [Google Scholar] [CrossRef]
- Enache, A.; Kühmaier, M.; Visser, R.; Stampfer, K. Forestry operations in the European mountains: A study of current practices and efficiency gaps. Scand. J. For. Res. 2016, 31, 412–427. [Google Scholar] [CrossRef]

Disclaimer/Publisher’s Note: The statements, opinions and data contained in all publications are solely those of the individual author(s) and contributor(s) and not of MDPI and/or the editor(s). MDPI and/or the editor(s) disclaim responsibility for any injury to people or property resulting from any ideas, methods, instructions or products referred to in the content. |
© 2023 by the authors. Licensee MDPI, Basel, Switzerland. This article is an open access article distributed under the terms and conditions of the Creative Commons Attribution (CC BY) license (https://creativecommons.org/licenses/by/4.0/).