
Non-Destructive Evaluation of Downy and Silver Birch Wood Quality and Stem Features from a Progeny Trial in Southern Sweden


Abstract
1. Introduction
2. Materials and Methods
2.1. Measurements
2.2. Statistical Analyses
3. Results
4. Discussion
5. Conclusions
Author Contributions
Funding
Data Availability Statement
Conflicts of Interest
References
- Fortin, M.; Guillemette, F.; Bedard, S. Predicting volumes by log grades in standing sugar maple and yellow birch trees in southern Quebec, Canada. Can. J. For. Res. 2009, 39, 1928–1938. [Google Scholar]
- Belleville, B.; Cloutier, A.; Achim, A. Detection of red heartwood in paper birch (Betula papyrifera) using external stem characteristics. Can. J. For. Res. 2011, 41, 1491–1499. [Google Scholar] [CrossRef]
- Erdene-Ochir, T.; Ishiguri, F.; Nezu, I.; Tumenjargal, B.; Baasan, B.; Chultem, G.; Ohshima, J.; Yokota, S. Utilization potential of naturally regenerated Mongolian Betula platyphylla wood based on growth characteristics and wood properties. Silva Fenn. 2020, 54, 10284. [Google Scholar] [CrossRef]
- Johansson, J. The Swedish hardwood sawmill industry: Structure, present status and development potential. Wood Mater. Sci. Eng. 2008, 3, 94–101. [Google Scholar] [CrossRef]
- Drouin, M.; Beauregard, R.; Duchesne, I. Impact of paper birch (Betula papyrifera) tree characteristics on lumber color, grade recovery, and lumber value. For. Prod. J. 2010, 60, 236–243. [Google Scholar] [CrossRef]
- Bédard, S.; Duchesne, I.; Guillemette, F.; DeBlois, J. Predicting volume distributions of hardwood sawn products by tree grade in eastern Canada. For. Int. J. For. Res. 2018, 91, 341–353. [Google Scholar]
- Hynynen, J.; Niemistö, P.; Viherä-Aarnio, A.; Brunner, A.; Hein, S.; Velling, P. Silviculture of birch (Betula pendula Roth and Betula pubescens Ehrh.) in northern Europe. For. Int. J. For. Res. 2010, 83, 103–119. [Google Scholar] [CrossRef]
- Eriksson, G. Betula pendula and Betula pubescens: Recent Genetic Research; Department of Plant Biology and Forest Genetics, Uppsala Bio Centre, SLU: Uppsala, Sweden, 2011. [Google Scholar]
- Hannrup, B.; Cahalan, C.; Chantre, G.; Grabner, M.; Karlsson, B.; Bayon, I.L.; Jones, G.L.; Müller, U.; Pereira, H.; Rodrigues, J.C. Genetic parameters of growth and wood quality traits in Picea abies. Scand. J. For. Res. 2004, 19, 14–29. [Google Scholar] [CrossRef]
- Eriksson, G.; Ekberg, I.; Clapham, D. Genetics Applied to Forestry: An Introduction; Department of Plant Biology and Forest Genetics, SLU: Uppsala, Sweden, 2013. [Google Scholar]
- Atkinson, M.D. Betula Pendula Roth (B. verrucosa Ehrh.) and B. pubescens Ehrh. J. Ecol. 1992, 80, 837–870. [Google Scholar] [CrossRef]
- Cameron, A.D. Managing birch woodlands for the production of quality timber. Forestry 1996, 69, 357–371. [Google Scholar] [CrossRef]
- Bhat, K.; Kärkkäinen, M. Distinguishing between Betula pendula Roth. and Betula pubescens Ehrh. on the basis of wood anatomy. Silva Fenn. 1980, 14, 294–304. [Google Scholar] [CrossRef][Green Version]
- SLU. Forest Statistics 2019; Swedish University of Agricultural Sciences: Umeå, Sweden, 2019; p. 138. [Google Scholar]
- Heräjärvi, H. Variation of basic density and Brinell hardness within mature Finnish Betula pendula and B. pubescens stems. Wood Fiber Sci. 2004, 36, 216–227. [Google Scholar]
- Liepiņš, J.; Liepiņš, K. Mean basic density and its axial variation in Scots pine, Norway spruce and birch stems. Res. Rural Dev. 2017, 1, 21–27. [Google Scholar]
- Heräjärvi, H. Static bending properties of Finnish birch wood. Wood Sci. Technol. 2004, 37, 523–530. [Google Scholar] [CrossRef]
- Luostarinen, K.; Möttönen, V. Radial variation in the anatomy of Betula pendula wood from different growing sites. Balt. For. 2010, 16, 209–316. [Google Scholar]
- Luostarinen, K.; Hakkarainen, K.; Kaksonen, H. Wood anatomy of seed and basal bud originated downy birches (Betula pubescens Ehrh.) grown at four different sites. Silva Fenn. 2017, 51, 1694. [Google Scholar] [CrossRef]
- Luostarinen, K.; Hakkarainen, K.; Kaksonen, H. Connection of growth and wood density with wood anatomy in downy birch grown in two different soil types. Scand. J. For. Res. 2017, 32, 789–797. [Google Scholar] [CrossRef]
- Karlsson, A.; Albrektson, A.; Sonesson, J. Site index and productivity of artificially regenerated Betula pendula and Betula pubescens stands on former farmland in southern and central Sweden. Scand. J. For. Res. 1997, 12, 256–263. [Google Scholar] [CrossRef]
- Hytönen, J.; Saramäki, J.; Niemistö, P. Growth, stem quality and nutritional status of Betula pendula and Betula pubescens in pure stands and mixtures. Scand. J. For. Res. 2014, 29, 1–11. [Google Scholar] [CrossRef]
- Heräjärvi, H. Technical properties of mature birch (Betula pendula and B. pubescens) for saw milling in Finland. Silva Fenn. 2001, 35, 469–485. [Google Scholar] [CrossRef]
- Stener, L.-G.; Hedenberg, Ö. Genetic parameters of wood, fibre, stem quality and growth traits in a clone test with Betula pendula. Scand. J. For. Res. 2003, 18, 103–110. [Google Scholar] [CrossRef]
- Jones, G.; Liziniewicz, M.; Adamopoulos, S.; Lindeberg, J. Genetic parameters of stem and wood traits in full-sib silver birch families. Forests 2021, 12, 159. [Google Scholar] [CrossRef]
- Kumar, S.; Lee, J. Age-age correlations and early selection for end-of-rotation wood density in radiata pine. For. Genet. 2002, 9, 323–330. [Google Scholar]
- Baliuckienė, A.; Baliuckas, V. Genetic variability of silver birch (Betula pendula L.) wood hardness in progeny testing at juvenile age. Balt. For. 2006, 12, 134–140. [Google Scholar]
- Austad, M. Parental and Individual Variation of Growth Traits and Wood Density in a Progeny Trial after a Complete Diallel Crossing of 9 Silver Birch (Betula pendula) Trees in South-Eastern Norway. Master’s Thesis, Norwegian University of Life Sciences, Ås, Norway, 2018. [Google Scholar]
- Erdene-Ochir, T.; Ishiguri, F.; Nezu, I.; Tumenjargal, B.; Sarkhad, M.; Ohshima, J.; Yokota, S. Within-tree and radial variations of wood properties in naturally regenerated trees of Betula platyphylla grown in Nikko, Japan. Int. Wood Prod. J. 2020, 12, 95–106. [Google Scholar] [CrossRef]
- Llana, D.F.; Short, I.; Harte, A.M. Use of non-destructive test methods on Irish hardwood standing trees and small-diameter round timber for prediction of mechanical properties. Ann. For. Sci. 2020, 77, 62. [Google Scholar] [CrossRef]
- Pramreiter, M.; Stadlmann, A.; Linkeseder, F.; Keckes, J.; Müller, U. Non-destructive Testing of Thin Birch (Betula pendula Roth.) Veneers. BioResources 2020, 15, 1265–1281. [Google Scholar] [CrossRef]
- Greaves, B.L.; Borralho, N.M.; Raymond, C.A.; Farrington, A. Use of a Pilodyn for the indirect selection of basic density in Eucalyptus nitens. Can. J. For. Res. 1996, 26, 1643–1650. [Google Scholar] [CrossRef]
- Dunham, R.; Cameron, A.; Petty, J. The effect of growth rate on the strength properties of sawn beams of silver birch (Betula pendula Roth). Scand. J. For. Res. 1999, 14, 18–26. [Google Scholar] [CrossRef]
- Kretschmann, D.E.; Bridwell, J.J.; Nelson, T.C. Effect of changing slope of grain on ash, maple, and yellow birch in bending strength. In Proceedings of the World Conference on Timber Engineering (WCTE 2010), Riva del Garda, Italy, 20–24 June 2010. [Google Scholar]
- Antikainen, T.; Eskelinen, J.; Rohumaa, A.; Vainio, T.; Hughes, M. Simultaneous measurement of lathe check depth and the grain angle of birch (Betula pendula Roth.) veneers using laser trans-illumination imaging. Wood Sci. Technol. 2015, 49, 591–605. [Google Scholar] [CrossRef]
- Stener, L.-G.; Jansson, G. Improvement of Betula pendula by clonal and progeny testing of phenotypically selected trees. Scand. J. For. Res. 2005, 20, 292–303. [Google Scholar] [CrossRef]
- Hallingbäck, H.; Jansson, G.; Hannrup, B. Genetic correlations between spiral grain and growth and quality traits in Picea abies. Can. J. For. Res. 2010, 40, 173–183. [Google Scholar] [CrossRef]
- Hallingbäck, H.R.; Jansson, G.; Hannrup, B. Genetic parameters for grain angle in 28-year-old Norway spruce progeny trials and their parent seed orchard. Ann. For. Sci. 2008, 65, 1. [Google Scholar] [CrossRef]
- Wu, S.; Xu, J.; Li, G.; Risto, V.; Du, Z.; Lu, Z.; Li, B.; Wang, W. Genotypic variation in wood properties and growth traits of Eucalyptus hybrid clones in southern China. New For. 2011, 42, 35–50. [Google Scholar] [CrossRef]
- Chen, Z.-Q.; Karlsson, B.; Lundqvist, S.-O.; García Gil, M.R.; Olsson, L.; Wu, H.X. Estimating solid wood properties using Pilodyn and acoustic velocity on standing trees of Norway spruce. Ann. For. Sci. 2015, 72, 499–508. [Google Scholar] [CrossRef]
- Fundova, I.; Hallingbäck, H.; Jansson, G.; Wu, H. Genetic improvement of sawn-board shape stability in Scots pine (Pinus sylvestris L.). Ind. Crops Prod. 2020, 157, 112939. [Google Scholar] [CrossRef]
- Wessels, C.; Malan, F.S.; Rypstra, T. A review of measurement methods used on standing trees for the prediction of some mechanical properties of timber. Eur. J. For. Res. 2011, 130, 881–893. [Google Scholar] [CrossRef]
- Wang, X. Acoustic measurements on trees and logs: A review and analysis. Wood Sci. Technol. 2013, 47, 965–975. [Google Scholar] [CrossRef]
- Legg, M.; Bradley, S. Measurement of stiffness of standing trees and felled logs using acoustics: A review. J. Acoust. Soc. Am. 2016, 139, 588–604. [Google Scholar] [CrossRef]
- Gao, S.; Wang, X.; Wiemann, M.C.; Brashaw, B.K.; Ross, R.J.; Wang, L. A critical analysis of methods for rapid and nondestructive determination of wood density in standing trees. Ann. For. Sci. 2017, 74, 27. [Google Scholar] [CrossRef]
- Hallingbäck, H.R.; Högberg, K.-A.; Säll, H.; Lindeberg, J.; Johansson, M.; Jansson, G. Optimal timing of early genetic selection for sawn timber traits in Picea abies. Eur. J. For. Res. 2018, 137, 553–564. [Google Scholar] [CrossRef]
- Adamopoulos, S.; Voulgaridis, E. Within-tree variation in growth rate and cell dimensions in the wood of black locust (Robinia pseudoacacia). IAWA J. 2002, 23, 191–199. [Google Scholar] [CrossRef]
- Isik, F.; Holland, J.; Maltecca, C. Genetic Data Analysis for Plant and Animal Breeding; Springer: Cham, Switzerland, 2017. [Google Scholar]
- R Core Team. R: A Language and Environment for Statistical Computing; R Foundation for Statistical Computing: Vienna, Austria, 2019. [Google Scholar]
- Mikola, J.; Paaso, U.; Silfver, T.; Autelo, M.; Koikkalainen, K.; Ruotsalainen, S.; Rousi, M. Growth and genotype × environment interactions in Betula pendula: Can tree genetic variation be maintained by small-scale forest ground heterogeneity? Evol. Ecol. 2014, 28, 811–828. [Google Scholar] [CrossRef]
- Zhang, S.; Morgenstern, E. Genetic variation and inheritance of wood density in black spruce (Picea mariana) and its relationship with growth: Implications for tree breeding. Wood Sci. Technol. 1995, 30, 63–75. [Google Scholar] [CrossRef]
- Huang, C.-L.; Lindström, H.; Nakada, R.; Ralston, J. Cell wall structure and wood properties determined by acoustics—A selective review. Holz Roh Werkst. 2003, 61, 321–335. [Google Scholar] [CrossRef]
- Baar, J.; Tippner, J.; Gryc, V. Wood anatomy and acoustic properties of selected tropical hardwoods. IAWA J. 2016, 37, 69–83. [Google Scholar] [CrossRef]
- Bhat, K. Variation in structure and selected properties of Finnish birch wood. 1: Interrelationships of some structural features, basic density and shrinkage [Betula pendula, B. pubescens]. Silva Fenn. 1980, 14, 384–396. [Google Scholar] [CrossRef]
- Fabisiak, E.; Helińska-Raczkowska, L. Variation in cell dimensions within single annual growth rings of birch wood (Betula pendula Roth.). Folia For. Pol. 1998, 29, 31–37. [Google Scholar]
- Bonham, V.; Barnett, J. Fibre length and microfibril angle in silver birch (Betula pendula Roth). Holzforschung 2001, 55, 159–162. [Google Scholar] [CrossRef]
- Rosvall, O. Review of the Swedish Tree Breeding Program; Skogforsk: Uppsala, Sweden, 2011. [Google Scholar]
- Seppä, H.; Nyman, M.; Korhola, A.; Weckström, J. Changes of treelines and alpine vegetation in relation to post-glacial climate dynamics in northern Fennoscandia based on pollen and chironomid records. J. Quat. Sci. Publ. Quat. Res. Assoc. 2002, 17, 287–301. [Google Scholar] [CrossRef]
- Beck, P.; Caudullo, G.; de Rigo, D.; Tinner, W. Betula pendula, Betula pubescens and other birches in Europe: Distribution, habitat, usage and threats. In European Atlas of Forest Tree Species; San-Miguel-Ayanz, J., de Rigo, D., Caudullo, G., Houston Durrant, T., Mauri, A., Eds.; Publication Office of the European Union: Luxembourg, 2016; pp. 70–73. [Google Scholar]
- Renou, F.; Scallan, Ú.; Keane, M.; Farrell, E.P. Early performance of native birch (Betula spp.) planted on cutaway peatlands: Influence of species, stock types and seedlings size. Eur. J. For. Res. 2007, 126, 545–554. [Google Scholar] [CrossRef]


| Trait | Code | Downy Birch | Silver Birch | Walsh’s t-Test | ||||||
|---|---|---|---|---|---|---|---|---|---|---|
| Units | n | Mean | St. Dev | n | Mean | St. Dev | Test Stat | p-Value | ||
| Height at age 5 | H5 | cm | 1036 | 358 | 12 | 145 | 447 | 12 | 9.86 | 0.00 |
| Diameter at age 10 | DBH10 | mm | 1006 | 50 | 21 | 141 | 79 | 27 | 12.26 | 0.00 |
| Diameter at age 15 | DBH15 | mm | 716 | 73 | 26 | 118 | 110 | 33 | 11.83 | 0.00 |
| Fissured bark height | FBH | cm | 710 | 14 | 13 | 118 | 69 | 33 | 18.08 | 0.00 |
| Grain angle | GA | ° | 623 | −1.7 | 1.6 | 106 | −2.0 | 1.5 | 2.36 | 0.02 |
| Acoustic velocity | AV | m s−1 | 389 | 3873 | 15 | 103 | 3892 | 16 | 0.69 | 0.49 |
| Pilodyn penetration | Pilo | mm | 647 | 17.8 | 2 | 112 | 17.4 | 2 | 1.81 | 0.07 |
| Wood density | DENSItrax | kg m−3 | 26 | 399 | 28 | 23 | 408 | 28 | 1.26 | 0.21 |
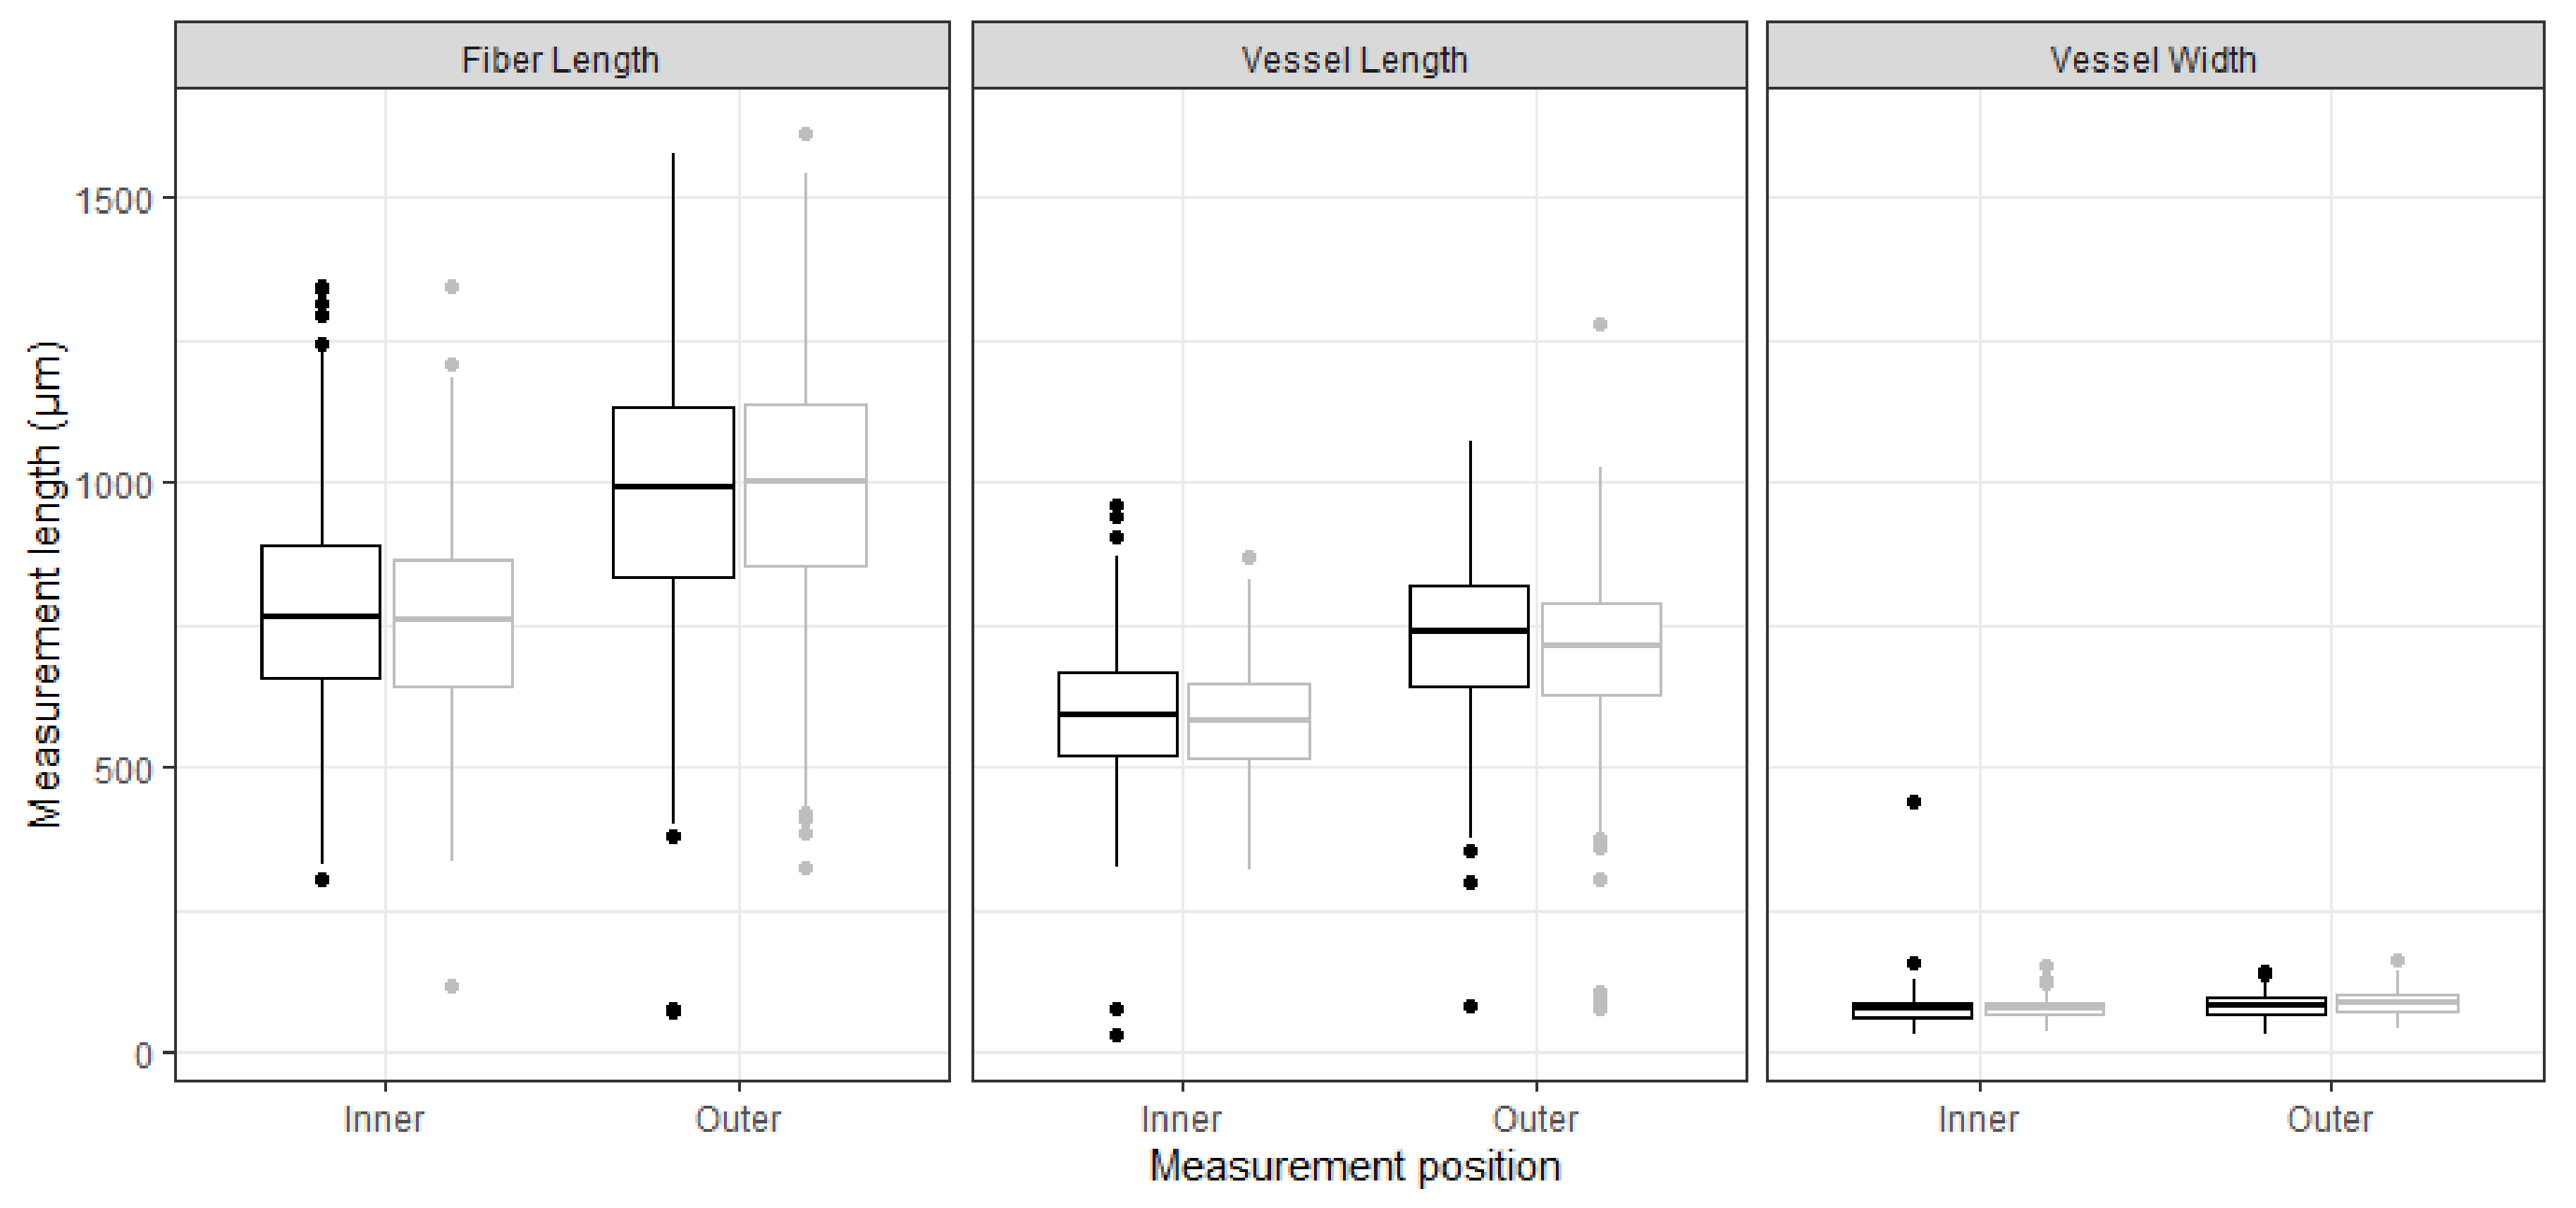
| Fiber length (outer) | FLO | μm | 19 | 987 | 74 | 15 | 994 | 101 | 0.35 | 0.73 |
| Vessel element length (outer) | VLO | μm | 19 | 729 | 63 | 15 | 706 | 81 | 0.83 | 0.41 |
| Vessel element width (outer) | VWO | μm | 19 | 86 | 8 | 15 | 94 | 16 | 1.72 | 0.10 |
| Trait * | Unit | Mean | CVP (%) ** | Min | Max | h2 | SE *** of h2 | CVG (%) **** |
|---|---|---|---|---|---|---|---|---|
| H5 | cm | 358 | 32 | 1 | 62 | 0.262 | 0.091 | 13.6 |
| DBH10 | mm | 50 | 41 | 1 | 110 | 0.212 | 0.079 | 8.0 |
| DBH15 | mm | 73 | 36 | 4 | 143 | 0.310 | 0.113 | 8.7 |
| BAng | class | 4.1 | 24 | 2 | 8 | 0.178 | 0.092 | 3.7 |
| BThk | class | 5.1 | 15 | 2 | 8 | 0.178 | 0.092 | 2.9 |
| BFrq | class | 4.6 | 22 | 2 | 8 | 0.201 | 0.093 | 4.3 |
| FBH | cm | 14 | 84 | 2 | 90 | 0.318 | 0.118 | 22.7 |
| STR | class | 4.1 | 31 | 1 | 8 | 0.290 | 0.107 | 7.3 |
| Pilo | mm | 17.8 | 11 | 13 | 23.5 | 0.599 | 0.165 | 3.3 |
| GA | ° | 1.95 | 71 | 2.75 | −10.7 | 0.197 | 0.096 | 18.0 |
| AV | (m s−1) | 3873 | 5.8 | 2907 | 6944 | 0.328 | 0.153 | 1.5 |
| Traits ** | H5 | DBH10 | DBH15 | Bang | BThk | BFrq | FBH | STR | Pilo | GA | AV | DENSItrax | FLO |
|---|---|---|---|---|---|---|---|---|---|---|---|---|---|
| H5 | 1 | 0.86 | 0.79 | 0.26 | 0.22 | 0.42 | 0.34 | 0.60 | 0.27 | 0.11 | 0.21 | 0.15 | 0.32 |
| DBH10 | 0.79 | 1 | 0.96 | 0.26 | 0.10 | 0.33 | 0.45 | 0.67 | 0.45 | 0.12 | 0.07 | 0.01 | 0.15 |
| DBH15 | 0.77 | 0.99 | 1 | 0.26 | 0.12 | 0.32 | 0.49 | 0.69 | 0.39 | 0.12 | 0.12 | 0.07 | 0.12 |
| Bang | 0.61 | 0.59 | 0.58 | 1 | 0.34 | 0.35 | 0.08 | 0.20 | 0.13 | 0.09 | 0.25 | 0.04 | 0.17 |
| BThk | 0.68 | 0.25 | 0.08 | 0.29 | 1 | 0.38 | 0.02 | 0.23 | −0.05 | 0.08 | 0.33 | 0.07 | 0.29 |
| BFrq | 0.26 | −0.11 | −0.06 | 0.25 | 0.68 | 1 | 0.06 | 0.36 | 0.04 | 0.11 | 0.41 | 0.07 | 0.03 |
| FBH | 0.12 | 0.23 | 0.32 | 0.09 | −0.15 | −0.17 | 1 | 0.25 | 0.19 | 0.12 | −0.04 | 0.26 | 0.10 |
| STR | 0.30 | 0.58 | 0.51 | 0.33 | 0.09 | −0.02 | −0.31 | 1 | 0.25 | 0.12 | 0.28 | −0.13 | 0.12 |
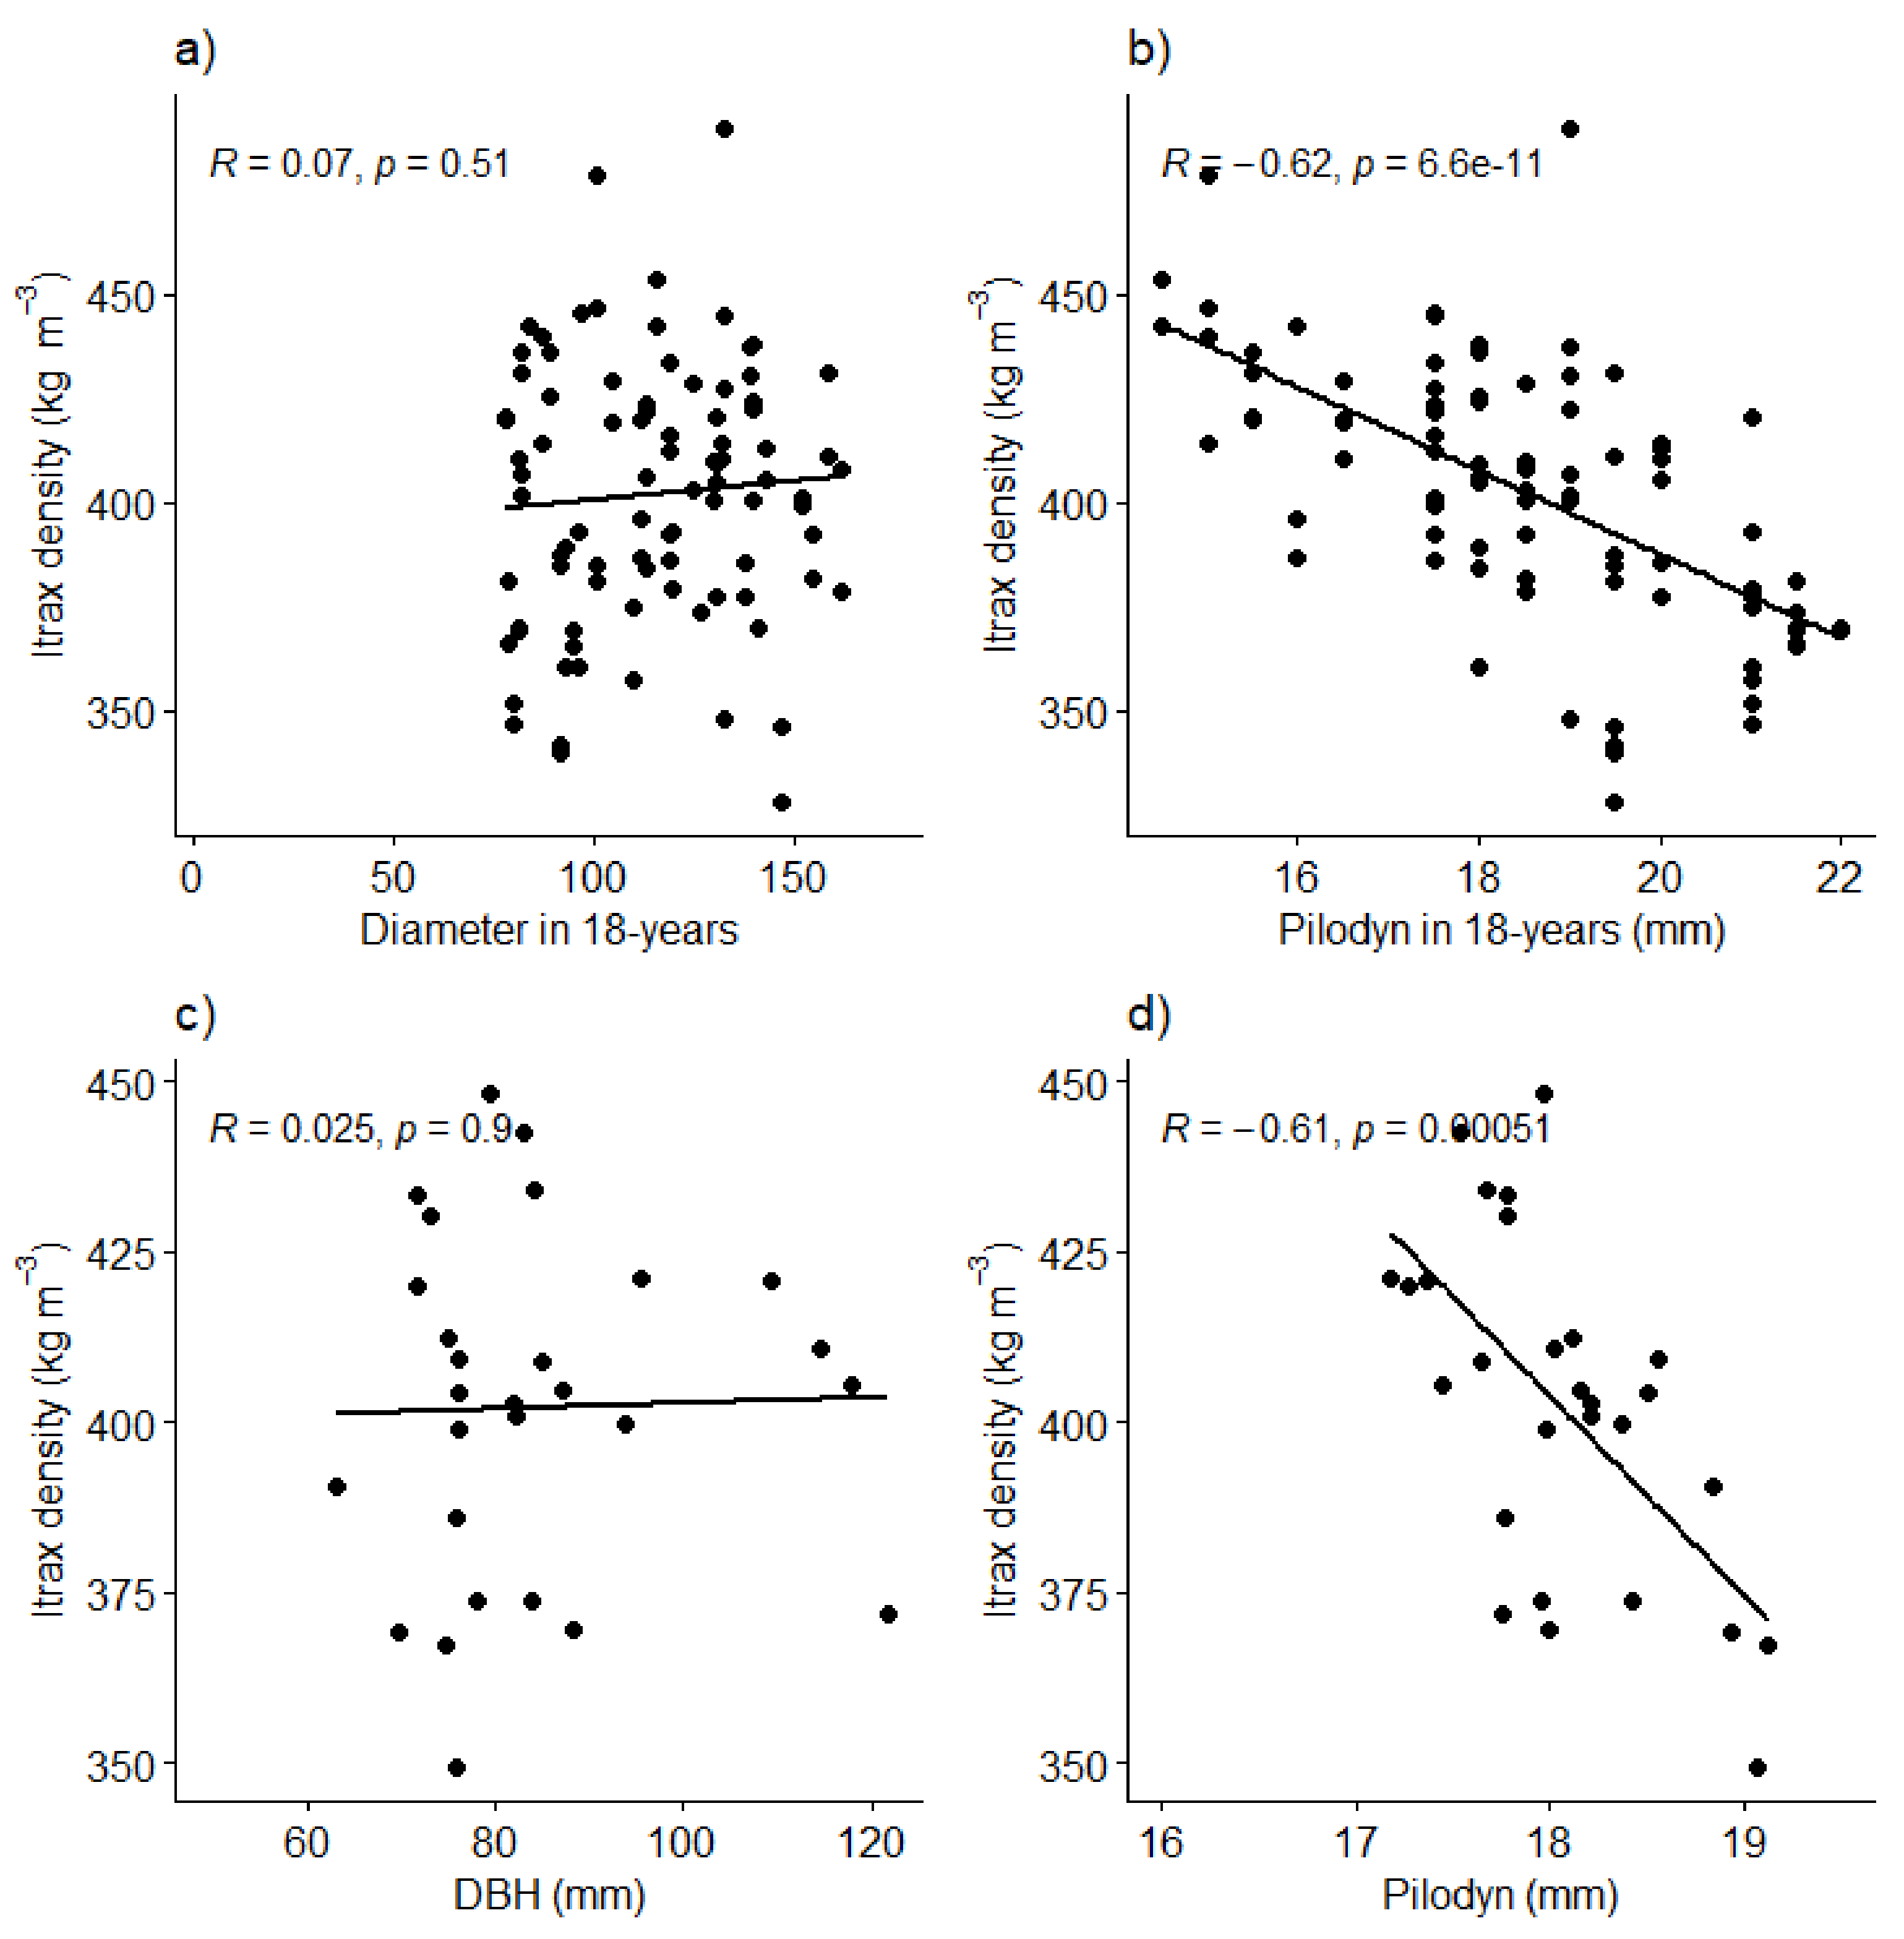
| Pilo | 0.35 | 0.51 | 0.45 | 0.38 | −0.29 | −0.20 | 0.30 | 0.28 | 1 | 0 | −0.18 | −0.64 | −0.05 |
| GA | 0.15 | 0.33 | 0.50 | 0.32 | −0.13 | −0.12 | −0.11 | −0.22 | −0.11 | 1 | 0.25 | 0.20 | −0.12 |
| AV | −0.25 | NC | NC | −0.17 | −0.14 | −0.29 | NC | NC | −0.82 | 0.35 | 1 | 0.11 | 0.59 |
| Trait * | FLI | VLI | VWI | FLO | VLO | VWO | DBH15 | GA | AV | Pilo |
|---|---|---|---|---|---|---|---|---|---|---|
| FLI | 1 | 0.91 | 0.44 | 0.61 | 0.52 | 0.27 | 0.18 | −0.09 | 0.53 | 0.24 |
| VLI | 0.61 | 1 | 0.52 | 0.72 | 0.66 | 0.33 | 0.34 | −0.01 | 0.54 | 0.23 |
| VWI | 0.21 | 0.35 | 1 | 0.43 | 0.43 | 0.43 | 0.40 | 0.19 | 0.48 | 0.24 |
| FLO | 0.63 | 0.68 | 0.60 | 1 | 0.72 | 0.26 | 0.12 | 0.04 | 0.56 | 0.15 |
| VLO | 0.51 | 0.64 | 0.45 | 0.85 | 1 | 0.20 | 0.17 | −0.01 | 0.44 | 0.53 |
| VWO | 0.04 | 0.25 | 0.05 | 0.39 | 0.35 | 1 | 0.32 | 0.16 | 0.40 | 0.30 |
| DBH15 | −0.19 | 0.32 | 0.32 | 0.16 | 0.08 | 0.13 | 1 | 0.48 | 0.25 | 0.23 |
| GA | −0.14 | 0.08 | 0.21 | −0.09 | −0.12 | −0.19 | 0.59 | 1 | 0.66 | −0.08 |
| AV | 0.43 | 0.56 | 0.34 | 0.69 | 0.64 | 0.45 | 0.38 | −0.12 | 1 | −0.05 |
| Pilo | 0.00 | 0.32 | 0.41 | 0.06 | 0.13 | −0.03 | 0.20 | 0.30 | −0.15 | 1 |
Disclaimer/Publisher’s Note: The statements, opinions and data contained in all publications are solely those of the individual author(s) and contributor(s) and not of MDPI and/or the editor(s). MDPI and/or the editor(s) disclaim responsibility for any injury to people or property resulting from any ideas, methods, instructions or products referred to in the content. |
© 2023 by the authors. Licensee MDPI, Basel, Switzerland. This article is an open access article distributed under the terms and conditions of the Creative Commons Attribution (CC BY) license (https://creativecommons.org/licenses/by/4.0/).
Share and Cite
Jones, G.; Liziniewicz, M.; Lindeberg, J.; Adamopoulos, S. Non-Destructive Evaluation of Downy and Silver Birch Wood Quality and Stem Features from a Progeny Trial in Southern Sweden. Forests 2023, 14, 2031. https://doi.org/10.3390/f14102031
Jones G, Liziniewicz M, Lindeberg J, Adamopoulos S. Non-Destructive Evaluation of Downy and Silver Birch Wood Quality and Stem Features from a Progeny Trial in Southern Sweden. Forests. 2023; 14(10):2031. https://doi.org/10.3390/f14102031
Chicago/Turabian StyleJones, Grace, Mateusz Liziniewicz, Johan Lindeberg, and Stergios Adamopoulos. 2023. "Non-Destructive Evaluation of Downy and Silver Birch Wood Quality and Stem Features from a Progeny Trial in Southern Sweden" Forests 14, no. 10: 2031. https://doi.org/10.3390/f14102031
APA StyleJones, G., Liziniewicz, M., Lindeberg, J., & Adamopoulos, S. (2023). Non-Destructive Evaluation of Downy and Silver Birch Wood Quality and Stem Features from a Progeny Trial in Southern Sweden. Forests, 14(10), 2031. https://doi.org/10.3390/f14102031