Abstract
The activity characteristics of the village and its symbiotic relationship with the environment play an important role in the sustainable development of the surrounding environment. Miao villages have a long history. In the process of long-term interaction with the surrounding natural environment, Miao villages have formed a unique forest culture, which has an important impact on the distribution of the surrounding forests and plays a crucial role in local forest management. In this study, we took the Miao villages of China that are distributed in Qiandongnan Miao and Dong Autonomous Prefecture of China as an example and constructed a research framework to study the interaction between the natural environment and human activities around the Miao villages and its impact on forest change based on partial least squares structural equation modeling (PLS-SEM) and geographically weighted regression modeling (GWR) methods. The validity and reliability evaluations showed that the PLS-SEM model was reasonable. The results showed that the Miao villages were randomly distributed within 0–2 km and clustered in the 8–10 km buffer zone. The temporal variation of the forest landscape around the Miao villages was small, and the spatial heterogeneity was obvious. Within the 0~2 km buffer zone, the proportion of closed-canopy forest was the largest, and with the increase in the buffer zone radius, the proportion of closed-canopy forest gradually decreased, the open-canopy forest gradually grew, and the proportion of shrubbery and other forests showed an upward trend first and then a downward trend. Temporally, the four forest landscapes did not change much, with closed and open forests sliding, and shrubbery and other forests increasing. Regarding the drivers of forest structure change, topographic factors and landscape patterns had a positive effect on forest structure, while human activities had a negative effect. The influence of topography on human activities in the Miao villages weakened the direct positive effect of topography on forests and promoted the positive effect of the landscape pattern on forests. There were significant spatial differences in the GWR regression coefficients of the effects of different factors on forest structure in 2020, with a pivotal negative correlation between NDVI and night-time light data. In addition, the higher the elevation, the more unfavorable the distribution of open-canopy forests and the better the distribution of closed-canopy forests. The higher the slope, the higher the NDVI but the more unfavorable the distribution of closed-canopy forests. In general, the impacts of Miao villages on forest structure are highly complex and interactive, with both direct and indirect effects. Different factors interact to affect the structure of the forest. The study on the effect of Miao villages on forests is helpful for more targeted forest protection and the formulation of laws and regulations, so as to find a balance between human activities and forest management, in order to maintain the ecological balance of local areas. This study introduced the PLS-SEM model to investigate the impacts of Miao villages on forest structure, which effectively enhanced our understanding of the drivers and impacts of forest change and provides theoretical support and a basis for forest protection and management.
1. Introduction
Forests cover nearly one third of the Earth’s land and they provide, directly or indirectly, important health benefits for all people [1,2]. The stability of forest ecosystems plays a critical role in human survival and well-being by supporting water, blocking wind and sand, and maintaining biodiversity, global energy flows, and material cycles [3,4]. Unfortunately, as global climate change and the human footprint continue to expand, the size and quality of forests continue to decline [5,6]. According to the Global Forest Goals Report 2021 published by the United Nations, “the global forest area declined by 1.2% between 2010 and 2020”, [7] so, in the ongoing global effort to curb the biodiversity crisis, mitigate climate change, and achieve the Sustainable Development Goals, maintaining and, where possible, restoring forests is an urgent task [8]. Forests play a key role in meeting social needs and policy objectives and determine the overall level and effectiveness of sustainable development [9]. At present, there are a number of studies on forest population ecology and forest ecosystem ecological processes [10,11,12], but there are relatively few studies on the driving factors and influencing mechanisms of forests. The study of the factors affecting forest distribution has been a key issue in ecological research [13,14]. Currently, some scholars have studied the drivers and mechanisms of forest distribution, including natural factors and anthropogenic effects. The effects of natural factors on forest distribution mainly focus on terrain, climate, and soil. Ma et al. studied the changes in ecosystem service functions of different forest types on different topographic gradients. The results showed that the ecosystem services of different vegetation types were different. Except for the water yield, natural forests provided more ecosystem services than other vegetation types [15]. Ogresses et al. explored the effects of climate on forests and on tribal cultures and resources, demonstrating that humans can use different sources and types of knowledge, including local ecological knowledge, to mitigate and adapt to climate change [16]. Mukhortova studied the contribution of soils to the carbon budget of forests in Russia [17]. The study of human factors affecting forests mainly includes human production activities, ecological policies, urbanization, and the cultural landscape. Johann et al. studied the impact of human activities, especially glass production, on mountain forests. They showed that human activities, including glass production and charcoal production, are responsible for intensive deforestation [18]. Beche studied the spatial variability of anthropogenic disturbances in African mountain forests and their effects on forest structure and biodiversity. The intersection between edge effects and forest degradation is context-specific and largely depends on how forests are used by a given society [19]. Lemus-Lauzon et al. documented the link between human disturbance and stand composition and structure, arguing that changes in land use patterns due to anthropogenic demand change as a driver of forest dynamics in forested landscapes [20]. Wang et al. observed the landscape changes and sustainable development around different types of ethnic villages driven by reforestation policies, and it was found that the application of the GGP policy promoted the protection of forests around the ethnic villages in Qiandongnan Prefecture [21]. Cui et al. quantified the impact of the presence and spatial distribution of Buddhist monasteries on forests using two spatial association features, point-points and point-areas, and the presence of monasteries was found to be highly correlated with the protection of natural ecosystems, especially grasslands and forests [22]. Rath et al. examined species richness in sacred forests and its role in biodiversity conservation, proving that forests used by humans can contribute to biodiversity conservation by preserving more tree diversity than forests used by humans [23]. Grace et al. examined the urbanization gradient in India in terms of sacred preferences for forest and temple attributes and found that urbanized respondents were likely to have higher perceptions of the value of unsacred and unused forests [24]. In recent years, there have been some studies combining natural factors and human factors to study their common effects. For example, Lingner et al. used linear regression models to simulate changes in forest attributes caused by terrain and human activities at different spatial scales in subtropical Atlantic forests, providing evidence that human activities cause disturbances such as edge effects and habitat fragmentation/isolation at different spatial scales [25]. Garbarino et al. used multivariate statistical analysis (ranking and SEM models) to link forest structure, anthropogenic impacts, land use, and topography [26]. Terrain, human activities, and the landscape pattern influenced by them do not only have a single effect on the surrounding environment, but may interact and influence each other. Therefore, how to analyze the drivers of forest structural changes and identify their mechanisms of action have become a major issue of interest in recent years [27,28,29].
The Miao people are widely distributed around the world, mainly in the southwest of China, as well as Laos, Vietnam, Thailand, and other countries and regions in Southeast Asia. The history of the Miao people can be traced back to ancient times. According to historical records, the ancestors of the Miao people first lived in the middle and lower reaches of the Yellow River [30]. Due to the continuous migration of the Miao people from generation to generation, the footprints of the Miao people have been widely dispersed in Asia, Europe, America, Australia, and other continents [21]. According to China’s Fifth Census, the population of the Miao people ranks fifth among the ethnic minorities in China. With the evolution of history, the Miao people have formed a rich traditional culture and lifestyle in terms of material (farming and living), spiritual (ideas and religion), and institutional (regulations and civil covenants) aspects [31]. The Miao people take farming and economic planting as the main means of production and life. In terms of religion, the Miao people have diversified beliefs and have their own primitive religious beliefs [32]. The Miao believe that there are spirits in all things—for example, there are spirits in the mountains, rivers, trees, etc., in nature [33]. During the long history of human interaction with nature, the Miao have formed traditional ethnic villages reflecting the characteristics, history, and culture of the Miao, and they carry the traditional ecological view of the Miao thatches as having a significant impact on the surrounding environment. This is most evident in Qiandongnan Prefecture in Guizhou Province, China. Qiandongnan Prefecture is one of the key collective forest areas in China and is known as the “Forest State”. Due to its unique geomorphology and soil and climate types, it has rich forest resources and a complex and diverse forest ecology. It is also the region with the largest Miao population, housing nearly a quarter of the country’s Miao population and the largest Miao village in the country, Miao Village, which has a history of thousands of years. Most of the Miao villages are located on the mountainsides or at the foot of the mountains, and are often surrounded by forests, thus forming a rich forest culture, which mainly includes slash-and-burn farming, hunting, and gathering on the material level, and forest culture on the spiritual level, mainly in folklore (such as sacred mountains and forests, plant and animal worship, etc.), literature (such as forest-related literature, etc.), philosophy (ecological ethics, etc.), village rules and regulations on the institutional and technical level, and forest protection and a culture of knowledge, etc. [34,35].
The long-term interactive practice between Miao villages and forests is not only reflected in the fact that Miao villages are influenced by forests, but also allows Miao villages to develop a splendid and rich forest culture based on their long-term production and living experience, which is highly vital in local forest management [36]. Some studies have shown that forests are an important consideration in the layout of Miao villages, which are mostly surrounded by forests [21,37]. The favorable forest vegetation protects the water source, and the spring water flowing from the highest cave of the village is constant throughout the year. For example, the Miao people believe in the god of the forest and always keep small patches of forest near or within the village as the so-called sacred forest [34]. In the process of production, various forms of forest management and protection systems have gradually developed within the Miao villages, which strictly regulate the daily management of forest resources and the order of their use. These customs are of paramount importance in maintaining the harmony and stability of local communities, protecting the traditional culture, promoting the rational development and utilization of land resources, and promoting the sustainable use and protection of biological resources, especially forests [35,38]. However, with the advancement of modernization, the increased opportunities for Miao villages to interact with the outside world have led to impacts on the traditional Miao culture and lifestyle, and the impact on the surrounding land use practices, including forests, has also changed [39]. Therefore, studying the mechanism and change pattern of the influence of Miao villages on the surrounding forests and exploring the spatial connection between forests and Miao villages can provide an important reference and theoretical basis for the protection and management of forests and the sustainable development of Miao villages under the modernization process.
There are many other cases of interaction between ethnic areas and forests. Cuni-Sanchez et al. examined the importance of livelihood strategies and ethnicity in the perception of forest ecosystem services through focus group discussions and found that groups from different cultural backgrounds make trade-offs when different ecosystem supplies change; the evolution of ethnicity can also have an impact on economic development, social trust, and democracy [40]. Rotaru et al., based on a hybrid approach of descriptive statistical analysis, identified the evolution of ethnic dynamics in post-communist Romania and applied ethnic fractionation and polarization indices [41]. Reang D et al. demonstrated that ethnic homestead forests or traditional agroforestry systems (TAFS) can achieve sustainable production, the in situ conservation of biodiversity, and climate change mitigation while maintaining cultural values [42]. O’Brien T et al. studied ethnic migration due to social, economic, and political factors that allow social and cultural relations to arise and reproduce, resulting in different forms of acceptance or rejection [43].
At present, scholars have applied a variety of methods to explore the impact of multiple drivers on various land use types, such as correlation analysis [44], linear regression models (OLS models, etc.), geographical weighted regression models (GWR models, etc.) [45,46], residual analysis [47], etc. These methods can study the correlation and significance of various factors and land types, or reflect the heterogeneity of variables in space, so that the mutual relationship between variables changes with the change in spatial location. However, these methods cannot explain the path mechanism of the influence of variables, nor can they determine the direct and indirect effects of variables. In recent years, structural equation modeling (SEM) has been widely used in the field of social science and behavioral science and is also gradually used in the field of natural science [48,49]. SEM is a multivariate statistical technology that integrates factor analysis and path analysis. Compared with the above methods, its advantage lies in the quantitative study of the interaction relationship between multiple variables, which can display the driving force analysis in a three-dimensional and multi-level way and include the attributes that cannot be directly measured in the analysis, while quantifying the causal relationships between various attributes [50]. Among them, the variance-based partial least square method (PLS-SEM) combines principal component analysis with multiple regression and performs iterative estimation, which requires a smaller sample size and is more suitable for the verification, exploration, and development of theories. Based on the above advantages, PLS-SEM models have been widely used in many areas to analyze the effects of multiple driving factors on plant and animal diversity, land or vegetation cover, etc. [51]. Currently, most of the related studies use PLS-SEM models for spatial correlation analysis and driver analysis, and the research scales are mostly focused on urban clusters. For example, Zhu et al. combined the data envelopment analysis (DEA) super-efficient SBM model with the partial least squares structural equation model (PLS-SEM) to analyze the land use efficiency and drivers of different cities [52]. Wang et al. used redundancy analysis (RDA) and partial least squares structural equation modeling (PLS-SEM) to study the relationship between the LULC model and water quality, etc. [51]. However, relatively few studies have used PLE-SEM models to study the influence of cultural landscapes on the spatial distribution patterns of surrounding lands. The establishment of a buffer zone is an effective method to analyze the influence range and degree of geographical factors on the surrounding environment. By establishing a buffer zone centered on the village point, the influence of the village on the surrounding area can be calculated quantitatively. Therefore, in this paper, based on data from the buffer zones of Miao villages, we use the PLS-SEM model and geographic regression weighting model to analyze the influence paths and mechanisms of Miao villages on the surrounding forests and the spatial linkage between them, filling the gap in the current research on the influence of human landscape on forests.
This study attempts to explore the ecological structure of landscape protection under the conditions of human activities/land use, especially the long-term interaction between the natural environment and human activities around traditional Miao villages and their impact on forest change, including the change in forest structure and the spatial change of the forest in the landscape. This study aims to understand the nature and mechanism of this research problem, trying to find a balance between human activities and forest quality, and integrate the ethnic cultural background, in order to maintain a better ecological balance in the entirety of landscape space management. GIS technology, the PLS-SEM model, and the geographical regression weighted model were used to analyze the mechanisms and direct and indirect effects of human activities on forest structure. This paper attempts to prove the following hypotheses: (1) the Miao village is located at a high elevation and slope, and the surrounding forest structure is different in space and time; accordingly, the Miao village has an impact on the surrounding forest structure; (2) Miao villages have direct and indirect effects on the surrounding forests, and different factors interact to affect the structure of the forest; (3) the factors affecting forest structure have spatial heterogeneity. By identifying the complex responses of forests to multiple driving factors, this work fills the gap in the study of the impact of natural factors and traditional villages on forests and provides an important reference for forest protection, restoration, and sustainable development.
2. Materials and Methods
2.1. Study Area
The study area is located in the southeastern part of Guizhou Province, China, in the Qiandongnan Miao and Dong Autonomous Prefecture (Qiandongnan Prefecture), with longitude and latitude 107°17′20″–109°35′24″ S, 25°19′20″–27°31′40″ N (Figure 1). The study area includes 16 cities or counties, with a total area of 30,282.34 km2, and the topography is high in the west and low in the east, sloping from the west to the north, east, and south, with a maximum altitude of 2178 m [53]. The study area is a subtropical monsoonal climate zone with an average annual temperature of 16 °C and average rainfall of 1200 mm. Forest resources are abundant here, with a forest coverage rate of 67.98%, making it an important ecological barrier in the upper reaches of the “two rivers”.
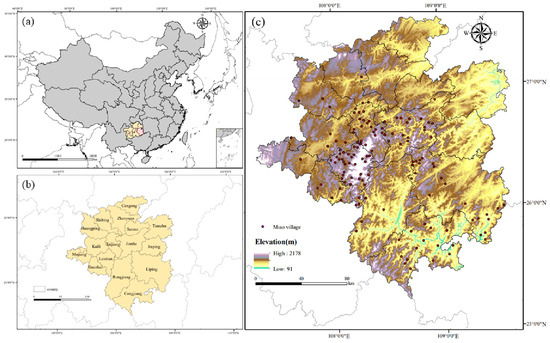
Figure 1.
The location and elevation of Qiandongnan Prefecture. (a) Location of Qiandongnan Prefecture in China; (b) Counties in Qiandongnan Prefecture; (c) The distribution of Miao villages in Qiandongnan Prefecture.
The economic development of Qiandongnan Prefecture is slow, mainly in the tertiary industry. As of 2021, the gross regional product of Qiandongnan Prefecture is 125.503 billion yuan, up 5.2% from the previous year, with a resident population of 3,740,400 [54].
Qiandongnan Prefecture has a strong ethnic composition, with 33 ethnic groups, such as Miao, Dong, Han, and Buyi, etc. The resident population of ethnic minorities accounts for 80.3% of the total registered population, among which the Miao population accounts for 42.5%, making this the most concentrated area of the Miao population in China, and it has high cultural value. The Miao populations are clustered in the form of ethnic villages, which are built on mountains, surrounded by forests.
2.2. Data Sources and Processing of the Variables
In this work, we analyzed a large amount of data to determine the factors affecting the structural changes of the forest around the Miao villages. Digital elevation model (DEM) data (resolution 30 m × 30 m) were obtained from the National Earth System Science Data Sharing Platform [55], and the slope was obtained from digital elevation model (DEM) data using ArcGIS 10.4. Construction land and cultivated land data were extracted from remote sensing data of land use in 1990, 2000, 2010, and 2020 from the Resource and Environment Science and Data Center of the Chinese Academy of Sciences (http://www.resdc.cn/, accessed on 7 September 2022), and their scales were calculated using ArcGIS 10.4. The land use data covered 1990, 2000, 2010, and 2020, with a spatial resolution of 30 m. Night-time light data representing the intensity of power infrastructure were provided by the Defense Meteorological Satellite Program Operational Line Scan System (DMSP/OLS). The land use data were input and the edge density, maximum patch index, and average patch area were calculated using the fragstats 4.2 software [56]. Four forest-related variables, closed-canopy forest, open-canopy forest, garden, and Normalized Difference Vegetation Index (NDVI), were used to characterize the forest structure. The GDP data were the product of the GDP statistics of the county administrative area where the grid unit was located and the weight ratio of standardized land use types and resident density GDP. The data of forests were also obtained from land use data. Among them, closed-canopy forests were defined as natural and planted forests with densities >30%, including timber forests, economic forests, protection forests, etc. Open-canopy forests were defined as forests with densities of 10%–30%. Using ArcGIS’s resampling technique, all data were standardized at a uniform resolution of 30 m. Table 1 shows the categories, scales, and data sources of the explanatory variables.

Table 1.
The categories and data sources of explanatory variables.
The traditional village data in this paper came from the Global Change Scientific Research Data Release System, and the village coordinates were extracted from the three batches of Chinese traditional village lists released by the Ministry of Housing and Urban-Rural Development, the Ministry of Culture, and the Ministry of Finance in December 2012, August 2013, and November 2014, respectively. Based on our survey data in Qiandongnan Prefecture in the past ten years, the list of ethnic minority villages in Qiandongnan Prefecture, and the census data of the Qianzhen million villages in Guizhou Province, the ethnic attributes of each village were determined, and 137 representative traditional Miao villages in the region were finally selected as sample points for analysis and research.
2.3. Spatial Distribution Pattern and Significance Test of Miao Ethnic Village Landscapes
2.3.1. Ripley’s K Function
Ripley’s K function is the most commonly used method to analyze the distribution patterns of point-like attributes at any scale. By calculating Ripley’s K function, we can obtain the distribution pattern change of point event with a spatial research scale or distance. Ripley’s K function is then used to indicate the extent to which the centers of mass of these elements are spatially clustered or diffused, and how they change as the size of the neighborhood changes. We use Ripley’s K function for point pattern analysis, which treats the local landscape as a point in space and draws a point location distribution map. There are three distribution patterns of control points (ethnic villages): random distribution, aggregated distribution, and discrete distribution [57]. The formula of Ripley’s K function is as follows:
where A represents the total area of the study area, n is the total number of control points, d is the distance scale, and di,j represents the distance between point i and point j. To keep the variance stable, Besag proposed to replace K(d) with L(d) and to make an open-square linear transformation of K(d). Under the assumption of a random distribution, the expectation of L(d) is 0. The formula of L(d) is
Ripley’s K function analysis was performed on the point location maps of each landscape type using the multi-distance spatial cluster analysis (Ripley’s K function) tool in the spatial statistics toolbox of the ArcGIS 10.4 software [58].
2.3.2. Monte Carlo Significance Test of Ripley’s K Function
A Monte Carlo simulation was used to test the significance of Ripley’s K index deviation from randomness. The starting distance and distance step were set to 2 km; the confidence level was set to 99.9%; the boundary correction was set to simulation outer boundary values. The calculated results in .dbf format were imported into the Excel software 2019, and the distance values d, the observed values L(d), the upper packet trace (HiConfEnv), the lower packet trace (LowConfEnv), and the relationship between the d value and the difference in the L(d) value DiffK were calculated. If the L(d) value was larger than the upper packet trace, the landscape type was significantly aggregated; if the L(d) value was smaller than the lower packet trace, the landscape type was significantly uniformly distributed; if the L(d) value lay between the upper and lower packet traces, the landscape type was significantly randomly distributed. When the L(d) value was greater than the d value, and the farther the two curves are apart, i.e., the larger the DiffK value, the more the spatial distribution of the landscape type was aggregated. When the L(d) value was less than the d value, and the farther the two curves are apart, i.e., the smaller the DiffK value, the more discrete the spatial distribution of the landscape type was. The values at different distances may show aggregation or dispersion at some distance scales, while, at other distance scales, there is none [57,59].
2.4. The Establishment of a Buffer Zone
Buffer analysis is a technique to create a buffer area based on points, lines, or planes in a geographic location by a given distance or range. These buffer areas can be used to analyze and predict the features, resource distribution, and potential risks around a location. The diffusion distance determines the influence range and mutual gravity of the point, and it is generally believed that the closer to the central point, the greater the impact. The impact of traditional villages on their surroundings can be measured by establishing buffer zones [22,60]. In order to further explore the influence of Miao traditional villages on each variable and combine the area and precision of the study area, we established buffers in the ArcGIS 10.4 software with the Miao village point as the center and r as the radius (r1 = 2 km, r2 = 4 km, …, r5 = 10 km) and extracted the values of different explanatory variables within the buffer for analysis [61,62].
2.5. Structural Equation Modeling
SEM is a statistical analysis technique including factor analysis and path analysis, which is suitable for the study of the relationships between multiple variables. The SEM model is a validated quantitative multivariate causality method that incorporates factor analysis, regression analysis, and path analysis. Among them, the structural analysis method based on partial least squares (PLS), which combines principal component analysis with multiple regression and iterative estimation, can estimate relatively complex models without strict requirements on variables as well as error distribution, and can computationally handle both measurement models and structural equation models [63,64,65]. We selected the PLS-SEM model to study the impact of Miao villages on the surrounding forests.
2.5.1. PLS-SEM Model
The PLS-SEM model analyzes the causal relationships between multiple variables with the covariance matrix as the core, including measurement models and structural models as two basic models. The measurement model describes the relationships between the latent variables and their corresponding observed variables with the following equations:
Equations (3) and (4) are the endogenous and exogenous variables, respectively. Λx is the factor loading matrix of the exogenous measurable variable on the exogenous latent variable ξ; Λy is the factor loading matrix of the endogenous measurable variable on the endogenous latent variable η; δ and ε are the measurement model error terms.
The structural model reflects the causal relationship between endogenous latent variables and exogenous latent variables with the following expressions:
where η is the endogenous latent variable, ξ is the exogenous latent variable, and Β denotes the effect of the exogenous latent variable on the endogenous latent variable. Γ is the path coefficient, which measures the effect of the exogenous latent variable on the endogenous latent variable, and ζ is the structural model residual term [51].
2.5.2. Model Variable Factors
In this study, taking Qiandongnan Prefecture as an example and combining the actual situation of the study area, the elevation, slope, edge density, maximum patch index, average patch area, proportion of construction land, GDP, night-time light, and proportion of cultivated land were selected as explicit variables, and the topography, landscape pattern, and human activities were used as latent variables to compile and calculate 13 evaluation indicators to construct the PLS-SEM model. The PLS-SEM model used a 30 m × 30 m raster integrated dataset to rasterize the GDP, night-time light, and elevation data into raster layers, and the average pixel value of each raster was used as the sample set. In addition, the proportion of construction land and the proportion of cultivated land in each cell of the grid were calculated.
2.6. Geographically Weighted Regression Modeling
A GWR model is a type of spatial regression model that uses the weight of the geographical location to explain the spatial relationships between model variables and dependent variables. By setting different geographical weights, more accurate regression analysis results can be obtained. In the GWR model, each geographical location corresponds to an independent regression equation, and the parameter values of these equations can be different. According to the results of the PLS-SEM model, in order to further study the effects of different variable factors on the forest space, the GWR model was used for analysis. In the case of the obvious spatial differentiation of variables, the geographically weighted regression model can well solve the problem of spatial non-stationarity by calculating the local parameters of the regression model, thus improving the goodness of fit of the model and displaying the spatial non-stationarity of the relationships between variables. The parameters of the GWR model are functions of position i, and the estimated parameters change as the spatial position i changes. The GWR model can be expressed as in the following formula:
where is the spatial location of the ith sample point; xik is the independent variable at the ith sample point; β0 is the constant term estimate at the ith sample point, βk is the regression parameter estimate for the kth independent variable at sample point i; p is the number of independent variables at the ith sample point; and εi is the residual correction term [66,67].
3. Results
3.1. The Spatial Distribution Pattern of Miao Traditional Ethnic Villages
Miao villages are mainly distributed in the central and western parts of Qiandongnan Prefecture, i.e., the Leigong Mountain area, where the terrain is more complex. The elevation and slope of the Miao villages are as shown in the Figure 2, mainly concentrated in the distribution range of 600–1000 m and 5–30. Relatively speaking, the Miao villages are located at a higher elevation and steeper slope. The spatial distribution of the Miao villages is mainly in two patterns of aggregation and randomness, and there is no significant discrete distribution pattern. Among them, within the buffer zone with a radius of 2 km, the distribution is mainly random, while, within the buffer zone of 2–10 km, the distribution is mainly aggregated.
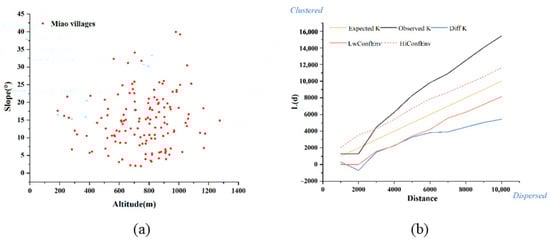
Figure 2.
Distribution of Miao villages in elevation and slope: (a) average elevation and slope of Miao village; (b) spatial distribution patterns of Miao villages at different distances.
3.2. Spatio-Temporal Variation Characteristics of Forest Structure around Miao Villages in Different Buffers
Figure 3 shows the proportions of closed-canopy forest, open-canopy forest, shrubbery, and other forests in different buffer zones around the Miao villages and their changes in 1990–2020, reflecting the influence of the Miao villages on the surrounding forest landscape. According to the results in Figure 3, the proportions of the four forest landscapes showed spatial heterogeneity in different buffer zones, and there was a certain pattern of change in time. Among them, spatially, the proportion of closed-canopy forests gradually decreased with the increase in the buffer radius, and it was especially significant in the 0–2 km buffer. On the other hand, the spatial trend of open-canopy forests was the opposite to that of closed-canopy forests, and the proportion of open-canopy forests gradually increased with the increase in the buffer radius; it reached the maximum in the 8–10 km buffer zone. The proportions of shrubbery and other forests, additionally, showed an increasing and then decreasing trend with the increase in the buffer radius, with the proportion of shrubbery reaching its maximum within the 2–4 km buffer zone, while the proportion of other forests was maximum within the 4–6 km buffer zone. In Qiandongnan Prefecture, especially around the Miao villages, the closed-canopy forests mainly include timber forests, economic forests, and shelterbelts. In addition, people in Miao villages have the custom of planting fengshui trees. They often plant fir, pine, walnut, and persimmon trees around the village entrance, houses, mausoleums, and mountains, which are regarded as fengshui trees and belong to this category. The Miao’s unique traditional culture and religious beliefs also mean that many trees around Miao villages exist as “sacred forests”, and these also mainly include tree species with a canopy of more than 30%. Open-canopy forests are mainly unclosed young forests; shrubland and other forests are mainly used for ornamental and decorative trees.
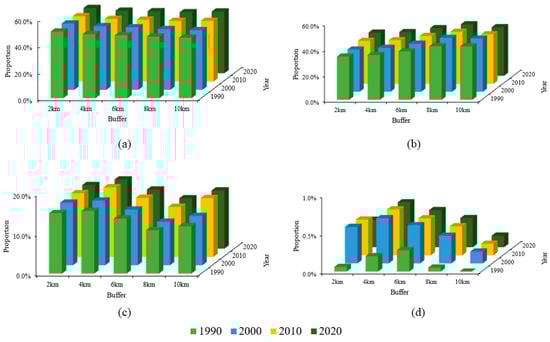
Figure 3.
Changes in forest structure around Miao villages in different buffers. (a) Closed-canopy forests; (b) open-canopy forests; (c) shrubbery; (d) other forests.
Over time, the proportion of closed-canopy forests decreased slightly in all buffer zones except the 8–10 km buffer zone from 1990 to 2020, and the change was not significant. Open-canopy forests, on the other hand, declined within all buffers, with the largest proportion in 1990. Shrubbery and other forests showed an increasing trend, reaching a maximum in 2020. Overall, the forest landscape around the Miao village had relatively little change in time and obvious spatial heterogeneity, which suggests that the distribution of the forest landscape may be affected by the Miao villages.
3.3. Indicators of Association between Villages and Forest Changes Based on PLS-SEM Model
3.3.1. Tests of the Measurement Model and Structural Equation Model
Due to the existence of measurement errors, in order to verify the scientificity of the model, it is necessary to test the reliability and validity of the data. Reliability refers to the stability of the measurement results, and the smaller the measurement error, the higher the stability of the results [68]. In order to effectively evaluate the reliability of the PLS-SEM model, composite reliability (CR) and Cronbach’s α are used for evaluation. It can be seen from the Table 2 that the Cronbach’s α coefficient of the four potential variables is greater than 0.7, and CR is greater than 0.65. The results show that the fitting data of the four measurement models have good reliability.
Table 2.
Reliability and validity assessment of the PLS-SEM model.
Convergence validity is used to test correlations between latent variables. Average variance extraction (AVE) is a common index to evaluate the validity of convergence. When AVE is greater than 0.5, the model can be considered to have sufficient convergence validity. In this paper, average variance extraction (AVE) is used to verify the convergence validity, and AVE is required to be greater than 0.5. According to Table 2, the AVE of the four potential variables is greater than 0.5, indicating good data reliability and aggregation validity. In general, the fitting data validity of the four measurement models is good.
Factor loading is one of the most important parameters in structural equation models, and it reflects the strength and direction of the relationships between variables and factors and is an important index to evaluate the fit degree of models and the importance of the variables [69]. In this study, factor loading was used to evaluate the fit degree of the model. Each factor loading was above 0.6, indicating that the model measurement relationship was good.
To summarize, the above indicators essentially met the ideal values, so the model had good reliability and validity, and the overall fit was good, which proved the rationality and reliability of the evaluation model.
3.3.2. Impact Path Analysis of Miao Villages on Forest Structure Based on PLS-SEM Model
In this study, the terrain, human activities, and landscape pattern were selected as three potential variables affecting forest structure change, and the effects of different potential variables and explanatory variables on the forest were measured. According to the results of the PLS-SEM model (Figure 4), from 1990 to 2020, human activities in the Miao village had a negative impact on the forest structure around the Miao village, and the path coefficients were −0.289, −0.175, −0.145, and −0.251, respectively. The impact was relatively significant, although the significance decreased slightly from 2000 to 2010. Topographic heterogeneity had a positive effect on forests from 1990 to 2020, and the path coefficients were 0.209, 0.494, 0.356, and 0.256, respectively, which decreased year by year after increasing in 2000. Similarly, the impact of the landscape pattern on forest structure was also positive, at 0.445 in 1990, 0.221 in 2000, 0.473 in 2010, and 0.176 in 2020, and the impact of the two was also very significant.
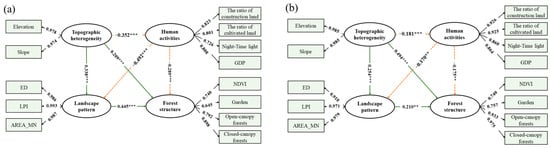
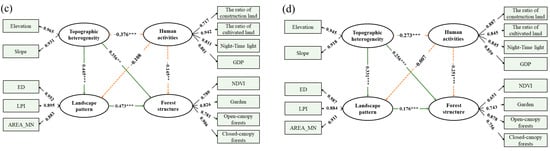
Figure 4.
The SEM model diagram shows the relationship between each variable and the structure of forests in 1990 (a), 2000 (b), 2010 (c), and 2020 (d). The dotted orange lines indicate negative correlations and solid dotted green lines indicate positive correlations (* p < 0.05, ** p < 0.01, and *** p < 0.001).
Through the analysis of the PLS-SEM model results, it is found that the three potential variables, terrain, human activities, and landscape pattern, not only have a direct influence on the forest, but also have indirect influences. They interact with each other and can affect the forest structure. For example, terrain exerts indirect control on the forest structure through its influence on human activities and the landscape pattern, and human activities also exert a significant indirect influence on the forest structure through their influence on the landscape pattern. These three potential variables may interact to affect the forest structure.
3.4. Influence of Miao Villages on Forest Structure Based on PLS-SEM Model
In multivariate analysis, the degree of influence of the independent variable on the dependent variable, i.e., the effect value, can be categorized into direct and indirect effects. The direct effect refers to the direct effect of the independent variable on the dependent variable, while the indirect effect refers to the indirect effect of the independent variable on the dependent variable, which is usually realized through the mediating variable. Based on the results of the PLS-SEM model, the direct and indirect effects of Miao villages on the surrounding forests were analyzed. As can be seen from Figure 5, human activities in Miao villages have significant direct and indirect impacts on the surrounding forests, and the direct impacts are significantly greater than the indirect impacts from 1990 to 2020. Among them, except in 2010, the proportion of construction land has the most significant negative impact on human activities in Miao villages, followed by GDP, night light, and the cultivated land proportion. In 2010, the proportion of arable land had the most significant negative impact, followed by night light, GDP, and the proportion of construction land. As for the direct and indirect effects, as for the total effects, except for 2010, the negative impact of construction land was the most significant. In 2020, the indirect impact of human activities was significantly reduced, and the direct impact was significantly increased.
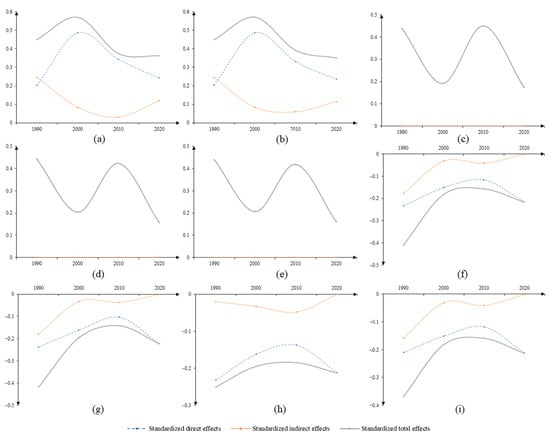
Figure 5.
The effects of explanatory variables on forest structure. (a) Elevation; (b) slope; (c) edge density; (d) largest patch index; (e) Patch Area_MN; (f) GDP; (g) the ratio of construction land; (h) the ratio of cultivated land; (i) night-time light.
In addition, we can also find indirect effects of topographic factors on human activities in Miao villages, and the landscape pattern is directly affected by human activities in Miao villages, thus affecting the forest structure. The indirect effect of topography was particularly significant in 1990; it then decreased in 2000–2010 and increased again in 2020. There was little difference between the direct and indirect effects of altitude and topography. The direct effect of the landscape pattern was more significant in 1990 and 2010, and, among the three variables, the edge density had the greatest effect on the forest.
3.5. Spatial Correlation Analysis of Forest Structure Distribution and Influencing Factors of Miao Villages
On the basis of the PLS-SEM results, among the three potential variables of terrain, human activities, and landscape pattern, six variables of night light, the proportion of construction land, the proportion of cultivated land, GDP, elevation, and slope were selected to conduct a spatial response analysis based on the 2020 data (Figure 6). The GWR analysis of NDVI, open-canopy forest, and gardens was conducted by selecting indexes with a higher R2 spatial correlation related to human activities, such as night light, construction land proportion, cultivated land proportion, GDP, elevation, and slope. It can be seen from the results in Figure 6 that the regression coefficient of GWR in 2020 presents significant spatial differences in the impact of different factors on the forest structure. For NDVI, the regression coefficient of night-time light range from −0.357 to −0.079, showing a negative effect, with the strongest negative effect in the southeast region and slightly weaker in the northwest region. The regression coefficient of the proportion of construction land is −0.166–0.161, and the overall effect is negative, except for a small part of the southeast of Liping County. The regression coefficient of the cultivated land ratio was −0.078–0.089, and the correlation was negative mainly in the central region, i.e., mainly in Jianhe County. The regression coefficient of GDP is −0.023–0.065, and the overall effect is negative. The regression coefficient of elevation is −0.017–0.094, with mainly a positive correlation, and the regression coefficient of slope is −0.020–0.137, decreasing along the gradient from northwest to southeast.
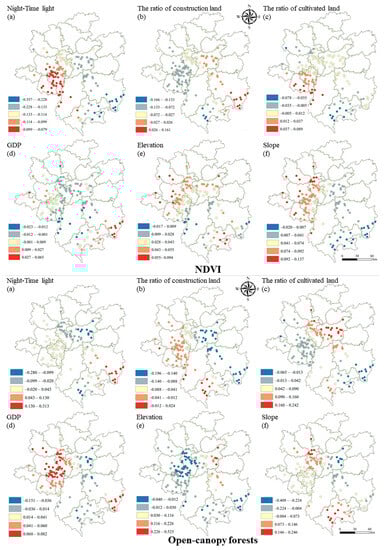
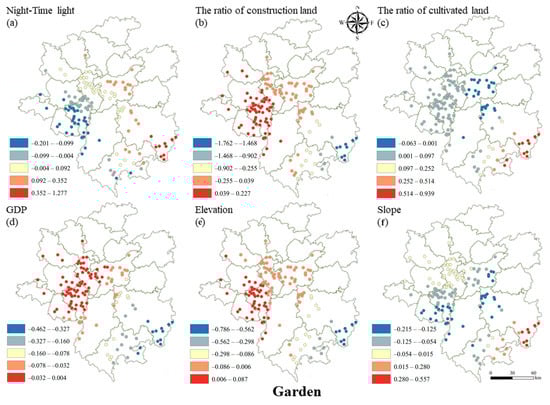
Figure 6.
Spatial distributions of the corresponding coefficients for the observed variables based on the GWR model. (a) Night-Time light; (b) The ratio of construction land; (c) The ratio of cultivated land; (d) GDP; (e) Elevation; (f) Slope.
For the open-canopy forests, the regression coefficient of night light was −0.280–0.313, mainly in Taijiang County and Jianhe County. The regression coefficient of the proportion of construction land was −0.196–0.161, and the overall negative effect was relatively large in Jianhe County and Liping County. The regression coefficient of the cultivated land ratio was −0.065–0.242, and it had a positive effect mainly in Jianhe County and Taijiang County. The regression coefficient of GDP was −0.151–0.082, and it was mainly positive in Danzhai County, Leishan County, Taijiang County, and Kaili City. The regression coefficient of altitude was −0.040–0.525, and it had mainly a positive correlation, while the regression coefficient of slope was −0.409–0.246, and it was mainly positive in Congjiang County.
For other forests, the regression coefficient of night light was between −0.201 and 1.277, mainly in Danzhai County and Leishan County and their surrounding areas, and it was positive in Liping County. The regression coefficient of the proportion of construction land was −1.762–0.227, and it was positive in Leishan County, Danzhai County, Kaili City, Majiang County, and Huangping County. The regression coefficient of the cultivated land proportion was −0.063–0.939, and the overall effect was positive. The regression coefficient of GDP was −0.462 to 0.004, and it was the opposite to the proportion of cultivated land and had a negative effect on the whole. The regression coefficient of elevation was −0.786 to 0.087, the regression coefficient of slope was −0.215 to 0.557, and the positive correlation was mainly concentrated in the south. It can be seen from the elevation and slope that the higher the elevation, the more unfavorable the distribution of open-canopy forests and the better the distribution of closed-canopy forests. The higher the slope, the higher the NDVI but the more unfavorable the distribution of closed-canopy forests.
4. Discussion
4.1. The Influence of Traditional Miao Villages on the Surrounding Forests
In this study, five buffer zones were established with the Miao village as the center and an interval of 2 km to analyze the forest structures of different buffer zones around the traditional Miao village. According to the research results, the forest structure around the traditional Miao village is significantly different from that in other buffer zones within the 2 km buffer zone. Within the 2 km buffer zone, the proportion of closed-canopy forests is obvious, and with the increase in the buffer zone interval, the proportion of closed-canopy forests, shrubbery, and other forest land gradually decreases, while the proportion of open-canopy forests increases. It shows that the Miao villages have a certain degree of influence on the forest structure. The impact of Miao villages on the surrounding forests is mainly related to production, lifestyle, and religious beliefs. Miao villages mainly focus on agricultural cultivation and economic planting. There are a large number of timber forests around the villages for house construction and energy materials, such as trees for winter heating and furniture processing. Affected by the market economy, there are also economic forests for market transactions to obtain economic benefits, such as a large number of planted peach trees, pear trees, and so on [70]. Because most of the Miao villages are located in high mountains and the terrain is complex, there are also many shelterbelts around the Miao villages, which are mainly aimed at preventing natural disasters, maintaining infrastructure, protecting production, improving the environment, and maintaining ecological balance. Furthermore, the unique traditional culture and religious beliefs of the Miao people also mean that many trees around the Miao villages exist as “sacred forests” and are protected by the Miao people. For example, the people in Miao villages have the custom of planting fengshui trees. They believe that this will protect and bring good fortune to future generations and it is a symbol of auspiciousness. Not only the Miao but also the Hani people, who live mainly in Yunnan Province, have beliefs and customs that regard trees as gods. The Hani people believe that the sacred forest (“milsanlsanqqu”) housed the Earth’s mother. Each village has one or more sacred forests, the size of which varies according to the size of the village, ranging from a few hundred square meters to several hectares. The sacred forest is only used for annual sacred events [71]. This is also consistent with the findings of other scholars. The importance of studying this cultural dimension of forest use was raised by de la Fuente et al. in their previous assessment of the implementation of the Native Forest Act. They argue that “cultural barriers are fundamental factors undermining the effectiveness of Chile’s forest regulations [72]”. Reyes et al. propose that no ethnic and religious group is more or less able to manage their forests in a sustainable way, but rather that specific socio-ecological circumstances, by changing people’s attitudes toward risk and time, determine differences in the way that people face uncertainty, which ultimately affects forests [73]. By investigating the perceptions and use of forest ecosystems according to ethnic differences, Cuni-Sanchez et al. discovered the importance that the Turacos place on the forest, where some rituals can only be performed [40]. There are also open-canopy forests, a small amount of shrubbery, and other forests around the Miao village, which are used for orchard planting and aesthetic appreciation.
From 1990 to 2020, with the passage of time, the forest structure in the 2 km buffer zone of the Miao village also changed obviously, the proportion of closed-canopy forests and open-canopy forests gradually decreased, and the proportion of shrubbery and other forest gradually increased. Among them, the difference in closed-canopy forests is small, while the difference in open-canopy forests, shrubbery, and other forests is large. With the development of the economy and the advancement of modernization, the production and lifestyle of Miao villages have also changed. The building materials have changed from wood to brick, and the living materials of people have gradually decreased. Under the influence of the market economy, the modern utilization of forests began to appear in Miao villages. People’s pursuit of material and economic benefits led to a decline in the area of economic forests, which were replaced by orchards and tea gardens that could obtain more economic benefits. However, due to the particularity of the geographical environment and the need to maintain an ecological balance, the shelterbelts around the Miao villages have been maintained in a good state. Under the influence of religious beliefs, the sacred forests and sacred trees in the villages have also been protected. The implementation of the policy of returning cultivated land to forests has made the green concept popular, the ecological value of forests has been paid attention to, and the forest around the Miao village has been protected to a certain extent, so there is little change in the closed-canopy forests. At the same time, with people’s pursuit of aesthetic landscape and recreation needs, open leisure forests, and shrubbery for building, the proportion of both has gradually increased.
4.2. Direct and Indirect Impacts of Factors on Forest Structure
In this study, a structural equation modeling (PLS-SEM) approach was used to quantify the direct and indirect effects of topography, human activities, and landscape patterns on the forest structure around Miao villages. Compared with traditional statistical analysis methods, PLS-SEM is scientifically and credibly tested for reliability, validity and fit. The PLS-SEM model has the advantage of conducting exploratory research in the face of numerous influencing factors and influence paths, and it can analyze the causal relationships among multiple variables in the system simultaneously, facilitating model prediction. The model can also study the correlations of each path, and the user can specify various relationships and obtain valid information by testing them.
Figure 7 shows the effect of different explanatory variables on the forest structure. Many studies have shown that topography has a direct impact on the structure of forests; for example, the proportion of forest landscape distribution in Qiannan Prefecture shows high middle and low sides with increasing elevation, and a trend of increasing and then decreasing with increasing slope, with the highest point being the slope, and the trend of curve change is close to a normal distribution. Some studies show that the patch density and edge density indirectly reflect the strength and extensiveness of the interaction between forest elements, a high patch density and edge density predict the active landscape ecological process, and the landscape pattern of the forest drives the distribution of the forest landscape to a certain extent [74]. In addition, human activities in Miao villages can negatively affect the surrounding forests. The higher the proportion of land used for construction [75], the proportion of cultivated land [76], GDP [77,78], and the number of night-time lights [79], the higher the negative impact on the forest, which is consistent with previous findings. Beche et al. showed that edge effects driven by human use of the forest depend on how the local community values and uses different forest resources [19]. The expansion of building sites has led to the destruction of many forests, and the development of agricultural and forestry economies has led to the expansion of villages and the destruction of forest resources.
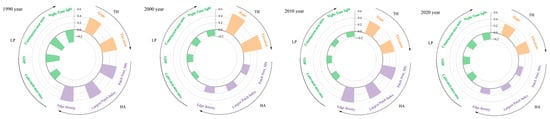
Figure 7.
The effects of explanatory variables on forest structure in 1990, 2000, 2010, and 2020.
In addition to the direct effects described above, topography can also influence the spatial distribution of Miao villages and thus the structure of the forest. The geographical environment of Miao villages is very special due to their long-term adaptation to the local natural environment and the historical and cultural background of the Miao, which are mostly located in the Leigong Mountains, a region with high and steep mountains and peaks. However, the residents of Miao villages have established a sound traditional management system for natural resources such as land resources, water resources, forest resources, and biological resources. Therefore, the forests around Miao villages are not only determined by the terrain itself, but also influenced by the Miao villages. The correlation between the spatial distribution pattern of Miao villages and their culture is also worth exploring. Historically, in order to escape war, the Miao people kept moving and eventually settled in the mountains. Safety was an important factor for the initial site selection of a Miao village. The stockade and the tail of the village are protected by the village forest, and the generally dangerous terrain and large number trees are the objects of the site selection of the village, as they have the characteristics of concealing. From the perspective of the Miao’s traditional culture and customs, feng shui theory is one of the concepts involved in Miao village location. The Miao people believe that if the material life can create “strangeness”, it must have extraordinary vitality, and remaining close to, following, or imitating them will lead to shelter and help. Forests are one such type of life. In addition, the presence of Miao village groups linked by family names or family name alliances in the site selection activity reveals that the Miao people have a strong desire for aggregation and active planning given their history of a lack of security. Therefore, compared with the outside world, Miao villages tend to gather together. In addition, human activities in Miao villages also lead to changes in landscape patterns, which in turn affect the structure of the forest. Linger et al. showed that human activities at different spatial scales lead to disturbances such as edge effects and habitat fragmentation/isolation, which are associated with continuous changes in the structure and composition of Atlantic secondary forests [25].
The utilization of forests in Miao villages also promotes the protection of large forest complexes in the landscape structure to a certain extent. Large-sized forests play a key role in the long-term persistence of carbon storage [80] and have greater species richness [81] and structural complexity, which can provide supportive habitats for typical forest species, including rare and endangered forest species. Miao villages’ worship of the sacred forest puts them in a good position to protect large forests, meaning that the forests around ethnic villages have a greater capacity to support biodiversity. In this paper, the impact of ethnic villages on large forest complexes has not been deeply studied, so it needs to be explored in future studies.
4.3. Limitations and Management Suggestions
There are many factors that affect the geographic distribution of forests, including biological factors, abiotic environmental conditions, and the effects of human activities. Many studies have shown that climate is a significant human disturbance factor affecting forests, but because the study area is in the same climatic zone, the climate of the villages is homogeneous, so the influence of the climate factor is not considered in this paper. Most of the Miao villages are located in the mountains, with high elevation and slope, and the altitude is relatively average. Each village has a slight temperature difference, but due to the difficulty of measurement, we cannot include them in the research system. Current studies on the influence of cultural landscapes, such as ethnic villages, on forest change have involved less quantitative analyses. Specifically, Bhagwat et al. used traditional palaeoecological and statistical methods to study the cultural drivers of tropical forest reforestation in the Western Ghats of India [82], and Grace et al. used walk-through and survey data to study personal preferences for sacred forests and non-forest temples along an urbanization gradient (defined by land use) [24]. However, due to the specificity of the Miao villages themselves, which can influence the surrounding forests in terms of production, lifestyle, and religious beliefs, the mechanisms of influence are complex and difficult to analyze quantitatively, so this study attempted to innovatively propose a research framework that explores the influence of the interaction between the natural environment and human activities in ethnic villages on forest change, bridging the gap in quantitative analyses in existing studies. This study also has certain limitations. For example, there are other factors that affect forests, such as soil and temperature [83] as natural conditions and tourism [84] and ecological restoration projects [21] as human activities. Since the consideration of forest change lacks the inclusion of these drivers, the actual driving mechanisms may not have been revealed yet. Therefore, the effects of other drivers on the forest structure should be considered in an integrated manner in future studies. Another limitation of the study is the limited number of samples analyzed by the PLS-SEM model, so the inclusion of a richer sample could be considered in the future to more accurately assess the impact of ethnic villages on forests.
In this study, we emphasize the specificity of the production, lifestyle, and cultural practices in ethnic villages, which provides a new perspective for forest change research. This study incorporates the natural environment and human activities into the analytical framework and constructs a comprehensive evaluation framework of the causal relationship between forest structure and different influencing factors. By constructing a balanced system between the economic and social development of ethnic villages and the surrounding forest ecosystem, the impact of human activities on forests is controlled within a reasonable range, with the aim of achieving sustainable development of the environment and society, especially in unique areas. This study also examined 17 specific indicators of the SDGs, such as SDG 6.6 (protect and restore water-related ecosystems) and SDG 15.2 (promote sustainable management of all types of forests, stop deforestation, restore degraded forests, and significantly increase global afforestation and reforestation), which provide some theoretical basis [85]. The analysis of the impact of Miao villages on the structure of the surrounding forests and the way that they are affected shows that the relationship between humans and nature must be the focus of our attention. Integrating the ethnic culture of the ecological environment-bearing subject into the process of the ecological utilization of resources can better enable the effective combination of culture and nature and better ensure the ecological maintenance of culture. Therefore, protecting the Miao villages, coordinating and maintaining the harmonious interaction between the villages and the surrounding environment, and promoting the sustainable development of the Miao villages can provide a reference for the management of a harmonious interaction between human beings and the natural and natural environment. The three-dimensional spatial structure of the forest, cultivated land, and buildings within the Miao villages also caters to the concept of modern urban ecological architecture and can provide experience for the planning, design, and operation of modern cities. Although Miao villages have inevitably been affected by the impacts of modern society, the unique ethnic culture of Miao villages and the concept of ecological civilization are still worth studying and learning from. Therefore, in the development of land use and economic activities, we should not only improve the policies and regulations related to forest protection, but also make full use of the concept of ecological civilization in the Miao culture to promote the development of local areas from the perspective of sustainable development.
5. Conclusions
By introducing the PLS-SEM and GWR models, this study innovatively constructed a research framework on the impact of ethnic villages on forest change and its mechanism. From the perspective of the temporal and spatial dynamics of forests, the interaction and influence degree of each driving factor were systematically discussed. Taking Qiandongnan Prefecture as an example, this paper analyzed the spatiotemporal characteristics and driving factors of forest structure changes around Miao villages in Qiandongnan Prefecture from 1990 to 2020 and explored the possible causes of these changes and the impact of the Miao villages on forest structure. The results show the following. (1) Almost all the Miao villages are located in the zone with high elevation and slope, distributed randomly in the buffer zone of 2 km, and clustered in the buffer zone of 2–10 km. The forest landscape around the Miao village has relatively little change in time and obvious spatial heterogeneity. In the 0–2 km buffer zone, the proportion of closed-canopy forests was the largest, and the proportion of closed-canopy forests gradually decreased as the radius of the buffer zone increased, while open-canopy forests showed the opposite, and the proportion of shrubbery and other forests showed a tendency to first increase and then decrease as the radius of the buffer zone increased. Temporally, all four forest landscapes changed little, with closed-canopy forests and open-canopy forests decreasing and shrubbery and other forests increasing. (2) In terms of driving factors of forest structure change, the study found that human activities had a negative impact on forests, while topographic factors and landscape patterns had a positive effect on the forest structure distribution. Our results show that Miao villages not only have a direct effect on the surrounding forests, but also affect the forests by indirectly influencing the landscape pattern. The PLS-SEM models have identified a number of indirect pathways that affect the forest distribution. The effect of topography on human activities in Miao villages weakened the direct positive effect of topography on the forest structure, while the positive effect of the landscape pattern on the forest structure was promoted. The impacts of Miao villages on forest structure are highly complex and interactive, with both direct and indirect effects. Three potential variables, topography, human activity, and landscape pattern, interact to affect the forest structure. The results of the PLS-SEM model show that topography, human activities, and landscape patterns all have a direct impact on the surrounding forest. Our study shows that topography and landscape patterns exert a direct positive influence on the forest structure around Miao villages. (3) There are significant spatial differences in the GWR regression coefficients of the impacts of different factors on forest structure in 2020, among which the NDVI and night light data are significantly negatively correlated. In addition, the higher the altitude, the more unfavorable the distribution of open-canopy forest land, and the better the distribution of other forest land. The higher the slope, the higher the NDVI, but this is not conducive to the distribution of other forest land.
In general, this study attempts to introduce the PLS-SEM model to study the impact of Miao villages on the forest structure, which effectively enhances our understanding of the driving forces and impacts of forest changes. These findings provide an important basis for the conservation and management of forests under different driving factors, especially cultural landscapes, and contribute to the achievement of the ecological and environmental goals of the United Nations’ 2030 Sustainable Development Goals.
Author Contributions
Conceptualization, X.M. and L.G.; methodology, X.M. and S.Z.; formal analysis, X.M.; investigation, X.M. and S.Z.; resources, L.G. and J.Y.; writing—original draft preparation, X.M.; writing—review and editing, L.G.; project administration, L.G.; funding acquisition, L.G. All authors have read and agreed to the published version of the manuscript.
Funding
This research was funded by the special research project of the Chinese Ministry of Science (2019QZKK0308) and the Key Research Project of the Chinese Ministry of Science (2022YFF1303001).
Data Availability Statement
Data developed in this study will be made available on request to the corresponding authors.
Acknowledgments
We are grateful for the comments of the anonymous reviewers, which greatly improved the quality of this paper.
Conflicts of Interest
The authors declare no conflict of interest.
References
- Karnosky, D.; Percy, K.; Thakur, R.; Honrath, R., Jr. Air pollution and global change: A double challenge to forest ecosystems. Dev. Environ. Sci. 2003, 3, 1–41. [Google Scholar]
- Sooyeon Laura Jin, N.A. Healthy Forests Are Vital to Human Health and Sustainable Development. Available online: https://www.un.org/en/node/207187 (accessed on 7 June 2023).
- Watson, J.E.; Evans, T.; Venter, O.; Williams, B.; Tulloch, A.; Stewart, C.; Thompson, I.; Ray, J.C.; Murray, K.; Salazar, A. The exceptional value of intact forest ecosystems. Nat. Ecol. Evol. 2018, 2, 599–610. [Google Scholar] [CrossRef] [PubMed]
- García-Nieto, A.P.; García-Llorente, M.; Iniesta-Arandia, I.; Martín-López, B. Mapping forest ecosystem services: From providing units to beneficiaries. Ecosyst. Serv. 2013, 4, 126–138. [Google Scholar] [CrossRef]
- Keenan, R.J.; Reams, G.A.; Achard, F.; de Freitas, J.V.; Grainger, A.; Lindquist, E. Dynamics of global forest area: Results from the FAO Global Forest Resources Assessment 2015. For. Ecol. Manag. 2015, 352, 9–20. [Google Scholar] [CrossRef]
- d’Annunzio, R.; Sandker, M.; Finegold, Y.; Min, Z. Projecting global forest area towards 2030. For. Ecol. Manag. 2015, 352, 124–133. [Google Scholar] [CrossRef]
- United Nations Department of Economic and Social Affairs. The Global Forest Goals Report 2021. Available online: https://sdgs.un.org/ (accessed on 7 June 2023).
- Seidl, R.; Thom, D.; Kautz, M.; Martin-Benito, D.; Peltoniemi, M.; Vacchiano, G.; Wild, J.; Ascoli, D.; Petr, M.; Honkaniemi, J. Forest disturbances under climate change. Nat. Clim. Chang. 2017, 7, 395–402. [Google Scholar] [CrossRef] [PubMed]
- Sotirov, M.; Sallnäs, O.; Eriksson, L.O. Forest owner behavioral models, policy changes, and forest management. An agent-based framework for studying the provision of forest ecosystem goods and services at the landscape level. For. Policy Econ. 2017, 105, 79–89. [Google Scholar] [CrossRef]
- Hengeveld, G.M.; Schüll, E.; Trubins, R.; Sallnäs, O. Forest Landscape Development Scenarios (FoLDS)–A framework for integrating forest models, owners’ behaviour and socio-economic developments. For. Policy Econ. 2017, 85, 245–255. [Google Scholar] [CrossRef]
- Taye, F.A.; Folkersen, M.V.; Fleming, C.M.; Buckwell, A.; Mackey, B.; Diwakar, K.; Le, D.; Hasan, S.; Saint Ange, C. The economic values of global forest ecosystem services: A meta-analysis. Ecol. Econ. 2021, 189, 107145. [Google Scholar] [CrossRef]
- Bennett, J.A.; Maherali, H.; Reinhart, K.O.; Lekberg, Y.; Hart, M.M.; Klironomos, J. Plant-soil feedbacks and mycorrhizal type influence temperate forest population dynamics. Science 2017, 355, 181–184. [Google Scholar] [CrossRef]
- Murphy, B.P.; Bowman, D.M. What controls the distribution of tropical forest and savanna? Ecol. Lett. 2012, 15, 748–758. [Google Scholar] [CrossRef] [PubMed]
- Boucher, Y.; Perrault-Hébert, M.; Fournier, R.; Drapeau, P.; Auger, I. Cumulative patterns of logging and fire (1940–2009): Consequences on the structure of the eastern Canadian boreal forest. Landsc. Ecol. 2017, 32, 361–375. [Google Scholar] [CrossRef]
- Ma, S.; Qiao, Y.-P.; Wang, L.-J.; Zhang, J.-C. Terrain gradient variations in ecosystem services of different vegetation types in mountainous regions: Vegetation resource conservation and sustainable development. For. Ecol. Manag. 2021, 482, 118856. [Google Scholar] [CrossRef]
- Voggesser, G.; Lynn, K.; Daigle, J.; Lake, F.K.; Ranco, D. Cultural impacts to tribes from climate change influences on forests. In Climate Change and Indigenous Peoples in the United States: Impacts, Experiences and Actions; Springer: Berlin/Heidelberg, Germany, 2013; pp. 107–118. [Google Scholar]
- Mukhortova, L.; Schepaschenko, D.; Shvidenko, A.; McCallum, I.; Kraxner, F. Soil contribution to carbon budget of Russian forests. Agric. For. Meteorol. 2015, 200, 97–108. [Google Scholar] [CrossRef]
- Tolksdorf, J.F.; Kaiser, K.; Petr, L.; Herbig, C.; Kočár, P.; Heinrich, S.; Wilke, F.D.; Theuerkauf, M.; Fülling, A.; Schubert, M. Past human impact in a mountain forest: Geoarchaeology of a medieval glass production and charcoal hearth site in the Erzgebirge, Germany. Reg. Environ. Chang. 2020, 20, 71. [Google Scholar] [CrossRef]
- Beche, D.; Tack, A.; Nemomissa, S.; Warkineh, B.; Lemessa, D.; Rodrigues, P.; Fischer, J.; Hylander, K. Spatial variation in human disturbances and their effects on forest structure and biodiversity across an Afromontane forest. Landsc. Ecol. 2022, 37, 493–510. [Google Scholar] [CrossRef]
- Lemus-Lauzon, I.; Bhiry, N.; Arseneault, D.; Woollett, J.; Delwaide, A. Tree-ring evidence of changes in the subarctic forest cover linked to human disturbance in northern Labrador (Canada). Écoscience 2018, 25, 135–151. [Google Scholar] [CrossRef]
- Wang, D.; Higgitt, D.; Tang, Y.-T.; He, J.; Guo, L. Landscape change and the sustainable development strategy of different types of ethnic villages driven by the grain for Green Program. Sustainability 2018, 10, 3485. [Google Scholar] [CrossRef]
- Cui, N.; Wu, T.; Wang, Y.-C.; Zou, H.; Axmacher, J.C.; Sang, W.; Guo, L. Buddhist monasteries facilitated landscape conservation on the Qinghai-Tibetan Plateau. Landsc. Ecol. 2022, 37, 1559–1572. [Google Scholar] [CrossRef]
- Rath, S.; Banerjee, S.; John, R. Greater tree community structure complexity in sacred forest compared to reserve forest land tenure systems in eastern India. Environ. Conserv. 2020, 47, 52–59. [Google Scholar] [CrossRef]
- Grace, D.; Jeuland, M. Preferences for attributes of sacred groves and temples along an urbanization gradient in the national capital region of India. Ecol. Econ. 2018, 152, 322–335. [Google Scholar] [CrossRef]
- Lingner, D.V.; Rodrigues, A.V.; Oliveira, L.Z.; De Gasper, A.L.; Vibrans, A.C. Modelling changes in forest attributes driven by human activities at different spatial scales in the subtropical Atlantic Forest. Biodivers. Conserv. 2020, 29, 1283–1299. [Google Scholar] [CrossRef]
- Garbarino, M.; Lingua, E.; Weisberg, P.J.; Bottero, A.; Meloni, F.; Motta, R. Land-use history and topographic gradients as driving factors of subalpine Larix decidua forests. Landsc. Ecol. 2013, 28, 805–817. [Google Scholar] [CrossRef]
- Rocha-Santos, L.; Pessoa, M.S.; Cassano, C.R.; Talora, D.C.; Orihuela, R.L.; Mariano-Neto, E.; Morante-Filho, J.C.; Faria, D.; Cazetta, E. The shrinkage of a forest: Landscape-scale deforestation leading to overall changes in local forest structure. Biol. Conserv. 2016, 196, 1–9. [Google Scholar] [CrossRef]
- De Frenne, P.; Lenoir, J.; Luoto, M.; Scheffers, B.R.; Zellweger, F.; Aalto, J.; Ashcroft, M.B.; Christiansen, D.M.; Decocq, G.; De Pauw, K. Forest microclimates and climate change: Importance, drivers and future research agenda. Glob. Chang. Biol. 2021, 27, 2279–2297. [Google Scholar] [CrossRef] [PubMed]
- Bebi, P.; Seidl, R.; Motta, R.; Fuhr, M.; Firm, D.; Krumm, F.; Conedera, M.; Ginzler, C.; Wohlgemuth, T.; Kulakowski, D. Changes of forest cover and disturbance regimes in the mountain forests of the Alps. For. Ecol. Manag. 2017, 388, 43–56. [Google Scholar] [CrossRef] [PubMed]
- Xu, C. The Migration and Integration of Miao Nationality in Hanzhong Area Recorded in Local Chronicles of Qing Dynasty. In Proceedings of the 2020 International Conference on Economics, Education and Social Research (ICEESR 2020), Lanzhou, China, 25–26 July 2020; pp. 368–373. [Google Scholar]
- Lei, Y.; Zhou, H.; Wang, M.; Wang, C. Analysis on Spatial Characteristics and the Adaptation Mechanism of Miao Traditional Settlement in Qiandongnan, China. Math. Probl. Eng. 2022, 2022, 6293833. [Google Scholar] [CrossRef]
- Wu, L. The Relationship between Religious Belief and Agricultural Production of the Miao people. Asian Agric. Res. 2017, 9, 80. [Google Scholar]
- Wang, Z. Defensive landscape: Spiritual land, spiritual boundary and the spatial strategic layout in a Miao village. Inn. Asia 2011, 13, 117–139. [Google Scholar]
- Xu, C.; Rong, B. Analysis of Landscape Image of Miao Ancient Villages in Qiandongnan. J. Landsc. Res. 2021, 13, 101–106. [Google Scholar]
- Wang, X. A case study of Miao village in China: Cultural identity, change and conservation. Adv. Anthropol. 2015, 5, 126. [Google Scholar] [CrossRef][Green Version]
- Huang, L.; Tian, L.; Zhou, L.; Jin, C.; Qian, S.; Jim, C.Y.; Lin, D.; Zhao, L.; Minor, J.; Coggins, C. Local cultural beliefs and practices promote conservation of large old trees in an ethnic minority region in southwestern China. Urban For. Urban Green. 2020, 49, 126584. [Google Scholar] [CrossRef]
- Wang, N.; Fang, M.; Beauchamp, M.; Jia, Z.; Zhou, Z. An indigenous knowledge-based sustainable landscape for mountain villages: The Jiabang rice terraces of Guizhou, China. Habitat Int. 2021, 111, 102360. [Google Scholar] [CrossRef]
- Zhao, D.; Liu, F. Indigenous Forest Knowledge (IFK) and Nature Reserve Workers’ Perceptions of IFK: A Case Study of Leigongshan National Nature Reserve, China. J. Sustain. For. 2022, 41, 721–744. [Google Scholar] [CrossRef]
- Shi, T.; Wu, X.H.; Wang, D.B.; Lei, Y. The Miao in China: A review of developments and achievements over seventy years. Hmong Stud. J. 2019, 20, 1–23. [Google Scholar]
- Cuni-Sanchez, A.; Ngute, A.S.K.; Sonké, B.; Sainge, M.N.; Burgess, N.D.; Klein, J.A.; Marchant, R. The importance of livelihood strategy and ethnicity in forest ecosystem services’ perceptions by local communities in north-western Cameroon. Ecosyst. Serv. 2019, 40, 101000. [Google Scholar] [CrossRef]
- Rotaru, M.-A.; Crețan, R.; Ianăş, A. Ethnicities in Post-Communist Romania: Spatial Dynamics, Fractionalisation, and Polarisation at the NUTS-3 Level. Land 2023, 12, 1133. [Google Scholar] [CrossRef]
- Reang, D.; Sahoo, U.K.; Giri, K.P.; Hazarika, A.; Nath, A.J. Ethnic homestead forests of North-East India revealed as diverse land-use systems. Agrofor. Syst. 2021, 96, 465–478. [Google Scholar] [CrossRef]
- O’Brien, T.; Crețan, R.; Jucu, I.S.; Covaci, R.N. Internal migration and stigmatization in the rural Banat region of Romania. Identities 2022, 30, 704–724. [Google Scholar] [CrossRef]
- Zhu, Z.; Wang, G.; Dong, J. Correlation analysis between land use/cover change and air pollutants—A case study in Wuyishan city. Energies 2019, 12, 2545. [Google Scholar] [CrossRef]
- Zhu, C.; Zhang, X.; Zhou, M.; He, S.; Gan, M.; Yang, L.; Wang, K. Impacts of urbanization and landscape pattern on habitat quality using OLS and GWR models in Hangzhou, China. Ecol. Indic. 2020, 117, 106654. [Google Scholar] [CrossRef]
- Lin, Y.; Hu, X.; Zheng, X.; Hou, X.; Zhang, Z.; Zhou, X.; Qiu, R.; Lin, J. Spatial variations in the relationships between road network and landscape ecological risks in the highest forest coverage region of China. Ecol. Indic. 2019, 96, 392–403. [Google Scholar] [CrossRef]
- Seto, K.C.; Kaufmann, R.K. Modeling the drivers of urban land use change in the Pearl River Delta, China: Integrating remote sensing with socioeconomic data. Land Econ. 2003, 79, 106–121. [Google Scholar] [CrossRef]
- Fan, Y.; Chen, J.; Shirkey, G.; John, R.; Wu, S.R.; Park, H.; Shao, C. Applications of structural equation modeling (SEM) in ecological studies: An updated review. Ecol. Process. 2016, 5, 1–12. [Google Scholar] [CrossRef]
- Eisenhauer, N.; Bowker, M.A.; Grace, J.B.; Powell, J.R. From patterns to causal understanding: Structural equation modeling (SEM) in soil ecology. Pedobiologia 2015, 58, 65–72. [Google Scholar] [CrossRef]
- Sun, Y.; Liu, S.; Liu, Y.; Dong, Y.; Li, M.; An, Y.; Shi, F.; Beazley, R. Effects of the interaction among climate, terrain and human activities on biodiversity on the Qinghai-Tibet Plateau. Sci. Total Environ. 2021, 794, 148497. [Google Scholar] [CrossRef]
- Wang, C.; Ma, L.; Zhang, Y.; Chen, N.; Wang, W. Spatiotemporal dynamics of wetlands and their driving factors based on PLS-SEM: A case study in Wuhan. Sci. Total Environ. 2022, 806, 151310. [Google Scholar] [CrossRef]
- Zhu, X.; Zhang, P.; Wei, Y.; Li, Y.; Zhao, H. Measuring the efficiency and driving factors of urban land use based on the DEA method and the PLS-SEM model—A case study of 35 large and medium-sized cities in China. Sustain. Cities Soc. 2019, 50, 101646. [Google Scholar] [CrossRef]
- Hailong, S.; Peihong, C.; Yongchang, L. Spatial Distribution Characteristics and Influencing Factors of Traditional Villages in Qiandongnan Prefecture. J. Landsc. Res. 2021, 13, 45–50. [Google Scholar]
- Bureau, G.S. Guizhou Statistical Bulletin. Available online: http://stjj.guizhou.gov.cn/ (accessed on 8 June 2023).
- The National Earth System Science Data Sharing Platform. Landsat Data of Qiandongnan Miao and Dong Autonomous Prefecture. Available online: http://www.geodata.cn (accessed on 8 June 2023).
- McGarigal, K. FRAGSTATS: Spatial Pattern Analysis Program for Categorical Maps. Computer Software Program Produced by the Authors at the University of Massachusetts, Amherst. Available online: www.umass.edu/landeco/research/fragstats/fragstats.html (accessed on 8 June 2023).
- Haase, P. Spatial pattern analysis in ecology based on Ripley’s K-function: Introduction and methods of edge correction. J. Veg. Sci. 1995, 6, 575–582. [Google Scholar] [CrossRef]
- Liao, Y.; Zhang, Y.; He, L.; Wang, J.; Liu, X.; Zhang, N.; Xu, B. Temporal and spatial analysis of neural tube defects and detection of geographical factors in Shanxi Province, China. PLoS ONE 2016, 11, e0150332. [Google Scholar] [CrossRef]
- Karimi, H.A.; Karimi, B. Geospatial Data Science Techniques and Applications; CRC Press: Boca Raton, FL, USA, 2017; pp. 155–176. ISBN 978-1-138-62644-7. [Google Scholar]
- Cui, N.; Zou, H.; Zhang, M.; Guo, L. The Effects of Terrain Factors and Cultural Landscapes on Plateau Forest Distribution in Yushu Tibetan Autonomous Prefecture, China. Land 2021, 10, 345. [Google Scholar] [CrossRef]
- Sun, J.; Hunter, P.D.; Tyler, A.N.; Willby, N.J. The influence of hydrological and land use indicators on macrophyte richness in lakes–A comparison of catchment and landscape buffers across multiple scales. Ecol. Indic. 2018, 89, 227–239. [Google Scholar] [CrossRef]
- Du, J.; Fu, Q.; Fang, S.; Wu, J.; He, P.; Quan, Z. Effects of rapid urbanization on vegetation cover in the metropolises of China over the last four decades. Ecol. Indic. 2019, 107, 105458. [Google Scholar] [CrossRef]
- Hair, J.F.; Risher, J.J.; Sarstedt, M.; Ringle, C.M. When to use and how to report the results of PLS-SEM. Eur. Bus. Rev. 2019, 31, 2–24. [Google Scholar] [CrossRef]
- Rigdon, E.E.; Sarstedt, M.; Ringle, C.M. On comparing results from CB-SEM and PLS-SEM: Five perspectives and five recommendations. Mark. ZFP–J. Res. Manag. 2017, 39, 4–16. [Google Scholar] [CrossRef]
- Dash, G.; Paul, J. CB-SEM vs PLS-SEM methods for research in social sciences and technology forecasting. Technol. Forecast. Soc. Chang. 2021, 173, 121092. [Google Scholar] [CrossRef]
- Yu, H.; Gong, H.; Chen, B.; Liu, K.; Gao, M. Analysis of the influence of groundwater on land subsidence in Beijing based on the geographical weighted regression (GWR) model. Sci. Total Environ. 2020, 738, 139405. [Google Scholar] [CrossRef]
- Li, S.; Song, Y.; Xu, H.; Li, Y.; Zhou, S. Spatial distribution characteristics and driving factors for traditional villages in areas of China based on GWR Modeling and Geodetector: A case study of the Awa Mountain Area. Sustainability 2023, 15, 3443. [Google Scholar] [CrossRef]
- Zhang, C.; Liu, Y.; Lu, W.; Xiao, G. Evaluating passenger satisfaction index based on PLS-SEM model: Evidence from Chinese public transport service. Transp. Res. Part A Policy Pract. 2019, 120, 149–164. [Google Scholar] [CrossRef]
- Afthanorhan, W. A comparison of partial least square structural equation modeling (PLS-SEM) and covariance based structural equation modeling (CB-SEM) for confirmatory factor analysis. Int. J. Eng. Sci. Innov. Technol. 2013, 2, 198–205. [Google Scholar]
- Xu, J.; Ma, E.T.; Tashi, D.; Fu, Y.; Lu, Z.; Melick, D. Integrating sacred knowledge for conservation: Cultures and landscapes in southwest China. Ecol. Soc. 2005, 10, 7. [Google Scholar] [CrossRef]
- Zhang, Y.; Min, Q.; Zhang, C.; He, L.; Zhang, S.; Yang, L.; Tian, M.; Xiong, Y. Traditional culture as an important power for maintaining agricultural landscapes in cultural heritage sites: A case study of the Hani terraces. J. Cult. Herit. 2017, 25, 170–179. [Google Scholar] [CrossRef]
- De la Fuente, J.; Calderón, C.; Torres, J. Informe Final Programa Ley de Bosque Nativo; Ministerio de Agricultura: Santiago, Chile, 2013. Available online: https://www.dipres.gob.cl/597/articles-139791_informe_final.pdf (accessed on 2 May 2023).
- Reyes, R.; Nelson, H.W.; Zerriffi, H. How do decision makers’ ethnicity and religion influence the use of forests? Evidence from Chile. For. Policy Econ. 2021, 128, 102462. [Google Scholar] [CrossRef]
- Zhan, Y.; Guo, J. The dynamics of patch density and edge density in forested landscape of Shanxi, China-a case study in Guandishan mountain forest district. Chin. J. Ecol. 2001, 20, 18–21. [Google Scholar]
- Freitas, S.R.; Hawbaker, T.J.; Metzger, J.P. Effects of roads, topography, and land use on forest cover dynamics in the Brazilian Atlantic Forest. For. Ecol. Manag. 2010, 259, 410–417. [Google Scholar] [CrossRef]
- Dupouey, J.-L.; Dambrine, E.; Laffite, J.-D.; Moares, C. Irreversible impact of past land use on forest soils and biodiversity. Ecology 2002, 83, 2978–2984. [Google Scholar] [CrossRef]
- Heino, M.; Kummu, M.; Makkonen, M.; Mulligan, M.; Verburg, P.H.; Jalava, M.; Räsänen, T.A. Forest loss in protected areas and intact forest landscapes: A global analysis. PLoS ONE 2015, 10, e0138918. [Google Scholar] [CrossRef]
- Morales-Hidalgo, D.; Oswalt, S.N.; Somanathan, E. Status and trends in global primary forest, protected areas, and areas designated for conservation of biodiversity from the Global Forest Resources Assessment 2015. For. Ecol. Manag. 2015, 352, 68–77. [Google Scholar] [CrossRef]
- Bennie, J.; Duffy, J.P.; Davies, T.W.; Correa-Cano, M.E.; Gaston, K.J. Global trends in exposure to light pollution in natural terrestrial ecosystems. Remote Sens. 2015, 7, 2715–2730. [Google Scholar] [CrossRef]
- Bordin, K.M.; Esquivel-Muelbert, A.; Bergamin, R.S.; Klipel, J.; Picolotto, R.C.; Frangipani, M.; Zanini, K.; Cianciaruso, M.V.; Jarenkow, J.A.; Jurinitz, C.F.; et al. Climate and large-sized trees, but not diversity, drive above-ground biomass in subtropical forests. For. Ecol. Manag. 2021, 490, 119126. [Google Scholar] [CrossRef]
- Mensah, S.; Salako, V.K.; Seifert, T. Structural complexity and large-sized trees explain shifting species richness and carbon relationship across vegetation types. Funct. Ecol. 2020, 34, 1731–1745. [Google Scholar] [CrossRef]
- Bhagwat, S.A.; Nogué, S.; Willis, K.J. Cultural drivers of reforestation in tropical forest groves of the Western Ghats of India. For. Ecol. Manag. 2014, 329, 393–400. [Google Scholar] [CrossRef]
- Al Balasmeh, O.I.; Karmaker, T. Effect of temperature and precipitation on the vegetation dynamics of high and moderate altitude natural forests in India. J. Indian Soc. Remote Sens. 2020, 48, 121–144. [Google Scholar] [CrossRef]
- Shang, Q.; Liu, Y.; Li, Q. Effects of Tourism Trampling on Soil Nitrogen Mineralization in Quercus variabilis Blume Forests Varies with Altitudes in the Climate Transition Zone. Forests 2022, 13, 1467. [Google Scholar] [CrossRef]
- Assembly, G. Sustainable development goals. SDGs Transform. Our World 2015, 2030, 6–28. [Google Scholar]
Disclaimer/Publisher’s Note: The statements, opinions and data contained in all publications are solely those of the individual author(s) and contributor(s) and not of MDPI and/or the editor(s). MDPI and/or the editor(s) disclaim responsibility for any injury to people or property resulting from any ideas, methods, instructions or products referred to in the content. |
© 2023 by the authors. Licensee MDPI, Basel, Switzerland. This article is an open access article distributed under the terms and conditions of the Creative Commons Attribution (CC BY) license (https://creativecommons.org/licenses/by/4.0/).