Article

Multi-Scale Altitudinal Patterns of Soil and Litter Invertebrate Communities in a Warm Temperate Deciduous Broadleaf Forest

1
State Key Laboratory of Urban and Regional Ecology, Research Center for Eco-Environmental Sciences, Chinese Academy of Sciences, Beijing 100085, China
2
Key Laboratory of Vegetation Restoration and Management of Degraded Ecosystems, South China Botanical Garden, Chinese Academy of Sciences, Guangzhou 510650, China
3
CAS Key Laboratory of Tropical Forestry Ecology, Xishuangbanna Tropical Botanical Garden, Chinese Academy of Sciences, Mengla 666303, China
*
Author to whom correspondence should be addressed.
Forests 2023, 14(10), 2009; https://doi.org/10.3390/f14102009
Submission received: 1 September 2023 / Revised: 28 September 2023 / Accepted: 5 October 2023 / Published: 7 October 2023
(This article belongs to the Section Forest Biodiversity)

Abstract

:
The diversity and spatial patterns of soil invertebrates are the cornerstones for understanding their ecological functions, which are crucial to maintaining nutrient cycling and soil health in forest ecosystems. Based on a continuous altitudinal gradient (1020–1770 m) composed of 119 plots, this study analyzed the spatial patterns of invertebrate communities in temperate mountain forest litter and soil using multi-scale ordination. The results indicate that along the altitudinal gradient, the invertebrate communities in both litter and soil layers exhibit “patches” at a scale of approximately 33 plots that are mainly composed of Mesostigmata and Apterogasterine oribatid mites. In the litter layer, at the 11-plot scale, an aggregation of Onychiuridae is also formed, while in the soil layer, there are “patches” represented by Diadocidiidae at the 33-plot scale. The positive–negative associations among invertebrate taxa also shift between the litter and soil layers, as well as among “patches”. Our study confirms that the richness of invertebrates in temperate-forest litter is higher and forms multi-scale assembly “patches” despite the higher abundance of invertebrates in the soil layer. Future studies should delve deeper into the aggregation mechanisms of these specific taxa and may require higher sampling densities to reveal the multi-scale spatial patterns of soil invertebrates.

1. Introduction

Soil invertebrates serve as connectors between above- and belowground, and between organic and inorganic environments [1,2], playing a crucial role in nutrient cycling in forest ecosystems. They regulate litter decomposition (e.g., saprozoic invertebrates), directly impact plant growth via root herbivory (e.g., phytophagy insect larvae), alter soil physical structure and nutrient availability (e.g., earthworms), and influence the composition and activity of soil bacterial and fungal communities (e.g., nematodes), thereby being essential to maintaining soil health and biodiversity [3,4,5]. Previous research on the spatial distribution of soil invertebrates mainly focused on investigating community composition and structural variations along environmental or disturbance gradients [6,7]. Since the indication of the importance of the scale in ecology by Simon Levin [8,9], numerous studies have emerged regarding multi-scale distribution patterns of various species. Recent biogeographical studies of soil invertebrates have also revealed that spatial autocorrelation and the mosaic distribution of “patch-gap” or “peak-valley” at local scales are common spatial patterns among various soil organisms [10,11]. Despite ongoing research on the distribution patterns of soil invertebrates [12,13], most studies still focus on the spatial patterns of specific taxa or on spatial patterns at the measurement scale only. However, it is not possible to obtain or fully reflect the pattern characteristics of the entire community by adding up the spatial information of various species [14], and studies on the multi-scale spatial pattern characteristics of soil invertebrates at the multi-species or community level are still scarce.
The spatial distribution patterns of multiple species or communities have long been a focal point in biogeographical research [15,16]. By integrating theories of species coexistence such as “ecological niche” and “nested sieves,” it is generally believed that the spatial patterns of communities are the combined result of multi-scale ecological processes, including species dispersion, environmental filtration, and interspecific interactions [17,18,19]. As factors with high diversity, broad distributions, and sensitivity to microenvironmental changes [4,20,21], soil invertebrates can deepen our understanding of species coexistence and community assembly mechanisms, which is also one of the breakthroughs in community ecology. Mountain forest ecosystems are considered the most powerful “natural experimental platforms” in biogeography, where spatial variation along altitudinal gradients can serve as a model system for understanding the structural and spatial patterns of scale-dependent communities and their responses to various factors [15,22,23]. Furthermore, the direction and strength of interspecific interactions may change with the external environment and spatial scale [24,25]. Litter and soil not only provide different habitats for invertebrates with small body sizes, but also limit their spatial mobility and affect their distribution ranges [13,26]. Conducting multi-scale spatial pattern analyses of invertebrate communities in litter and soil layers could lay the foundation for accurately revealing the heterogeneous characteristics of community spatial distribution and the spatial aggregation mechanism of species.
Therefore, this study focuses on soil invertebrates in temperate mountain forests. Based on a continuous altitudinal gradient transect, by employing the multi-species and multi-scale ordination method improved by Dale and Zbigniewicz [27,28], we aim to explore and compare the diversity and potential multi-scale spatial patterns, pattern intensities, contributions of various taxa, and variation patterns of inter-taxa associations of invertebrate communities in litter and soil.

2. Materials and Methods

2.1. Sites

The study area is located on Dongling Mountain, Beijing, China (40°00″–40°02″ N, 115°26″–115°30″ E), with the highest altitude of the mountain reaching 2303 m. The study area falls within the typical temperate, semi-humid, continental monsoon zone, with an average annual temperature of 5–10 °C and average annual precipitation of approximately 500–600 mm, mainly concentrated in July and August. The soil in the study area is mountain brown soil (at elevations of 1000–1800 m), and the dominant vegetation consists of warm temperate deciduous broadleaved forests (e.g., Quercus wutaishanica, Acer mono, and Betula dahurica), with the Quercus spp. being the representative vegetation in this region. For a detailed study area description, please refer to Xu et al. [13].

2.2. Soil Invertebrate Collection

Within the study area, we selected ten west-facing slopes with similar slopes dominated by Quercus wutaishanica. Subsequently, we established belt transects ranging from 80 to 180 m in length (from bottom to top) and 10 m in width along these slopes, forming an altitudinal gradient from 1020 to 1770 m. Each 10 m wide belt transect was further divided into 10 m × 10 m plots, resulting in a total of 119 plots. Thus, the altitude delta between the highest and lowest points within each plot is approximately 6.5 m. Within each plot, three random 0.6 m × 0.6 m (1 m2 in total) subplots were selected to collect litter samples; and two random 10 cm deep soil cores (six cores per plot in total) were collected using an 8 cm diameter soil auger and then mixed into one composite soil sample. The collected litter and soil samples were placed in cotton bags and tightly sealed, respectively. Thus, we obtained 238 litter and soil samples (119 each). Modified Berlese–Tullgren extractors (equipped with 60 watt light bulbs, continuous exposure for 48 h) and Baermann wet funnels were used to separate and collect invertebrates from the litter layer and soil layer. After separation, the invertebrates were identified and counted under a microscope. Except for Mesostigmata and Prostigmata, which were identified to the suborder level, other soil invertebrates were identified to at least the family level. Field sampling was conducted between July and August 2013. For a more detailed collection of methods of soil invertebrates, please refer to Xu et al. [13].

2.3. Statistical Analyses

We first analyzed the variation in the total abundance of invertebrates in the litter layer and soil layer along the altitudinal gradient. To compare the two layers, we divided the abundance data by the respective sampling area to obtain the unit area abundance of soil invertebrates. We then used Wilcoxon tests to analyze the significance of the differences in the α and β diversity of invertebrate communities between the litter layer and soil layer. Here, we selected the Shannon–Wiener and Simpson indices as indicators of α diversity. For β diversity, we used the richness-based Sorensen index, which accounts for the spatial turnover and nestedness components, and the Bray–Curtis index, which considers both the balanced variation and abundance gradient components of dissimilarity and incorporates abundance information.
Then, we employed the multi-species multi-scale ordination method proposed by Noy-Meir and Anderson [27] and refined by Dale and Zbigniewicz [28] to reveal the potential multi-scale patterns of soil invertebrate communities. This method, based on moving-window variance analysis, combines the covariance among species at different scales and principal component analysis to identify potential “patch-gap” or “peak-valley” patterns. It also determines the contribution of each species to the formation of these patterns and estimates the positive–negative associations and their strength among species. The main calculation process is detailed below.
For a community composed of k species, covariance matrices C1, C2, …, CS with dimensions of k × k is calculated using two-term local quadrat covariance (TTLQC) for scales ranging from 1 to S. Here, scale refers to the number of plots, sometimes referred to as block size in other studies. In this paper, maximum scale S was set to half the total number of plots. The covariance matrices are then summed to obtain sum matrix C with dimensions of k × k. Principal component analysis is applied to obtain eigenvalues λ1, λ2, …, λk, and the weights assigned by the corresponding eigenvectors are allocated to different scales. The peak value in the plot of variance, λi(s), against scale value s represents the pattern scale of the community. To mitigate the influence of the scale effect during the summation of covariance matrices, a weighting process is usually conducted. After completing the feature analysis and allocation of eigenvalues, a de-weighting process is applied. The weighting factor is calculated as 6s/(s2 + 2), where s represents the corresponding scale. In this study, the pattern intensity was calculated using J i s = 6 s λ i s s 2 + 2 . The pattern consistency at a specific scale s along a particular ordination axis is defined as M s = k J k s k D k , where Dk represents the average density of species k. The overall consistency across the entire ordination axis is denoted by M T = s M s .
In the scores provided by the principal component eigenvectors, species with the same sign (both positive or both negative) tend to show positive associations in patches at that specific scale, and more similar and larger weights values indicate stronger associations. The contribution of each species to the patterns can be expressed as the square of the corresponding weights at different scales. The evenness of the contribution of species to the whole distribution pattern of the community is calculated as E i = 1 C i k 1 , where Ci represents the coefficient of variation in the eigenvector for each species, i.e., the ratio of variance over mean. The variation trend of the community along the altitudinal gradient at scale s is obtained by calculating the weighted average of each sample plot on the specific ordination axis, which is derived from the product of the eigenvectors of the axis and the species abundance values within the community.
All statistical analyses and graphical presentations in this study were conducted using R (version 3.5.3) [29].

3. Results

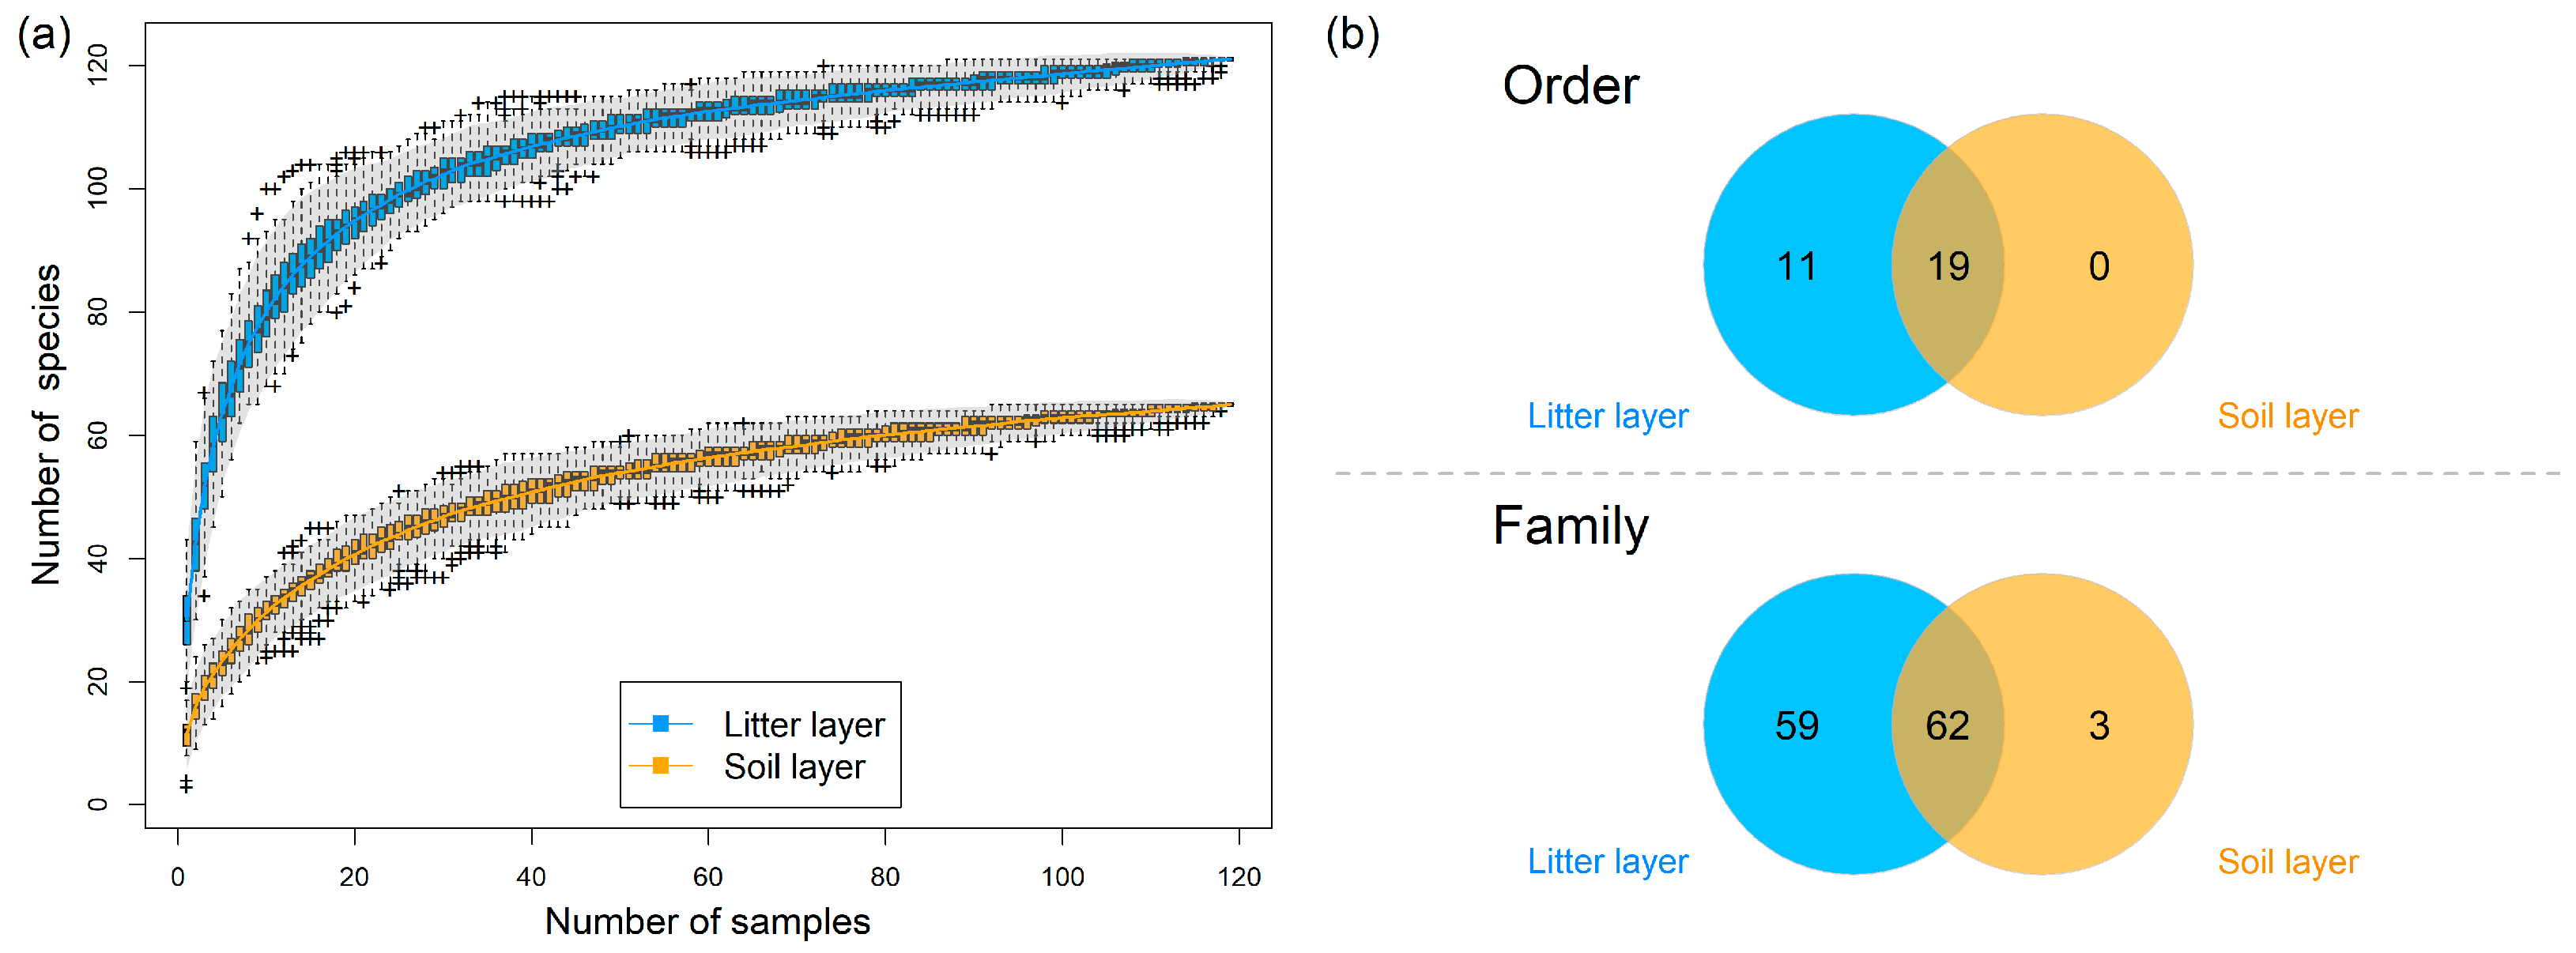
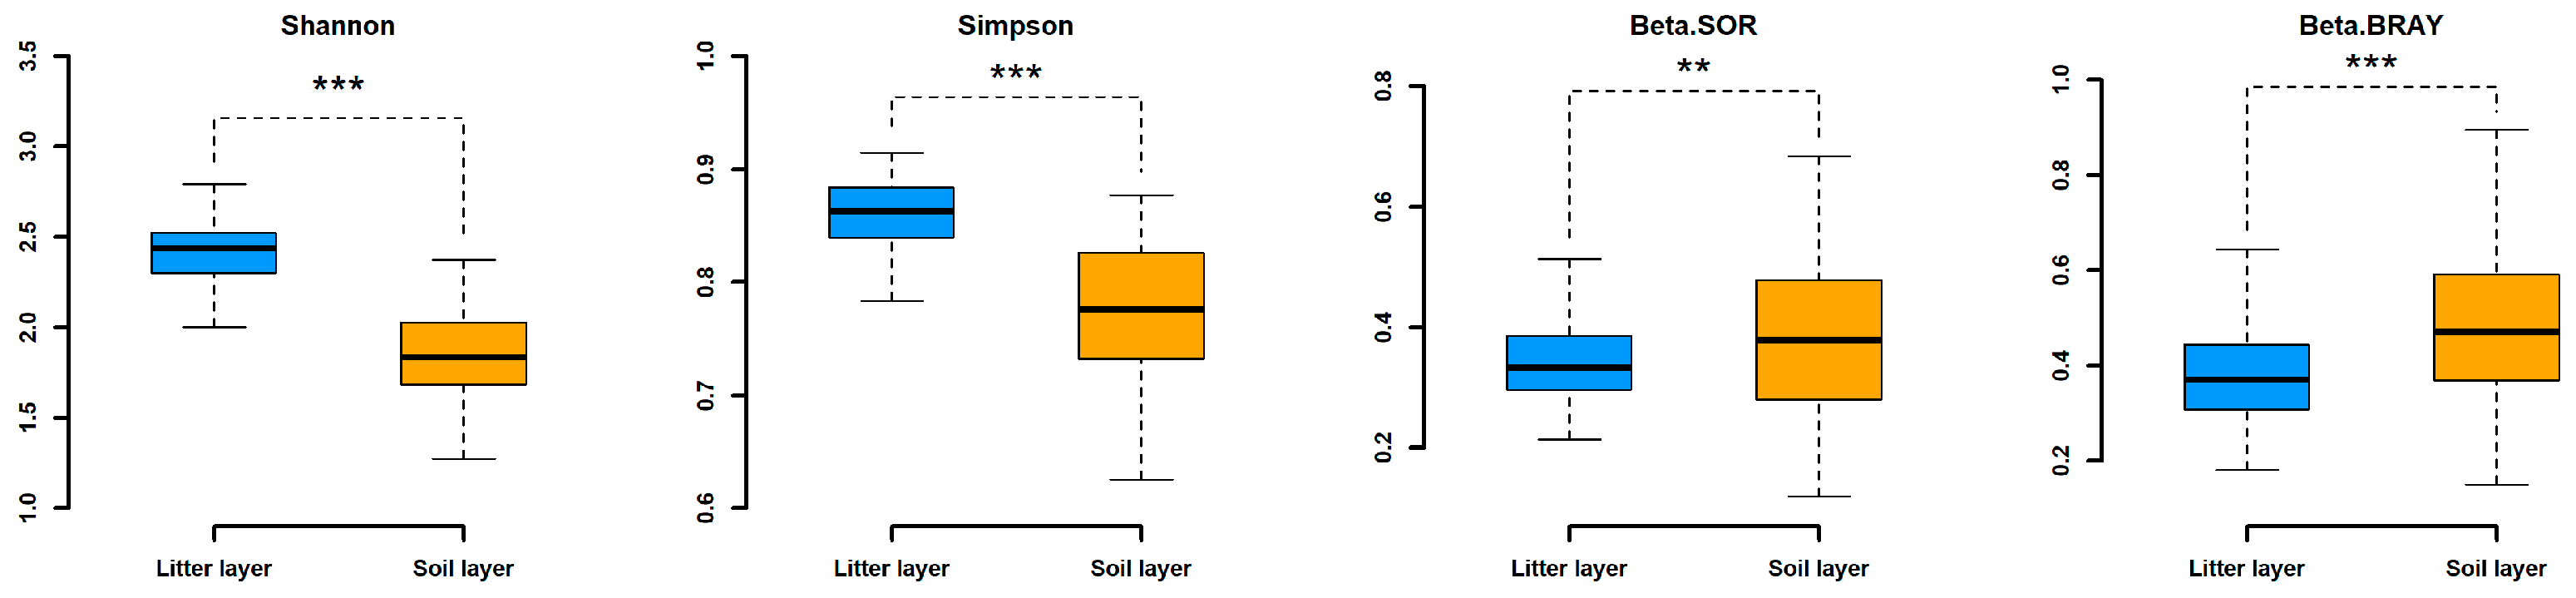
3.1. Soil Invertebrate Diversity

The species accumulation curves along the altitudinal gradient for invertebrate communities in the litter and soil layers (Figure 1a) indicate that the sampling in this study was sufficient to comprehensively reflect the diversity of invertebrates in both layers. When the number of sampling points was the same, the richness of invertebrates in the litter layer was consistently higher than that in the soil layer. The Venn diagrams (Figure 1b) showed that there were 11 unique orders in the litter layer and 19 shared orders between the two layers, but no unique orders in the soil layer. Moreover, there were 59 unique families in the litter layer, three unique families in the soil layer, and 62 shared families between the two layers. A total of 62,019 invertebrates were collected in the litter layer and 8273 invertebrates in the soil layer. The composition of dominant taxa was similar in both layers, with Collembola, Parasitiformes, and Prostigmata being the dominant orders. The Shannon diversity and Simpson diversity of invertebrates in the litter layer were significantly higher than those in the soil layer (Figure 2), although the density of invertebrates in the litter layer was lower than that in the soil layer. Additionally, both the Sorensen index based on the presence or absence of taxa and the Bray–Curtis diversity index considering abundance information indicated that the compositional differences in invertebrate communities in the soil layer along this altitudinal gradient was significantly higher than that in the litter layer.

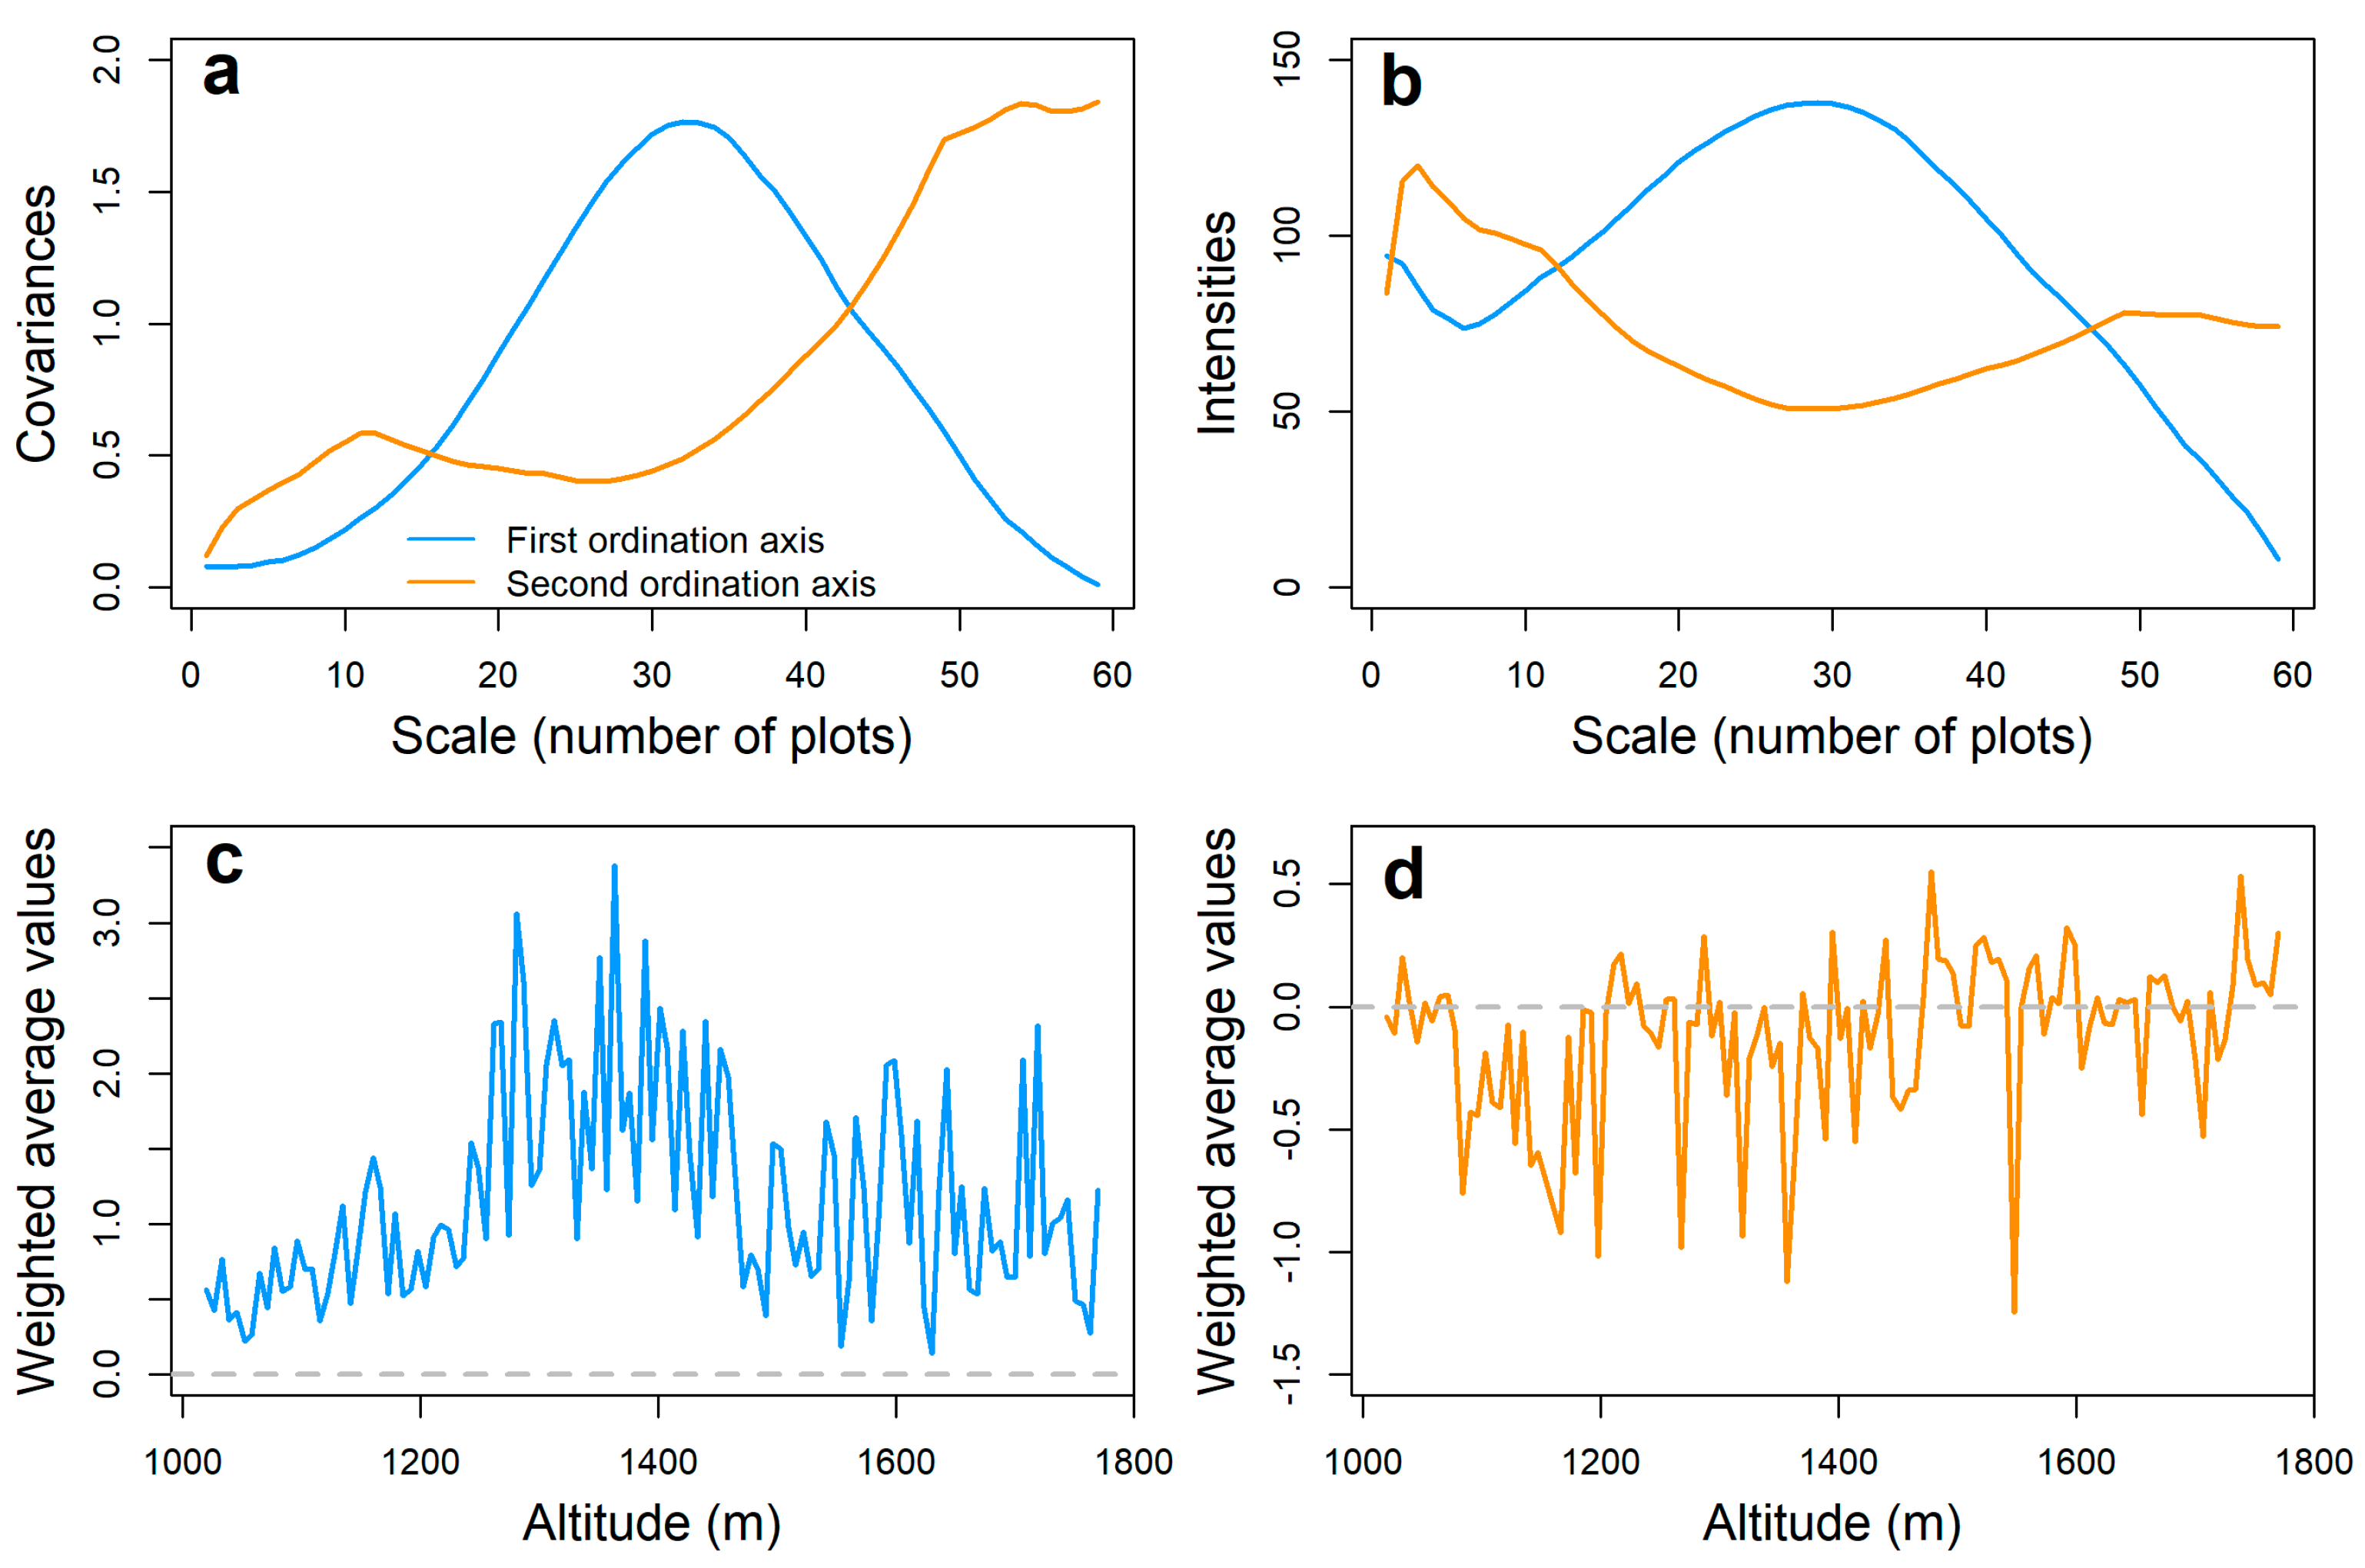
3.2. Pattern Analysis of Soil Invertebrate Communities

In this study, we conducted a principal component analysis on the covariance and sum matrices of various invertebrate taxa in the litter layer at different scales. Based on the eigenvalues, we selected two principal components that accounted for 52.2% and 30.1% of the total variance as ordination axes. From the variance–scale relationship in Figure 3a, it can be observed that the altitudinal distribution of invertebrates in the litter layer primarily exhibits “patches” at two pattern scales (11 and 32 plots; approximately 70 and 203 m, respectively). Furthermore, the steepness of the peaks indicates that the boundary of the patch at the 32-plot scale is more distinct than that at the 11-plot scale. The pattern intensity of the patch at the 32-plot scale is 145.9, while that at the 11-plot scale is 103.1 (Figure 3b), with pattern consistencies of 0.28 and 0.20, respectively. The consistencies of community distribution patterns along the two ordination axes are 0.19 and 0.15, while the values of the evenness of the contributions from different taxa to the community distribution patterns are 0.63 and 0.51, respectively.
Based on the contribution of each taxon shown in Table 1, Mesostigmata presents the highest contribution (48.31%) to the first ordination axis, followed by Apterogasterine oribatid mites (34.97%), while the remaining taxa together contribute 16.72%. Therefore, the first ordination axis mainly represents a distribution pattern composed of Mesostigmata and Apterogasterine oribatid mites. On the second ordination axis, Onychiuridae show a contribution as high as 88.73%, while the remaining taxa together contribute 11.27%. The second ordination axis represents a community distribution pattern dominated by Onychiuridae. In addition, by examining the eigenvectors assigned to each taxon, it can be observed that the associations among the top-ranked taxa on the first ordination axis are positive but differ in strength. On the second ordination axis, Isotomidae show negative associations with Mesostigmata and several other taxa, with varying associations in strength.
Furthermore, Figure 3c,d illustrate the altitudinal patterns of the weighted community considering different taxa. The values on the first ordination axis are mostly positive, indicating a significant increase in the abundance of high-contributing taxa such as Mesostigmata and Apterogasterine oribatid mites, reaching a peak in the mid-altitude section. The results on the second ordination axis exhibit greater fluctuations, suggesting an unstable variation in the negative-eigenvector taxa dominated by Onychiuridae and the positive-eigenvector taxa dominated by Isotomidae and Mesostigmata along the altitudinal gradient. The lower negative and positive values also indicate an increase in the abundance of taxa, with negative eigenvectors being dominated by Onychiuridae.
Similarly, we conducted a principal component analysis on the covariance and sum matrices of various invertebrate taxa in the soil layer at different scales. Based on the eigenvalues, we selected two principal components that accounted for 74.1% and 10.6% of the total variance as ordination axes. From the variance–scale relationship in Figure 4a, it can be observed that the altitudinal distribution of invertebrates in the soil layer primarily exhibits “patches” at two similar scales (34 and 33 plots; approximately 216 and 210 m, respectively). The pattern strength of the patch at the 34-plot scale is 835.0, and it is 298.0 at the 33-plot scale (Figure 4b), corresponding to pattern consistencies of 0.36 and 0.13, respectively. The consistencies of community distribution patterns along the two ordination axes are 0.30 and 0.11, and the values of the evenness of contributions to community distribution patterns by various taxa are 0.52 and 0.68, respectively.
According to the contribution of each taxon in Table 2, Mesostigmata presents the highest contribution (60.13%) to the first ordination axis, followed by Apterogasterine oribatid mites (29.44%), while the remaining taxa together contribute 10.43%. Therefore, the first ordination axis mainly represents a distribution pattern composed of Mesostigmata and Apterogasterine oribatid mites. On the second ordination axis, the contributions of Diadocidiidae, Mesostigmata, and Apterogasterine oribatid mites are 40.23%, 25.98%, and 18.43%, respectively, while the other taxa together contribute 15.36%. The second ordination axis represents a distribution pattern mainly dominated by Diadocidiidae, Mesostigmata, and Apterogasterine oribatid mites. In addition, based on the eigenvectors obtained from the distribution of each taxon, it can be seen that although the strength of association varies among the top-ranked taxa on the first ordination axis, the values are all positively correlated. On the second ordination axis, several taxa show negative associations, and the strength of association also differs.
Figure 4c,d illustrate the altitudinal patterns of the weighted community for each taxon. The results on the first ordination axis are mostly positive values, indicating a significant increase in the abundance of high-contributing taxa such as Mesostigmata and Apterogasterine oribatid mites, reaching a peak in the mid-altitude section. The results on the second ordination axis fluctuate significantly, indicating an unstable change in the negative-eigenvector taxa dominated by Diadocidiidae and Mesostigmata (Table 1) and the positive-eigenvector taxa dominated by Apterogasterine oribatid mites along the altitudinal gradient. The presence of both low negative and positive values also indicates an increase in the abundance of positive-eigenvector taxa dominated by Apterogasterine oribatid mites and other taxa.

4. Discussion

A previous study based on this transect reported that the total abundance of invertebrates in the litter layer exhibits a significant “bell-shaped” pattern along the altitudinal gradient [13], which may be due to the stress from soil temperature, humidity, and other environmental factors or mid-domain effects [30,31]. However, the spatial patterns of the communities are not obtained by directly summing up the spatial distribution information of various taxa. So far, multi-scale spatial pattern analyses have been conducted on specific soil invertebrate taxa [32,33], but there is still a lack of comprehensive analyses of multiple taxa at different scales [34], especially across continuous spatial scales. Based on the induction of the association among multiple taxa at different scales, we further discovered that along the same environmental gradient, soil invertebrate taxa dominated by Mesostigmata and Apterogasterine oribatid mites in both litter and soil layers form stable combinations and aggregate into “patches” at a scale of approximately 33 plots. The altitudinal variation in the weighted average of multiple taxa indicates that the dominant taxa, represented by Mesostigmata and Apterogasterine oribatid mites, mainly exhibit a “low–high–low” pattern of “patches” distributed along the altitudinal gradient. According to our experimental design, their distribution is lower in the low- and high-altitude sections, but higher in the mid-altitude section, which is consistent with the “bell-shaped” distribution of the total abundance of invertebrates in the litter layer. In addition, there is also a “patch” dominated by Onychiuridae in the litter layer, at a scale of 11 plots. Compared with the soil layer, invertebrates in the litter layer are more susceptible to the influence of vegetation diversity or litter quantity and quality [35,36]. Generally, the variation in plant and litter richness along the altitudinal gradient also shows a “bell-shaped” pattern [29,37], but the formation of this “patch” still needs to be further analyzed in relation to other environmental factors or vegetation. Compared with the litter layer, the spatial pattern of the community in the soil layer is more stable. The second ordination axis, represented by Diadocidiidae, also displays a scale of about 33 plots. Overall, the combination of Mesostigmata and Apterogasterine oribatid mites can best represent the altitudinal pattern of soil invertebrates at the community level in this forest transect. Since the physical and chemical properties of litter and soil were not tested in this study, the specific reasons for the formation of these strongly aggregated “patches” cannot be revealed.
Although invertebrates in the litter layer have higher richness, the compositional changes between adjacent plots are greater in the soil layer. However, the altitudinal pattern of the communities in both layers is dominated by a small number of taxa. Subsequent analyses of these dominant taxa (such as patterns of abundance and ecological niche) are needed to deepen our understanding of community assembly mechanisms [38,39,40]. Although the contributions of internal taxa to the pattern are similar in both layers, the higher abundance of soil invertebrates in the soil layer results in a much stronger pattern intensity than that in the litter layer. At the same time, the consistency of the pattern of soil invertebrates in the soil layer is slightly higher than that in the litter layer, regardless of specific scales or aggregated “patches”. In addition, interspecific associations are an important part of studying community assembly processes and the distribution patterns of multiple taxa, reflecting the interactions among different taxa, their adaptation to the external environment, and the utilization of spatial resources [41,42]. Strongly positively associated taxa often have similar altitudinal distribution patterns and similar environmental adaptations [43]. We found that the associations among the same invertebrate taxa may also differ between the litter layer and the soil layer (such as Mesostigmata and Isotomidae), and it may also change with the increase or decrease in other species in the community. We suggest that future studies on soil invertebrates consider the connections and differences between the litter and soil layers based on multiple sampling methods [44], especially focusing on the distribution patterns and aggregation mechanisms of some dominant taxa.
In this study, there was no occurrence of multiple scales of aggregated “patches” along a specific ordination axis in neither the litter nor soil layer, indicating no significant nesting in specific taxa combinations. On the one hand, it may be because Quercus wutaishanica, which is the dominant species in this altitudinal transect, provides relatively simple and low-spatial-heterogeneity food for soil invertebrates [21,45]. On the other hand, compared with plants or large animals, the small body size of soil invertebrates determines their limited migration and small-scale autocorrelation in spatial distribution [10,46]. The measurement scale of 10 m × 10 m used in this study may be too large for soil invertebrates, making it difficult to obtain the aggregation scale driven by microecological processes. In the future, more intensive sampling is needed to explore their potential fine-scale pattern information and conduct more detailed analyses for different size-functional groups [47].

5. Conclusions

This study, using multi-species multi-scale ordination, confirmed that in temperate mountain forests: (1) invertebrate communities in both litter layer and soil layer exhibit aggregated “patches” with different scales dominated by a few taxa along the same altitudinal gradient. Further research is needed to explore the mechanisms by which these specific dominant taxa respond to altitudinal gradients. (2) The associations among soil invertebrate taxa are not constant and change between the two layers or with different taxon compositions. Furthermore, this study only provides insights into the altitudinal distribution patterns of soil invertebrate communities at the measurement scale (10 m × 10 m). Future research should investigate the multi-scale spatial patterns of communities at smaller survey scales and integrate more biological taxa (such as microbial communities) to gain a more comprehensive understanding of the mechanisms driving species aggregation in soil ecosystems.

Author Contributions

Conceptualization, Z.D. and K.M.; methodology, Z.D.; investigation, G.X., S.Z. and Y.Z.; writing—original draft preparation, Z.D.; writing—review and editing, G.X., S.Z., Y.Z. and K.M. All authors have read and agreed to the published version of the manuscript.

Funding

This research was funded by National Natural Science Foundation of China [31470481].

Data Availability Statement

All data that support the findings of this study are available upon request from the corresponding author.

Acknowledgments

We thank Yinghua Lin, Yanpeng Xu, and Ping Lu for their assistance in the identification of soil invertebrates. We also thank Quan Chen, Qiang Zhang, and Bingbing Wang for their help in the field sampling of soil invertebrates, and Xiu Yuan, Guixiang Li, Naiqing Fan, and Yuzhou Chen for the investigation of plants.

Conflicts of Interest

The authors declare no conflict of interest. The funders had no role in the design of the study; in the collection, analyses, or interpretation of data; in the writing of the manuscript; or in the decision to publish the results.

References

  1. Hansen, R.A. Effects of habitat complexity and composition on a diverse litter microarthropod assemblage. Ecology 2000, 81, 1120–1132. [Google Scholar] [CrossRef]
  2. García-Palacios, P.; Maestre, F.T.; Kattge, J.; Wall, D.H. Climate and litter quality differently modulate the effects of soil fauna on litter decomposition across biomes. Ecol. Lett. 2013, 16, 1045–1053. [Google Scholar] [CrossRef] [PubMed]
  3. Osler, G.H.R.; Sommerkorn, M. Toward a complete soil C and N cycle: Incorporating the soil fauna. Ecology 2007, 88, 1611–1621. [Google Scholar] [CrossRef]
  4. Bardgett, R.D.; van der Putten, W.H. Belowground biodiversity and ecosystem functioning. Nature 2014, 515, 505–511. [Google Scholar] [CrossRef] [PubMed]
  5. Coyle, D.R.; Nagendra, U.J.; Taylor, M.K.; Campbell, J.H.; Cunard, C.E.; Joslin, A.H.; Mundepi, A.; Phillips, C.A.; Callaham, M.A. Soil fauna responses to natural disturbances, invasive species, and global climate change: Current state of the science and a call to action. Soil Biol. Biochem. 2017, 110, 116–133. [Google Scholar] [CrossRef]
  6. Landesman, W.J.; Treonis, A.M.; Dighton, J. Effects of a one-year rainfall manipulation on soil nematode abundances and community composition. Pedobiologia 2011, 54, 87–91. [Google Scholar] [CrossRef]
  7. Ding, J.; Eldridge, D.J. Drivers of soil biodiversity vary with organism type along an extensive aridity gradient. Appl. Soil Ecol. 2022, 170, 104271. [Google Scholar] [CrossRef]
  8. Levin, S.A. The Problem of Pattern and Scale in Ecology: The Robert H. MacArthur Award Lecture. Ecology 1992, 73, 1943–1967. [Google Scholar] [CrossRef]
  9. Chave, J. The problem of pattern and scale in ecology: What have we learned in 20 years? Ecol. Lett. 2013, 16, 4–16. [Google Scholar] [CrossRef]
  10. Caruso, T.; Taormina, M.; Migliorini, M. Relative role of deterministic and stochastic determinants of soil animal community: A spatially explicit analysis of oribatid mites. J. Anim. Ecol. 2012, 81, 214–221. [Google Scholar] [CrossRef]
  11. Magilton, M.; Maraun, M.; Emmerson, M.; Caruso, T. Oribatid mites reveal that competition for resources and trophic structure combine to regulate the assembly of diverse soil animal communities. Ecol. Evol. 2019, 9, 8320–8330. [Google Scholar] [CrossRef]
  12. Fierer, N.; Strickland, M.S.; Liptzin, D.; Bradford, M.A.; Cleveland, C.C. Global patterns in belowground communities. Ecol. Lett. 2009, 12, 1238–1249. [Google Scholar] [CrossRef] [PubMed]
  13. Xu, G.; Lin, Y.; Zhang, S.; Zhang, Y.; Li, G.; Ma, K. Shifting mechanisms of elevational diversity and biomass patterns in soil invertebrates at treeline. Soil Biol. Biochem. 2017, 113, 80–88. [Google Scholar] [CrossRef]
  14. Leibold, M.A.; Holyoak, M.; Mouquet, N.; Amarasekare, P.; Chase, J.M.; Hoopes, M.F.; Holt, R.D.; Shurin, J.B.; Law, R.; Tilman, D.; et al. The metacommunity concept: A framework for multi-scale community ecology. Ecol. Lett. 2004, 7, 601–613. [Google Scholar] [CrossRef]
  15. Sundqvist, M.K.; Sanders, N.J.; Wardle, D.A. Community and Ecosystem Responses to Elevational Gradients: Processes, Mechanisms, and Insights for Global Change. Annu. Rev. Ecol. Evol. Syst. 2013, 44, 261–280. [Google Scholar] [CrossRef]
  16. Wu, P.; Wang, C. Differences in spatiotemporal dynamics between soil macrofauna and mesofauna communities in forest ecosystems: The significance for soil fauna diversity monitoring. Geoderma 2019, 337, 266–272. [Google Scholar] [CrossRef]
  17. Tilman, D. Niche tradeoffs, neutrality, and community structure: A stochastic theory of resource competition, invasion, and community assembly. Proc. Natl. Acad. Sci. USA 2004, 101, 10854–10861. [Google Scholar] [CrossRef]
  18. Weiher, E.; Freund, D.; Bunton, T.; Stefanski, A.; Lee, T.; Bentivenga, S. Advances, challenges and a developing synthesis of ecological community assembly theory. Philos. Trans. R. Soc. B Biol. Sci. 2011, 366, 2403–2413. [Google Scholar] [CrossRef]
  19. Romdhane, S.; Spor, A.; Aubert, J.; Bru, D.; Breuil, M.-C.; Hallin, S.; Mounier, A.; Ouadah, S.; Tsiknia, M.; Philippot, L. Unraveling negative biotic interactions determining soil microbial community assembly and functioning. ISME J. 2022, 16, 296–306. [Google Scholar] [CrossRef]
  20. Huang, Y.; Yang, X.; Zhang, D.; Zhang, J. The effects of gap size and litter species on colonization of soil fauna during litter decomposition in Pinus massoniana plantations. Appl. Soil Ecol. 2020, 155, 103611. [Google Scholar] [CrossRef]
  21. Ganault, P.; Nahmani, J.; Hättenschwiler, S.; Gillespie, L.M.; David, J.-F.; Henneron, L.; Iorio, E.; Mazzia, C.; Muys, B.; Pasquet, A.; et al. Relative importance of tree species richness, tree functional type, and microenvironment for soil macrofauna communities in European forests. Oecologia 2021, 196, 455–468. [Google Scholar] [CrossRef] [PubMed]
  22. Körner, C. The use of ‘altitude’ in ecological research. Trends Ecol. Evol. 2007, 22, 569–574. [Google Scholar] [CrossRef] [PubMed]
  23. MacArthur, R.H. Geographical Ecology: Patterns in the Distribution of Species; Princeton University Press: Princeton, NJ, USA, 1984; pp. 1–269. [Google Scholar]
  24. Ushio, M.; Hsieh, C.-H.; Masuda, R.; Deyle, E.R.; Ye, H.; Chang, C.-W.; Sugihara, G.; Kondoh, M. Fluctuating interaction network and time-varying stability of a natural fish community. Nature 2018, 554, 360–363. [Google Scholar] [CrossRef] [PubMed]
  25. Ding, Z.; Ma, K. Identifying changing interspecific associations along gradients at multiple scales using wavelet correlation networks. Ecology 2021, 102, e03360. [Google Scholar] [CrossRef]
  26. Szabó, B.; Korányi, D.; Gallé, R.; Lövei, G.L.; Bakonyi, G.; Batáry, P. Urbanization decreases species richness, and increases abundance in dry climates whereas decreases in wet climates: A global meta-analysis. Sci. Total. Environ. 2023, 859, 160145. [Google Scholar] [CrossRef]
  27. Noy-Meir, I.; Anderson, D.J. Multiple Pattern Analysis or Multiscale Ordination: Pathway to a Vegetation Hologram. In Statistical Ecology III. Many Species Populations, Ecosystems and Systems Analysis; Patil, G.P., Pielou, E.C., Waters, W.E., Eds.; Pennsylvania State University Press: University Park, PA, USA, 1971; pp. 207–232. [Google Scholar]
  28. Dale, M.; Zbigniewicz, M. The evaluation of multi-species pattern. J. Veg. Sci. 1995, 6, 391–398. [Google Scholar] [CrossRef]
  29. R Core Team. R Version 3.5.3: A Language and Environment for Statistical Computing. R Foundation for Statistical Computing, Vienna, Austria. 2019. Available online: https://www.r-project.org (accessed on 6 October 2023).
  30. Rahbek, C. The role of spatial scale and the perception of large-scale species-richness patterns. Ecol. Lett. 2005, 8, 224–239. [Google Scholar] [CrossRef]
  31. González, G.; Lodge, D.J. Soil Biology Research across Latitude, Elevation and Disturbance Gradients: A Review of Forest Studies from Puerto Rico during the Past 25 Years. Forests 2017, 8, 178. [Google Scholar] [CrossRef]
  32. Birkhofer, K.; Henschel, J.R.; Scheu, S. Spatial-pattern analysis in a territorial spider: Evidence for multi-scale effects. Ecography 2006, 29, 641–648. [Google Scholar] [CrossRef]
  33. Davis, A.L.; Scholtz, C.H.; Deschodt, C. Multi-scale determinants of dung beetle assemblage structure across abiotic gradients of the Kalahari-Nama Karoo ecotone, South Africa. J. Biogeogr. 2008, 35, 1465–1480. [Google Scholar] [CrossRef]
  34. Reynolds, C.; Fletcher, R.J.; Carneiro, C.M.; Jennings, N.; Ke, A.; LaScaleia, M.C.; Lukhele, M.B.; Mamba, M.L.; Sibiya, M.D.; Austin, J.D.; et al. Inconsistent effects of landscape heterogeneity and land-use on animal diversity in an agricultural mosaic: A multi-scale and multi-taxon investigation. Landsc. Ecol. 2018, 33, 241–255. [Google Scholar] [CrossRef]
  35. Korboulewsky, N.; Perez, G.; Chauvat, M. How tree diversity affects soil fauna diversity: A review. Soil Biol. Biochem. 2016, 94, 94–106. [Google Scholar] [CrossRef]
  36. Sauvadet, M.; Chauvat, M.; Brunet, N.; Bertrand, I. Can changes in litter quality drive soil fauna structure and functions? Soil Biol. Biochem. 2017, 107, 94–103. [Google Scholar] [CrossRef]
  37. Jiang, Z.; Ma, K.; Liu, H.; Tang, Z. A trait-based approach reveals the importance of biotic filter for elevational herb richness pattern. J. Biogeogr. 2018, 45, 2288–2298. [Google Scholar] [CrossRef]
  38. Massaccesi, L.; Bardgett, R.D.; Agnelli, A.; Ostle, N.; Wilby, A.; Orwin, K.H. Impact of plant species evenness, dominant species identity and spatial arrangement on the structure and functioning of soil microbial communities in a model grassland. Oecologia 2015, 177, 747–759. [Google Scholar] [CrossRef] [PubMed]
  39. Lazzaro, L.; Mazza, G.; D’Errico, G.; Fabiani, A.; Giuliani, C.; Inghilesi, A.F.; Lagomarsino, A.; Landi, S.; Lastrucci, L.; Pastorelli, R.; et al. How ecosystems change following invasion by Robinia pseudoacacia: Insights from soil chemical properties and soil microbial, nematode, microarthropod and plant communities. Sci. Total. Environ. 2018, 622, 1509–1518. [Google Scholar] [CrossRef]
  40. Jia, Y.; Sun, Y.; Zhang, T.; Shi, Z.; Maimaitiaili, B.; Tian, C.; Feng, G. Elevated precipitation alters the community structure of spring ephemerals by changing dominant species density in Central Asia. Ecol. Evol. 2020, 10, 2196–2212. [Google Scholar] [CrossRef] [PubMed]
  41. Morueta-Holme, N.; Blonder, B.; Sandel, B.; McGill, B.J.; Peet, R.K.; Ott, J.E.; Violle, C.; Enquist, B.J.; Jørgensen, P.M.; Svenning, J. A network approach for inferring species associations from co-occurrence data. Ecography 2016, 39, 1139–1150. [Google Scholar] [CrossRef]
  42. Uvarov, A.V.; Ilieva-Makulec, K.; Karaban, K.; Yakovenko, N.S.; Uchmański, J. Effects of Intra- and Interspecific Interactions in Earthworm Assemblages: A Comparative Study. Biol. Bull. 2019, 46, 475–482. [Google Scholar] [CrossRef]
  43. Chazot, N.; Willmott, K.R.; Endara, P.G.S.; Toporov, A.; Hill, R.I.; Jiggins, C.D.; Elias, M. Mutualistic Mimicry and Filtering by Altitude Shape the Structure of Andean Butterfly Communities. Am. Nat. 2014, 183, 26–39. [Google Scholar] [CrossRef]
  44. Querner, P.; Bruckner, A. Combining pitfall traps and soil samples to collect Collembola for site scale biodiversity assessments. Appl. Soil Ecol. 2010, 45, 293–297. [Google Scholar] [CrossRef]
  45. Marsden, C.; Martin-Chave, A.; Cortet, J.; Hedde, M.; Capowiez, Y. How agroforestry systems influence soil fauna and their functions—A review. Plant Soil 2020, 453, 29–44. [Google Scholar] [CrossRef]
  46. Bae, S.; Heidrich, L.; Levick, S.R.; Gossner, M.M.; Seibold, S.; Weisser, W.W.; Magdon, P.; Serebryanyk, A.; Bässler, C.; Schäfer, D.; et al. Dispersal ability, trophic position and body size mediate species turnover processes: Insights from a multi-taxa and multi-scale approach. Divers. Distrib. 2021, 27, 439–453. [Google Scholar] [CrossRef]
  47. Potapov, A.M.; Beaulieu, F.; Birkhofer, K.; Bluhm, S.L.; Degtyarev, M.I.; Devetter, M.; Goncharov, A.A.; Gongalsky, K.B.; Klarner, B.; Korobushkin, D.I.; et al. Feeding habits and multifunctional classification of soil-associated consumers from protists to vertebrates. Biol. Rev. 2022, 97, 1057–1117. [Google Scholar] [CrossRef] [PubMed]
Figure 1. Species accumulation curves (a) and Venn diagrams at order and family levels (b) of soil invertebrates in the litter and soil layers.
Forests 14 02009 g001
Figure 2. Alpha and beta diversity of soil invertebrates in the litter and soil layers (**, p < 0.01; ***, p < 0.001).
Forests 14 02009 g002
Figure 3. Multi-scale ordination of soil invertebrate communities in the litter layer. Covariances based on the first two eigenvectors (a). In order to facilitate graphing, the data were normalized (divided by the respective root mean square). Covariance intensity at different scales (b). Weighted average values of soil invertebrate communities along the altitudinal gradient at the 32-plot (c) and 11-plot scales (d). The blue solid line represents the first ordination axis, and the orange solid line represents the second ordination axis.
Forests 14 02009 g003
Figure 4. Multi-scale ordination of soil invertebrate communities in the soil layer. Covariances based on the first two eigenvectors (a). In order to facilitate graphing, the data were normalized (divided by the respective root mean square). Covariance intensity at different scales (b). Weighted average values of soil invertebrate communities along the altitudinal gradient at the 34-plot (c) and 33-plot scales (d). The blue solid line represents the first ordination axis, and the orange solid line represents the second ordination axis.
Forests 14 02009 g004
Table 1. Contributions of various taxa in the litter layer to patterns and corresponding eigenvectors.
First Ordination AxisSecond Ordination Axis
TaxaEigenvectorContributionTaxaEigenvectorContribution
Mesostigmata0.69510.4831Onychiuridae−0.9420.8873
Apterogasterine oribatid mites0.59140.3497Isotomidae0.24390.0595
Entomobryidae0.29010.0841Mesostigmata0.16440.027
Macropylina oribatid mites0.16840.0283Macropylina oribatid mites−0.08890.0079
Tomoceridae0.12110.0147Tomoceridae−0.07910.0063
Formicidae0.09740.0095Pterogasterine oribatid mites−0.06450.0042
Neanuridae0.09350.0087Entomobryidae−0.04950.0024
The top 7 contributing taxa.
Table 2. Contributions of various taxa in the soil layer to patterns and corresponding eigenvectors.
First Ordination AxisSecond Ordination Axis
TaxaEigenvectorContributionTaxaEigenvectorContribution
Mesostigmata0.77540.6013Diadocidiidae−0.63420.4023
Apterogasterine oribatid mites0.54260.2944Apterogasterine oribatid mites0.50970.2598
Isotomidae0.2880.0829Mesostigmata−0.42930.1843
Macropylina oribatid mites0.12050.0145Isotomidae0.24260.0588
Enchytraeidae0.0510.0026Enchytraeidae−0.17460.0305
Formicidae0.02930.0009Macropylina oribatid mites0.15040.0226
Empididae0.02790.0008Onychiuridae−0.12070.0146
The top 7 contributing taxa.
Disclaimer/Publisher’s Note: The statements, opinions and data contained in all publications are solely those of the individual author(s) and contributor(s) and not of MDPI and/or the editor(s). MDPI and/or the editor(s) disclaim responsibility for any injury to people or property resulting from any ideas, methods, instructions or products referred to in the content.

