Abstract
The composition and stability of soil aggregates are important characteristics for evaluating soil health. The objective of this study was to explore the effects of different restoration modes and secondary succession sequences of Korean pine on the stability of forest soil aggregates after clear cutting and their causes. The stability and composition of soil aggregates in 0–10 cm, 10–20 cm, and 20–40 cm were analyzed in four natural forests in the secondary succession sequence and a Pinus koraiensis plantation in the clear-cutting area of Liangshui National Nature Reserve, and the effects of forest community characteristics and cementing materials on these aggregates were explored. With the advancement of succession, the large soil water-stable aggregates and mechanical aggregates increased, and the stability increased. From the pioneer community to the top community, the proportion of macroaggregates in the soil mechanical aggregates in the 20–40 cm soil layer increased by 36%, while that in the water-stable aggregates in the 10–20 cm soil layer increased by 19%. Compared with plantation, the stability of soil aggregates in natural forests with a similar age was stronger. Water-stable aggregates were negatively correlated with bulk density, density, and porosity, and positively correlated with organic-matter-related cement. The volume of the dominant tree, litter yield, tree species diversity, biomass of various tree species, and litter biomass in the undecomposed layer were the key indicators affecting the stability of aggregates. In terms of restoration measures, natural restoration is better than plantations with a single tree species. In addition, succession makes forest soil aggregates more stable. The change of dominant tree species leads to changes in soil aggregate stability, and the effect of organic-related cementing material was stronger than that of iron oxide.
1. Introduction
To restore degraded forests, a number of different approaches are used including artificial planting but also the utilization of natural or augmented secondary succession. The aim of restoration is to restore all aspects of material and nutrient cycling in forests, including biotic factors [1,2,3] and abiotic factors [4,5]. The restoration of nutrient cycling is due to the build-up of organic material within the ecosystem [6] and is strongly related to both the primary productivity, and thus the amount of organic matter entering the ecosystem [7], but also the quality of the plant material [8]. The restoration of soil health can be estimated by the formation of soil aggregates. The formation of soil aggregates is promoted by the inclusion of particulate organic matter in the soil [9] and roots exudates [10]. Plant root exudates promote microbial activity [11] by producing a large amount of polysaccharides, which enter the soil and act as a binder of soil aggregates [12]. Plant growth accelerates the movement and transformation of substances in the soil [13], increases the cation exchange ability in the soil, reduces internal stress in the soil, and prevents the disintegration of soil aggregates. Plant growth also promotes the redistribution of inorganic carbon in the soil and increases the amount of inorganic carbon in the deep layer [14]. Therefore, research on changes in soil quality after vegetation restoration is urgently needed to understand the mechanisms underlying forest restoration in a more comprehensive manner.
Soil structure involves a three-dimensional interaction between the particles of soil primary aggregates, and soil aggregates constitute the basic units of soil structure [15]. The stability of these aggregates is one of the main indicators of changes in soil quality. Generally, a particle size of 0.25 mm is the standard size of soil aggregates. Particles with a size greater than 0.25 mm are referred to as macroaggregates, and particles with a size lesser than 0.25 mm are referred to as microaggregates [16]. A variety of aggregate stability evaluation methods based on size are available, namely, mean weight diameter (MWD) [17], geometric mean diameter (GMD) [18], fractal dimension (D) [19], and erosion resistance coefficient (K) [20]. Among these measurement parameters, MWD is calculated by the weighted sum of the mass and size of each particle, and the measurement method was improved by Aksakal to calculate mean weight aggregate stability [21]. In an evaluation of aggregates, compared with the MWD, the GMD represents the average size of soil particles. Turcotte described soil as a system with fractal characteristics and proposed a particle size distribution formula [22]. Yang Peiling used the weight of particles instead of the number of particles in the distribution formula, which can more flexibly and accurately evaluate the stability of soil aggregates [19]. Such methods have been widely used in the evaluation of soil aggregate stability. Kong et al. used MWD, GMD, and D values to evaluate the influence of different types of shelterbelts on the stability of cultivated soil aggregates [23]. Ran et al. evaluated the stability of soil aggregates under the influence of different hydrological stress intensities in the Three Gorges Reservoir Area by calculating the MWD, GMD, and transfer matrix (ASI) [24].
In the context of forest restoration and succession, many studies have evaluated the mechanism underlying the composition and stability of soil aggregates. Dou et al. analyzed the stability of soil aggregates in the Loess Plateau, wherein seven types of restoration methods were applied; the authors reported that restoration measures for natural shrubs improved the stability and erosion resistance of soil aggregates, which were higher than restoration measures for forest and grass [25]. Xiao et al. conducted a study of soil aggregate stability during vegetation succession on the Loess Plateau and reported that plant root characteristics and soil organic carbon (SOC) characteristics are the main factors affecting the stability of soil aggregates [26]. Demenois et al. analyzed the influence of population dynamics on the stability of tropical plant community succession in the Ferrasol area and reported that vegetation coverage and its community composition greatly and significantly contributed to the stability of soil aggregates [27]. More attention should be paid to the influence of population dynamics on soil stability. Previous studies have investigated the stability of soil aggregates in the ecosystems of the Loess Plateau and Qinghai-Tibet Plateau in China at different stages of succession. However, the impact of secondary succession and afforestation on the composition and stability of soil aggregates in broad-leaved Korean pine forests after clear-cutting remains uncertain.
Broad-leaved Korean pine forests constitute a significant forest ecosystem in the Lesser Khingan Mountain Range. Nevertheless, during the 20th century, a series of clear-cutting activities occurred due to various human factors. Subsequently, restoration measures were implemented, including the extensive planting of Korean pine seedlings, without additional management practices. Towards the end of the 20th century, in order to conserve the natural forest resources, the policy of mountain closure and forest restoration/cultivation was enforced in the region. The secondary succession of the broad-leaved Korean pine forest represents one of the primary approaches for vegetation restoration in this area. In the present study, a chronosequence of forest plant community types (forest types) during the secondary succession of a broad-leaved Korean pine forest after clear-cutting, pioneer community (OC; natural maple birch secondary forest, 39 years old), middle community (MC; secondary broad-leaved forest, 69 years old) stable community (SC; secondary broad-leaved mixed forest, 125 years old), top community (TC; originally broad-leaved pine forest, 230 years old), and Korean pine plantation (61 years old) were selected, and compared to artificial and natural afforestation. The purpose of this study was to compare the characteristics of soil aggregates in plantations and secondary forests of similar forest ages, and to explore the effects of secondary succession on the characteristics of soil aggregates. We made the following assumptions: (1) in terms of aggregate characteristics, the secondary restoration area has healthier soil than the plantation; (2) with the occurrence of succession, the characteristics of soil aggregates tend to be better; (3) the change in upper vegetation is a potential key factor affecting the characteristics of soil aggregates, which can be used as an intuitive factor to predict soil health in the future.
2. Materials and Methods
2.1. Study Site Background and Sample Plot Setting
The study sites were selected in Liangshui National Nature Reserve, Dailing District, Yichun City, Heilongjiang Province (Figure 1). The Liangshui Reserve mainly comprised Korean pine natural coniferous and broad-leaved mixed forest systems. Owing to a variety of factors, broad-leaved Korean pine forests in the reserve experienced multiple clear-cutting events before the 21st century [28]. When consulting forest historical archives and investigation, the sample plots were found to be broad-leaved Korean pine forests before the clear-cutting event. After clear-cutting, in some areas, the vegetation in the sample plots was restored by artificial restoration with Korean pine seedlings. No management measures were taken in other areas.
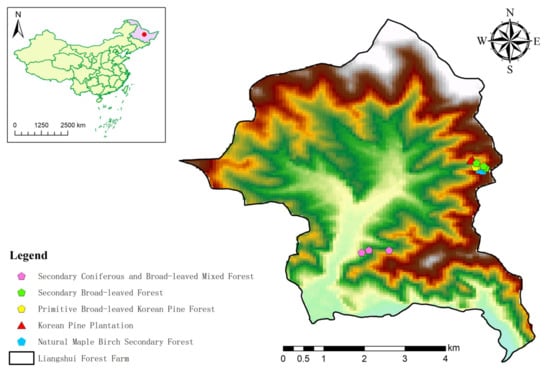
Figure 1.
Location of the research site.
Therefore, four representative types of natural forest plant communities (forest types) in different secondary succession sequences after clear-cutting of the broad-leaved Korean pine forest, and a planted Korean pine plantation, were selected for this study (Figure 2 contains photos and Table 1 presents information regarding the plot we set up). Growth cone was used to determine the age of each forest type. The characteristics of each stand type were as follows (Table 2).
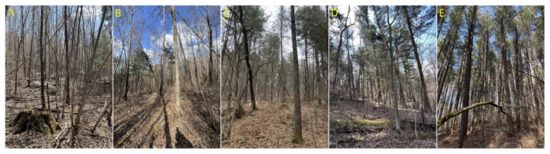
Figure 2.
Five selected forest types. (A) is the pioneer community, (B) is the middle community, (C) is the stable community, (D) is the top community, and (E) is the Korean pine artificial forest, reflecting the state of Korean pine in the sample plot. These photos were taken in April when broadleaf trees did not grow leaves to reflect the state of Korean pine.

Table 1.
Overview of plot characteristics.
Table 2.
Sample plot setting conditions.
Overall, three fixed plots (20 m × 30 m) were established for each forest type, with a total of 15 plots, and the distance between the plots was greater than 30 m. A background survey was conducted on trees with a diameter at breast height of ≥2 cm in each plot, and information on species name, exact diameter at breast height, tree height, and listing number was collected.
2.2. Community Status Analysis
Based on the background survey data, the timber volume of each tree species in the sample plot was calculated using the binary volume table of each tree species, and the biomass of each tree species per unit area of each plot was estimated using the continuous biomass expansion factor method (BEF) [29].
where B is the biomass per unit area of stand, a and b are constants, V is the timber volume in the plot, and binary volume table is used to calculate the timber volume.
Margalefs index was used to evaluate the biodiversity of trees within different communities:
where S is the total number of trees in the sample plot and N is the total number of individuals in all tree species in the sample plot [30].
where R is the proportion of conifers and broad-leaved trees, VC is the growing stock of conifers in the plot, and VB is the growing stock of broad-leaved trees in the plot.
Using the direct collection method, forest litter was collected from fixed-size quardrats (the area size was 1 m2, 5 quadrats were set in each plot, and 15 quadrats were set in each forest type, with 45 in total) and fresh litters were by self-made litter collection box (the area size is 1 m2; the number was the same as that of forest litter), and the biomass of the litters was measured by drying. After crushing, the organic carbon content was measured using the total organic carbon (TOC) analyzer (TOC and total organic nitrogen analyzer; Shanghai, China), and the litter yield and standing carbon storage were calculated.
2.3. Soil Sample Collection and Index Determination
The soil samples were collected using the profile method. The samples were collected by excavating a 60 cm deep pit and selecting the soil surface for repair. A soil knife was used to collect the soil samples at depths (surface layers) of 0–10 cm, 10–20 cm, and 20–40 cm below the litter layer, and they were placed in a fresh keeping box. Each soil layer of each plot was mixed after removing three portions, so that the soil under each condition (3 soil layers × 5 forest types) had three replicates; there were 45 in total. Additionally, the soil density, soil porosity, and soil bulk density were measured using the ring-knife method.
The soil samples were brought back to the laboratory and dried (moisture content of 220–250 g·kg−1), after which the dried samples were broken into small pieces (10 mm) along the natural structure and dried after removing impurities such as animal and plant residues and stones. Soil mechanical aggregates were separated using the Savinov dry sieve method [31], and soil water-stable aggregates were separated using the Elliott wet-sieving method [32]. The soil (200 g) was screened and categorized into macroaggregates, comprising aggregates of >2 mm, 2–0.25 mm, and microaggregates, comprising aggregates of 0.25–0.053 mm and <0.053 mm, and the mass ratio of each particle size was calculated.
Furthermore, additional procedures were conducted on air-dried soil samples to determine various indicators. The samples were crushed and passed through a 60-mesh sieve before being transferred to a self-sealing bag. The determination of soil organic carbon (SOC) was performed using a Elementaer TOC (Hamburg, Germany).
2.3.1. Determination of Humus Components
A 5 g air-dried soil sample was put in a 250 mL triangular flask; sodium pyrophosphate–sodium hydroxide was added. Samples were shaken for 30 min, and then left to stand for 13–14 h (about 20 °C). After pouring into a 100 mL centrifuge tube for centrifugation, the supernatant was poured into a 100 mL triangular flask for use. Take the above extract of 2–15 mL: depending on the color in the digestive tube, with the addition of 0.5 M H2SO4 solution to neutralize to pH7, the digestive tube evaporated in a boiling water bath. This extract comprises extractable humus.
A total of 50 mL of the spare supernatant was placed in a 100 mL Erlenmeyer flask, and 0.5 M H2SO4 solution was added dropwise at 60–70 °C. The solution was adjusted so that the pH of the liquid was below 3. At this time, the humic acid flocculent precipitate should appear. The solution was placed in a water bath at 80 °C for 30 min, and then cooled and allowed to stand (about 8 h) to completely precipitate the humic acid. The turbid fluid was filtered with slow filter pape, the filtrate was discarded, and the precipitate was washed with 0.025 M dilute H2SO4 solution 3 times. A total of 0.05 M sodium oxide solution (40–50 °C) was used to wash the precipitate in a 50 mL volumetric flask in a small amount, and this was carried out multiple times until a constant volume was attained. Then, 10–25 mL of the solution was taken into the digestive tube and neutralized with 0.5 M H2SO4 solution to pH7. The digestive tube was evaporated to dryness in a boiling water bath. This extract is humic acid.
The fulvic acid content is the extractable humus content minus the humic acid content. Humin content is soil organic carbon content minus extractable humus content.
2.3.2. Determination of Iron Oxide Components
The extraction of free iron oxide (Fed) was achieved using a DCB solution, while amorphous iron oxide (Feo) was extracted using ammonium oxalate, and complex iron oxide (Fep) was extracted using sodium pyrophosphate. The iron content in these extracts was determined using an ultraviolet spectrophotometer.
2.4. Analysis of Soil Stability
Aggregate MWD (mm), GMD (%), and D were used to evaluate soil stability, according to the following formula:
where Xi is the average diameter of soil in any particle size range (mm), Wi is the percentage of aggregates with particle size i in total aggregates, and M is the total weight of the sample.
where W(δ < di) is the cumulative mass of soil particles less than the particle size di (the average particle size between the two sieve sizes), W0 is the sum of the mass of each particle size (g), di is the average diameter of a particle size aggregate (mm), and dmax is the maximum particle size diameter (mm) of the aggregate.
2.5. Data Analysis
Single-factor variance analysis was used to calculate the difference in soil aggregate stability among the five forest types; two-factor variance analysis was used to calculate the influence of forest type and soil layer on aggregate stability. RDA was used to calculate the influence of community characteristics and tree volume on soil aggregate stability. Pearson correlation analysis was used for the correlation between soil physical and chemical properties and soil aggregate stability.
3. Results
3.1. Characteristics of Soil Aggregates
3.1.1. Composition Characteristics of Soil Aggregates
As secondary succession progresses, the proportion of large aggregates of soil mechanical aggregates at depths of 0–10 cm, 10–20 cm, and 20–40 cm showed an increasing trend (Figure 3). With the progression of succession, the increments were 2%, 4%, and 2%, respectively, at the depth of 0–10 cm; at the depth of 10–20 cm, the increments were 1%, 6%, and 6%, respectively; at the depth of 20–40 cm, the increments were 25%, 0%, and 11%, respectively. From the OC to TC, the proportion of soil macroaggregates at a depth of 20–40 cm increased the most (36%); hence, the response of deep soil to the secondary succession was the most intense. The proportion of soil mechanical aggregates with a particle size exceeding 0.25 mm was found to be lower in the 69-year natural secondary forest (referred to as MC) compared to the 61-year Korean pine plantation forest. During the process of secondary succession, the content of soil macroaggregates in the 10–20 cm soil layer was higher across the four forest types than in the 0–10 cm and 20–40 cm soil layers, except for the Korean pine plantation, where the results were contradictory.
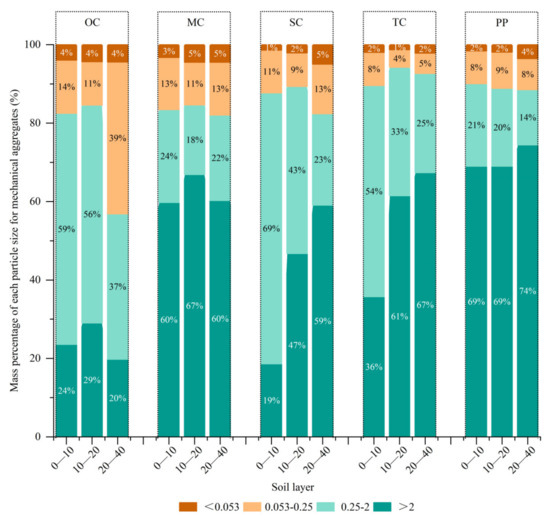
Figure 3.
Mass percentage of each particle size for mechanical aggregates. In the figure, PP is the Korean pine plantation, TC is the top community, SC is the stable community, MC is the middle community, and OC is the pioneer community.
Regarding particle size distribution, the soil aggregates in each soil layer of the original forest (OC) were primarily composed of particles sized 2–0.25 mm, while those in MC and the Korean pine plantation forest consisted mainly of particles larger than 2 mm. In the case of the second clear-cut forest (SC) and third clear-cut forest (TC), the surface layer (0–10 cm) predominantly contained soil aggregates sized 2–0.25 mm, while the surface layers of 10–20 cm and 20–40 cm were dominated by soil aggregates larger than 2 mm.
As for soil water-stable aggregates in this study (Figure 4), the proportion of large aggregates in the soil surface layer of 0–40 cm in SC was higher. In the 0–10 cm soil layer, the proportion of macroaggregates in the SC was the same as that in the MC and OC but 10% higher than that in the TC. In the 10–20 cm soil layer, the proportion of macroaggregates in the SC was 3%, 20%, and 21% higher than that in the TC, MC, and OC, and 2%, 12%, and 9% higher than that in the 20–40 soil layer. When comparing the 69-year MC with the 61-year Korean pine plantation in terms of the 0–10 cm, 10–20 cm, and 20–40 cm soil layers, the proportion of large aggregates in the natural forest soil was higher than that in the plantation, by 3%, 6%, and 5%, respectively. From the soil particle size distribution in each forest type, the 0–10 cm soil layer of OC, MC, and SC and Korean pine plantations predominantly contained aggregates of size >2 mm, while the TC predominantly contained aggregates of size 2–0.25 mm. In the soil surface layer of 10–20 cm, the aggregate size in OC, TC, and Korean pine plantation was mainly >2 mm, whereas that of MC and SC was mainly in the range of 2–0.25 mm. In the soil surface layer of 20–40 cm in each forest type, soil aggregate size was mainly in the range of 2–0.25 mm.
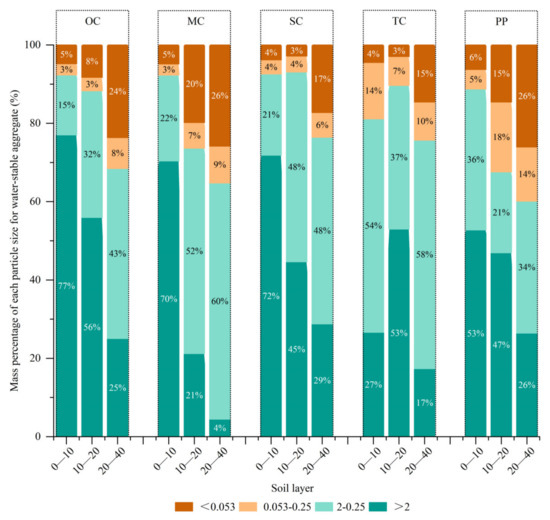
Figure 4.
Mass percentage of each particle size for water-stable aggregates. PP is the Korean pine plantation, TC is the top community, SC is the stable community, MC is the middle community, and OC is the pioneer community.
3.1.2. Stability Characteristics of Soil Aggregates
As shown in Table 3, except for the D value of soil mechanical aggregates, no significant difference existed in the interaction between forest type and soil layer. The mean weight diameter (MWD), geometric mass diameter (GMD), and fractal dimension (D) values of soil mechanical and water-stable aggregates were significantly different in different soil layers and forest types.
Table 3.
Effects of forest type and soil layer on the stability of mechanical and water-stable aggregates.
It can be seen from Figure 5 that the MWD, GMD and D values of mechanical aggregates in five forest types were 1.66–4.64,0.33–3.25 and 1.8–2.24, respectively. The values in water-stable aggregates were 0.97–4.8, 0.38–3.25 and 0.5–2.13, respectively. During the process of secondary succession, the mean weight diameter (MWD) of soil mechanical aggregates in the 0–10 cm and 10–20 cm soil layers of MC exhibited higher values compared to the other three forest types. However, the MWD of the 20–40 cm soil layer was the largest in TC. In contrast, the results for water-stable aggregates varied, with higher MWD values observed in all three soil layers for OC and SC. The MWDs in the 0–10 cm soil layer of TC and in the 10–20 cm and 20–40 cm soil layers of MC were the lowest. The geometric mean diameter (GMD) of soil mechanical and water-stable aggregates exhibited similar trends across different soil layers during the succession process. The GMD was smallest in the 0–10 cm soil layer of the apex community but increased with the progression of secondary succession in the 10–20 cm and 20–40 cm soil layers.
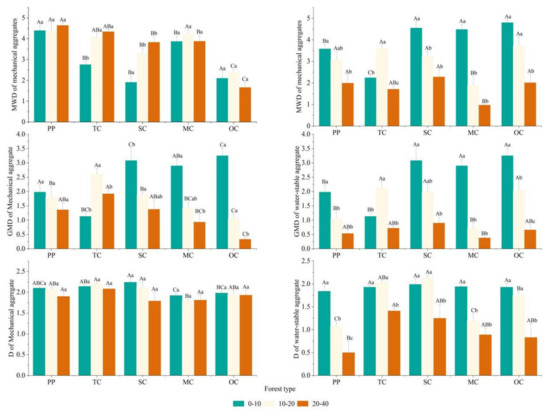
Figure 5.
Aggregate stability of different soil layers in each forest type. PP is the Korean pine plantation, TC is the top community, SC is the stable community, MC is the middle community, OC is the pioneer community, MWD is mean weight diameter, GMD is geometric mass diameter, and D is fractal dimension. Different uppercase letters indicate differences between different forest types (p < 0.05), and different lowercase letters indicate differences between different soil layers (p < 0.05).
To provide a more accurate and convenient comparison of soil aggregate stability in different samples, the D value of different communities was examined. The D value of soil mechanical aggregates in the 0–10 cm and 10–20 cm soil layers initially increased and then decreased as secondary succession progressed, reaching its peak in SC. However, there was no significant difference in the 20–40 cm soil layer. No significant difference was observed in the D value of water-stable aggregates in the 0–10 cm and 20–40 cm soil layers, and the D value of mechanical aggregates in the 10–20 cm layer was the same as that of soil mechanical aggregates. Overall, as secondary succession advanced, both soil mechanical aggregates and water-stable aggregates demonstrated a trend towards greater stability.
No significant difference existed in the MWD and mass diameter of soil mechanical aggregates between the MC of 69 years and the Korean pine plantation of 61 years. However, the D value of the Korean pine plantation was higher than that of the MC in numerical terms. For water-stable aggregates, the MWD of the 0–10 cm soil layer was significantly higher than that of the Korean pine plantation, but the MWD of the 10–20 cm and 20–40 cm soil layers of the Korean pine plantation was significantly higher than that of the MC in the pine plantation. The GMD showed a similar pattern, but the GMD of the Korean pine plantation in the soil layers of 10–20 cm and 20–40 cm was only numerically higher than that of the MC in the pine plantation, and the results were not significant. The D value of the MC was not significantly higher than that of the artificial Korean pine forest in the three layers of soil.
3.2. Effects of Soil Physical and Chemical Properties on the Stability of Soil Aggregates
3.2.1. Content of Cementing Materials in Soil Aggregates
The valure of extractable humus C, Humic acid C, Fulvic acid C, Humin C and organic carbon was 4.60–21.26 g/kg, 0.82–5.85 g/kg, 3.21–17.51 g/kg, 9.19–79.62 g/kg and 15.26–97.69 g/kg, respectively (Table 4). The 10 cm and 10–20 cm soil layers in different forest types, and the content of extractable humus in the 20–40 cm soil layer of SC were significantly higher than that of the other four forest types. No significant difference existed in the content of humic acid in the three layers of soil in the four forest types during secondary succession, and the content of the 0–10 cm soil layer in the Korean pine plantation was significantly lower than that in OC. The content of fulvic acid in the 10–20 cm soil layer of the TC was significantly lower than that in the other four forest types, and the content of fulvic acid in the 20–40 cm soil layer of the SC was significantly higher than that of the OC, TC, and Korean pine plantation. In the 10–20 cm and 20–40 cm soil layers, the humin content in the five forest types was not significantly different, but in the 0–10 cm soil layer, the humin content of the TC was significantly higher than that of the Korean pine plantation and the MC, and the OC was significantly higher than that of the MC. No significant difference existed in organic carbon content in the 10–20 cm soil layer. In the 0–10 cm soil, the content of TC was significantly higher than that of the MC and Korean pine plantation. In the 20–40 cm soil layer, the content of SC was significantly higher than that of the OC, MC, and Korean pine plantation. Organic carbon encompasses extractable humus and humin, and extractable humus can be further divided into humic acid and fulvic acid. To summarize, during the process of secondary succession, the variation in fulvic acid content was more pronounced in the 20–40 cm soil layer, while discrepancies in humic acid and humin content were primarily observed in the 0–10 cm soil layer. Across different soil layers within the same forest type, the levels of all organic carbon-related indicators followed the pattern of 0–10 cm > 10–20 cm > 20–40 cm.
Table 4.
Contents of organic carbon and humus components in soil in three layers of different forest types.
The value of Fed, Feo and Fep were 33.25–54.21 g/kg, 13.13–19.21 g/kg and 9.16–20.07 g/kg, respectively (Table 5). From the perspective of different forms of iron oxide, the Fed content showed no significant difference in the three layers of soil in the five forest types, and no difference existed among different soil layers of the same forest type. The contents of Feo and Fep were higher in late succession than in early succession. For example, Feo in the 0–10 cm and 10–20 cm soil layers in the SC was significantly higher than that in the OC. The Fep content in the 10–20 cm soil layer of TC, SC, and the plantation community was significantly higher than that of the OC and higher than that of MC, but the difference was not significant. In addition, the Fep content in the 20–40 cm soil layer of TC and SC was significantly higher than that of the plantation community, OC, and MC. Therefore, the contents of Feo and Fep provide a certain indication of the degree of soil development; that is, with the occurrence of secondary succession, the contents of Feo and Fep are higher.
Table 5.
Contents of each component of ferric oxide in soils in three layers of different forest types.
3.2.2. Effects of Soil Physical Properties and Aggregate Cementing Materials on the Stability of Soil Aggregates
There is clear evidence that all stability characteristics of soil water-stable aggregates display a negative correlation with soil physical properties, particularly soil density, which exhibits the highest correlation coefficient (Figure 6). Furthermore, a significant positive correlation was observed with respect to SOC, humus, and humus components. Among these, the strongest positive correlation was found between humin and organic carbon. The mean weight diameter (MWD) of soil mechanical aggregates exhibited a negative correlation with humic acid, SOC, and humin. The D value showed a negative correlation with soil density and porosity, and a positive correlation with Feo, SOC, and humin. However, the GMD of soil mechanical aggregates did not show a significant correlation with the selected indicators.
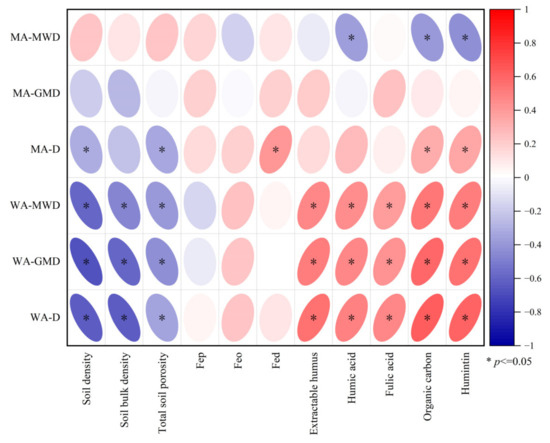
Figure 6.
Correlation analysis between soil physical and chemical properties and stability of soil aggregates * significant at p < 0.05, MWD is mean weight diameter, GMD is geometric mass diameter, and D is fractal dimension, MA is mechanical aggregates, and WA is water-stable aggregate.
3.3. Effects of Community Characteristics on the Stability of Soil Aggregates
Overall, the sum of the first and second axes of community characteristics was 71.42% (Table 6 and Figure 7). The top three explanatory rates for aggregate stability were litter yield, tree species diversity, and the ratio of coniferous trees to broad-leaved trees, with a total explanatory rate of 57.4%. The complete decomposed layer biomass of forest litter also had a higher explanatory rate of 9%. According to the RDA diagram, a significant positive correlation existed between litter yield and D value of soil mechanical and water-stable aggregates in the three layers of soil, whereas a significant negative correlation existed between litter biomass in the undecomposed layer (UFL) in the undecomposed layer and D value of water-stable aggregates. The GMD and MWD of soil mechanical aggregates were both significantly positively correlated with the biomass of trees and negatively correlated with the tree species diversity. The MWD and GMD of soil water-stable aggregates showed different correlations in different soil layers. The MWD and GMD of water-stable aggregates in the 0–10 cm soil layer showed a significant negative correlation with tree species diversity and UFL. However, the 10–20 cm and 20–40 cm soil layers showed a significant positive correlation with litter yield and a significant negative correlation with UFL. In conclusion, the characteristics of litter and community affect the stability characteristics of aggregates from different perspectives.
Table 6.
Effects of community characteristics on aggregate stability.
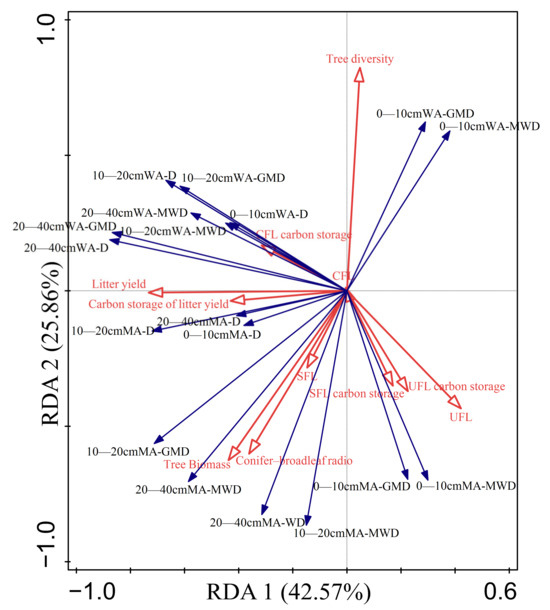
Figure 7.
RDA of community characteristic and aggregate stability. CFL is the fully decomposed layer, SFL is the semi-decomposed layer litter, and UFL is the undecomposed layer litter; MWD is mean weight diameter, GMD is geometric mass diameter, and D is fractal dimension; MA is mechanical aggregates, and WA is water-stable aggregate. In the figure, the red arrows represent the explanatory variables and the blue arrows represent the response variables.
The combined explanatory rates of the first and second axes, indicating that soil aggregate stability is influenced by tree species accumulation, accounted for 71.66% (Table 7 and Figure 8), aligning with the community characteristics. Tree species with explanation rates exceeding 10% included poplar, Korean pine, and maple birch. In particular, maple birch exhibited a positive correlation with the geometric mean diameter (GMD) and mean weight diameter (MWD) of water-stable aggregates in the 0–10 cm soil layer, but displayed a significant negative correlation with the GMD and MWD of soil mechanical aggregates in the 10–20 cm and 20–40 cm soil layers. Conversely, the relationship between Korean pine and soil stability characteristics of soil aggregates was entirely opposite to that of maple birch. Poplar and birch demonstrated a significant negative correlation with the D value of soil mechanical aggregates across all three soil layers. Furthermore, a significant correlation was observed between Acer pictum and Phellodendron amurense, and the stability indexes were distributed in the second and fourth quadrants.
Table 7.
Effects of tree species stock on soil stability.
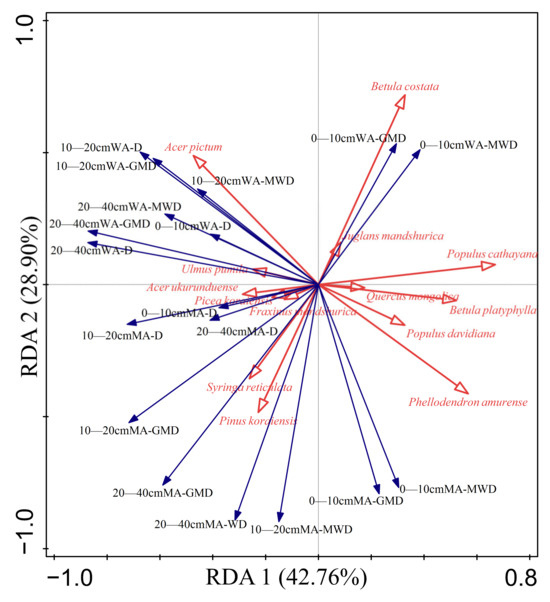
Figure 8.
RDA of community characteristic and aggregate stability MWD is mean weight diameter, GMD is geometric mass diameter, and D is fractal dimension, MA is mechanical aggregates, WA is water-stable aggregate. In the figure, the red arrows represent the explanatory variables and the blue arrows represent the response variables.
4. Discussion
4.1. Effects of Secondary Succession on Soil Aggregate Composition
As a crucial indicator in evaluating soil quality, soil aggregates exhibit a robust response to secondary succession. The process of secondary succession involves various factors, such as the refractory portion of litter [33,34], soil microorganisms [35,36], and plant roots [37,38], which are believed to play significant roles in regulating the composition of soil aggregates. These factors contribute to an increase in refractory carbon components within the soil and facilitate aggregate formation [39,40]. The physical protection provided by aggregate formation also hinders carbon release [41]. In this study, both soil mechanical aggregates and water-stable aggregates exhibited an increase in the proportion of stable macroaggregates during secondary succession, further confirming that secondary succession promotes the formation of macroaggregates within the soil. This result is similar to the results of Hu and Lan in their study of soil aggregate composition during vegetation succession in karst landforms in Southwest China, where natural vegetation restoration increased the percentage of soil macroaggregates but decreased the fraction of medium aggregates and microaggregates [42]. Wachendorf et al. selected five stages of vegetation succession in erosive areas, namely bare land, grassland, grassland shrub transition land, shrub, and secondary forest, and demonstrated an increase in macroaggregates of size >0.25 mm [40]. Ma et al. reported that the vegetation restoration process reduced the forces of soil exclusion, thereby reducing the disintegration degree of aggregates [43]. Xue et al. conducted a study on soil microorganisms during vegetation restoration and reported that macroaggregates have the highest microbial diversity, low environmental stress, and strong stability [44]. Sun et al. found that natural vegetation restoration rapidly increased the content and proportion of inert carbon in large aggregates of the soil. From the perspective of the increase in the size of large aggregates in different soil layers, the increase in the size of large aggregates in deep soil (20–40 cm depth) was the largest during secondary succession [45]. Changes in vegetation or land use in the upper layer of soil not only have an important effect on the shallow soil but also have an important impact on the deep soil [46,47]. For example, long-term conservation tillage in dryland will increase SOC content and macroaggregates in deep soils [48].
4.2. Effects of Secondary Succession on the Stability of Soil Aggregates
The mean weight diameter (MWD), geometric mean diameter (GMD), and D values of both water-stable aggregates and soil mechanical aggregates indicate that secondary succession enhances the stability of soil aggregates. This finding aligns with the conclusions drawn by Xiao et al. [26] in the secondary succession gradient of the Loess Plateau, which highlighted the close relationship between aggregate stability improvements and soil properties. Furthermore, there is a significant positive correlation between the content and composition of organic carbon and humus with water-stable aggregates. Numerous experiments have confirmed that soil organic carbon (SOC) and inert carbon pools play crucial roles in aggregate formation mechanisms. However, the correlation with soil mechanical aggregates is not as significant as that with water-stable aggregates. Soil mechanical aggregates are the result of external forces causing damage, and as a result, they are protected by various forces such as van der Waals force and internal stress. On the other hand, water-stable aggregates are structures that remain after water erosion disrupts the van der Waals forces and internal stress between the aggregates, leaving behind a relatively stable aggregate structure [43].
From the perspective of soil aggregate stability and population characteristics, most indicators of soil aggregate stability exhibit a negative correlation with tree species diversity but a positive correlation with tree litter production and tree biomass. This finding slightly deviates from the results reported by Pérès et al. [49] and Erktan et al. [37], which may be attributed to differences in the selected stands. During the succession process of the selected broad-leaved Korean pine secondary forest, maple birch and positive pioneer tree species dominated the stand initially. However, after reaching the mature canopy stage (MC), Korean pine became the primary canopy tree, alongside maple birch, reducing tree species diversity. Despite this reduction, the canopy height increased, resulting in a higher biomass per unit area. With an increase in aboveground biomass, there is also an increase in litter storage, nutrient content in litter, and root density in the soil. A redundancy analysis (RDA) of the volume of each tree species and the stability of soil aggregates revealed that maple birch, Korean pine, and aspen exhibited the highest explanatory power for soil aggregates. These tree species are dominant in the sample plot. The internal mechanisms by which plants influence soil aggregate stability are complex and varied. However, the relationship between aggregate accumulation and stability indicates that the dominant tree species in the plot primarily dictate the stability of soil aggregates.
4.3. Influence of Restoration Methods on the Stability of Soil Aggregate Composition
The proportion of macroaggregates in soil mechanical aggregates within the Korean pine plantation was relatively high, primarily due to the significant presence of aggregates with a particle size larger than 2 mm. However, the proportion of water-stable aggregates was lower compared to that of natural secondary forests. This disparity may be attributed to the plantation consisting of a single tree species, which can contribute to soil compaction and increased resistance to mechanical crushing. Nevertheless, the plantation exhibits weaker anti-erosion and anti-scouring capabilities in comparison to natural forests [50].
In terms of deep soil, a comparison between natural secondary forests and Korean pine plantations revealed that water-stable aggregates in natural secondary forests are more stable, and their stability is closely linked to the organic carbon content. These findings suggest that the deep soil in natural forests experiences greater interference from plant roots and microbial activity compared to plantations. Considering the results obtained by Lyu et al. [51], the increase in deep soil respiration rate resulting from forest transformation indicates that deep SOM may be more susceptible to decomposition and destabilization than surface SOC. Consequently, future research should explore the soil carbon sink and release of deep inorganic carbon after the implementation of various restoration measures. Additionally, it is crucial to assess the realization of ecological functions, the selection of tree species, and the methods of planting in future afforestation processes. These aspects were not evaluated in the present study, highlighting potential limitations.
In summary, incorporating near-natural mixed forests in forestry planning may enhance ecological benefits such as soil and water conservation in forested areas.
5. Conclusions
In terms of restoration measures, natural restoration is better than plantations containing a single tree species. In addition, succession makes forest soil aggregates more stable. A change in dominant tree species leads to changes in soil aggregate stability, and the effect of organic-related cementing material was stronger than that of iron oxide. Although this study uncovered the relationship between various soil physical and chemical properties and the stability of soil aggregates, data pertaining to organic carbon components and iron oxide in aggregates of different particle sizes were not collected. Consequently, the relationship between organic carbon, iron oxide, and the formation of aggregates with different particle sizes remains unknown and requires further investigation.
Author Contributions
Conceptualization: L.C. and W.D.; methodology, L.C. and Y.W.; software, Y.W.; validation, Y.W. and M.Q.; formal analysis, Y.W.; investigation, Y.W., M.Q., Z.T. and W.Y. and Z.W.; data curation, Y.W.; writing—original draft preparation, Y.W.; writing—review and editing, Y.W., L.C. and W.D.; visualization, Y.W.; supervision, L.C. and W.D.; project administration, L.C.; funding acquisition, L.C. All authors have read and agreed to the published version of the manuscript.
Funding
This research was funded by the Fundamental Research Funds for the central Universities, grant number 2572021DT04.
Data Availability Statement
The data that support the findings of this study are available from the corresponding author upon reasonable request.
Conflicts of Interest
The authors declare no conflict of interest.
References
- Bell-Doyon, P.; Bellavance, V.; Bélanger, L.; Mazerolle, M.J.; Villarreal, A.J.C. Bacterial, fungal, and mycorrhizal communities in the soil differ between clearcuts and insect outbreaks in the boreal forest 50 years after disturbance. For. Ecol. Manag. 2022, 523, 120493. [Google Scholar] [CrossRef]
- Izbicki, B.J.; Alexander, H.D.; Paulson, A.K.; Frey, B.R.; Mcewan, R.W.; Berry, A.I. Prescribed fire and natural canopy gap disturbances: Impacts on upland oak regeneration. For. Ecol Manag. 2020, 465, 118107. [Google Scholar] [CrossRef]
- Ren, S.; Ali, A.; Liu, H.; Yuan, Z.; Yang, Q.; Shen, G.; Zhou, S.; Wang, X. Response of community diversity and productivity to canopy gap disturbance in subtropical forests. For. Ecol. Manag. 2021, 502, 119740. [Google Scholar] [CrossRef]
- Bertini, S.C.B.; Stromberger, M.; Azevedo, L.C.B.; Cardoso, E.J.B.N. Soil physicochemical and biological profiles as indicators for Araucaria forest disturbance levels. Appl. Soil Ecol. 2021, 158, 103794. [Google Scholar] [CrossRef]
- Lin, S.; Fan, C.; Zhang, C.; Zhao, X.; von Gadow, K. Anthropogenic disturbance mediates soil water effect on diversity-productivity relationships in a temperate forest region. For. Ecol. Manag. 2022, 525, 120544. [Google Scholar] [CrossRef]
- Napora, K.; Noe, G.; Ahn, C.; Fellows, M.Q.N. Urban stream restorations increase floodplain soil carbon and nutrient retention along a chronosequence. Ecol. Eng. 2023, 195, 107063. [Google Scholar] [CrossRef]
- Li, Y.; Liu, G.; Song, Z.; Zhang, B.; Sun, M.; Tian, X.; Yang, D.; Wang, Y.; Zhu, L.; Cao, Y. Organic matter enrichment due to high primary productivity in the deep-water shelf: Insights from the lower Cambrian Qiongzhusi shales of the central Sichuan Basin, SW China. J. Asian Earth Sci. 2022, 239, 105417. [Google Scholar] [CrossRef]
- Joseph Oyedele, D.; Schjønning, P.; Sibbesen, E.; Debosz, K. Aggregation and organic matter fractions of three Nigerian soils as affected by soil disturbance and incorporation of plant material. Soil Tillage Res. 1999, 50, 105–114. [Google Scholar] [CrossRef]
- Man, M.; Pierson, D.; Chiu, R.; Tabatabaei Anaraki, M.; Vandenenden, L.; Ye, R.; Lajtha, K.; Simpson, M.J. Twenty years of litter manipulation reveals that above-ground litter quantity and quality controls soil organic matter molecular composition. Biogeochemistry 2022, 159, 393–411. [Google Scholar] [CrossRef]
- von Haden, A.C.; Kucharik, C.J.; Jackson, R.D.; Marín-Spiotta, E. Litter quantity, litter chemistry, and soil texture control changes in soil organic carbon fractions under bioenergy cropping systems of the North Central, U.S. Biogeochemistry 2019, 143, 313–326. [Google Scholar] [CrossRef]
- Vaidya, B.P.; Hagmann, D.F.; Haramuniz, J.; Krumins, J.A.; Goodey, N.M. Artificial root exudates restore microbial functioning in a metal contaminated, barren, inactive soil. Environ. Pollut. 2022, 312, 120007. [Google Scholar] [CrossRef]
- Chotte, J. Importance of Microorganisms for Soil Aggregation. In Microorganisms in Soils: Roles in Genesis and Functions; Varma, A., Buscot, F., Eds.; Springer: Berlin/Heidelberg, Germany, 2005; pp. 107–119. [Google Scholar]
- Ma, R.; Hu, F.; Xu, C.; Liu, J.; Zhao, S. Response of soil aggregate stability and splash erosion to different breakdown mechanisms along natural vegetation restoration. Catena 2022, 208, 105775. [Google Scholar] [CrossRef]
- Liu, M.; Han, G.; Zhang, Q. Soil organic carbon sequestration following a secondary succession of agricultural abandonment in the karst region of southwest China. Environ. Earth Sci. 2022, 81, 467. [Google Scholar] [CrossRef]
- Menon, M.; Mawodza, T.; Rabbani, A.; Blaud, A.; Lair, G.J.; Babaei, M.; Kercheva, M.; Rousseva, S.; Banwart, S. Pore system characteristics of soil aggregates and their relevance to aggregate stability. Geoderma 2020, 366, 114259. [Google Scholar] [CrossRef]
- Tisdall, J.M.; Oades, J.M. Organic matter and water-stable aggregates in soils. J. Soil Sci. 1982, 33, 141–163. [Google Scholar] [CrossRef]
- Xiao, L.; Yao, K.; Li, P.; Liu, Y.; Chang, E.; Zhang, Y.; Zhu, T. Increased soil aggregate stability is strongly correlated with root and soil properties along a gradient of secondary succession on the Loess Plateau. Ecol. Eng. 2020, 143, 105671. [Google Scholar] [CrossRef]
- Zhou, W.; Sun, X.; Li, S.; Du, T.; Zheng, Y.; Fan, Z. Effects of organic mulching on soil aggregate stability and aggregate binding agents in an urban forest in Beijing, China. J. For. Res. 2022, 33, 1083–1094. [Google Scholar] [CrossRef]
- Yang, P.; Luo, Y.; Shi, Y. Fractal features of soils characterized by grain size weight distribution. Chin. Sci. Bull. 1993, 38, 1896–1899. [Google Scholar] [CrossRef]
- Shirazi, M.A.; Boersma, L. A Unifying Quantitative Analysis of Soil Texture. Soil Sci. Soc. Am. J. 1984, 48, 142–147. [Google Scholar] [CrossRef]
- Aksakal, E.L.; Angin, I.; Sari, S. A new approach for calculating aggregate stability: Mean weight aggregate stability (MWAS). Catena 2020, 194, 104708. [Google Scholar] [CrossRef]
- Turcotte, D.L. Fractals and fragmentation. J. Geophys. Res. Solid Earth 1986, 91, 1921–1926. [Google Scholar] [CrossRef]
- Kong, T.; Liu, B.; Henderson, M.; Zhou, W.; Su, Y.; Wang, S.; Wang, L.; Wang, G. Effects of shelterbelt transformation on soil aggregates characterization and erodibility in China black soil farmland. Agriculture 2022, 12, 1917. [Google Scholar] [CrossRef]
- Ran, Y.; Wu, S.; Zhu, K.; Li, W.; Liu, Z.; Huang, P. Soil types differentiated their responses of aggregate stability to hydrological stresses at the riparian zones of the Three Gorges Reservoir. J. Soils Sediments 2020, 20, 951–962. [Google Scholar] [CrossRef]
- Dou, Y.; Yang, Y.; An, S.; Zhu, Z. Effects of different vegetation restoration measures on soil aggregate stability and erodibility on the Loess Plateau, China. Catena 2020, 185, 104294. [Google Scholar] [CrossRef]
- Xiao, L.; Yao, K.; Li, P.; Liu, Y.; Zhang, Y. Effects of freeze-thaw cycles and initial soil moisture content on soil aggregate stability in natural grassland and Chinese pine forest on the Loess Plateau of China. J. Soil Sediments 2020, 20, 1222–1230. [Google Scholar] [CrossRef]
- Demenois, J.; Carriconde, F.; Rey, F.; Stokes, A. Tropical plant communities modify soil aggregate stability along a successional vegetation gradient on a Ferralsol. Ecol. Eng. 2017, 109, 161–168. [Google Scholar] [CrossRef]
- Yu, D.; Zhou, L.; Zhou, W.; Ding, H.; Wang, Q.; Wang, Y.; Wu, X.; Dai, L. Forest Management in Northeast China: History, Problems, and Challenges. Environ. Manag. 2011, 48, 1122–1135. [Google Scholar] [CrossRef] [PubMed]
- Fang, J.; Wang, G.G.; Liu, G.; Xu, S. Forest biomass of china: An estimate based on the biomass–volume relationship. Ecol. Appl. 1998, 8, 1084–1091. [Google Scholar] [CrossRef]
- Qianwen, G.; Arif, M.; Zhongxun, Y.; Jie, Z.; Xinrui, H.; Dongdong, D.; Fan, Y.; Changxiao, L. Plant species composition and diversity along successional gradients in arid and semi-arid regions of China. For. Ecol. Manag. 2022, 524, 120542. [Google Scholar] [CrossRef]
- Zhao, S.; Yu, F.; Zhai, C.; Zhong, R.; Zhao, Y.; Wang, Y.; Zhang, J.; Meng, Q. Long-term effects of cattle manure application on the soil aggregate stability of salt-affected soil on the Songnen Plain of North-Eastern China. J. Soil Sediments 2023, 23, 344–354. [Google Scholar] [CrossRef]
- Lin, Y.; Ye, G.; Kuzyakov, Y.; Liu, D.; Fan, J.; Ding, W. Long-term manure application increases soil organic matter and aggregation, and alters microbial community structure and keystone taxa. Soil Biol. Biochem. 2019, 134, 187–196. [Google Scholar] [CrossRef]
- Levi, E.M.; Archer, S.R.; Throop, H.L.; Rasmussen, C. Soil-litter mixing promotes decomposition and soil aggregate formation on contrasting geomorphic surfaces in a shrub-invaded Sonoran Desert grassland. Plant Soil 2020, 450, 397–415. [Google Scholar] [CrossRef]
- Yavitt, J.B.; Fahey, T.J.; Sherman, R.E.; Groffman, P.M. Lumbricid earthworm effects on incorporation of root and leaf litter into aggregates in a forest soil, New York State. Biogeochemistry 2015, 125, 261–273. [Google Scholar] [CrossRef]
- Xu, Y.; Gao, X.; Pei, J.; Sun, L.; Wang, J. Crop root vs. shoot incorporation drives microbial residue carbon accumulation in soil aggregate fractions. Biol. Fertil. Soils 2022, 58, 843–854. [Google Scholar] [CrossRef]
- Xue, Z.; Wen, Z.; Zhou, Z.; An, S. The distribution of soil microbial parameters based on aggregate fractions in successional grassland restoration ecosystems on the Loess Plateau. SN Appl. Sci. 2020, 2, 1468. [Google Scholar] [CrossRef]
- Erktan, A.; Cécillon, L.; Graf, F.; Roumet, C.; Legout, C.; Rey, F. Increase in soil aggregate stability along a Mediterranean successional gradient in severely eroded gully bed ecosystems: Combined effects of soil, root traits and plant community characteristics. Plant Soil 2016, 398, 121–137. [Google Scholar] [CrossRef]
- Garcia, L.; Damour, G.; Gary, C.; Follain, S.; Le Bissonnais, Y.; Metay, A. Trait-based approach for agroecology: Contribution of service crop root traits to explain soil aggregate stability in vineyards. Plant Soil 2019, 435, 1–14. [Google Scholar] [CrossRef]
- Ali, W.; Hussain, S.; Chen, J.; Hu, F.; Liu, J.; He, Y.; Yang, M. Cover crop root-derived organic carbon influences aggregate stability through soil internal forces in a clayey red soil. Geoderma 2023, 429, 116271. [Google Scholar] [CrossRef]
- Wachendorf, C.; Potthoff, M.; Ludwig, B.; Joergensen, R.G. Effects of addition of maize litter and earthworms on C mineralization and aggregate formation in single and mixed soils differing in soil organic carbon and clay content. Pedobiologia 2014, 57, 161–169. [Google Scholar] [CrossRef]
- Liu, K.; Xu, Y.; Feng, W.; Zhang, X.; Yao, S.; Zhang, B. Modeling the dynamics of protected and primed organic carbon in soil and aggregates under constant soil moisture following litter incorporation. Soil Biol. Biochem. 2020, 151, 108039. [Google Scholar] [CrossRef]
- Hu, N.; Lan, J. Impact of vegetation restoration on soil organic carbon stocks and aggregates in a karst rocky desertification area in Southwest China. J. Soil Sediments 2020, 20, 1264–1275. [Google Scholar] [CrossRef]
- Ma, R.; Hu, F.; Liu, J.; Zhao, S. Evaluating the effect of soil internal forces on the stability of natural soil aggregates during vegetation restoration. J. Soil Sediments 2021, 21, 3034–3043. [Google Scholar] [CrossRef]
- Xue, Z.; Zhou, Z.; An, S. Changes in the soil microbial communities of different soil aggregations after vegetation restoration in a semiarid grassland, China. Soil Ecol. Lett. 2021, 3, 6–21. [Google Scholar] [CrossRef]
- Sun, L.; He, L.; Wang, G.; Jing, H.; Liu, G. Natural vegetation restoration of Liaodong oak (Quercus liaotungensis Koidz.) forests rapidly increased the content and ratio of inert carbon in soil macroaggregates. J. Arid Land 2019, 11, 928–938. [Google Scholar] [CrossRef]
- Ji, W.; Huang, Y.; Shi, P.; Li, Z. Recharge mechanism of deep soil water and the response to land use change in the loess deposits. J. Hydrol. 2021, 592, 125817. [Google Scholar] [CrossRef]
- Tong, Y.; Wang, Y.; Song, Y.; Sun, H.; Xu, Y. Spatiotemporal variations in deep soil moisture and its response to land-use shifts in the Wind–Water Erosion Crisscross Region in the Critical Zone of the Loess Plateau (2011–2015), China. Catena 2020, 193, 104643. [Google Scholar] [CrossRef]
- Wang, B.; Gao, L.; Yu, W.; Wei, X.; Li, J.; Li, S.; Song, X.; Liang, G.; Cai, D.; Wu, X. Distribution of soil aggregates and organic carbon in deep soil under long-term conservation tillage with residual retention in dryland. J. Arid Land 2019, 11, 241–254. [Google Scholar] [CrossRef]
- Pérès, G.; Cluzeau, D.; Menasseri, S.; Soussana, J.F.; Bessler, H.; Engels, C.; Habekost, M.; Gleixner, G.; Weigelt, A.; Weisser, W.W.; et al. Mechanisms linking plant community properties to soil aggregate stability in an experimental grassland plant diversity gradient. Plant Soil 2013, 373, 285–299. [Google Scholar] [CrossRef]
- Hua, F.; Bruijnzeel, L.A.; Meli, P.; Martin, P.A.; Zhang, J.; Nakagawa, S.; Miao, X.; Wang, W.; Mcevoy, C.; Peña-Arancibia, J.L.; et al. The biodiversity and ecosystem service contributions and trade-offs of forest restoration approaches. Science 2022, 376, 839–844. [Google Scholar] [CrossRef]
- Lyu, M.; Xie, J.; Ukonmaanaho, L.; Jiang, M.; Li, Y.; Chen, Y.; Yang, Z.; Zhou, Y.; Lin, W.; Yang, Y. Land use change exerts a strong impact on deep soil C stabilization in subtropical forests. J. Soil Sediments 2017, 17, 2305–2317. [Google Scholar] [CrossRef]
Disclaimer/Publisher’s Note: The statements, opinions and data contained in all publications are solely those of the individual author(s) and contributor(s) and not of MDPI and/or the editor(s). MDPI and/or the editor(s) disclaim responsibility for any injury to people or property resulting from any ideas, methods, instructions or products referred to in the content. |
© 2023 by the authors. Licensee MDPI, Basel, Switzerland. This article is an open access article distributed under the terms and conditions of the Creative Commons Attribution (CC BY) license (https://creativecommons.org/licenses/by/4.0/).