Abstract
Urban development and its climatic consequences have caused urban decision-makers to establish strategies to mitigate climate change. The implementation of different green spaces is one of the main strategies to reduce the environmental and climatic consequences of urbanization. Therefore, the main objective of this research is to reveal the effect of different green space scenarios on micro-bioclimatic conditions of a hospital located in Gorgan city, Golestan province. Therefore, in order to determine the position of the hospital building relative to Gorgan’s urban heat island (UHI), the location and changes in UHI intensity of Gorgan were determined as evidence of urban expansion. Since 27 July was determined as the hottest day in Gorgan city based on historical data analysis, the climatic conditions during 27 July 2021 were measured using an AR847 data logger installed in the hospital environment. Additionally, four different conditions, including actual environmental conditions of the hospital (actual conditions), along with the application of cypress trees (scenario A), plane trees (scenario B), and Buxus shrubs (scenario C), have been used to analyze the impact of different vegetation species on the bioclimatic conditions of 5 Azar Hospital during two time intervals, including observational periods (1970–2020) and the decade of the 2040s. Finally, spatiotemporal patterns of the predicted mean vote (PMV) thermal index were calculated for the observational period and during the 2040s using the ENVI-met micro-scale model. Results showed that the study site is in the UHI, which can affect the micro-bioclimatic conditions and the patient’s thermal perception. For all designed scenarios, results indicate that the average PMV index will increase by the 2040s. However, implementing different green space scenarios showed that the minimum and maximum values of PMV were found in scenario B, of 2.7. The actual PMV conditions of the studied site increased by 3.5. The scenario introduction of green spaces during the 2040s indicates that the average PMV at the hospital site will be decreased by 0.9 compared to the actual conditions. The study proves that appropriate green space strategies can reduce thermal loads occurring due to global climate change and improve the thermal conditions in the study area.
1. Introduction
In recent decades, the world’s population increase has led to the creation of thousands of cities and metropolises worldwide [1]. However, the urban design process has often neglected the impact of rapid urban expansion and land-use changes on urban public health. This may be due to the lack of interdisciplinary urban design and planning studies among climatologists, architects, and urban planners [2]. This disregard for unbridled urban development causes a variety of challenges to the health of people who live in cities worldwide. For instance, the urban heat island (UHI) effect, which is the name given to the higher temperature found in towns and cities than in surrounding rural or suburban areas in tropical cities, can compromise urban public health [3,4]. In other words, creating thermal comfort conditions in outdoor spaces can encourage city walking and improve public health and air quality [5,6]. Since citizens spend most of their time in open spaces, they are directly affected by the bioclimatic conditions of the outdoor environment. Among the citizens of a city, patients of a hospital are more sensitive to the bioclimatic conditions of the outdoor environment. In fact, some patients come to the outdoor environment during the day to enjoy the clean and fresh air of the open space of the hospital [7,8]. Therefore, patients are more vulnerable to outdoor thermal stresses caused by the urban climate [9].
Although attention to the hospital environments and their thermal comfort conditions is not a new topic, the outbreak of the COVID-19 pandemic again placed hospitals and health centers in the spotlight for many scientists and researchershers during the last two years. In 1968, Wyon, Lidwell, and Williams were among the first researchers to report that climatic elements, especially air temperature, have a significant effect on the thermal sensation experienced by hospital staff [10]. Research at the Bologna General Hospital indicated that the PMV comfort index was not within the range of thermal comfort in most rooms, especially in the summer [11]. For example, as reported in [12], hospitals’ thermal comfort conditions and annual energy demand for cooling will be affected by global climate change in six islands in the Indian Ocean region [12]. Hence, vulnerable hospital patients will need more dedicated care with the concurrent challenge of creating a more appropriate hospital environment [8].
Like many open urban environments, the bioclimatic conditions of the open spaces of hospitals are strongly affected by artificial structures such as buildings, sidewalks, asphalt roads, and natural structures, including green spaces, meadows, and soil-type water fountains. However, field studies in outdoor wards of hospitals are less common. Moreover, when considering global climate change, these designs must be sustainable and have an excellent perspective to provide thermal comfort both in the coming decades and in current conditions. Therefore, proper knowledge about the micro-bioclimatic environment of the hospitals may be an appropriate way to improve outdoor thermal comfort conditions, especially for patients and their companions or medical staff in that environment. In contrast, patients’ family members that use the garden rather than indoor spaces to mitigate stress can deal more efficiently with depression feelings [13]. A suitable climate-oriented design for hospital structures and open spaces can reduce the requirement and budget for ambient heat and patients’ vulnerability, especially under very high-temperature stresses. However, the effect of urban climate change on the thermal sensation of patients and the effectiveness of mitigation strategies is not well documented in the literature, represents the main literature gap in this research topic. Therefore, the main objective of the present study is to monitor and predict the effects of urban climate conditions on outdoor thermal comfort conditions of a health center of Gorgan City, which is located in “Csa” climatic conditions according to the Koppen Climate Classification. The 5 Azar Hospital in Gorgan City (Golestan province) in the North of Iran was selected as the study area (Figure 1). The study aims to reveal the effect of urban expansion on the thermal conditions of the health center and the patients’ thermal sensations. Furthermore, as a mitigation strategy, the impact of different green space scenarios on the spatiotemporal pattern of bioclimatic comfort of the hospital environment will be discussed. Since the 5 Azar Hospital is one of the largest hospitals in Gorgan city (Golestan province), it was selected as a case study. The study results can effectively create a platform for urban design and urban-landscape service structures and provide informed design decision recommendations to mitigate the future conditions arising from climate change.
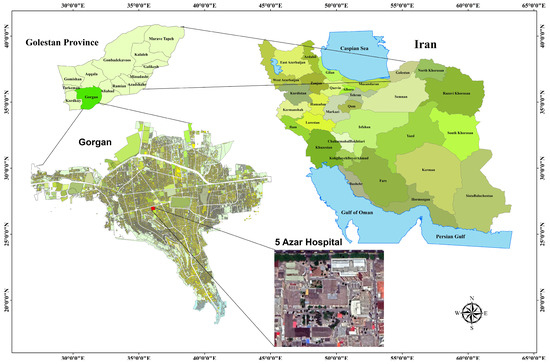
Figure 1.
The map of Iran, Golestan province and 5 Azar hospital location in Gorgan.
2. Materials and Methods
This research aims to evaluate the most acute bioclimatic conditions of heat stress to analyze the efficiency of different green space scenarios and reduce the heat budget load of urban services structures such as hospitals. Climatic parameters were extracted from the Gorgan weather station, including relative humidity (%), air temperature (°C), air velocity (m/s), and cloudiness (octas), and the hottest day of the year during the studied period (1970–2020) was determined. Furthermore, the mean radiant temperature (MRT) was calculated for the selected hottest day using RayMan software 1.1 (open source) [14,15]. For the evaluation of the thermal component of urban and regional climates, precise and high-resolution radiation data from the whole surrounding are necessary. These data can be either measured or calculated by use of a suitable radiation model. RayMan is one of these models. In the manual of this model, the calculation steps of MRT are explained. Another advantage of RayMan is that it is available for general use. Therefore, considering the validity of RayMan’s results in MRT modeling, which has been proven by various researchers [14,15,16,17,18,19,20,21,22], this model was used in the present study. Then, the variables were used for input into the ENVI-met micro-bioclimatic model in hourly time intervals. The 5 Azar Hospital in Gorgan City (Golestan province) was selected in the North of Iran as the study area. Gorgan city has 480,541 people, an area of 1700 km2 area, and a height of 155 m.
The coastal areas along the Caspian Sea typically have a mild, humid climate with relatively stable temperatures that rarely drop below 0 °C or rise above 29 °C. In contrast, mountainous regions endure harsh winters and heavy snowfall, while other parts of the area are arid. The humidity and temperature in these arid areas depend on their proximity to large bodies of water and the local topography. January tends to be the coldest month, with temperatures ranging from 0 to 10 °C, while July stands as the hottest month, with temperatures ranging from 20 to 30 °C [23]. Iran receives an average annual rainfall of approximately 240 mm. The Caspian seashore receives the highest rainfall, up to 1800 mm, while the sloping areas of the Alborz and Zagros mountains receive around 400 mm [24]. Gorgan is situated in the southeastern region of the Caspian Sea. It experiences an average annual relative humidity of 69.73% and maintains a yearly temperature average of 17.80 °C [25]. However, Gorgan is an area with a diverse topography, natural features, and is surrounded by water bodies, forests, and mountains. Therefore, its climate is affected by the atmospheric systems and varied local features. During the cold seasons, Siberian high pressure and westerlies affect its environment, while the Azores high pressure from the south controls its climate during the warm seasons. The activity and variability of these systems throughout the year significantly alter the wind flow [26]. Based on the Köppen climate classification, Gorgan experiences Csa Hot-summer Mediterranean climate conditions [27].
2.1. Remote Sensing Data Analysis to Identify Gorgan’s Urban Heat Island Pattern
Modis (Moderate Resolution Imaging Spectroradiometer) Terra satellite (originally known as EOS AM-1) data were used as 8-day composite images to evaluate changes in Gorgan’s UHI in the hottest month of the year. Since 5 Azar Hospital is located in the center of Gorgan, it is assumed that it is affected by anthropogenic heat consequences such as the UHI. Urban heat islands can strongly affect thermal comfort. Hence, identifying the geographical location of the studied area in relation to UHI can provide a warning to urban planners and designers to use different strategies, such as increasing green space to reduce the thermal budget and heat stress. The advantage of applying 8-day data, rather than daily data, is that these images have less cloud cover and the least amount of lost information in each frame. This product (MOD11A2) is a temperature indicator with a spatial resolution of 1000 m and a time frame of 8 accumulated days, covering the period of July 1 to July 31 for each year from 2000 to 2020. Furthermore, ArcGIS software 10.8.2 (ESRI, Redlands, CA, USA) was applied for the spatial analysis of temperature. Accordingly, the Getis–Ord statistics were computed for Hot Spot and air temperature analysis in context with neighboring cell temperatures. The value is a z-score indicating where high or low values are clustered. Statistically, a hot spot is significant when a given location will have a high value and be surrounded by high values. The Getis–Ord statistic is calculated as follows (Equation (1)) [28,29]:
where i is the resultant statistics (z-scores and p-values) for pixel i, xj is the land surface temperature (LST) value for pixel j, wi, j is the spatial weight between pixel i and neighboring pixel j, n is equal to the total number of pixels, and and S are mean and variance. S and are computed as follows (Equations (2) and (3)):
and
The statistical significance of clustering for a specified distance is determined by the statistic (z-score) output [28]. The z-score was then compared with a range of values entailing seven confidence levels (Table 1). The LST values were assigned to these seven levels. The “very cold spots” and “very hot spots” are areas with extreme values, which are very important in the analysis.

Table 1.
Classification based on p-value and z score [29,30].
The MOD11A2 V6 product provides an average 8-day land surface temperature [31] in a 1200 × 1200 km grid. The characteristics of the images were obtained from the Google Earth Engine system related to the Terra satellite Modis sensor. All images for 1 to 31 July 2000–2020 were downloaded, with Kelvin evaluation unit, a numerical range of 7500 to 65,535, a scale factor of two-hundredths, pixel size of 100 m, 16-bit data type, an 8-day time separation. The following link shows the urban heat island analysis programming from the Google Earth Engine website: https://code.earthengine.google.com/70551b3ca803cc639f87e87406008440, accessed on 1 January 2023.
It is essential to underscore that the intensity of the urban heat island (UHI) is computed based on the disparity between the land surface temperature (LST) in the urban and suburban areas. However, in this particular study, the Hot Spots analysis has been employed with the specific aim of identifying the most scorching UHI locations. The analysis assesses the spatial variations in these hotspots at three distinct significance levels: those exceeding 90%, 95%, and 99%. Consequently, when referring to the UHI throughout this text, it pertains exclusively to the most elevated UHI hotspots, and their spatial changes are examined at a statistically significant level.
2.2. Field Survey and Micro-Bioclimatic Modeling of the Study Area by ENVI-Met
From a microclimatic point of view, it is necessary to identify the details and characteristics of geometric factors and the form of physical structures in the designed site on outdoor thermal loads. Therefore, the details and characteristics of the hospital’s open space structures, including information about the height of buildings, the width of surrounding streets, sidewalks, traffic route, soil type, species, location, and height of trees and vegetation, were obtained by field study. Notably, the collected field information (physical structures) is considered a fixed characteristic (without any change) for all study periods as input into the ENVI-met software V5.5 (ENVI-met GmbH, Essen, Germany).
Figure 2a shows the location of the 5 Azar Hospital as extracted from Google Map software 7.3. It also presents the location of the 15 points selected for installing the meteorological data loggers. Moreover, the Landsat satellite images for two-time intervals were used, including the TM sensor (row 163, pass 034) on 28 May (2010) and the OLI sensor on 7 June (2020) to extract the land-use changes in Gorgan City during over time. It is worth noting that May to July is the best period due to the lack of cloud cover. The radiometric and spatial resolution of the satellite data was 16 bits and 30 m, respectively. The NDVI index was used to analyze the vegetation cover of Gorgan City. Training samples were determined by Google Earth images with a proper distribution whole over the city. It should be noted that the number of pixels selected in each training sample should be at least ten times the number of spectral bands of the image, which was well observed in the present study. Therefore, 120, 100, and 150 training samples were extracted for bare lands, rangelands, and urban areas. Finally, an Object-Oriented Algorithm and Hierarchical Classification Method were used to generate a land-use map by eCognition Developer 9.01. Figure 3 shows the land-use changes in Gorgan with emphasis on the location of 5 Azar Hospital from 2010 to 2020. The area of the hospital includes 22,251 m2, of which 12,020 m2 is built-up and 10,231 m2 is related to the open space of the hospital. The 27 July was statistically determined as the hottest day of the year during the long-term measurement period. Hence, 27 July 2021 was selected as the field harvesting day to measure meteorological data in 15 determined points of open spaces of the hospital using an AR847 data logger. Finally, the PMV bioclimatic index was calculated based on measured data, and the outputs were compared with the results of the ENVI-met model to evaluate the validity of ENVI-met outputs.
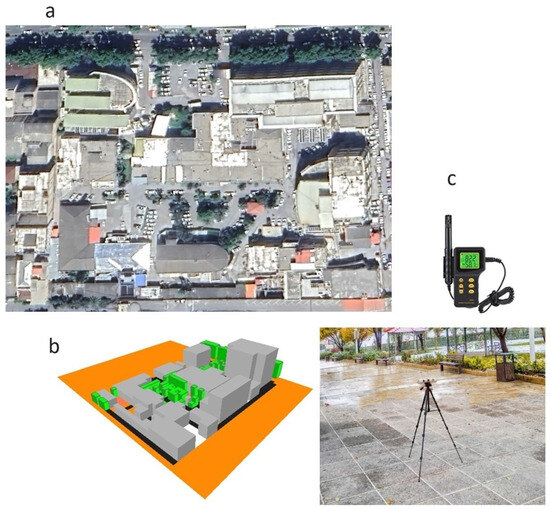
Figure 2.
(a) 5 Azar Hospital location in Google Earth and (b) designed studied site in ENVI-met environment; (c) humidity–thermometer data logger (model AR847).
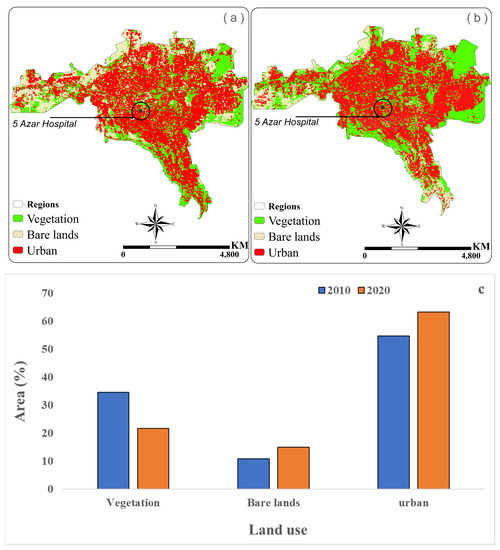
Figure 3.
Land use changes in Gorgan city with an emphasis on the location of 5 Azar Hospital: (a) 2010 and (b) 2020. (c) The percentage of different land uses for the two studied periods.
ENVI-met is a three-dimensional micro-scale climatic model that simulates surfaces, plants, and air interactions in an urban environment with a spatial accuracy of 0.5 m and a time accuracy of 10 s. It was introduced in 1998 by Michael Bruce and Heribert Fleer of the University of Bochum, Germany [32,33]. The main advantage of this simulator is that it simulates the main interactions of the atmosphere based on physical rules, such as fluid dynamics and thermodynamics, which affect the microclimate. Furthermore, this model simulates a set of micro-climatic factors within a daily cycle (24 to 48 h) and predicts all processes, including wind flow, solar radiation, temperature, and humidity [21,34,35]. The elements of the urban environment with a complex structure, such as buildings with different shapes and heights or some architectural details comprising balconies and geometric forms, can be considered in simulations by the ENVI-met model. Vegetation in ENVI-met is used not only as porous masses for wind and sunlight but also for evaporation and photosynthesis processes. This model also determines the ground surface material. However, the large volume of information processing is one of the greatest limitations of this model, as semi-professional computers will not be able to process the require amounts [36,37,38].
2.3. Thermal Comfort Index
Thermal comfort is defined as a condition or a person’s satisfaction with the thermal conditions of the environment [39]. Different thermal indices can determine the determination of thermal comfort of a person. One of the thermal comfort standards is an index of thermal sensation known as the Predicted Mean Vote (PMV) index. The PMV index represents the average temperature sensed by a group of people and is calculated based on Fanger’s heat balance model [40]. Two types of variables are used to calculate the PMV index, including physiological (clothing insulation and metabolic rate) [41] and environmental variables (air temperature, air velocity, relative humidity, and radiation temperature [16,21]. For more details, see [39]. PMV was first used to evaluate indoor thermal comfort, but after modification by adding activity and clothing factors, shortwave and longwave radiation fluxes were also used for outdoor environments [42]. Previous studies have also used the PMV index to evaluate outdoor thermal comfort [43,44,45,46,47,48].
2.4. Climate Projection to Model Micro-Bioclimatic Conditions for Future Decades
Since the sustainable design of the hospital’s open space to reduce thermal stress is one of the main objectives of this study, it is necessary to investigate the effects of future climate change on the micro-bioclimatic conditions of the study site. Therefore, Meteonorm software V8 (Meteotest AG, Bern, Switzerland) simulated future climate conditions in the study area. It is worth noting that Meteonorm is a strong weather data generator used as a source for effective climatic data in building simulations. The first version of Meteonorm was published as a paperback handbook in 1985. Ten years later, Meteotest transferred the handbook to desktop software. Its database comprises over 8000 weather stations, 5 geostationary satellites, and globally calibrated aerosol climatology. It can generate more than 30 different climatic parameters such as radiation, precipitation, temperature, relative humidity, and air velocity in monthly, daily, and hourly time intervals. The standard periods are 1996–2015 for irradiation data and 2000–2019 for all other parameters [49]. Meteonorm also predicts future climatic conditions using RCP scenarios from 10 CMIP5 models [50]. In this study, the effect of climate change on the micro-bioclimatic pattern of the study area was assessed using Meteonorm. The outputs of 10 global climate models based on CMIP5 were used, and the average of all 3 scenarios was used to project climate conditions for the 2040s (Table 2).
Table 2.
Basic information on 10 global climate models based on the Coupled Model Inter-comparison Project Phase 5 (CMIP5) embedded in Meteonorm.
In this study, “calibration” refers to the adjustment of data from Global Climate Model (GCM) simulations. For the entire simulated period, the average annual standard deviation of all variables was consistently lower than the standard deviation (STD) observed during the reference statistical period. Given the expectation of future increases in climatic extremes, a corrective measure has been implemented. This correction involves augmenting the standard deviation of these variables during the base period while maintaining their averages, to align it with the standard deviation observed in the historical data for the same period. This adjustment is carried out using relationships 4 and 5.
where , , and represent these variables denoting the projections made by the model for the future period and the simulations conducted using the model network for the past period. Subsequently, while maintaining the mean values, their standard deviation was computed in accordance with Equation (5), where “STD” represents the standard deviation of the meteorological variable [51].
2.5. Different Scenarios of Green Space Design
In order to evaluate green space impact on micro-bioclimatic conditions of the outdoor environment of 5Azar Hospital, three different green space design scenarios were modeled. Then, the results of these scenarios and their impact on the heat budget were compared with the study area’s actual conditions. Figure 4 shows the selected vegetation cover of these scenarios, including cypress tree (A), plane tree (B), and finally, shrubs (C). In all of these scenarios, the number of species considered is 100. In scenarios A and B, the height of cypress and plane tree trees is 10 m, and for shrubs, the desired height is 2 m.
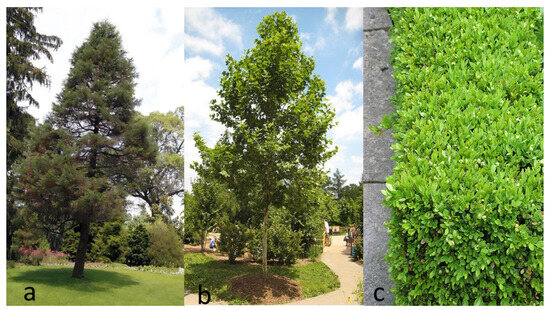
Figure 4.
The type of species selected for different scenarios of green space: (a) cypress tree (Cupressus bakeri), (b) plane tree (Platanus × acerifolia) (c) shrubs (Buxus ‘Green Velvet’).
Vegetation species were selected so that the values of leaf area density (LAD) would be similar; therefore, the effects of other physical properties of the plants, including the width and height of the crown, can be studied more accurately. By default, ENVI-met considers three different values for LAD: high LAD (1.1), medium LAD (0.6), and low LAD (0.3). This study simulated all three plants with a high LAD value. The details of the simulation process are indicated in Table 3.
Table 3.
The details of the green space scenarios simulation process by ENVI-met.
It is noteworthy that the implementation of these different green space design scenarios will take place for the observation period from the 1970s to the 2010s and the predicted decade (2040s).
3. Results
3.1. Gorgan’s UHI Pattern in the Hottest Month of the Year
In order to determine the maximum heat stress during the year, the statistically hottest day of the year during the measurement period (1970–2020) was extracted from weather station data. Since the hospital is located in Gorgan’s UHI, which can affect the thermal conditions of the studied site, the relationship between UHI’s spatial changes and the hospital’s thermal conditions on the hottest day of the year and during the last two decades was evaluated. Then, the bioclimatic pattern of the selected day was evaluated. Results of statistical analysis of the climatic conditions of Gorgan city showed that the annual average of daily mean temperatures of Gorgan is 17.77 °C, with a maximum long-term average of 28.51 °C, which occurred on 27 July. Figure 5 shows the long-term pattern of daily temperature in Gorgan.
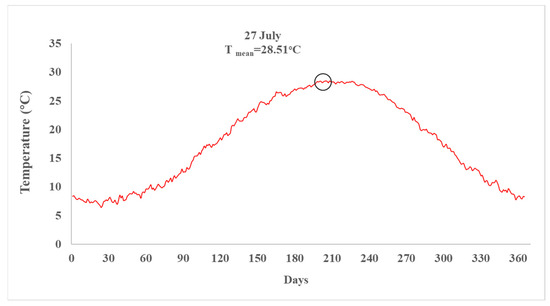
Figure 5.
Long-term average daily temperature in Gorgan during the 1970 to 2020 statistical period according to the shadowed air temperature under classical weather observations.
Accordingly, July was introduced as the hottest month in Gorgan. Therefore, Modis satellite images calculated the changes in land surface temperature [31] and Gorgan’s UHI’s in July from 2000 to 2020. Based on the long-term average of the UHI during the July in these two decades, the average area of the UHI was calculated as about 795.63 hectares for night hours and 517.3 hectares for daytime hours (Figure 6a,b). As shown in Figure 6c, the maximum area of the nighttime UHI of 979.64 hectares occurred in 2018, and the minimum area of 430.16 hectares occurred in 2019. The maximum and minimum area of the UHI in daytime hours, with values of 876.1 and 257.3 hectares, occurred in 2004 and 2005, respectively. The long-term average LST during night and day is 24.67 °C and 40.6 °C, respectively (Figure 7a,b). Furthermore, it is observed that the maximum and minimum average of LST for nighttime is 27.07 °C (2017) and 19.46 °C (2003) while the daytime maximum and minimum LST by 43.72 °C and 37.29 °C, and occurred in 2017 and 2012, respectively (Figure 7c). Accordingly, the hospital area experienced a maximum LST threshold in daytime (>41 °C) and nighttime (>24 °C).
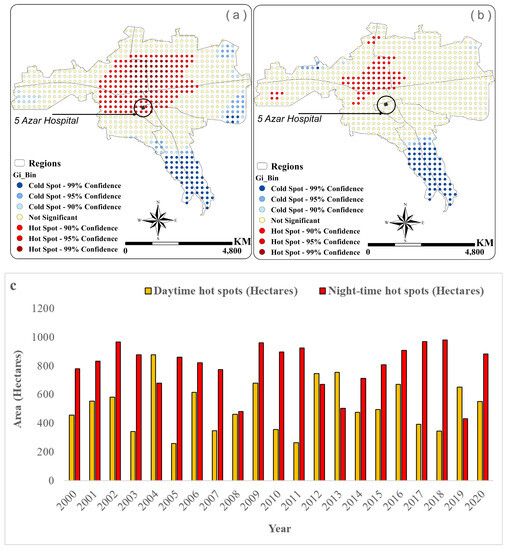
Figure 6.
The long-term average spatial pattern of the hot and cold islands of Gorgan during (a) nighttime, (b) daytime in July (2000 to 2020), and (c) the changes in the UHI area over the last two decades.
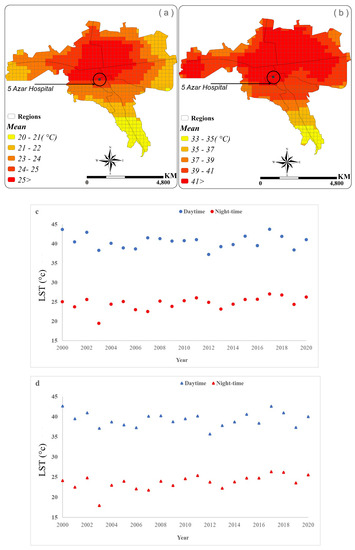
Figure 7.
Long-term average of LST during (a) nighttime; (b) daytime in July (2000 to 2020); (c) the average LST from 2000 to 2020 of hospital area, and (d) average LST related to the total area of Gorgan during night and day.
It is notable that the average LST for the entire area of Gorgan city during the night time and daytime is 23.71 °C and 39.28 °C, respectively. In addition, the findings showed that the maximum average LST (Figure 7d) occurred in 2017 (26.33 °C) and 2000 (42.66 °C). Generally, the study of the spatial pattern of the UHI indicated that the hospital area is highly affected by UHI during the nighttime, while no traces of hot spots are observed in the hospital area during the day.
3.2. Validation of Simulated Data in ENVI-Met Model by Field Measurements
Generally, the extracted results from the ENVI-met model are validated with experimental data measured in the environment [21,31,43,52,53,54,55,56]. Accordingly, field measurements of relative humidity and air temperature were performed on 27 July 2021, from 0:00 to 24:00, at receptor point R06. Additionally, smart sensor humidity-temperature data logger model AR847 was used (±1.5 °C accuracy for Ta) (±3% (41~80%) ± 5% (10%~40%) accuracy for humidity) (Figure 8). The nearest meteorological station with historical weather data is Hashemabad station, which is located approximately 9 km northwest of the hospital. Therefore, for simulation in the ENVI-met software, we have to use the data from the Hashemabad meteorological station.
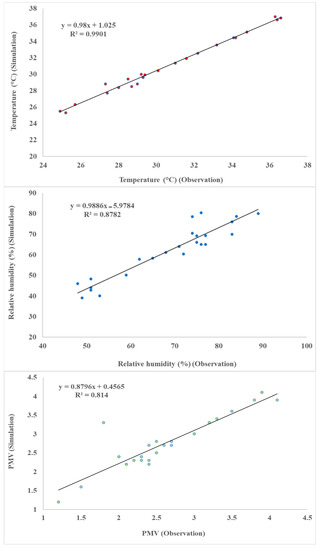
Figure 8.
Comparison of simulated and measured data of the 5 Azar Hospital site for air temperature, relative humidity, and PMV components during 27 July 2021.
Historically, R2 and root mean square error (RMSE) statistics are used to evaluate the simulation results from the ENVI-met model and measured data [54]. The closer that R2 is to 1 and RMSE is to 0, the higher the validity of the data simulation results. The results showed R2 of 0.99 and RMSE of 0.63 between simulated and measured air temperature. Furthermore, R2 of 0.87 and RMSE of 3.87 were calculated between the simulated and measured relative humidity, respectively. From a thermal comfort point of view, R2 of 0.81 and RMSE of 0.75 were calculated between simulated and measured PMV, respectively. This is consistent with [57], who found a high correlation between ENVI-met simulated data and measured data [57].
Based on the 24-hour measured temperature component, the daily average air temperature was 30.51 °C, while the ENVI-met simulated this component as 30.93 °C, only 0.41 °C higher than the measured data. However, the measured average relative humidity was 68.46%, while the ENVI-met simulation computed this component as about 61.70%. Finally, the average PMV thermal index was calculated as 2.65 and 2.79 according to the observational and simulated data, respectively. Hereupon, these results confirm the validity of the simulated outputs of the ENVI-met model (Figure 8).
Since it is assumed that there is the highest thermal stress at midday in the summer season, the application of different green space scenarios and their impact on the PMV index at 14:00 on 27 July 2021is presented in Figure 9. As the results show, in actual conditions, the maximum and minimum PMV values are 5.25 and 3.97, respectively. At the same time, scenario B modeled the minimum values of the PMV index. Accordingly, the upper and lower thresholds of the PMV index were computed as 3.14 and 4.53 in scenario B, respectively. Furthermore, scenarios A and C presented the upper limit of the PMV threshold as about 3.51 and 3.66, and the lower threshold as about 5.22 and 5.10, respectively.
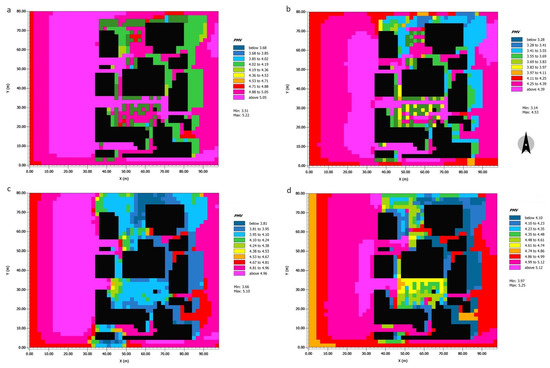
Figure 9.
Modeling the micro-bioclimatic conditions of the study site according to the different scenarios at 14:00 on 27 July 2021. (a) Scenario A; (b) Scenario B; (c) Scenario C; (d) Real conditions.
3.3. Simulation of Micro-Bioclimatic Conditions of the Hospital According to Different Green Space Scenarios and under the Effect of Climate Change
To evaluate the effect of different green space scenarios and climate change impact on bio-climatic conditions of open spaces of the hospital, the micro-bioclimatic conditions of the hospital were simulated both for historical (1970–2020) and future periods (the 2040s) based on RCPs scenarios. The simulated results were compared with the actual conditions of the hospital from 6:00 a.m. to 6:00 p.m. local time. Accordingly, Figure 10 represents the average PMV index for 15 selected points in the hospital’s open spaces.
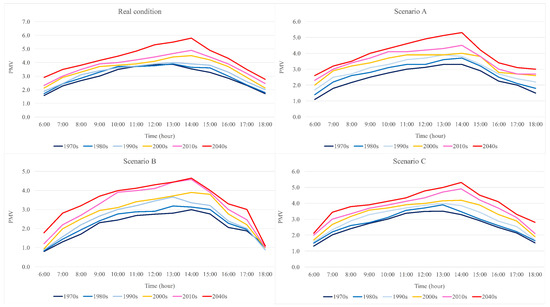
Figure 10.
Hourly changes in PMV index for different decades according to different scenarios of green space compared with the actual conditions in the hospital’s open spaces.
The results depicted that the long-term average air temperature and relative humidity of 27 July during the historical period (1970 to 2020) are 28.51 °C and 69%, respectively. However, based on the average of the three RCPs in the 2040s, the average air temperature will increase by 1.6 °C to 29.90 °C. Additionally, due to climate change, the relative humidity will increase by 8% compared to the observation period and reach 78%.
The results show that the PMV values have increased both in actual and green scenarios conditions from the 1970s to the 2020s; moreover, the maximum value occurred in the 2040s owing the effect of global climate change. However, a comparison of different green space scenarios illustrated that the minimum increase in PMV values is associated with scenario B, of 3.4, while according to scenarios A and C, the average PMV index will reach 3.9 and 4, respectively. It is worth noting that the PMV value will increase to 4.3 in actual conditions. It should be kept in mind that scenario B represents moderate heat discomfort due to the intense shadowing of the plane tree. However, it is known that more shadowing, especially when given by larger tree leaves, diminishes the ventilation so that at least part of the gain from the improved thermal comfort is lost through lower ventilation. Hereupon, it can be concluded that although the 2040s will have increased PMV, the lowest increase is related to green space implementation scenarios. In other words, the implementation of green space scenarios can reduce the negative effect of global warming on the open space of the hospital. As the findings of this study show, the maximum PMV was experienced around 13:00 in local time during the 1970s and 1990s, while it was shifted to 14:00 from 2000 to 2020 and in the 2040s. The outputs also show that the average PMV index based on all studied decades (observational and simulated) is 2.7, 3.2, 3.2, and 3.5 for scenarios B, A, and C and actual conditions, respectively (Figure 11).
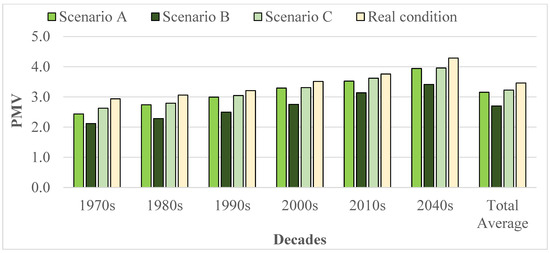
Figure 11.
The overall average of the PMV index for the studied decades under different green space scenarios and actual conditions.
The results agree with Roshan et al. (2020), who reported that in the 2040s, the percentage of days with thermal comfort conditions will be 1.5% lower compared to the 2000s, due to global warming [26].
4. Discussion
The consideration of thermal issues in an urban environment is increasing significantly due to climate change and changes in urban structure. The application of nature-based strategies to improve urban thermal comfort conditions and mitigate urban areas’ heat loads is expanding worldwide. The present paper describes a process for applying several bioclimatic design scenarios under climate change effects to improve the thermal comfort conditions in the outdoor spaces of a hospital in the subtropical climates of Gorgan City in Iran.
4.1. Finding and Recommendations
Accordingly, the present research aimed to evaluate the impact of different green space scenarios on micro-bioclimatic conditions of the 5 Azar Hospital in Gorgan City. Initially, the results of this study showed that in recent decades, Gorgan city had experienced land-use changes, causing a decrease in the vegetation cover of Gorgan, and urban land uses have quickly expanded. Further, the expansion of urban structures in Gorgan has led to the formation of UHI, which can certainly change the bioclimatic pattern of the city. Results indicated that 27 July is the hottest day in Gorgan city, at 28.51 °C. The analysis of the UHI pattern reveals July as the warmest month of the year in Gorgan city, indicating that the average area of the UHI at nighttime is 579.63 hectares, while it shrinks to 517.3 hectares during the day. Notwithstanding the changes in the UHI area, the calculated long-term average of the LST (July 2000 to 2020) showed that the LST of the Gorgan varies between 40.6 °C and 24.67 °C during the day and night, respectively. The hospital site experiences a maximum land surface temperature threshold at nighttime (of 24 °C) and daytime (of 41 °C) in the hottest month of the year. Since the hospital is located in Gorgan’s UHI core, implementing green space scenarios can be an alternative strategy to reduce heat stress, especially under future climate change conditions.
Furthermore, the prevailing weather conditions are sultry during the warm seasons in Gorgan. Therefore, uncomfortable climate conditions are expected to increase due to global climate change and increasing temperatures in this region. Hence, in order to mitigate the impact of thermal stress, especially on patients in hospital open spaces, the simulation of different green space scenarios has indicated that implementation of the plane tree (scenario B) is a more effective strategy to mitigate the thermal stress of open spacescape of the hospital, both in real and future climatic conditions.
4.2. Strength and Limitations
The results align with outcomes from similar studies, including the work of [58], who investigated the impact of climate change tree distribution in subtropical climates. Additionally, [59] investigated the effects of climate change on urban parks and the potential of vegetation to improve the microclimate. There is an awareness of bioclimatic landscape design principles [60] to cool thermal conditions in outdoor spaces [26]. However, based on observational data, most existing studies do not consider the long-term effects of climate change in the urban context [55]. Therefore, the strength of this paper relies on its methodology, which is based on coupling long-term observations, remote sensing data, and advanced modeling. The use of data from the Terra satellite (EOS AM-1) allowed the characterization of the UHI in Gorgan, and field observation provided accurate in-situ data on the surface finishing characteristics and albedo.
Consequently, the findings of this study show that the presence of vegetation reduces the rate of PMV enhancement. This cooling potential is different for different types of vegetation. It is important to note that vegetation and green space can moderate thermal comfort conditions as an influential factor, considering urban areas with a high potential for heat events (UHI) and higher population density. Generally, although climate change, urbanization, and demographic trends continue to contribute to the change and intensification of thermal sensations, the use of green space design strategies can reduce the negative effects of climate change on thermal thresholds. Regarding the different species of vegetation’s impact on human thermal comfort in the open air, it is necessary to implement adaptation strategies to mitigate the negative impact of urban land uses, the UHI, and climate change. These strategies improve thermal comfort conditions, especially in sensitive service uses such as hospitals. The output of this research shows that the role of green space will be even more valuable in maintaining human thermal comfort in the 2040s than in the current climate. Considering the excellent potential of green space in urban morphology, landscape planning is a practical approach to combat the adverse effects and risk of severe future heat events.
5. Conclusions
The purpose of this paper was to reveal the effects of climate change on the microclimate around a hospital located in the humid subtropical climate (Köppen: Cfa, Trewartha: Cf) of Gorgan. The findings indicate that the average PMV index increased rapidly during the 1970s and 2040s based on all green space scenarios, which could be due to global warming and anthropogenic conditions. Gorgan is located approximately 40 km away from the nearest coast of the Caspian Sea. Indeed, increasing air temperature under climate change will increase the evaporation from this moisture source. Finally, the relative humidity in Gorgan will increase.
The study methodology followed a mixed approach, combining field measurements with micro-bioclimatic modeling. Using observational data allowed calibration of the simulations and exploration of future climate change scenarios and green vegetation strategies. Applying different green space scenarios, especially plane trees (scenario B), was the most effective strategy to mitigate the thermal stress of the open space of the hospital in both current and future climatic conditions. It can be concluded that although the 2040s will ahigher PMV index, the low increase occurs green space scenarios being implementation. In other words, the implementation of green space scenarios can reduce the negative effect of global warming on the open spaces of the hospital.
Author Contributions
Conceptualization, R.B. and G.R.; methodology, G.R., R.B. and B.A.; software, G.R. and B.A.; validation, R.B., G.R. and G.S.; formal analysis, G.R. and B.A.; investigation, R.B.; resources, G.R.; data curation, G.R.; writing—original draft preparation, G.R., B.A., R.B. and M.M.; writing—review and editing, S.A. and M.M.; visualization, G.R., G.S. and B.A.; supervision, G.R.; project administration, R.B.; funding acquisition, B.A. and G.S. All authors have read and agreed to the published version of the manuscript.
Funding
Project no. TKP2021-NKTA-32 has been implemented with the support provided by the National Research, Development and Innovation Fund of Hungary, financed under the TKP2021-NKTA funding scheme. Work was also partially supported by the Council of Iran National Science Foundation under Grant No. 99000069.
Institutional Review Board Statement
Not applicable.
Informed Consent Statement
Not applicable.
Data Availability Statement
The datasets used during the current study are available from the corresponding author on reasonable request.
Acknowledgments
The authors’ work was partially supported by the Council of Iran National Science Foundation under Grant No. 99000069. The authors would like to thank the Council of Iran National Science Foundation for their support in the project. We wish to thank Reza Sarli from the University of Agriculture in Krakow (Poland) for their comments and intellectual guidance, which helped improve an earlier version of the paper.
Conflicts of Interest
The authors declare no conflict of interest.
References
- Xu, H.; Shi, T.; Wang, M.; Fang, C.; Lin, Z. Predicting effect of forthcoming population growth–induced impervious surface increase on regional thermal environment: Xiong'an New Area, North China. Build. Environ. 2018, 136, 98–106. [Google Scholar] [CrossRef]
- Cirrincione, L.; Marvuglia, A.; Scaccianoce, G. Assessing the effectiveness of green roofs in enhancing the energy and indoor comfort resilience of urban buildings to climate change: Methodology proposal and application. Build. Environ. 2021, 205, 108198. [Google Scholar] [CrossRef]
- Ghanghermeh, A.; Roshan, G.; Orosa, J.A.; Calvo-Rolle, J.L.; Costa, Á.M. New climatic indicators for improving urban sprawl: A case study of Tehran city. Entropy 2013, 15, 999–1013. [Google Scholar] [CrossRef]
- Heaviside, C.; Macintyre, H.; Vardoulakis, S. The Urban Heat Island: Implications for Health in a Changing Envi-Ronment. Curr. Environ. Health Rep. 2017, 4, 296–305. [Google Scholar] [CrossRef] [PubMed]
- Atwa, S.; Ibrahim, M.G.; Murata, R. Evaluation of plantation design methodology to improve the human thermal comfort in hot-arid climatic responsive open spaces. Sustain. Cities Soc. 2020, 59, 102198. [Google Scholar] [CrossRef]
- Nitidara, N.P.A.; Sarwono, J.; Suprijanto, S.; Soelami, F.N. The multisensory interaction between auditory, visual, and thermal to the overall comfort in public open space: A study in a tropical climate. Sustain. Cities Soc. 2021, 78, 103622. [Google Scholar] [CrossRef]
- Sattayakorn, S.; Ichinose, M.; Sasaki, R. Clarifying thermal comfort of healthcare occupants in tropical region: A case of indoor environment in Thai hospitals. Energy Build. 2017, 149, 45–57. [Google Scholar] [CrossRef]
- Yuan, F.; Yao, R.; Sadrizadeh, S.; Li, B.; Cao, G.; Zhang, S.; Zhou, S.; Liu, H.; Bogdan, A.; Croitoru, C.; et al. Thermal comfort in hospital buildings – A literature review. J. Build. Eng. 2021, 45, 103463. [Google Scholar] [CrossRef]
- Kenny, G.P.; Yardley, J.; Brown, C.; Sigal, R.J.; Jay, O. Heat stress in older individuals and patients with common chronic diseases. Can. Med Assoc. J. 2009, 182, 1053–1060. [Google Scholar] [CrossRef]
- Pereira, P.F.d.C.; Broday, E.E.; Xavier, A.A.d.P. Thermal Comfort Applied in Hospital Environments: A Literature Review. Appl. Sci. 2020, 10, 7030. [Google Scholar] [CrossRef]
- Berardi, B.M.; Leoni, E. Indoor air climate and microbiological airborne: Contamination in various hospital areas. Int. J. Hyg. Environ. Med. 1993, 194, 405–418. [Google Scholar]
- Nematchoua, M.K.; Yvon, A.; Kalameu, O.; Asadi, S.; Choudhary, R.; Reiter, S. Impact of climate change on demands for heating and cooling energy in hospitals: An in-depth case study of six islands located in the Indian Ocean region. Sustain. Cities Soc. 2019, 44, 629–645. [Google Scholar] [CrossRef]
- Ulrich, R.S.; Cordoza, M.; Gardiner, S.K.; Manulik, B.J.; Fitzpatrick, P.S.; Hazen, T.M.; Perkins, R.S. ICU Patient Family Stress Recovery During Breaks in a Hospital Garden and Indoor Environments. HERD Health Environ. Res. Des. J. 2020, 13, 83–102. [Google Scholar] [CrossRef]
- Matzarakis, A.; Rutz, F.; Mayer, H. Modelling radiation fluxes in simple and complex environments—Application of the RayMan model. Int. J. Biometeorol. 2007, 51, 323–334. [Google Scholar] [CrossRef]
- Matzarakis, A.; Rutz, F.; Mayer, H. Modelling radiation fluxes in simple and complex environments: Basics of the RayMan model. Int. J. Biometeorol. 2010, 54, 131–139. [Google Scholar] [CrossRef] [PubMed]
- Thorsson, S.; Lindberg, F.; Eliasson, I.; Holmer, B. Different methods for estimating the mean radiant temperature in an outdoor urban setting. Int. J. Climatol. 2007, 27, 1983–1993. [Google Scholar] [CrossRef]
- Andrade, H.; Alcoforado, M.-J. Microclimatic variation of thermal comfort in a district of Lisbon (Telheiras) at night. Theor. Appl. Clim. 2008, 92, 225–237. [Google Scholar] [CrossRef]
- Chen, Y.-C.; Lin, T.-P.; Matzarakis, A. Comparison of Mean Radiant Temperature from Field Experiment and Model-Ling: A Case Study in Freiburg, Germany. Theor. Appl. Climatol. 2014, 118, 535–551. [Google Scholar] [CrossRef]
- Hwang, R.-L.; Lin, T.-P.; Matzarakis, A. Seasonal effects of urban street shading on long-term outdoor thermal comfort. Build. Environ. 2011, 46, 863–870. [Google Scholar] [CrossRef]
- Krüger, E.L.; Minella, F.O.; Matzarakis, A. Comparison of different methods of estimating the mean radiant temperature in outdoor thermal comfort studies. Int. J. Biometeorol. 2014, 58, 1727–1737. [Google Scholar] [CrossRef]
- Lee, H.; Mayer, H. Validation of the Mean Radiant Temperature Simulated by the RayMan Software in Urban Environments. Int. J. Biometeorol. 2016, 60, 1775–1785. [Google Scholar] [CrossRef] [PubMed]
- Naboni, E.; Meloni, M.; Makey, C.; Kaempf, J. The Simulation of Mean Radiant Temperature in Outdoor Conditions: A review of Software Tools Capabilities. In Proceedings of the Building Simulation Conference Proceedings, International Building Performance Simulation Association, Rome, Italy, 2–4 September 2019. [Google Scholar] [CrossRef]
- Alijani, B. Climate of Iran; Payame Noor University: Tehran, Iran, 1996. [Google Scholar]
- Soltani, S.; Saboohi, R.; Yaghmaei, L. Rainfall and rainy days trend in Iran. Clim. Chang. 2012, 110, 187–213. [Google Scholar] [CrossRef]
- Roshan, G.; Ghanghermeh, A.; Attia, S. Determining new threshold temperatures for cooling and heating degree day index of different climatic zones of Iran. Renew. Energy 2017, 101, 156–167. [Google Scholar] [CrossRef]
- Roshan, G.; Moghbel, M.; Attia, S. Evaluating the wind cooling potential on outdoor thermal comfort in selected Iranian climate types. J. Therm. Biol. 2020, 92, 102660. [Google Scholar] [CrossRef] [PubMed]
- Roshan, G.; Farrokhzad, M.; Attia, S. Climatic clustering analysis for novel atlas mapping and bioclimatic design recommendations. Indoor Built Environ. 2021, 30, 313–333. [Google Scholar] [CrossRef]
- ESRI. How Hot Spot Analysis: Getis-Ord Gi*(Spatial Statistics) Works. 2009. Available online: https://pro.arcgis.com/en/pro-app/latest/tool-reference/spatial-statistics/h-how-hot-spot-analysis-getis-ord-gi-spatial-stati.htm (accessed on 1 February 2023).
- Roshan, G.R.; Sarli, R.; Grab, S.W. The Case of Tehran’s Urban Heat Island, Iran: Impacts of Urban ‘Lockdown’ Associated with the COVID-19 Pandemic. Sustain. Cities Soc. 2021, 75, 103263. [Google Scholar] [CrossRef]
- Grigoraș, G.; Urițescu, B. Spatial Hotspot Analysis of Bucharest’s Urban Heat Island (UHI) Using Modis Data. Ann. Valahia Univ. Targoviste Geogr. Ser. 2018, 18, 14–22. [Google Scholar] [CrossRef]
- Taleghani, M.; Tenpierik, M.; van den Dobbelsteen, A.; Sailor, D.J. Heat in courtyards: A validated and calibrated parametric study of heat mitigation strategies for urban courtyards in The Netherlands. Sol. Energy 2014, 103, 108–124. [Google Scholar] [CrossRef]
- Yang, J.; Shi, B.; Xia, G.; Xue, Q.; Cao, S.-J. Impacts of Urban Form on Thermal Environment Near the Surface Region at Pedestrian Height: A Case Study Based on High-Density Built-Up Areas of Nanjing City in China. Sustainability 2020, 12, 1737. [Google Scholar] [CrossRef]
- Yang, J.; Wang, Y.; Xiu, C.; Xiao, X.; Xia, J.; Jin, C. Optimizing local climate zones to mitigate urban heat island effect in human settlements. J. Clean. Prod. 2020, 275, 123767. [Google Scholar] [CrossRef]
- Yahia, M.W.; Johansson, E.; Thorsson, S.; Lindberg, F.; Rasmussen, M.I. Effect of urban design on microclimate and thermal comfort outdoors in warm-humid Dar es Salaam, Tanzania. Int. J. Biometeorol. 2018, 62, 373–385. [Google Scholar] [CrossRef] [PubMed]
- Darbani, E.S.; Parapari, D.M.; Boland, J.; Sharifi, E. Impacts of urban form and urban heat island on the outdoor thermal comfort: A pilot study on Mashhad. Int. J. Biometeorol. 2021, 65, 1101–1117. [Google Scholar] [CrossRef] [PubMed]
- Gusson, C.S.; Duarte, D.H. Effects of Built Density and Urban Morphology on Urban Microclimate - Calibration of the Model ENVI-met V4 for the Subtropical Sao Paulo, Brazil. Procedia Eng. 2016, 169, 2–10. [Google Scholar] [CrossRef]
- Simon, H.; Lindén, J.; Hoffmann, D.; Braun, P.; Bruse, M.; Esper, J. Modeling transpiration and leaf temperature of urban trees—A case study evaluating the microclimate model ENVI-met against measurement data. Landsc. Urban Plan. 2018, 174, 33–40. [Google Scholar] [CrossRef]
- Yang, J.; Hu, X.; Feng, H.; Marvin, S. Verifying an ENVI-met simulation of the thermal environment of Yanzhong Square Park in Shanghai. Urban For. Urban Green. 2021, 66, 127384. [Google Scholar] [CrossRef]
- Dyvia, H.; Arif, C. Analysis of Thermal Comfort with Predicted Mean Vote (PMV) Index Using Artificial Neural Net-Work. In Proceedings of the IOP Conference Series: Earth and Environmental Science; IOP Publishing: Bristol, UK, 2021. [Google Scholar]
- Fanger, P.O. Thermal Comfort. Analysis and Applications in Environmental Engineering. In Thermal Comfort. Analysis and Applications in Environmental Engineering; Cab Direct: Glasgow, UK, 1970. [Google Scholar]
- Mayer, H. Urban bioclimatology. Experientia 1993, 49, 957–963. [Google Scholar] [CrossRef]
- Coccolo, S.; Kämpf, J.; Scartezzini, J.-L.; Pearlmutter, D. Outdoor Human Comfort and Thermal Stress: A Compre-Hensive Review on Models and Standards. Urban. Clim. 2016, 18, 33–57. [Google Scholar] [CrossRef]
- Salata, F.; Golasi, I.; Lieto Vollaro, A.; Lieto Vollaro, R. How High Albedo and Traditional “buildings” Materials and Vegetation Affect the Quality of Urban Microclimate. A Case Study. Energy Build. 2015, 99, 32–49. [Google Scholar] [CrossRef]
- El-Bardisy, W.M.; Fahmy, M.; El-Gohary, G.F. Climatic Sensitive Landscape Design: Towards a Better Microclimate through Plantation in Public Schools, Cairo, Egypt. Procedia Soc. Behav. Sci. 2016, 216, 206–216. [Google Scholar] [CrossRef]
- Barakat, A.; Ayad, H.; El-Sayed, Z. Urban design in favor of human thermal comfort for hot arid climate using advanced simulation methods. Alex. Eng. J. 2017, 56, 533–543. [Google Scholar] [CrossRef]
- Nasrollahi, N.; Hatami, M.; Khastar, S.R.; Taleghani, M. Numerical evaluation of thermal comfort in traditional courtyards to develop new microclimate design in a hot and dry climate. Sustain. Cities Soc. 2017, 35, 449–467. [Google Scholar] [CrossRef]
- Karakounos, I.; Dimoudi, A.; Zoras, S. The influence of bioclimatic urban redevelopment on outdoor thermal comfort. Energy Build. 2018, 158, 1266–1274. [Google Scholar] [CrossRef]
- Perini, K.; Chokhachian, A.; Auer, T. Green Streets to Enhance Outdoor Comfort. Nature Based Strategies for Urban and Building Sustainability; Elsevier: Amsterdam, The Netherlands, 2018; pp. 119–129. [Google Scholar]
- Remund, J.; Müller, S.; Kunz, S.; Huguenin-Landl, B.; Studer, C.; Klauser, D.; Schilter, C.; Lehnherr, R. Meteonorm Handbook Part I: Software; Meteotest AG: Bern, Switzerland, 2010. [Google Scholar]
- Remund, J.; Grossenbacher, U. Urban climate scenario data for European cities. J. Phys. Conf. Ser. 2019, 1343, 012019. [Google Scholar] [CrossRef]
- Ababaei, B.; Mirzaei, F. Sohrabi, T. Assessment of LARS-WG performance in 12 coastal stations of Iran. Water Res. J. 2012, 9, 217–222. [Google Scholar]
- Morakinyo, T.E.; Kong, L.; Lau, K.K.-L.; Yuan, C.; Ng, E. A study on the impact of shadow-cast and tree species on in-canyon and neighborhood's thermal comfort. Build. Environ. 2017, 115, 1–17. [Google Scholar] [CrossRef]
- Forouzandeh, A. Numerical modeling validation for the microclimate thermal condition of semi-closed courtyard spaces between buildings. Sustain. Cities Soc. 2018, 36, 327–345. [Google Scholar] [CrossRef]
- López-Cabeza, V.; Galán-Marín, C.; Rivera-Gómez, C.; Roa-Fernández, J. Courtyard microclimate ENVI-met outputs deviation from the experimental data. J. Affect. Disord. 2018, 144, 129–141. [Google Scholar] [CrossRef]
- Fahmy, M.; Mahdy, M.; Mahmoud, S.; Abdelalim, M.; Ezzeldin, S.; Attia, S. Influence of urban canopy green coverage and future climate change scenarios on energy consumption of new sub-urban residential developments using coupled simu-lation techniques: A case study in Alexandria, Egypt. Energy Rep. 2020, 6, 638–645. [Google Scholar] [CrossRef]
- Karimi, A.; Sanaieian, H.; Farhadi, H.; Norouzian-Maleki, S. Evaluation of the thermal indices and thermal comfort improvement by different vegetation species and materials in a medium-sized urban park. Energy Rep. 2020, 6, 1670–1684. [Google Scholar] [CrossRef]
- Abdi, B.; Hami, A.; Zarehaghi, D. Impact of small-scale tree planting patterns on outdoor cooling and thermal comfort. Sustain. Cities Soc. 2020, 56, 102085. [Google Scholar] [CrossRef]
- Gasper, A.L.; Grittz, G.S.; Russi, C.H.; Schwartz, C.E.; Rodrigues, A.V. Expected Impacts of Climate Change on Tree Ferns Distribution and Diversity Patterns in Subtropical Atlantic Forest. Perspect. Ecol. Conserv. 2021, 19, 369–378. [Google Scholar] [CrossRef]
- Brown, R.D.; Vanos, J.; Kenny, N.; Lenzholzer, S. Designing urban parks that ameliorate the effects of climate change. Landsc. Urban Plan. 2015, 138, 118–131. [Google Scholar] [CrossRef]
- Gaitani, N.; Mihalakakou, G.; Santamouris, M. On the use of bioclimatic architecture principles in order to improve thermal comfort conditions in outdoor spaces. Build. Environ. 2007, 42, 317–324. [Google Scholar] [CrossRef]
Disclaimer/Publisher’s Note: The statements, opinions and data contained in all publications are solely those of the individual author(s) and contributor(s) and not of MDPI and/or the editor(s). MDPI and/or the editor(s) disclaim responsibility for any injury to people or property resulting from any ideas, methods, instructions or products referred to in the content. |
© 2023 by the authors. Licensee MDPI, Basel, Switzerland. This article is an open access article distributed under the terms and conditions of the Creative Commons Attribution (CC BY) license (https://creativecommons.org/licenses/by/4.0/).