Article

Examining Drivers of Post-Fire Seismic Line Ecotone Regeneration in a Boreal Peatland Environment

1
Department of Geography and Environment, University of Lethbridge, Lethbridge, AB T1K 3M4, Canada
2
Canadian Forest Service, Great Lakes Forestry Centre, Saulte Ste. Marie, ON P6A 2E5, Canada
3
Alberta Environment and Protected Areas, Edmonton, AB T5K 2M4, Canada
*
Author to whom correspondence should be addressed.
Forests 2023, 14(10), 1979; https://doi.org/10.3390/f14101979
Submission received: 16 August 2023 / Revised: 22 September 2023 / Accepted: 26 September 2023 / Published: 29 September 2023

Abstract

:
Seismic lines are the dominant anthropogenic disturbance in the boreal forest of the Canadian province of Alberta, fragmenting over 1900 km2 of peatland areas and accounting for more than 80% of all anthropogenic disturbance in this region. The goal of this study is to determine whether the wildland fires that burn across seismic lines in peatlands result in the regeneration of woody vegetation within the ecotonal areas adjacent to seismic lines. We use a combination of seismic line and vegetation structural characteristics derived from multi-spectral airborne lidar across a post-fire peatland chronosequence. We found an increasing encroachment of shrubs and trees into seismic lines after many years since a fire, especially in fens, relative to unburned peatlands. Fens typically had shorter woody vegetation regeneration (average = 3.3 m ± 0.9 m, standard deviation) adjacent to seismic lines compared to bogs (average = 3.8 m ± 1.0 m, standard deviation), despite enhanced shrubification closer to seismic lines. The incoming solar radiation and seismic line age since the establishment of seismic line(s) were the factors most strongly correlated with enhanced shrubification, suggesting that the increased light and time since a disturbance are driving these vegetation changes. Shrub encroachment closer to seismic lines tends to occur within fens, indicating that these may be more sensitive to drying conditions and vegetation regeneration after several years post-fire/post-seismic line disturbance.

1. Introduction

Boreal peatlands cover large areas of western Canada and play an important role in carbon sequestration via the slow accumulation of biomass within peatland mosses [1,2]. Within the next century, climate models predict a median temperature increase of 2.9 to 5.9 °C under an intermediate Representative Concentration Pathway (RCP) concentration trajectory of 4.5 between 2081 and 2100 [3]. This will increase the drying of these peatlands and promote further landscape-level fire activity [4]. Although wildland fires are regarded as the most prevalent disturbance driving ecosystem change in the Canadian Boreal Plains ecozone [5], climatic changes exacerbate fires by altering fire regimes [6]. These changes enhance peatland afforestation, which increases fuel loading in boreal, e.g., [7] and temperate, e.g., [8] peatlands, thereby altering the carbon balance [9]. Fires can also reduce the belowground carbon (C) stores in peatlands and alter soil organic matter by burning deep into mosses that have been exposed to drying. This can result in increased depth to water table [10] as well as a range of other post-fire hydro-ecological changes (reviewed in [11]). The mean fire return intervals in North America range from 167 to 180 years; however, with climate change, wildland fires in the boreal region are occurring more frequently, shifting the average return intervals to between 35 and 120 years [9,12].
In the years following a wildland fire, there can be a lag in woody vegetation regeneration and a decrease in the vegetation net ecosystem production (NEP). It can take three to seven years for trees to be established, and up to 20 to 25 years for the tree canopy to reach its intermediate maturation due to changes in the soil conditions, nutrient levels, and general life history (e.g., seed dispersal, propagation from roots, etc.) [13,14,15].
In addition to fire disturbance, some western boreal peatlands are also fragmented by petroleum resource exploration [16], which can further complicate peatland ecohydrology and fire regimes. Petroleum deposits cover 142,200 km2 of northern Alberta, most of which are deep bitumen deposits, which require a network of seismic lines, well sites, access roads, and pipelines [17] for extraction and transport. Seismic lines are a dominant anthropogenic disturbance feature and are used for petroleum exploration. They have a relatively low impact compared to surface mining, which fully removes ecosystem components such as soils and vegetation [18]. Seismic lines are disturbed over 1900 km2 of peatlands in Alberta and can impact ecosystem hydrology, energy exchanges, and vegetation [17]. When seismic lines are constructed, organic soils and mosses become compacted compared with undisturbed areas due to the mulching of trees and heavy machinery [16]. Seismic lines are also climatically warmer due to a greater reception of incoming shortwave solar radiation at the ground surface due to canopy openness, which can alter vegetation growth post-disturbance [17,19]. Wider seismic lines (>3 m) have a greater impact on soil characteristics: they increase soil bulk density and have higher soil moisture content due to shallower water tables [20].
A combination of field measurements and remote sensing technologies can be used to quantify the broader ecological impacts of seismic lines during a period of climate change and occasional wildland fires. Although the impacts of seismic lines on upland forests are generally better understood [16,20,21,22,23,24], less is known about the combined impacts of fires and seismic lines within peatlands. Barber et al. [25] found significantly reduced vegetation heights in seismic lines crossing peatlands using airborne lidar data. They examined the impacts of seismic lines in peatlands that had burned about five years earlier compared with undisturbed peatlands. Further, [26] examined the influence of a micro-climate on wildland fire fuel properties in north-to-south and east-to-west directional seismic lines. They found that the position of the seismic line and the potential for drying have a significant influence on the fire spread, especially in the north-to-south -positioned seismic line relative to the adjacent (undisturbed) area. Pinzon et al. [27] determined that a fire does not ‘erase’ the influence of seismic lines on the surrounding peatland/forest areas in the early post-fire period. Despite these leading studies, questions remain regarding the trajectories and drivers of vegetation recovery in the early-to-intermediate years following a fire in peatlands with seismic lines. This is of increasing interest as peatland drying increases and fires become more prevalent, intense, and widespread.
The overall goal of this study is to determine whether wildland fires that burn over seismic lines in peatlands promote the regeneration of woody vegetation adjacent to seismic lines relative to peatlands that are fragmented by seismic lines only. Previous research has found that a moderate drop in the water table can reduce Sphagnum spp. colonization, resulting in enhanced broadleaf species establishment [28,29]. The objectives of this study are to (a) assess the spatial distribution of vegetation heights proximal to seismic lines in peatlands burned 5, 18, 30, and 38 years ago compared with recently unburned (in the last more than 80 years) and anthropogenically undisturbed ‘mature’ reference peatlands; and (b) determine the environmental and anthropogenic drivers of post-fire and post-seismic line vegetation growth in boreal peatlands with respect to the time passed since a fire. We hypothesize that fire may enhance woody vegetation regeneration nearer to (within the ecotone of) seismic lines, especially after a period of years. This may be enhanced in fens as opposed to bogs possibly due to changes in peat moisture. We also expect that the differences in vegetation heights adjacent to seismic lines between the burned and unburned bogs will not be as large due to the moisture characteristics of bogs.

2. Materials and Methods
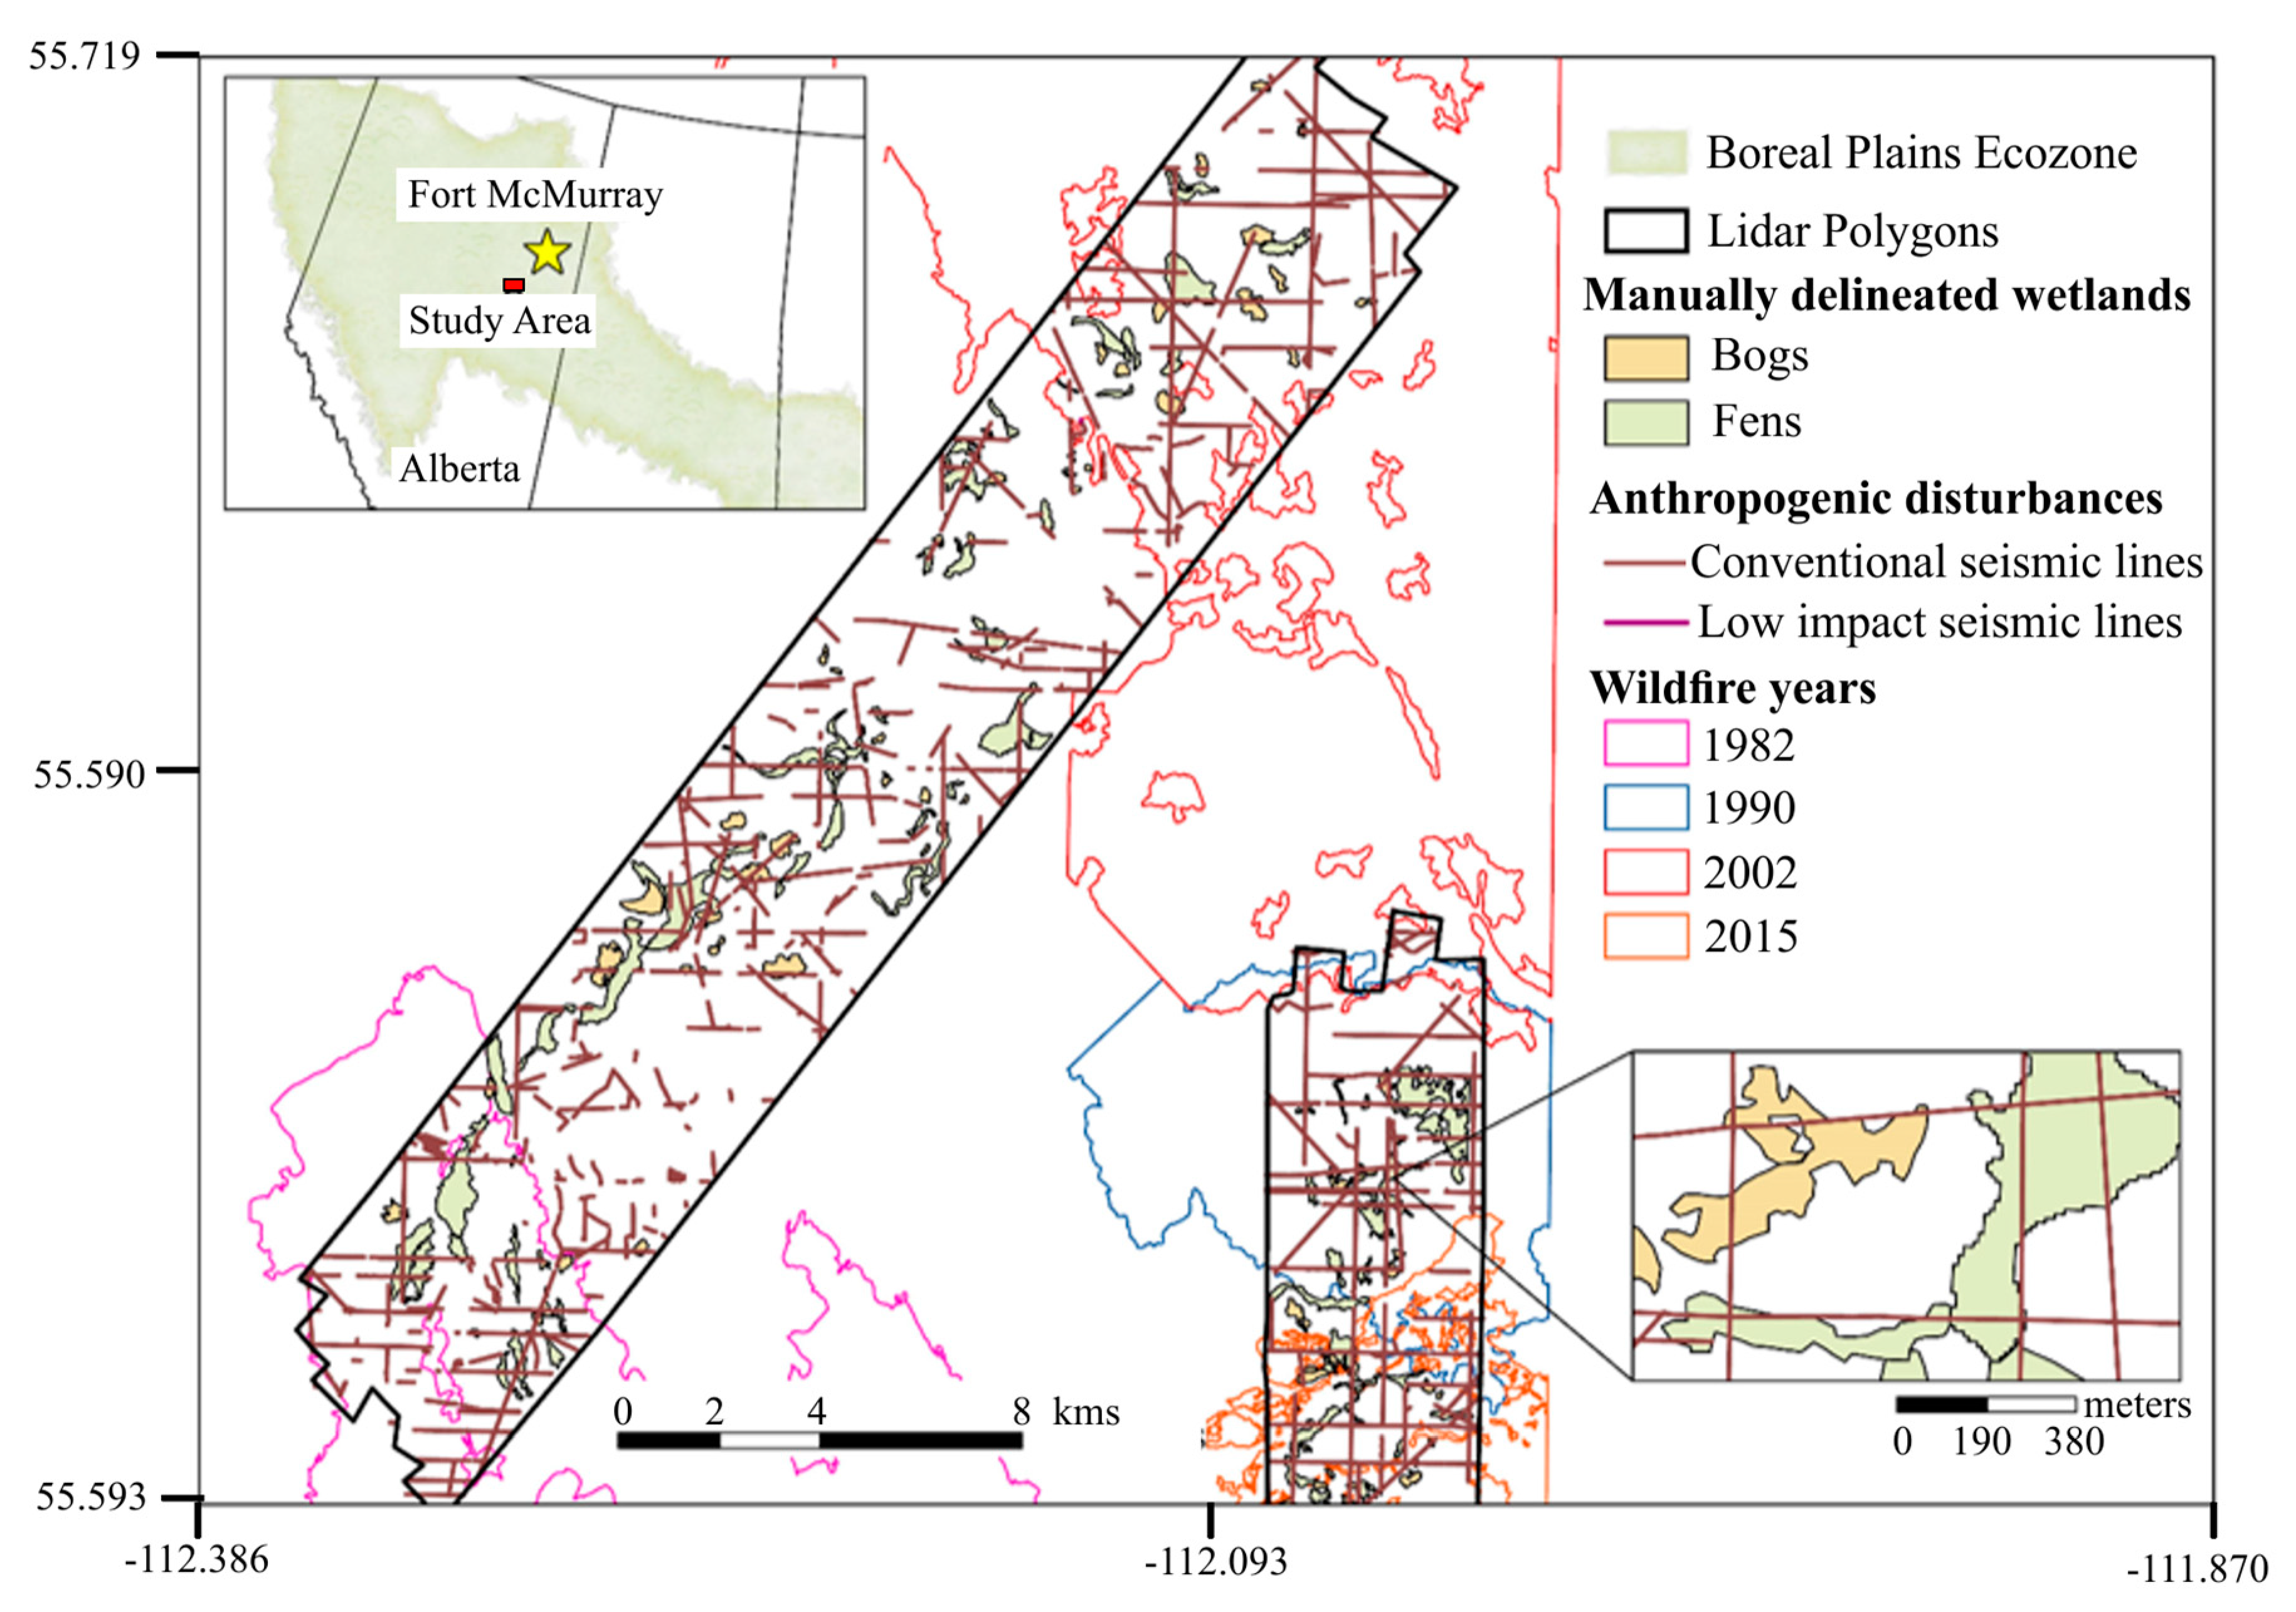
2.1. Study Area

The area of study is located ~230 km south of Fort McMurray near Wandering River, Alberta (112°12′31″ W, 55°37′46″ N), and within the Central Mixedwood subregion of the Boreal Plains Ecozone (Figure 1). The Boreal Plains is one of the driest forested ecozones in Canada and is characterized by large seasonal variations in temperature (from −13 °C on average in winter to 15 °C on average in summer) and a total annual precipitation between 300 and 500 mm [30,31]. The closest weather station (Lac La Biche, Alberta) received a total annual precipitation of 482 mm and had a mean annual temperature of 2 °C during the year of data collection, 2020 [32]. Peatlands include bogs and fens, which cover more than 50% of the area [33]. Vegetation in this region is dominated by pure and mixed forests of coniferous (mostly Picea mariana (Kuntze), Picea glauca (Moench) Voss, and Pinus banksiana Lamb.) and broadleaf deciduous species (Populus tremuloides Michx, Populus balsamifera Lyall, and Betula papyrifera Marshall). Understory shrub species include, but are not limited to, Prunus virginiana L., Alnus crispa Pursh, Amelanchier alnifolia Nutt, Symphoricarpos albus K. Koch, Ledum groenlandicum Oeder, Betula pumila L., and Salix spp. L., with a variety of herbaceous and moss species. The surficial geology is characterized by glacial deposits consisting of mostly glacial moraines, stagnant ice moraines, and glaciofluvial deposits [34]. The major soils within peatlands found in the two survey areas include mesisols with some gleysols.
Lidar survey areas were characterized by a relatively low density of seismic lines (1.6 km × km−2) compared with other parts of Alberta with higher densities (10 km × km−2 [35,36]). These areas were burned by fire in 1982, 1990, 2002, and 2015. Burned areas were used to assess post-fire regeneration with respect to time since fire, assuming relatively similar environmental conditions, including surficial geology and the nearness of the polygons to ensure similar climatological influences (within 5–25 km, Figure 1). Seismic lines found in these areas were typically ~6 m wide and were classified as conventional seismic lines based on the Human Footprint Inventory [36]. Most seismic lines were constructed in 2002 [36], with an average period available for vegetation regeneration of 18 years in burned areas and 15 years (constructed in 2005, [36]) in unburned areas. Some peatlands were also fragmented by ~4 m-wide trails, 10 to 20 m-wide underground/aboveground pipelines used to transport petrochemicals, and adjacent ~100 m × 100 m well pads [36]. Finally, there was a 38 m-wide transmission line corridor that intersected the eastern lidar polygon with towers and poles for transmitting high-voltage electricity. These, and surrounding peatland areas, were excluded from the analysis [36]. Vegetation within linear disturbances consisted mostly of mosses and herbaceous ground cover, with Salix spp. and Alnus spp. growing on seismic lines and intersections with well pads [37,38]. Vegetation species and canopy heights were determined/measured within 202 × 1 m2 plots, collected at 4 m intervals at the centre of seismic lines. Field measurements were used in a previous study [38] to validate lidar-based vegetation structure.

2.2. Lidar Data Collection and Processing

Airborne lidar data for the fire chronosequence study area (Figure 1) were collected on 2 August 2020 by using a Titan multi-spectral airborne lidar system (Teledyne Optech Inc, Toronto, Canada) owned and operated by the University of Lethbridge, ARTeMiS Lab. The Titan scanner is a multi-spectral, three-channel (Channel ‘C’ herein C1, C2, and C3) system with laser pulse emissions at 1550 nm (shortwave infrared, C1), 1064 nm (near infrared, C2), and 532 nm (green, C3), respectively [39,40]. The survey characteristics included a mean flight altitude of 1000 m above ground and a pulse repetition frequency (PRF) of 100 KHz per channel. The survey polygons covered an area of 220 km2 with a lateral strip overlap of 50% and an average point density of 6.2 points per square meter. Lidar data were used to derive elevation and vegetation canopy characteristics from within burned and unburned peatlands.
Lidar returns were classified into ground and non-ground using the last of many echoes and only echoes in TerraScan (TerraSolid, Kanavaranta, Finland). A digital elevation model (DEM) and a digital surface model (DSM) were generated using the first and only returns to create a TIN (DEM) and the maximum height of all first returns from all channels > 0.5 m above the ground using a TIN interpolation method and rasterizing to 2 m pixel resolution in LAStools (RapidLasso, Gilching, Germany). To determine variations in vegetation height, a Canopy Height Model (CHM) was created by calculating the difference between the DSM and the DEM. To reduce the influence of dead standing stems burned during the previous fire, the first and isolated returns at heights above the regenerating vegetation and included in the DSM were removed by assigning these cells a value of ‘nodata’. This removes the influence of the post-fire vegetation heights associated with burned trees from post-fire regenerating vegetation.

2.3. Supplementary Geospatial Data

Additional geospatial layers were used to quantify the distribution of seismic lines and other anthropogenic disturbances within peatlands. These disturbances were included in the Human Footprint Inventory for the Oil Sands Monitoring Region circa 2019 [35]. Because of the relatively coarse resolution of the data and classification method used, the edges of seismic lines were not adequately identified. Therefore, the edges of seismic lines and other linear disturbances, including trails and pipelines, were manually delineated using the Human Footprint Inventory as a guide [36]. Delineation was assisted by the use of the CHM, which indicates shorter vegetation occurring within seismic lines compared with that of the surrounding forests and peatlands. These linear disturbances were treated together as total anthropogenic disturbances. Seismic line age was calculated by subtracting the year the seismic line was installed from the year when the lidar data were collected (in 2020). Finally, seismic line direction (north to south, NS vs. east to west, EW) and total percentage of peatland area fragmented by these anthropogenic disturbances were also determined, as these can influence soil moisture and incoming solar radiation [25,41].
Peatlands were expertly identified based on their shape, vegetation characteristics, and topography using high spatial resolution imagery, circa 2018. These were approximately outlined and delineated into bogs and fens and were used for comparative analysis here. A total of 155 peatlands (sample size, n = 76 bogs, and n = 79 fens) were identified. The variations in vegetation heights (across cells, described below) and classification into deciduous shrubs and conifer or deciduous trees [38] within peatlands were examined. Within classified peatland shapes, peatland forms were also determined and classified into open, shrubby, and treed peatlands based on assumed shrub (up to 3 m) and tree (>3 m) heights.
To integrate the proportions of open, shrub, and treed cells within each peatland, a simple height-based metric was used based on the Alberta Wetland Classification System [42]. The proportional cover of open, shrub, and treed cells within each peatland was determined by thresholding CHM raster cells into arbitrary values as classes: Cells with a vegetation height < 0.5 m were re-classed to a value of “0”, representing “open” peatlands. Similarly, cells with vegetation heights of 0.5 to 3 m = “1” represented “shrubby” peatlands (also including juvenile trees). Cells with vegetation heights > 3 m = “2” represented “treed” peatlands. Classes were multiplied by the proportional cover of cells, and a zonal average was calculated for each peatland to determine the average proportion of each class. These were then used to identify dominantly open, shrubby, or treed classes for each peatland within the fire scars. This threshold classification was used as a simple index of combined height and proportional cover, akin to a generalized metric of ‘volume’ as an index of biomass change.

2.4. Data Analysis

2.4.1. Vegetation Height within Seismic Line Ecotones

A geospatial analysis was completed using ArcGIS Pro (ESRI Inc. Redlands, CA, USA). The difference in vegetation structure adjacent to seismic lines was quantified with distance from seismic line edge. Vegetation heights were determined at random locations using the random points tool in ArcGIS Pro, where each point was separated by a distance of >5 m (to reduce spatial autocorrelation) within each peatland. A total of 3597 sampling locations within peatlands were identified. Seismic lines can have proximal effects of up to 100 m and can influence vegetation height at distances of up to 60 m from seismic line edges, though the greatest variability is often found within 30 m of seismic lines [41]. To determine the area of greatest influence, we chose sample locations within 30 m of the seismic line edge and sampled in 1 m intervals. Vegetation heights across the seismic line within peatlands were compared using a Kruskal–Wallis one-way ANOVA to determine if statistically significant differences exist with distance from seismic lines.

2.4.2. Principle Components Analysis

To identify potentially important general peatland natural/morphological and anthropogenic drivers of post-disturbance succession, a principal component analysis (PCA) was used. A PCA is defined as a dimension-reduction approach in which new variables are constructed from original variables without losing the original information provided by the input data, thereby maintaining high data variance [43]. PCA was used to identify the interactions between the different environmental and anthropogenic correlates associated with post-fire succession by combining geospatial information and reducing data redundancy [43,44].
Within the PCA analysis, vegetation height was treated as the dependent variable, and various environmental/natural characteristics, including overall peatland slope, area, topographic position (determined from a topographic position index, TPI), and incoming solar radiation, were treated as explanatory variables that may influence post-fire vegetation growth within each peatland by altering the moisture and energy received [45,46]. For example, north-facing slopes receive less solar radiation and retain more moisture, which supports coniferous trees and casts shadows, further reducing incoming energy [47]. Anthropogenic characteristics such as seismic line age, seismic line direction, and total area fragmented by linear disturbances were also included as explanatory variables as these can impact the rate of vegetation regeneration (assumed using a descriptor of height) within peatlands [23,41]. The variables used within the PCA are described in Table 1. Variables were standardized according to [48], which ensures that the total variance is equal to one [43].
PCA variables were checked for auto correlation and collinearity using a correlation matrix and variance inflation factors (VIFs), respectively. A correlation score of greater than 0.8 and VIF greater than 15 suggest that the variables were correlated and therefore subject to collinearity [44]. These variables were removed from the final model and total variance was accounted for based on eigenvalues. The eigenvalues were then used to create a component matrix with varimax rotation to visualize how the variables cluster [43]. Varimax rotation was chosen as the rotation method because it is an orthogonal rotation that attempts to maximize the variance for each component. For this analysis, eigenvalues > 1.0 were considered as significant, and the varimax factor loadings on each PC were measured. If the values were >0.75, the factor was considered a “strong” loading factor. However, values ranging from 0.50 to 0.75 were considered “moderate”, and values range from 0.30 to 0.49 were considered “weak” factor loadings [43].

3. Results

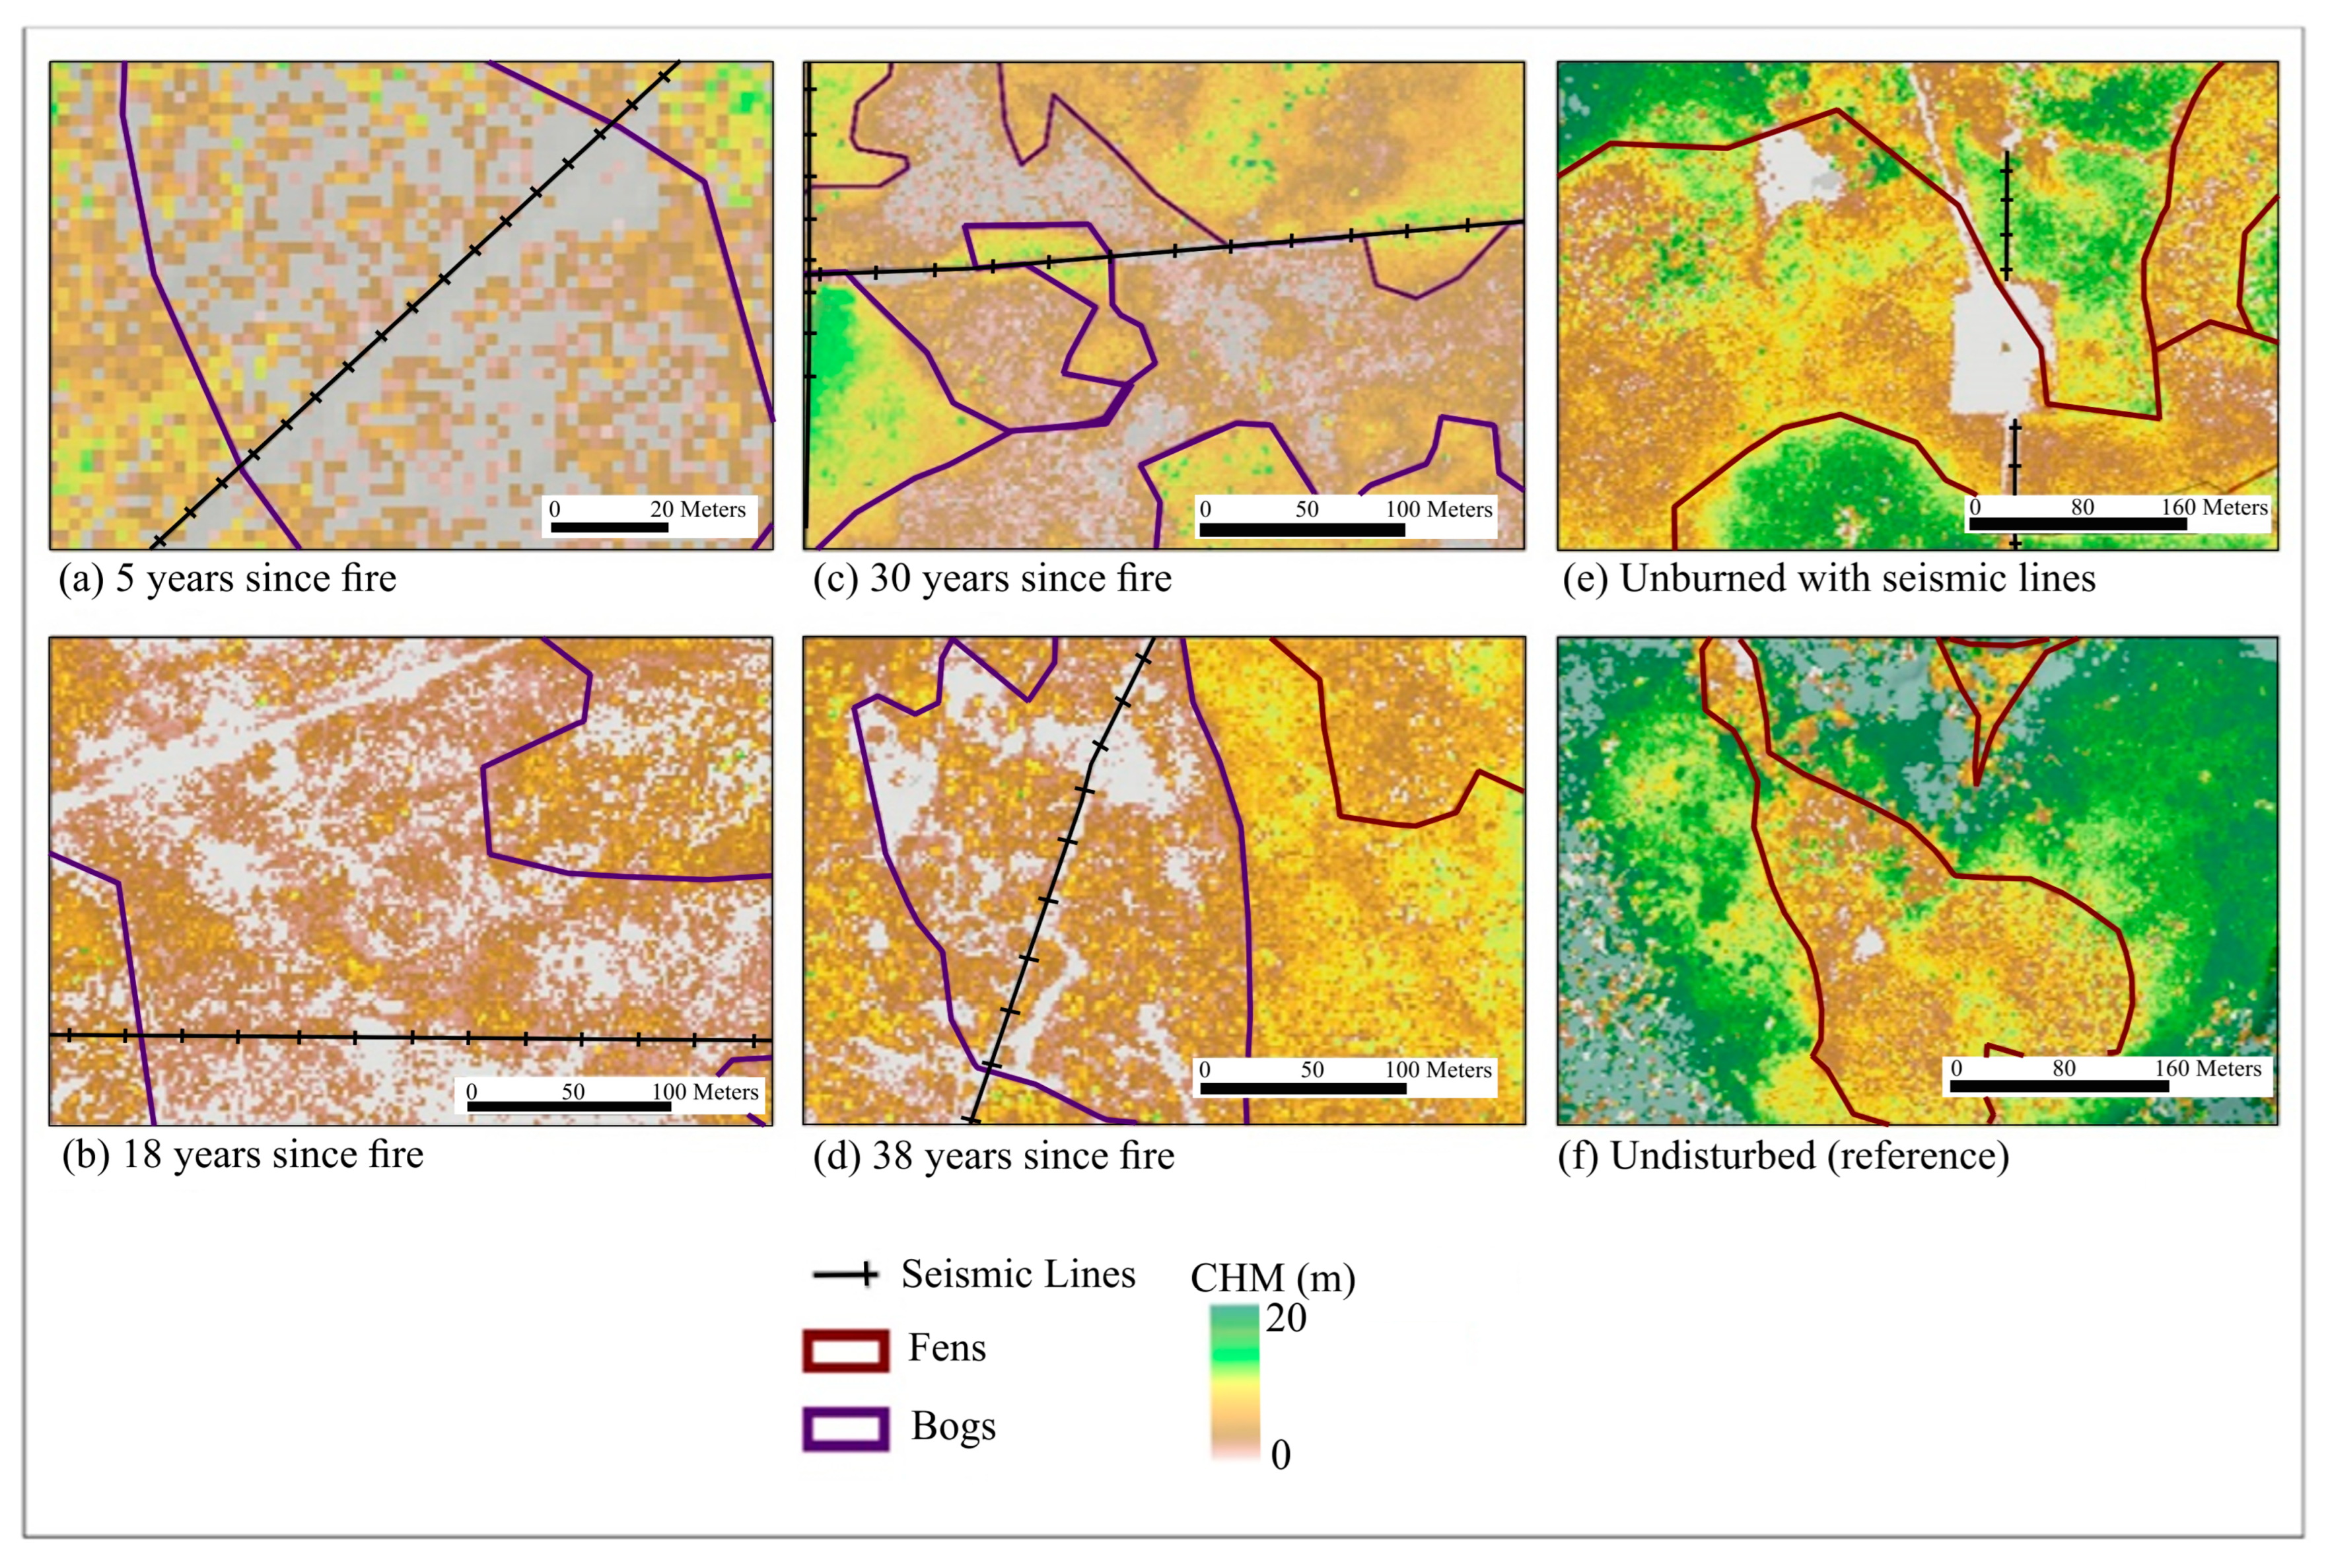
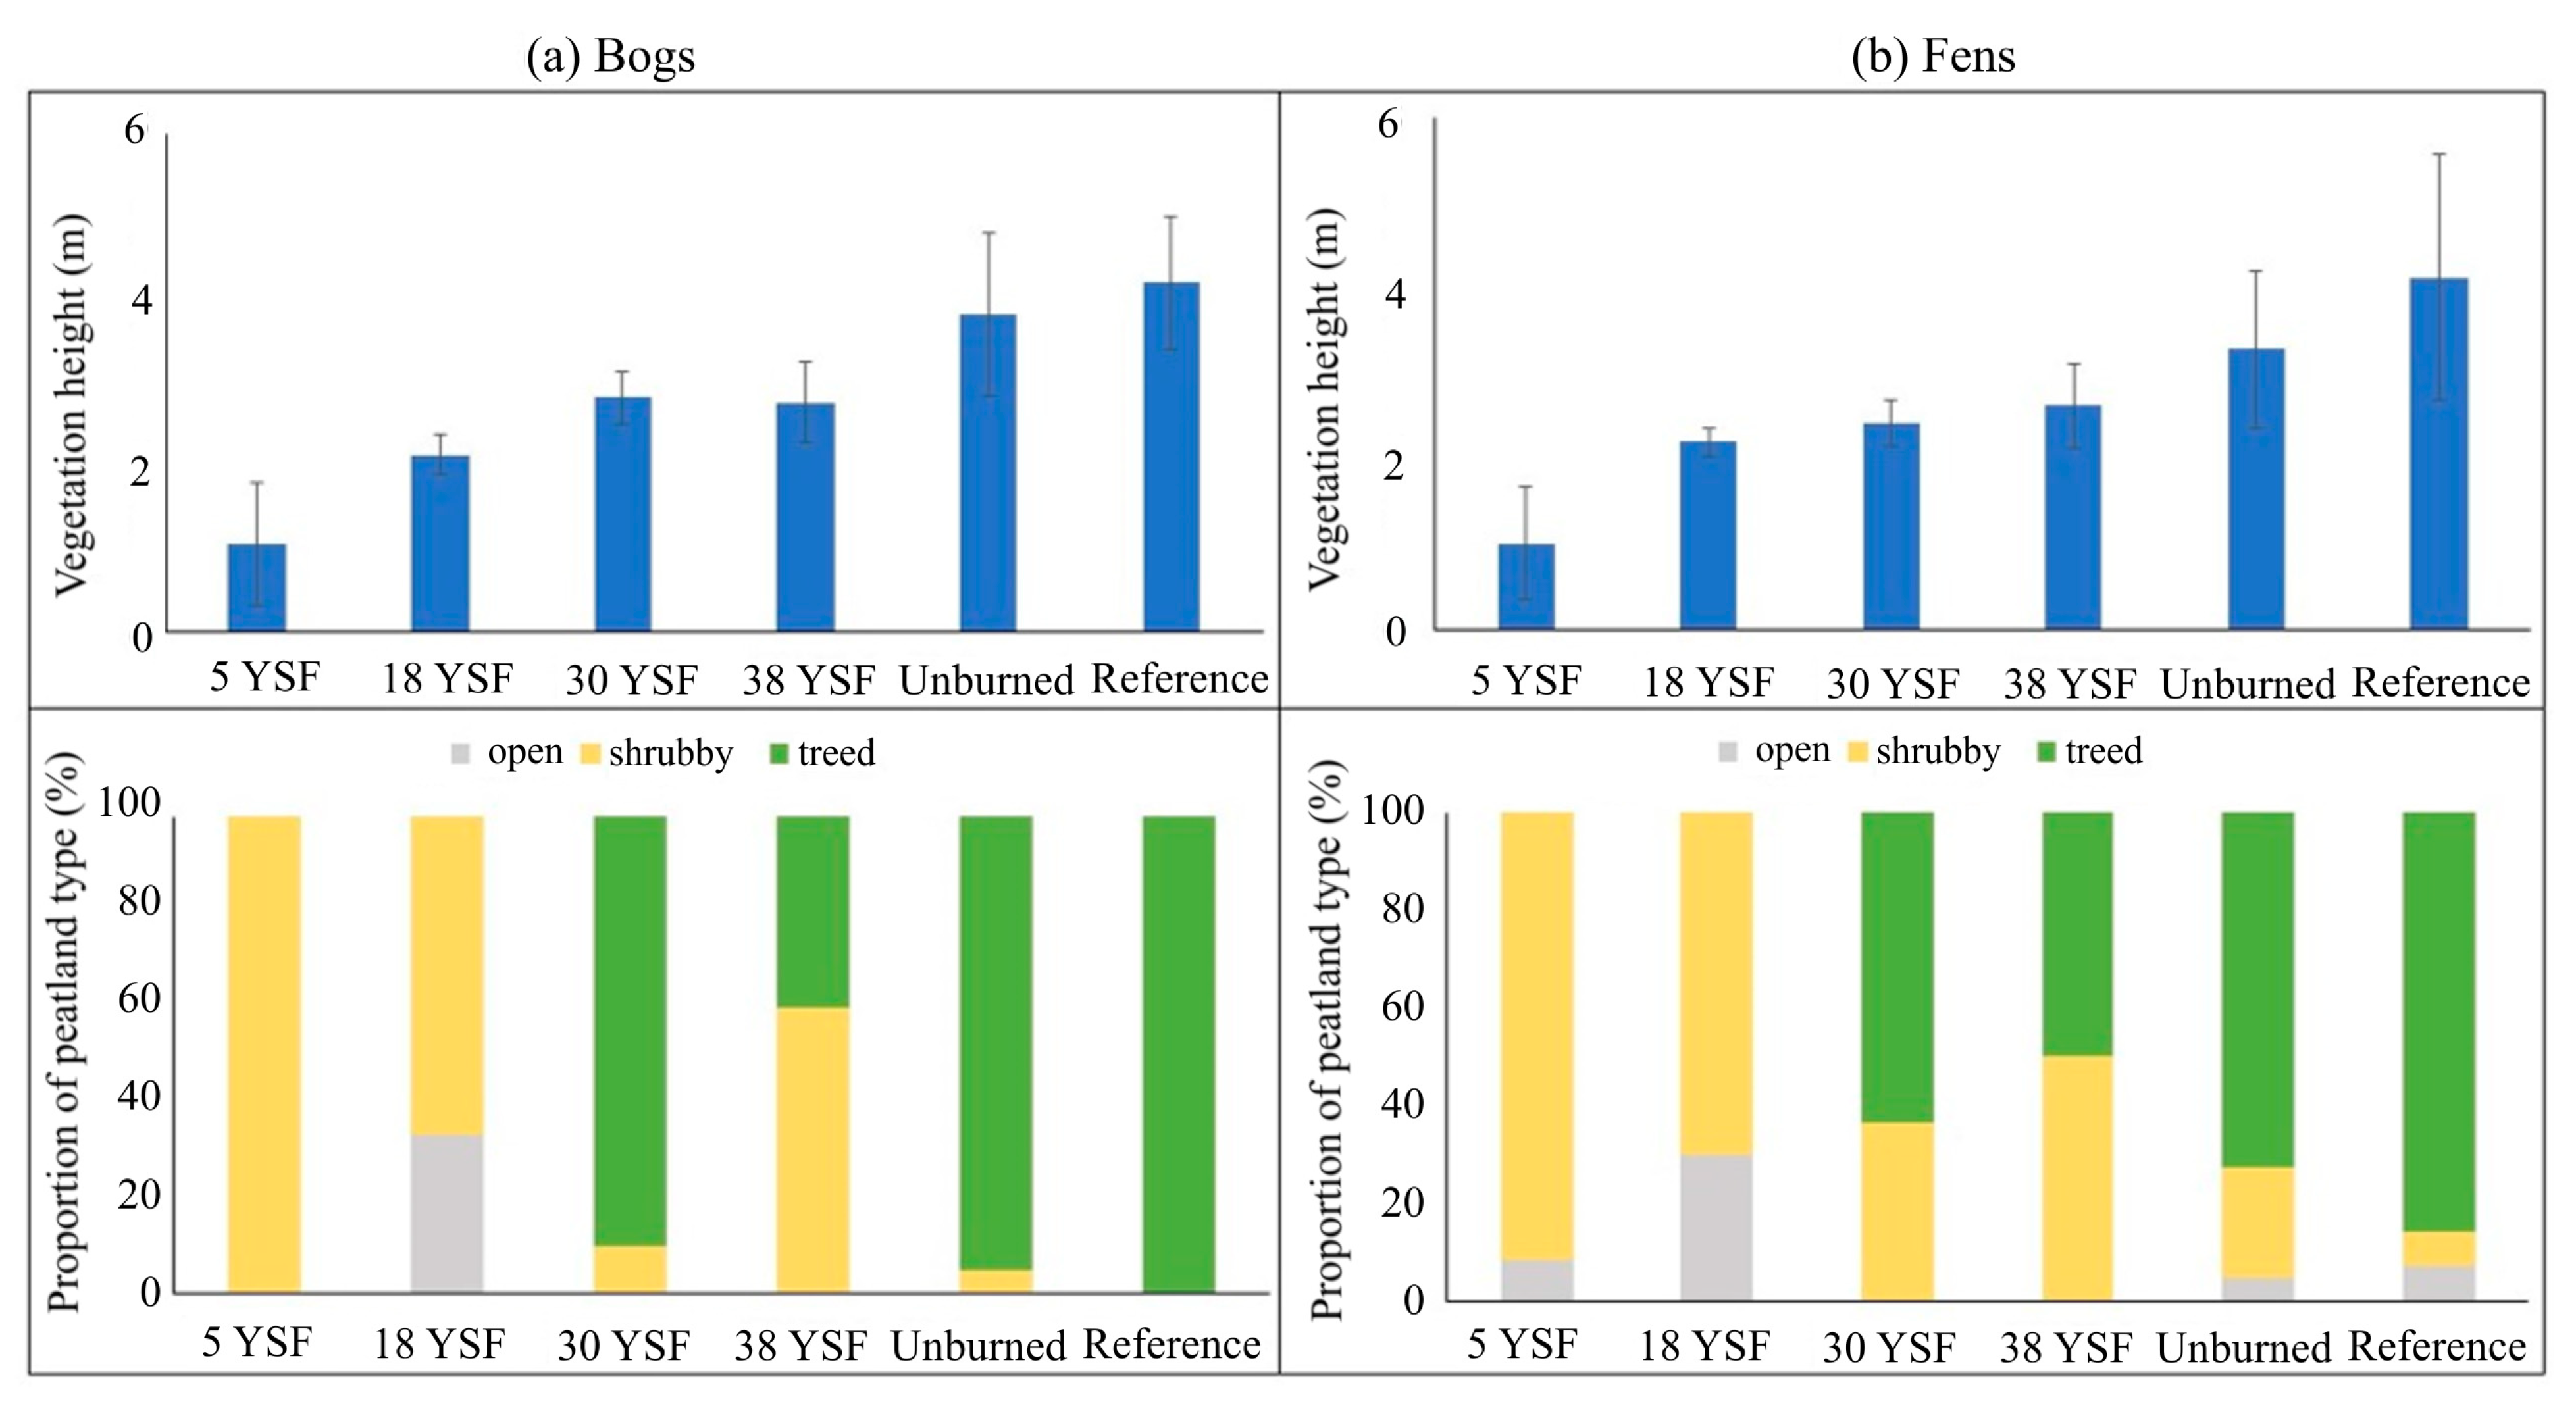
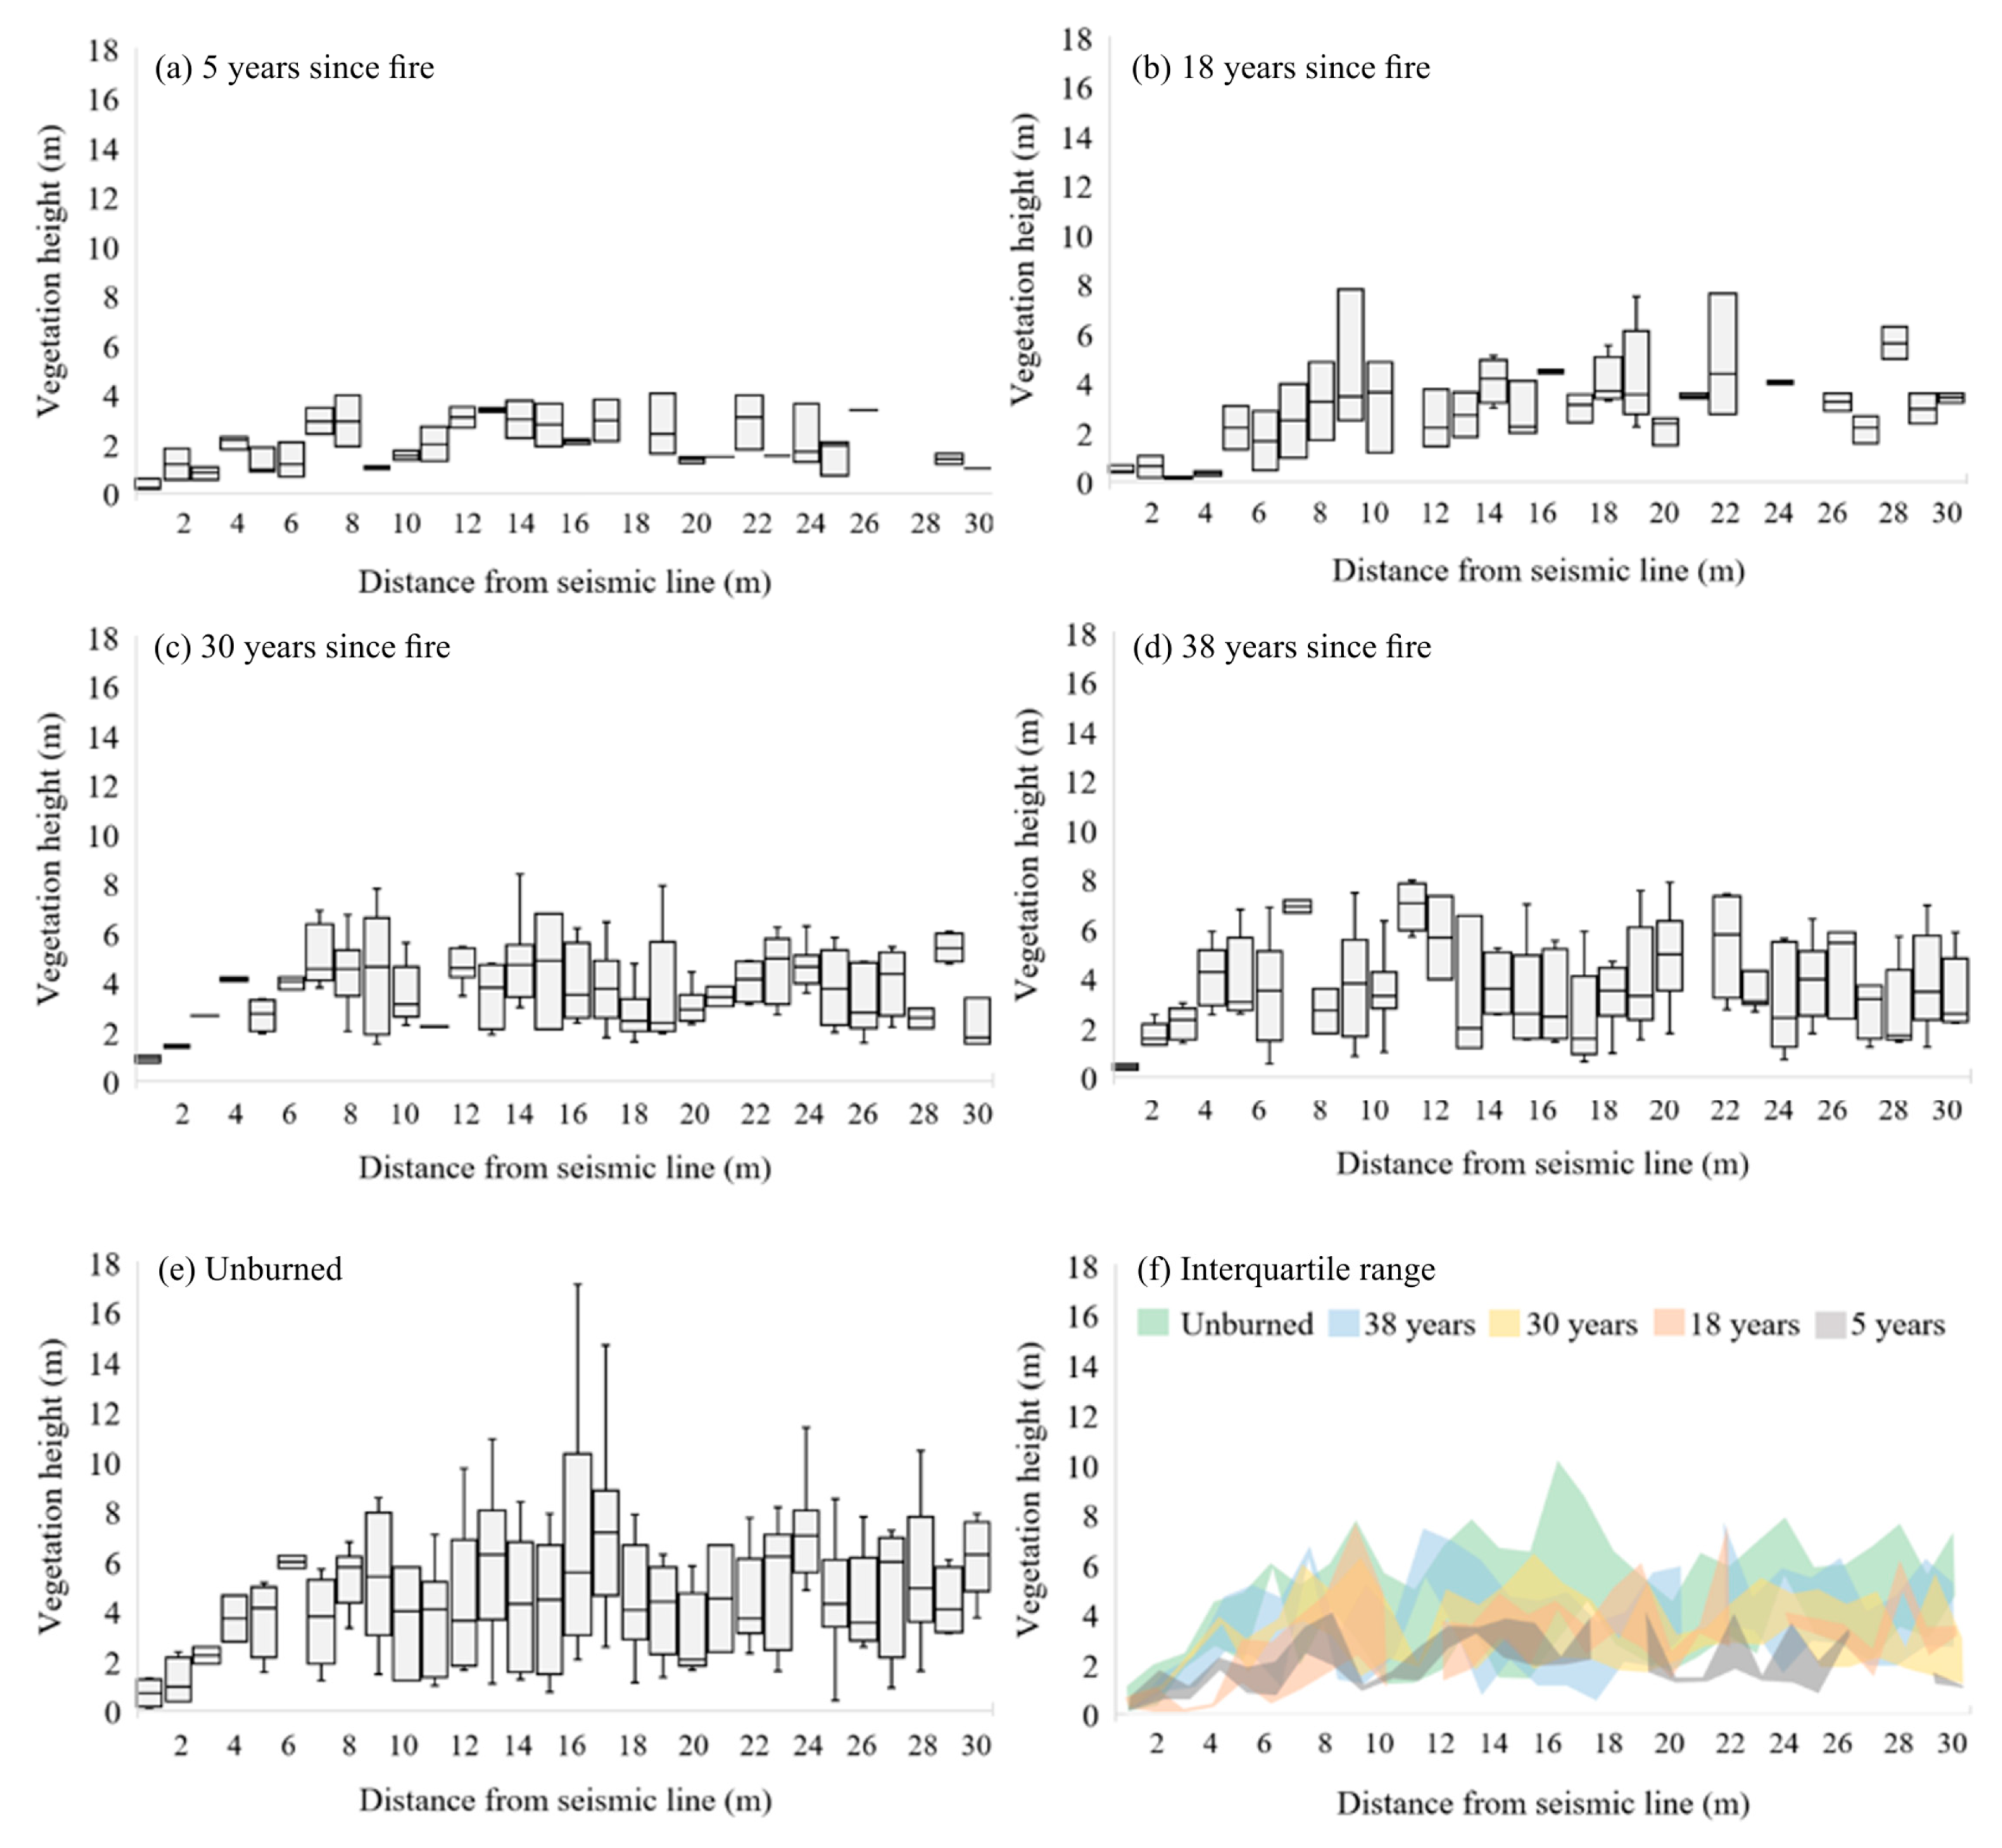
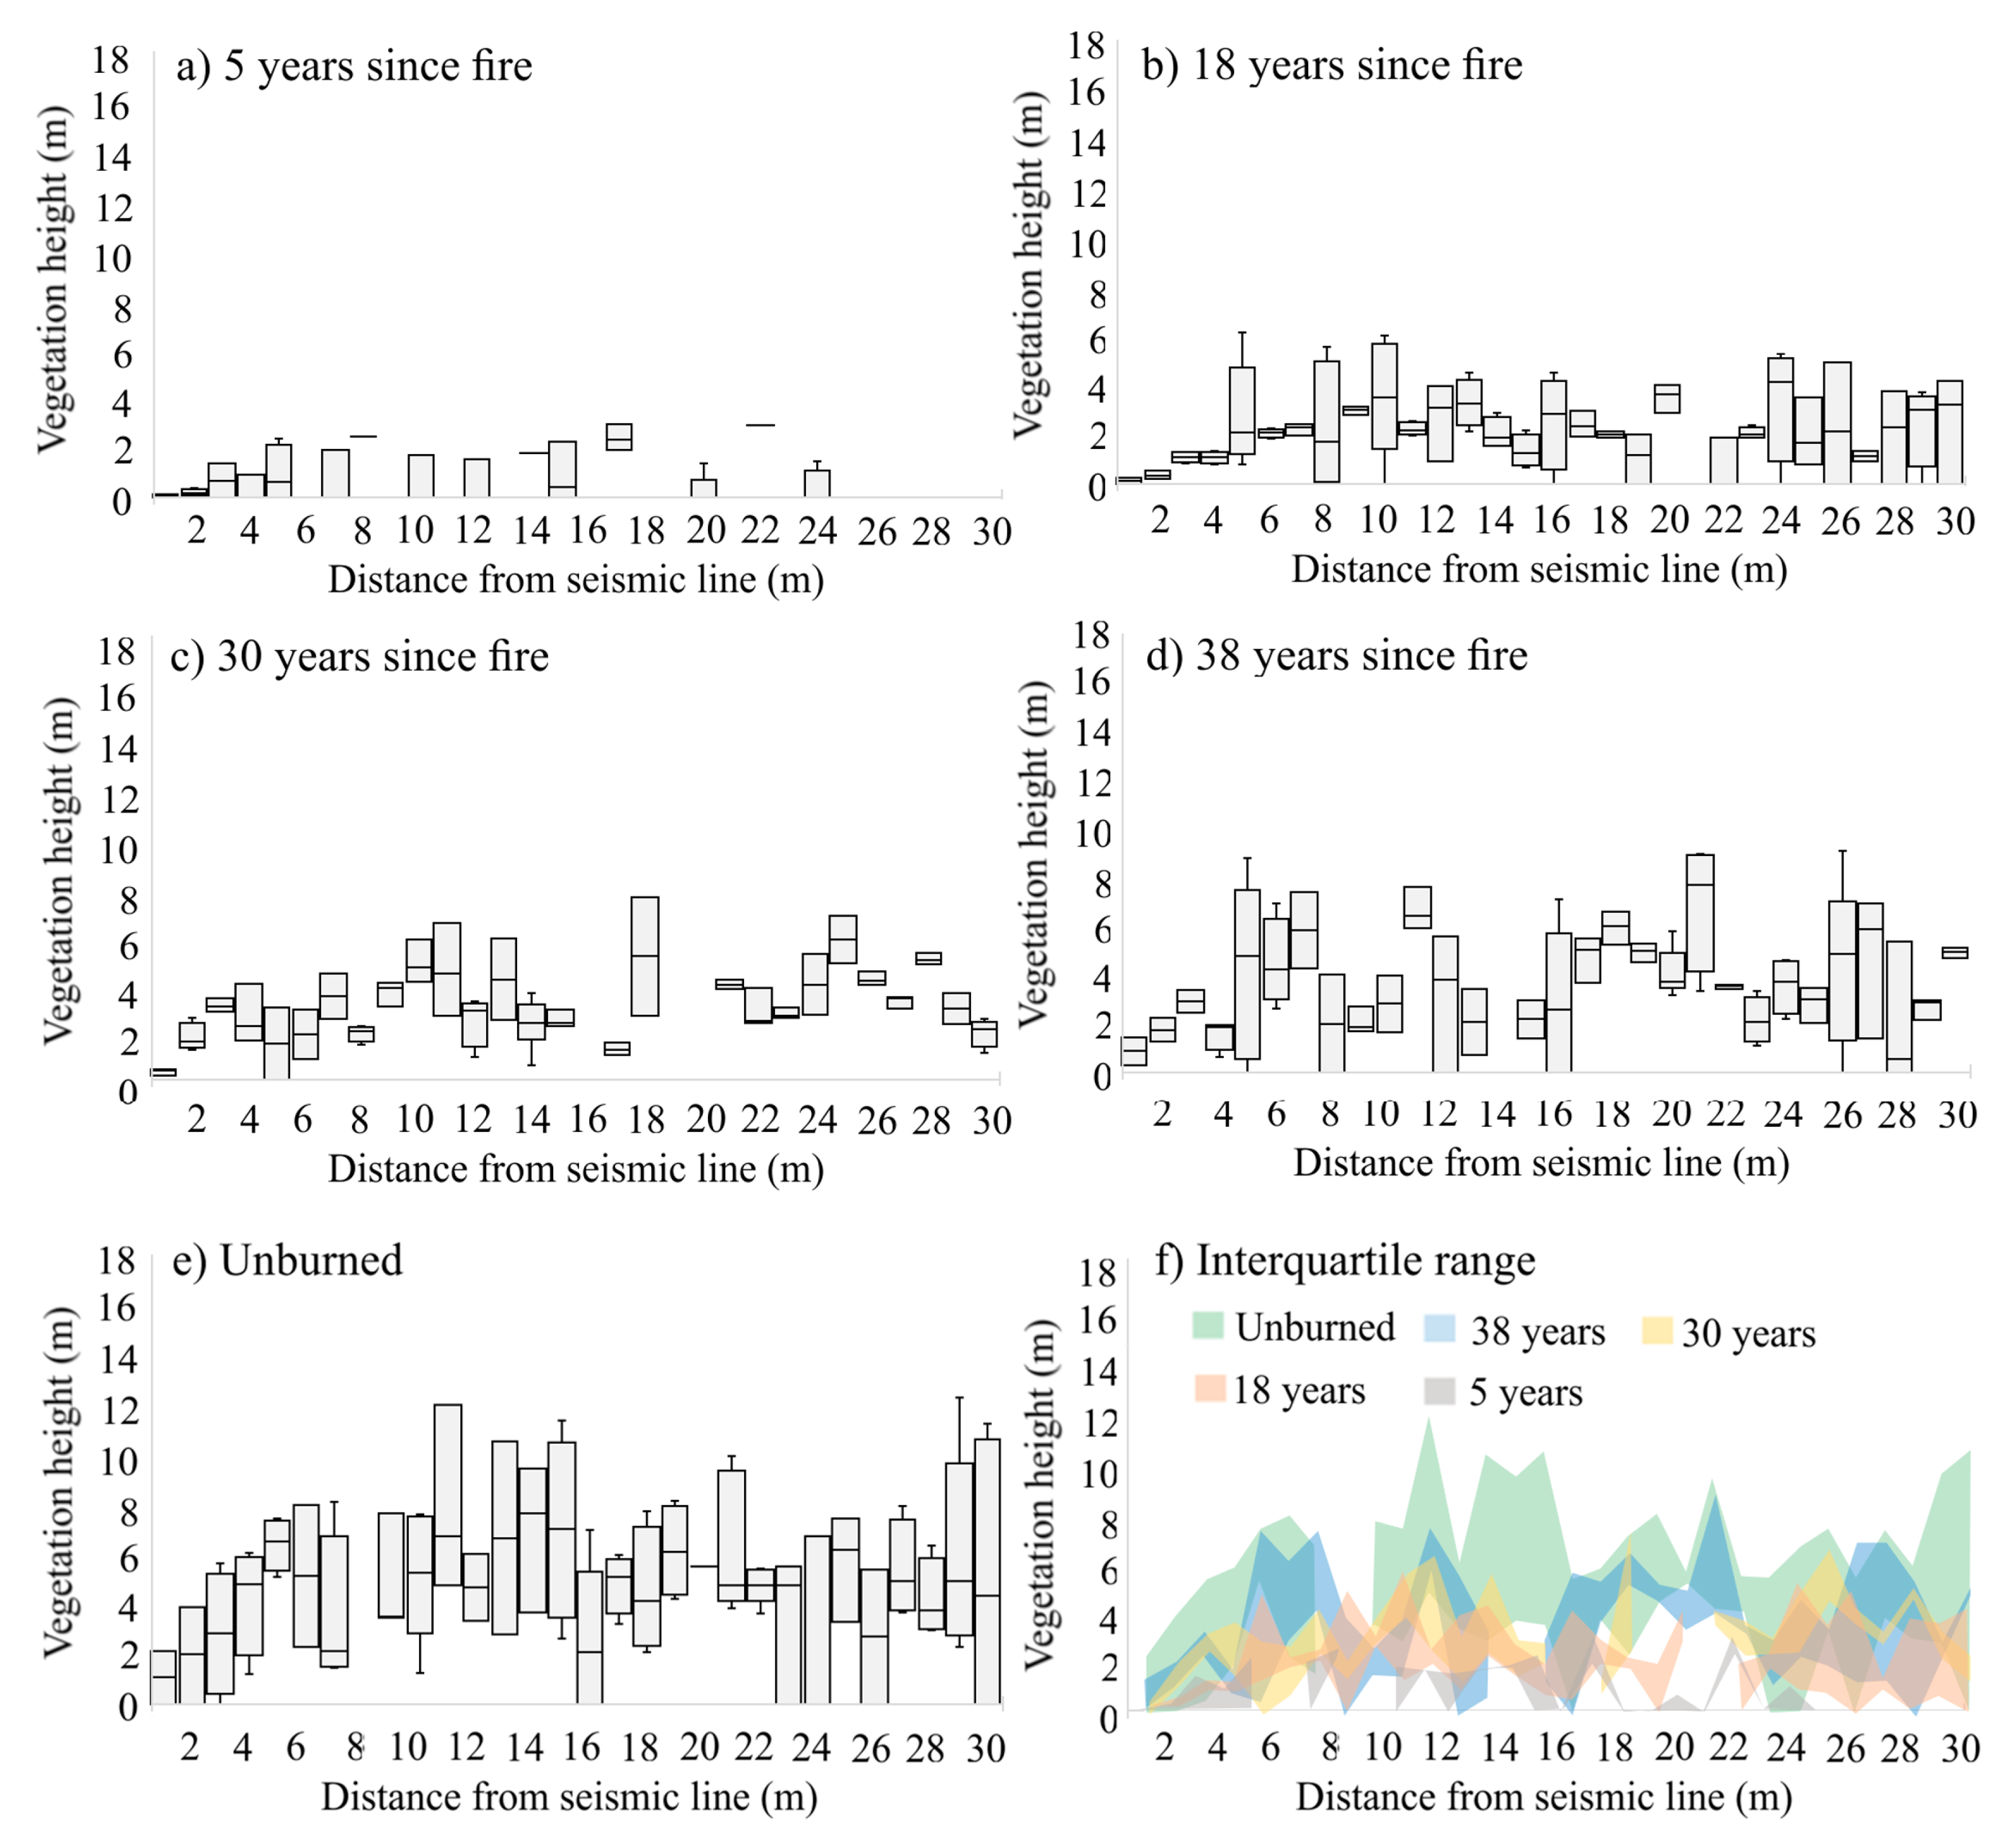
3.1. Influence of Seismic Lines on Vegetation Heights

The vegetation heights adjacent to seismic lines vary greatly between bogs and fens and with the number of years since a fire. The seismic lines had little-to-no regeneration for a period of up to 38 years since a fire (YSF) and in unburned peatlands. These differences in vegetation heights are illustrated for example peatlands in Figure 2 using the CHM.
The average vegetation heights did not differ significantly between the bogs and fens (p < 0.05), but the fens had greater variability in vegetation height as they were classified as open, shrubby, and treed, while the majority of the bogs were treed (Figure 3). Furthermore, the majority of the unburned and reference peatlands were treed. The peatlands that have gone up to 5 YSF and 18 YSF were in open and shrubby forms. The average height of vegetation did not vary greatly between 30 and 38 YSF, indicating a reduced rate of growth as trees begin to reach an intermediate level of maturity. The peatlands within these burn scars were typically shrubby and treed. The greatest average vegetation heights observed in undisturbed/reference bogs and fens were 4.2 m ± 0.8 m (stdev) and 4.1 m ± 1.4 m (stdev), respectively, while the maximum height was 6 m ± 0.5 m (stdev) (Figure 3).
The average variability in vegetation heights in the bogs was more variable up to a distance of about 20 m from the seismic lines (stdev of height is ~0.5 m), after which the vegetation heights become less variable (stdev of height is ~0.3 m) within all fire scars (Figure 4). This may be associated with a competition between herbaceous vegetation/forbs and shrubs based on the distance from the seismic lines, as well as seismic line impacts on peat compaction and hydrology. In the older burned scars in the bogs (30 and 38 YSF), there was an increase in the vegetation height adjacent to the seismic lines; however, the tree heights decreased beyond 30 m from the seismic lines within the older, burned peatlands (Figure 4). Similarly, in the unburned bogs, there was a significant (p < 0.05) increase in the vegetation height within 0 to 30 m from the seismic lines, with high variability in the vegetation heights from 6 to 30 m (stdev of height 0.2–2 m), regardless of the distance from the seismic lines (Figure 4). The distance across which there was an approximately linear increase in vegetation heights is ~9 m from the seismic line in unburned bogs; however, this distance shortens from about 8–10 m in recently burned bogs (5 and 18 YSF) to 4 m by 38 YSF. This may indicate the relationship between shrub encroachment and the time since a fire in bogs.
The fens had shorter vegetation heights (1.6 ± 0.2 m), with less variability in the deciduous shrub height as the years since fire increased (Figure 5). Similar to the bogs, we found an enhanced shrubification of fens along seismic lines in the early years post-fire, extending beyond 10 m from seismic lines. Tree heights decreased as the distance from the seismic lines increased beyond 10 m (Figure 5). However, in the unburned fens with seismic lines, shorter vegetation was found adjacent to the lines (4.3 ± 0.3 m) compared with seismic lines in more mature burned sites (38 YSF), which had taller vegetation (4.9 ± 0.4 m). There was also more variability in vegetation height (stdev of height 0.3–2.7 m) in unburned fens at distances of greater than ~6 m from the seismic lines. This suggests that seismic lines may have a more detrimental impact on fens (and perhaps hydrology) based on the relationship between variations in canopy height and the distance from seismic lines.
For the unburned fens (Figure 5), the linear increase in mean vegetation height reaches a peak at 6 m from the seismic lines. On the other hand, for the older burned fens, the vegetation heights increase to ~7 m and 5 m for 30 YSF and 38 YSF. At 18 YSF, the height increases linearly to ~10 m, on average, which suggests that fen shrub growth may be impacted by the location of seismic lines for a longer period than bogs, resulting in shorter post-fire vegetation heights, which exist at further distances from seismic lines (Figure 5). Hence, from Figure 4 and Figure 5, seismic lines have more impact on vegetation heights within the first 10 m, adjacent to seismic lines, especially in the early years post-fire.

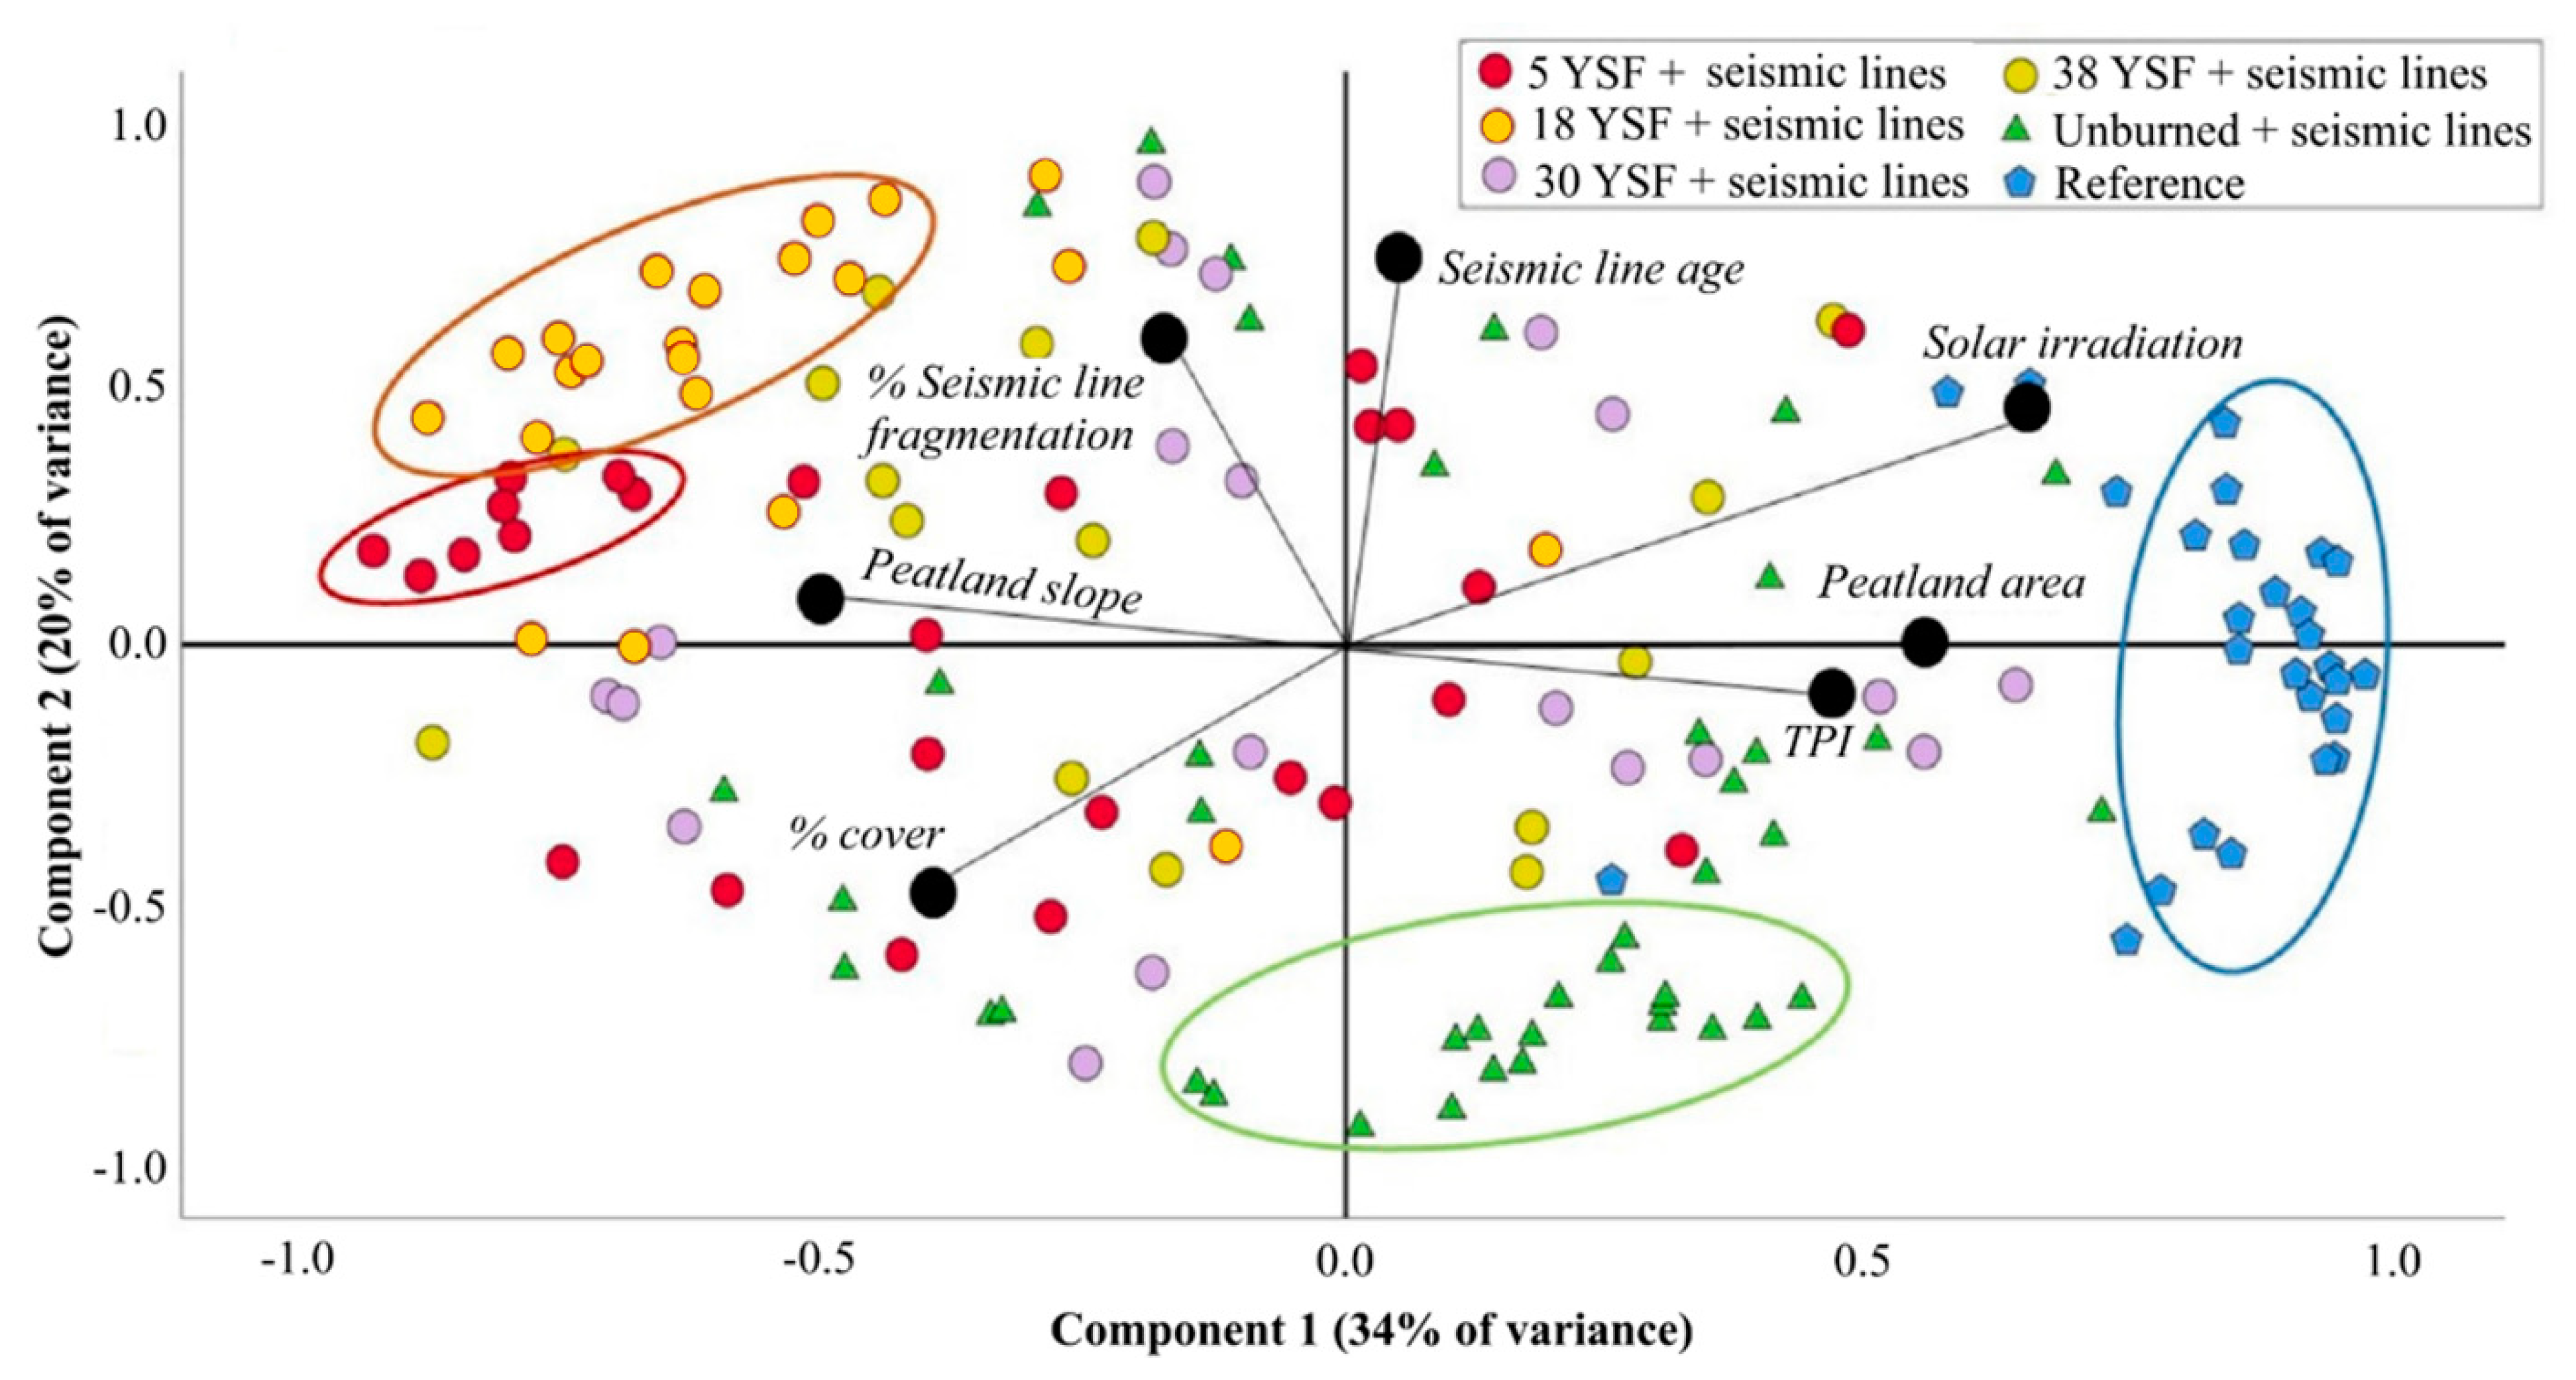
3.2. Anthropogenic/Environmental Correlates of Vegetation Succession in Peatlands

The general peatland characteristics and anthropogenic influences, including the age and width of seismic lines, were compared using a PCA to identify the correspondence between these and post-fire vegetation growth as well as the dominance of shrubs vs. trees within bog and fen peatlands. Similar work on species distributions in seismic lines using a PERMANOVA was used by Dabros and Higgins [53] in unburned forested uplands. Here we found that the seven explanatory variables (Table 2) were not strongly correlated with each other (correlation coefficient less than 0.8). Furthermore, the variables had a variance inflation factor (VIF) of less than five, suggesting that there was no collinearity in the model.
The results of the PCA showed that principal component (PC) 1 explained 34% of the variance in the average vegetation height characteristics of peatlands (bogs and fens together), while PC2 explained 20% of the variance in vegetation height. However, PCs 3 to 5 explained approximately 11% of the variance each, though their explanatory power was greatly decreased from the first two loadings. From the first two components, 54% of the cumulative variability in vegetation height was explained, while the remaining variability could be due to localized or ecological factors, possibly associated with local moisture conditions and other drivers not examined here. When components were plotted for all bogs and fens, incoming solar radiation had the strongest correspondence with taller vegetation (PC1 factor loading = 0.72) followed by peatland slope (factor loading = −0.66) and area (factor loading = 0.61), suggesting that increased slope and larger peatland areas had greater vegetation height. Similarly, seismic line age had the greatest loading on PC2 (factor loading = 0.79), followed by the percentage of peatland area fragmented by seismic lines (factor loading = 0.61). The percent of vegetation cover was negatively correlated with these variables and had a moderate loading on both components (factor loading of −0.53 on PC1 and −0.63 on PC2). Based on the groupings of the drivers, PC1 represents the morphological/natural environmental drivers and PC2 represents the anthropogenic disturbance drivers of vegetation height variability within peatlands.
Using the PCA scores, the relationship between the environmental and anthropogenic characteristics was evident based on clustering and loading vectors. The visualization identified four groups of clusters: reference peatlands and 5 YSF peatlands, which had strong loadings on PC1, and unburned peatlands and 18 YSF peatlands, which had a strong loading on PC2 (Figure 6). This indicates that the peatlands that have gone five YSF and the reference peatlands were more greatly influenced by natural/environmental components, while the 18 YSF and unburned peatlands were more influenced by anthropogenic components. However, only 36% and 48% of peatlands cluster together within the 5 YSF and unburned areas, respectively, while 68% and 86% of the eighteen YSF and reference peatlands cluster together (Figure 6). The remaining peatlands in the 30 and 38 YSF areas had a variable loading of environmental and anthropogenic components and had no clusters. These might be influenced by not only other, possibly more localized environmental driving mechanisms but also rapid regeneration/competition that exceeds the influence of local drivers.

4. Discussion

4.1. Interaction between Seismic Lines and Vegetation Response

The lidar-derived canopy height models were used to visualize the areas of vegetation regeneration in peatland ecotones adjacent to seismic lines and in the broader peatlands with respect to the time passed since a fire (Figure 3). Our results showed that most of the bogs and fens were open and shrubby, with shorter vegetation heights (as expected) in the early years post-fire (Figure 2 and Figure 3). As observed in [51], deciduous species dominate in the early years post-fire due to rapid asexual reproduction and the long-distance transport of wind-blown seeds, while conifers take longer to establish and are late post-disturbance species [54]. Moreover, Whitman et al. [55] found that forested sites with shorter fire return intervals had a decrease in conifer absolute density but with no corresponding change in deciduous tree stem density. In other recent research, Baltzer et al. [56] suggest the failure of black spruce regeneration in increasingly drier post-fire regeneration across North America. The variations in vegetation height noted in [19,35] exist due to the soil compression caused during seismic line construction, resulting in the lowering of the surface elevation and reduced water table depth. This was especially the case in bogs near Fort Mackay, Alberta, where Chasmer et al. [57] found greater proportional area of shrubs and greater shrub heights in bogs fragmented by anthropogenic disturbances. In the early years following a wildland fire, Pinzon et al. [27] found that the lack of fire on seismic lines following the high-severity Horse River (Fort McMurray) fire in Alberta, Canada, in 2016 provided opportunities for new seedling growth and improved habitats for fauna such as spiders compared with unburned seismic lines and adjacent forested areas. Thus, seismic lines could be considered important mechanisms for early post-fire peatland recovery and may, over time, initiate the recovery trajectories of particular post-fire species [27]. Pinzon et al. [27] note, however, that the early recovery trajectories of post-fire species should be monitored over time, as these may or may not represent intermediate and late-stage vegetation recovery. Further, the combined influence of environmental variability on seismic lines may result in a loss of suitable microsites for conifer seedling establishment associated with changing soil moisture and thermal regimes with respect to the time passed since a fire [16,26].
On average, we observe an impact on the average vegetation height up to a distance of ~9 m from seismic lines in unburned bogs. The average distance between seismic lines and shrub growth shortens with increasing numbers of years since a fire, indicating greater shrubification adjacent to seismic lines after many years since a fire compared with bogs that have not been burned in the recent past. Finnegan et al. [24] and Barber et al. [25] found that burned seismic lines were characterized by an open canopy of moss, shrub, and graminoid cover, with a 21%–25% reduction in canopy height compared to adjacent forest plots, while Pinzon et al. [27] found increased seedling density in low-severity post-fire seismic lines one year following the Horse River fire, but lower in seismic lines that had not burned. In peatlands adjacent to seismic lines, Echiverri et al. [58] found that the edge effects of seismic lines in fens occur within 25 m from the seismic line edge.
Our results also showed that seismic lines have a potentially more damaging and long-lasting effect on fens. Tree heights decreased significantly (p < 0.05) with increasing distance from seismic lines, suggesting that seismic lines have a less severe impact on bogs overall. Since bogs are ombrogenous and dominated by black spruce, the areas adjacent to burned seismic lines provide suitable microsites for the establishment of conifer seedlings and have lower species richness post-fire, which was observed (from adolescence to intermediate maturity) within peatlands burned 38 years ago [52].
At 30 years since a fire, there was a higher proportional cover of taller vegetation, which decreased as the years since a fire increased (Figure 3). This provides evidence that peatlands with seismic lines that burn could result in enhanced regeneration with similar vegetation characteristics to those in areas adjacent to seismic lines in unburned peatlands. Hence, wildland fires that burn through seismic lines may increase the water table depth over time, thereby enhancing the conditions for woody vegetation growth [52,59]. Changes in hydrology, especially enhanced drying, promote the more rapid regeneration of herbaceous vegetation following a fire compared with peatlands that have remained unburned in recent history. Fire also allows the vegetation near seismic lines to recover to similar trajectories as undisturbed peatlands that have not been burned or fragmented by seismic lines.

4.2. Interactions between the Primary Drivers of Vegetation Growth

Among all the environmental/morphological variables (derived from geospatial information) examined in this study, modelled incoming solar radiation was the strongest driver of vegetation growth adjacent to seismic lines. Similar observations were also found in [27] in two peatland examples and in [53] in upland forests. We hypothesized that areas receiving more solar radiation with greater sloped surfaces would have taller vegetation, demonstrated by its highest loading on PC1 compared to the other topographical drivers (Table 2). A greater canopy openness adjacent to seismic lines increases light penetration, creating an opportunity for competition and vegetation establishment compared with areas that are furthest from seismic line influences [35]. This was observed in some peatlands burned five years prior to the data collection, resulting in a strong loading on PC1, dominated by shrubs (Figure 6). Furthermore, greater amounts and prolonged periods of incident solar radiation increases air and soil temperatures as well as water fluxes [60], decreasing resource competition among species [37]. Similar to [41], the tree and shrub vegetation at the furthest distances (~30 m) from seismic lines became more similar in height to those found in the unburned and undisturbed (reference) peatlands.
Finally, we hypothesized that older seismic lines would have taller vegetation. Our results showed that the age of seismic lines has the strongest loading on the anthropogenic component, PC2, compared to the percentage of area fragmented by seismic lines. Similarly, [41] found that vegetation was often taller adjacent to older seismic lines, as there is more time for its establishment and growth. Moreover, there was less vegetation recovery in peatlands that were more fragmented by seismic lines, as these tended to reduce microtopography [19]. The peatlands burned 18 years ago were strongly influenced by anthropogenic factors, loading strongly on PC2. Interestingly, in this area, peatlands also have an average seismic line age of 18 years, e.g., [36], indicating that seismic lines in some peatlands may have been constructed either just before (in the 5 YSF and 18 YSF peatlands) or just after the fire (in the 30 YSF and 38 YSF peatlands). Within peatlands that had burned 30 and 38 years ago, we find that these tend to have a variable loading of environmental and seismic line characteristics, possibly indicating other, perhaps more localised environmental factors influencing vegetation regeneration, which should be explored further in future studies.
Hence, there is a dominance of shorter vegetation (likely shrubs) and taller vegetation (trees) immediately adjacent to seismic lines (up to 30 YSF, Figure 2 and Figure 3), indicating that the seismic lines have an influence on vegetation succession. These may also recover more rapidly due to abiotic conditions, especially in the early years following a disturbance [61]. In unburned peatlands, vegetation is at a mature stage of succession; therefore, the trees will be dominantly impacted by seismic lines only (and climatic changes impacting all peatlands in the area), which can be observed via the strong loading of unburned peatlands on PC2 (Figure 6). The recovery of vegetation on seismic lines is slow, and it may take decades to establish the pre-disturbance conditions suitable for tree regeneration [23,41].

4.3. Limitations

Although lidar data provide a high-spatial-resolution quantification of structural variability [39], the data acquired using lidar can be both more detailed (in terms of structural measurements) and can also exclude other important information about the forest succession observed using field measurements. These include important attributes of the post-disturbance environment, including seedling count, species richness, tree diameter, and site conditions [25]. However, field measurements are also limited due to the time and cost associated with data collection. Therefore, there is a trade-off between the generalized acquisition of post-fire and seismic line impacts on a broad range of peatlands using lidar data and the detail achieved with field measurements. Dabros and Higgins [53] note the importance of using a combined approach comprising field measurements and remotely sensed data to understand the post-seismic line disturbance impacts on forest regeneration.
With regards to the drivers of vegetation growth following a disturbance, we limited the drivers to the use of morphological (vegetation and topographic) and anthropogenic average variables within peatlands. These explain 54% of the variability, suggesting that the remaining variability is localized (Table 2) and should be assessed using on-site proximal characteristics with localised thematic information. Moreover, extrinsic drivers, such as the water inputs into the peatlands, were not considered, nor was the initial burn severity, which can influence site conditions and seedbank availability [62]. To improve this model, localized environmental variables such as peatland hydrological characteristics, soil moisture, and life stage conditions of deciduous and conifer species should be considered in future studies.

5. Conclusions

This study demonstrates the use of a multi-spectral lidar for quantifying the vegetation recovery adjacent to seismic lines within a post-fire chronosequence. The results of this study suggest that a wildland fire improves the site conditions for woody vegetation regeneration, especially for shrubs and trees adjacent to seismic lines, in the years following fires in peatlands. However, once seismic lines have been constructed through the peatlands, they have significant and continued impacts on the establishment of vegetation within up to 9 m from the seismic lines. This could indicate that seismic lines have lasting effects on peatlands, not only within seismic lines but also across the broader peatland area. Further, shrub encroachment closer to seismic lines tends to occur within fens, indicating that these may be more sensitive to drying conditions after several years post-fire/post-seismic-line disturbance. When quantifying the environmental drivers of post-fire vegetation height, peatland morphological/environmental and anthropogenic components explained 54% of the variability in vegetation growth following fire. This suggests that peatlands with seismic lines and older vegetation succession might be impacted by other, more localised factors.

Author Contributions

Conceptualization, H.E., L.C., C.H., D.T. and D.C.; methodology, H.E., L.C., C.H., D.T. and D.C.; software, L.C. and C.H.; validation, H.E.; formal analysis, H.E.; writing—original draft preparation, H.E.; writing—review and editing, L.C., C.H., D.T. and D.C.; supervision, L.C.; project administration, L.C. and D.C.; funding acquisition, L.C., C.H. and D.C. All authors have read and agreed to the published version of the manuscript.

Funding

This research was funded by the NSERC Discovery Grant (grant number 2017-04492) to Laura Chasmer, Alberta Environment and Protected Areas (grant number 18GRAEM24) to Laura Chasmer and Danielle Cobbaert, NSERC Canada Wildfire (grant number RES0049086) to Laura Chasmer and Christopher Hopkinson, and the Oil Sands Monitoring Program. The Titan lidar was purchased with a grant to Christopher Hopkinson from Western Economic Diversification Canada (grant number 000015316). Field equipment was purchased using Canadian Foundation for Innovation (grant number 32436) to Christopher Hopkinson and Laura Chasmer. Funding for this project was also provided to Humaira Enayetullah by Alberta Graduate Excellence Scholarship, Alberta Environment and Protected Areas and Northern Scientific Training Program (NSTP).

Data Availability Statement

Lidar data can be requested through [email protected] and [email protected], along with delineated wetlands. Geospatial data layers can be downloaded from ABMI (https://abmi.ca/home/data-analytics/da-top/da-product-overview/Data-Archive/Land-Cover.html, accessed on 27 November 2021).

Acknowledgments

Airborne lidar data collection, pre-processing, and technical support was completed by Maxim Okhrimenko. Lab help was obtained from Celeste Barnes (University of Lethbridge). We would also like to thank Edberto Moura-Lima for a helpful discussion on PCAs. This work was partially funded under the Oil Sands Monitoring (OSM) Program. It is independent of any position of the OSM Program.

Conflicts of Interest

The authors declare no conflict of interest.

References

  1. Kuhry, P.; Nicholson, B.J.; Gignac, L.D.; Vitt, D.H.; Bayley, S.E. Development of Sphagnum-dominated peatlands in boreal continental Canada. Can. J. Bot. 1993, 71, 10–22. [Google Scholar] [CrossRef]
  2. Vitt, D.H. An overview of factors that influence the development of Canadian peatlands. Mem. Entomol. Soc. Can. 1994, 126, 7–20. [Google Scholar] [CrossRef]
  3. ECCC. Climate Data and Scenarios for Canada: Synthesis of Recent Observation and Modelling Results; Environment and Climate Change Canada: Gatineau, QC, Canada, 2016; ISBN 978-0-660-04262-6. [Google Scholar]
  4. Thompson, D.K.; Simpson, B.N.; Whitman, E.; Barber, Q.E.; Parisien, M.-A. Peatland Hydrological Dynamics as A Driver of Landscape Connectivity and Fire Activity in the Boreal Plain of Canada. Forests 2019, 10, 534. [Google Scholar] [CrossRef]
  5. Burton, P.J.; Parisien, M.-A.; Hicke, J.A.; Hall, R.J.; Freeburn, J.T. Large fires as agents of ecological diversity in the North American boreal forest. Int. J. Wildland Fire 2008, 17, 754–767. [Google Scholar] [CrossRef]
  6. Jones, E.; Chasmer, L.; Devito, K.; Rood, S.; Hopkinson, C. Ecological impacts of shortening fire return intervals on boreal peatlands and transition zones using integrated in situ field sampling and lidar approaches. Ecohydrology 2022, 15, e2403. [Google Scholar] [CrossRef]
  7. Wilkinson, S.L.; Moore, P.A.; Flannigan, M.D.; Wotton, B.M.; Waddington, J.M. Did enhanced afforestation cause high severity peat burn in the Fort McMurray Horse River wildfire? Env. Res. Lett. 2018, 13, 014018. [Google Scholar] [CrossRef]
  8. Davies, G.M.; Gray, A.; Rein, G.; Legg, C.J. Peat consumption and carbon loss due to smoldering wildfire in a temperate peatland. For. Ecol. Manag. 2013, 308, 169–177. [Google Scholar] [CrossRef]
  9. de Groot, W.J.; Flannigan, M.D.; Cantin, A.S. Climate change impacts on future boreal fire regimes. For. Ecol. Manag. 2013, 294, 35–44. [Google Scholar] [CrossRef]
  10. Davidson, S.J.; Van Beest, C.; Petrone, R.; Strack, M. Wildfire overrides hydrological controls on boreal peatland methane emissions. Biogeosciences 2019, 16, 2651–2660. [Google Scholar] [CrossRef]
  11. Nelson, K.; Thompson, D.; Hopkinson, C.; Petrone, R.; Chasmer, L. Peatland-fire interactions: A review of wildland fire feedbacks and interactions in Canadian boreal peatlands. Sci. Total Environ. 2021, 769, 145212. [Google Scholar] [CrossRef]
  12. Natural Resources Canada. The State of Canada’s Forests. Annual Report 2017. Canadian Forest Service, Ottawa. Available online: https://cfs.nrcan.gc.ca/publications/download-pdf/38871 (accessed on 30 May 2020).
  13. Johnstone, J.F.; Chapin, F.S., III; Foote, J.; Kemmett, S.; Price, K.; Viereck, L. Decadal observations of tree regeneration following fire in boreal forests. Can. J. For. Res. 2004, 34, 267–273. [Google Scholar] [CrossRef]
  14. Johnstone, J.F.; Chapin, F.S. Effects of Soil Burn Severity on Post-Fire Tree Recruitment in Boreal Forest. Ecosystems 2006, 9, 14–31. [Google Scholar] [CrossRef]
  15. Bolton, D.K.; Coops, N.C.; Wulder, M.A. Characterizing residual structure and forest recovery following high-severity fire in the western boreal of Canada using Landsat time-series and airborne lidar data. Remote Sens. Environ. 2015, 163, 48–60. [Google Scholar] [CrossRef]
  16. Dabros, A.; Pyper, M.; Castilla, G. Seismic lines in the boreal and arctic ecosystems of North America: Environmental impacts, challenges, and opportunities. Environ. Rev. 2018, 26, 214–229. [Google Scholar] [CrossRef]
  17. Strack, M.; Hayne, S.; Lovitt, J.; McDermid, G.J.; Rahman, M.M.; Saraswati, S.; Xu, B. Petroleum exploration increases methane emissions from northern peatlands. Nat. Commun. 2019, 10, 2804. [Google Scholar] [CrossRef]
  18. Jordaan, S.M. Land and Water Impacts of Oil Sands Production in Alberta. Environ. Sci. Technol. 2012, 46, 3611–3617. [Google Scholar] [CrossRef]
  19. Stevenson, C.; Filicetti, A.; Nielsen, S. High precision altimeter demonstrates simplification and depression of microtopography on seismic lines in treed peatlands. Forests 2019, 10, 295. [Google Scholar] [CrossRef]
  20. Davidson, S.J.; Goud, E.M.; Franklin, C.; Nielsen, S.E.; Strack, M. Seismic Line Disturbance Alters Soil Physical and Chemical Properties Across Boreal Forest and Peatland Soils. Front. Earth Sci. 2020, 8, 281. [Google Scholar] [CrossRef]
  21. Dabros, A.; Higgins, K.L.; Pinzon, J. Seismic line edge effects on plants, lichens and their environmental conditions in boreal peatlands of Northwest Alberta (Canada). Restor. Ecol. 2021, 30, e13468. [Google Scholar] [CrossRef]
  22. Lee, P.; Boutin, S. Persistence and developmental transition of wide seismic lines in the western Boreal Plains of Canada. J. Environ. Manag. 2006, 78, 240–250. [Google Scholar] [CrossRef]
  23. Van Rensen, C.K.; Nielsen, S.E.; White, B.; Vinge, T.; Lieffers, V.J. Natural regeneration of forest vegetation on legacy seismic lines in boreal habitats in Alberta’s oil sands region. Biol. Conserv. 2015, 184, 127–135. [Google Scholar] [CrossRef]
  24. Finnegan, L.; Pigeon, K.E.; MacNearney, D. Predicting patterns of vegetation recovery on seismic lines: Informing restoration based on understory species composition and growth. For. Ecol. Manag. 2019, 446, 175–192. [Google Scholar] [CrossRef]
  25. Barber, Q.E.; Bater, C.W.; Dabros, A.; Pinzon, J.; Nielsen, S.E.; Parisien, M.-A. Persistent impact of conventional seismic lines on boreal vegetation structure following wildfire. Can. J. For. Res. 2021, 51, 1581–1594. [Google Scholar] [CrossRef]
  26. Weiland, L.; Green-Harrison, T.; Ketcheson, S. The Influence of Seismic Lines on Wildfire Potential in the Boreal Region of Northern Alberta, Canada. Forests 2023, 14, 1574. [Google Scholar] [CrossRef]
  27. Pinzon, J.; Dabros, A.; Riva, F. Short-term effects of wildfire in boreal peatlands: Does fire mitigate the linear footprint of oil and gas exploration? Ecol. Appl. 2021, 31, e02281. [Google Scholar] [CrossRef]
  28. Sherwood, J.H.; Kettridge, N.; Thompson, D.K.; Morris, P.J.; Silins, U.; Waddington, J.M. Effect of drainage and wildfire on peat hydrophysical properties. Hydrol. Process. 2013, 27, 1866–1874. [Google Scholar] [CrossRef]
  29. Kettridge, N.; Turetsky, M.R.; Sherwood, J.H.; Thompson, D.K.; Miller, C.A.; Benscoter, B.W.; Flannigan, M.D.; Wotton, B.M.; Waddington, J.M. Moderate drop in water table increases peatland vulnerability to post-fire regime shift. Sci. Rep. 2015, 5, srep08063. [Google Scholar] [CrossRef]
  30. Bonan, G.B.; Shugart, H.H. Environmental Factors and Ecological Processes in Boreal Forests. Annu. Rev. Ecol. Syst. 1989, 20, 1–28. [Google Scholar] [CrossRef]
  31. Canadian Councils of Resource Ministers. Boreal Plains Ecozone+ Evidence for Key Findings Summary. Canadian Biodiversity: Ecosystem Status and Trends 2010,. Evidence for Key Findings Summary Report No. 12. 2014, Ottawa, ON. ix + 106p. Available online: http://www.biodivcanada.ca/default.asp?lang=En&n=137E1147-1 (accessed on 15 June 2021).
  32. Government of Canada. Meteorolgical Service of Canada Weather Station Data at Lac La Biche, AB; Government of Canada: Ottawa, ON, Canada, 2020. [Google Scholar]
  33. Alberta Parks. Natural Regions and Subregions of Alberta. A Framework for Alberta’s Parks; Alberta Tourism, Parks and Recreation: Edmonton, AB, Canada, 2015; Available online: https://www.albertaparks.ca/media/6256258/natural-regions-subregions-of-alberta-a-framework-for-albertas-parks-booklet.pdf (accessed on 26 March 2021).
  34. Campbell, J.E.; Fenton, M.M.; Pawlowicz, J.G. Surficial Geology of the Pelican Lake Area (NTS83P). 2006. Available online: https://ags.aer.ca/publication/dig-2002-0017 (accessed on 23 March 2021).
  35. Dabros, A.; Hammond, H.J.; Pinzon, J.; Pinno, B.; Langor, D. Edge influence of low-impact seismic lines for oil exploration on upland forest vegetation in northern Alberta (Canada). For. Ecol. Manag. 2017, 400, 278–288. [Google Scholar] [CrossRef]
  36. Human Footprint Inventory Enhanced (HFIe) for the Oil Sands Region: Wall-to-Wall Human Footprint Inventory En-hanced for the Oil Sands Region. Alberta Biodiversity Monitoring Institute and Alberta Human Footprint Monitoring Program: Edmonton, AB. 2019. Available online: https://abmi.ca/home/data-analytics/da-top/da-product-overview/Data-Archive/Land-Cover.html (accessed on 24 March 2021).
  37. Revel, R.D.; Dougherty, T.D.; Downing, D.J. Forest Growth & Revegetation Along Seismic Lines; University of Calgary Press: Calgary, AB, Canada, 1984. Available online: https://www.osti.gov/servlets/purl/6109132 (accessed on 26 February 2021).
  38. Enayetullah, H.; Chasmer, L.; Hopkinson, C.; Thompson, D.; Cobbaert, D. Identifying Conifer Tree vs. Deciduous Shrub and Tree Regeneration Trajectories in a Space-for-Time Boreal Peatland Fire Chronosequence Using Multispectral Lidar. Atmosphere 2022, 13, 112. [Google Scholar] [CrossRef]
  39. Hopkinson, C.; Chasmer, L.; Gynan, C.; Mahoney, C.; Sitar, M. Multisensor and Multispectral LiDAR Characterization and Classification of a Forest Environment. Can. J. Remote Sens. 2016, 42, 501–520. [Google Scholar] [CrossRef]
  40. Chasmer, L.E.; Hopkinson, C.D.; Petrone, R.M.; Sitar, M. Using multitemporal and multispectral airborne lidar to assess depth of peat loss and correspondence with a new active normalized burn ratio for wildfires. Geophys. Res. Lett. 2017, 44, 11–851. [Google Scholar] [CrossRef]
  41. Abib, T.H.; Chasmer, L.; Hopkinson, C.; Mahoney, C.; Rodriguez, L.C. Seismic line impacts on proximal boreal forest and wetland environments in Alberta. Sci. Total Environ. 2019, 658, 1601–1613. [Google Scholar] [CrossRef] [PubMed]
  42. Government of Alberta. Alberta Wetland Classification System. 2015. Available online: https://open.alberta.ca/publications/9781460122587 (accessed on 11 July 2020).
  43. Jolliffe, I.T. Principal Component Analysis: A Beginner’s Guide—I. Introduction and application. Weather 1990, 45, 375–382. [Google Scholar] [CrossRef]
  44. Liu, R.; Kuang, J.; Gong, Q.; Hou, X. Principal component regression analysis with spss. Comput. Methods Programs Biomed. 2002, 71, 141–147. [Google Scholar] [CrossRef]
  45. Gignac, L.D.; Dale, M.R. Effects of size, shape, and edge on vegetation in remnants of the upland boreal mixed-wood forest in agro-environments of Alberta, Canada. Can. J. Bot. 2007, 85, 273–284. [Google Scholar] [CrossRef]
  46. Méndez-Toribio, M.; Meave, J.A.; Zermeño-Hernández, I.; Ibarra-Manríquez, G. Effects of slope aspect and topographic position on environmental variables, disturbance regime and tree community attributes in a seasonal tropical dry forest. J. Veg. Sci. 2016, 27, 1094–1103. [Google Scholar] [CrossRef]
  47. Prévost, M.; Raymond, P. Effect of gap size, aspect and slope on available light and soil temperature after patch-selection cutting in yellow birch–conifer stands, Quebec, Canada. For. Ecol. Manag. 2012, 274, 210–221. [Google Scholar] [CrossRef]
  48. Cruz-Cárdenas, G.; López-Mata, L.; Villaseñor, J.L.; Ortiz, E. Potential species distribution modeling and the use of principal component analysis as predictor variables. Rev. Mex. Biodiversidad. 2014, 85, 189–199. [Google Scholar] [CrossRef]
  49. Jenness, J. Topographic Position Index (tpi_jen.avx) Extension for ArcView 3.x, v. 1.3a. 2006. Jenness Enterprises. Available online: http://www.jennessent.com/arcview/tpi.htm (accessed on 17 November 2021).
  50. Thompson, D.K.; Simpson, B.N.; Beaudoin, A. Using forest structure to predict the distribution of treed boreal peatlands in Canada. For. Ecol. Manag. 2016, 372, 19–27. [Google Scholar] [CrossRef]
  51. Jean, S.A.; Pinno, B.D.; Nielsen, S.E. Early Regeneration Dynamics of Pure Black Spruce and Aspen Forests after Wildfire in Boreal Alberta, Canada. Forests 2020, 11, 333. [Google Scholar] [CrossRef]
  52. Filicetti, A.T.; Nielsen, S.E. Tree regeneration on industrial linear disturbances in treed peatlands is hastened by wildfire and delayed by loss of microtopography. Can. J. For. Res. 2020, 50, 936–945. [Google Scholar] [CrossRef]
  53. Dabros, A.; Higgins, K.L. Vegetation recovery and edge effects of low impact seismic lines over eight-year period in boreal uplands of northern Alberta. For. Ecol. Manag. 2023, 532, 120850. [Google Scholar] [CrossRef]
  54. Coop, J.D.; A Parks, S.; Stevens-Rumann, C.S.; Crausbay, S.D.; Higuera, P.E.; Hurteau, M.D.; Tepley, A.; Whitman, E.; Assal, T.; Collins, B.M.; et al. Wildfire-Driven Forest Conversion in Western North American Landscapes. Bioscience 2020, 70, 659–673. [Google Scholar] [CrossRef] [PubMed]
  55. Whitman, E.; Parisien, M.-A.; Thompson, D.K.; Flannigan, M.D. Short-interval wildfire and drought overwhelm boreal forest resilience. Sci. Rep. 2019, 9, 18796. [Google Scholar] [CrossRef]
  56. Baltzer, J.L.; Day, N.J.; Walker, X.J.; Greene, D.; Mack, M.C.; Alexander, H.D.; Arseneault, D.; Barnes, J.; Bergeron, Y.; Boucher, Y.; et al. Increasing fire and the decline of fire adapted black spruce in the boreal forest. Proc. Natl. Acad. Sci. USA 2021, 118, e2024872118. [Google Scholar] [CrossRef]
  57. Chasmer, L.; Lima, E.M.; Mahoney, C.; Hopkinson, C.; Montgomery, J.; Cobbaert, D. Shrub changes with proximity to anthropogenic disturbance in boreal wetlands determined using bi-temporal airborne lidar in the Oil Sands Region, Alberta Canada. Sci. Total Environ. 2021, 780, 146638. [Google Scholar] [CrossRef]
  58. Echiverri, L.F.I.; Macdonald, S.E.; Nielsen, S.E. Neighboring edges: Interacting edge effects from linear disturbances in treed fens. Appl. Veg. Sci. 2022, 25, e12645. [Google Scholar] [CrossRef]
  59. Benscoter, B.W.; Greenacre, D.; Turetsky, M.R. Wildfire as a key determinant of peatland microtopography. Can. J. For. Res. 2015, 45, 1132–1136. [Google Scholar] [CrossRef]
  60. Holland, P.G.; Steyn, D.G. Vegetational Responses to Latitudinal Variations in Slope Angle and Aspect. J. Biogeogr. 1975, 2, 179. [Google Scholar] [CrossRef]
  61. Davidson, S.J.; Goud, E.M.; Malhotra, A.; Estey, C.O.; Korsah, P.; Strack, M. Linear Disturbances Shift Boreal Peatland Plant Communities Toward Earlier Peak Greenness. J. Geophys. Res. Biogeosci. 2021, 126, e2021JG006403. [Google Scholar] [CrossRef]
  62. Whitman, E.; Parisien, M.-A.; Thompson, D.K.; Flannigan, M.D. Topoedaphic and Forest Controls on Post-Fire Vegetation Assemblies Are Modified by Fire History and Burn Severity in the Northwestern Canadian Boreal Forest. Forests 2018, 9, 151. [Google Scholar] [CrossRef]
Figure 1. Location of lidar survey polygons south of Fort McMurray, Alberta. The peatland–forest complexes within the polygons have been disturbed by industrial land use activities, including petroleum exploration and extraction, infrastructure, and forestry operations (harvesting). Areas that have not been burned recently, according to fire management records (since ~1930) are found in between the fire scars, predominantly between the 1982 and 2002 fires in the western lidar polygon, while the smaller eastern lidar polygon was burned by fires in 1990 and 2015.
Forests 14 01979 g001
Figure 2. Canopy height model for example peatlands found in the burn chronosequence. Upland and transitional areas: (a) 5 years since fire with seismic lines; (b) 18 years since fire with seismic lines; (c) 30 years since fire with seismic lines; (d) 38 years since fire with seismic lines; (e) unburned reference site with seismic lines; (f) unburned reference site without seismic lines. Uplands and transitional areas have taller vegetation, while peatlands fragmented by seismic lines have vegetation height less than 6 m.
Forests 14 01979 g002
Figure 3. Average vegetation height and bog/fen forms found across fire scars and in unburned areas.
Forests 14 01979 g003
Figure 4. Variation in canopy height with distance from seismic lines in bogs determined from randomly located lidar-based height measurements ((ae) for years since fire). Box plots indicate mean line, with interquartile ranges (25th and 75th percentiles) and outliers (5th and 95th percentiles) indicated by whiskers; (f) illustration of canopy height with distance from seismic line for all years since fire, where ribbons represent interquartile range.
Forests 14 01979 g004
Figure 5. Variation in canopy height along with distance from seismic lines in fens, determined from randomly located lidar-based height measurements ((ae) for years since fire). Box plots indicate mean line, with interquartile ranges (25th and 75th percentiles) range and outliers (5th and 95th percentiles) indicated by whiskers; (f) illustration of canopy height against distance from seismic line for all years since fire, where ribbons represent interquartile range.
Forests 14 01979 g005
Figure 6. Plots of scaled peatland explanatory attribute score and arrows of loadings for the first two principal components (PC1 34% and PC2 20% of variance) of PCA for both bogs and fens. The length of their respective arrows illustrates the component loadings of the indices, while individual bogs and fens found in the study area are also included (n = 155). Circles represent strong clustering of bogs and fens that cluster with years since fire.
Forests 14 01979 g006
Table 1. Explanatory variables used in PCA analysis.
Variable DescriptionMechanism/HypothesisRange of Predictor VariableRefer-
Ences
BogsFens
TPI (m) Topographic position index (TPI) from a 2 m DEM by applying a circular search radius: low-lying areas = negative values; upraised = positive values; values near 0 are flatNegative TPI may be an indicator that the ground surface is closer to the top of the water table, which may result in less woody vegetation recovery.−1.3 to 0.7 m−5.6 to 1.7 m[4,49]
Peatland
slope
(degrees)
Average peatland slope calculated using DEMPeatlands with greater sloped surfaces might have a greater growth rate/more tree establishment since fire due to enhanced drainage and overall drier soils.0.3 to 4.1°0.4 to 7.1°[46,50]
Peatland
area (m2)
Peatland area in m2 determined from the peatland manual delineationSmaller peatlands are more vulnerable to disturbance due to proximity to uplands, resulting in greater post-disturbance deciduous shrub growth.2539 to 292,148 m25979 to 137,549 m2[45,51]
Solar
radiation
(Wh m−2)
Incoming solar radiation determined from 2 m DSM of tree heights + elevation over a period of one yearSouth-facing areas and areas adjacent to seismic lines receive more incoming solar radiation compared with north-facing and forested areas, enhancing growth987 to 3466 Wh m−2718 to 3372 Wh m−2[17,20,37,41]
Percent
cover
(%)
Percent cover of trees and shrubs generated using all returns above 0.5 m from all channels Low percent cover is an indicator of open canopies and short vegetation, mosses ≤ 0.5 m, compared with peatlands with higher percent vegetation cover.11 to 91%14 to 92%[22,25,52]
Seismic
line age
(years)
Age of seismic line in years, calculated by subtracting the year the line was installed from the year the lidar data were collectedTaller vegetation found within and adjacent to older seismic lines may be more likely, as these have more time for woody vegetation to establish compared with more recently developed seismic lines with early vegetation succession. 0 to 37 years0 to 37 years[16,35,41,52]
Human-
caused peatland fragment-
ation (%)
Percentage of fragmented peatland area (seismic lines, well pads, trails, and pipelines (from HFI))More fragmented peatlands will have less vegetation recovery as they are flatter and closer to the water table.0 to 16.0%0 to 10.5%[16,19,23,24]
Table 2. Correlation matrix (coefficient of determination (R2)) of the explanatory variables used within peatlands in PCA.
Bog/Fen Area (m2)Seismic Line Age (years)% Area Seismic LinesTPIPeatland SlopeIrradiance (Wh m−2)% Cover
Bog/fen area (m2)1.00------
Seismic line age0.051.00-----
% area seismic lines−0.110.271.00----
TPI0.170.05−0.041.00---
Peatland slope−0.210.06−0.01−0.241.00--
Irradiance (Wh m−2)0.290.250.020.21−0.381.00-
% cover−0.19−0.34−0.07−0.100.20−0.671.00
Disclaimer/Publisher’s Note: The statements, opinions and data contained in all publications are solely those of the individual author(s) and contributor(s) and not of MDPI and/or the editor(s). MDPI and/or the editor(s) disclaim responsibility for any injury to people or property resulting from any ideas, methods, instructions or products referred to in the content.

