Abstract
The purpose of the study is an economic assessment of the effectiveness of agroforestry based on determining the value of ecosystem services of an afforested model land object and extrapolating the data obtained to the territory of the south of the Volga upland with identical natural and economic conditions to the model. The study presents a methodology for the economic assessment of ecosystem goods and services of forested agricultural landscapes based on the modern classification of ecosystem services: CICES. It is established that the economic value of the regional ecosystem product provided by forested lands in the dry steppe is USD 1323 per 1 ha of agroforest landscape per year (price for 2021 on average for 30 years). Of these, regulatory and maintenance services account for 52% of the total economic value, security services—45%, and cultural services—3%. The projected economic value of ecosystem services that will be provided by afforested lands in the south of the Volga upland, the price for 2025, taking into account inflation, is estimated at almost USD 20 million. This value is a sufficient justification for conducting forest reclamation works in the region and providing recommendations for their necessity for small enterprises and farms.
1. Introduction
Recently, the concern about land degradation has increased in international political circles due to the growing attention being given to sustainable development [1]. Usually, soil degradation is defined as a decrease in its quality, covering the physical, chemical, and biological properties [2].
Agroforestry is inextricably linked to land degradation. The scientific data on the role of agroforestry systems as an alternative method of restoring degraded lands in human-dominated landscapes is increasing [3]. Protecting land from degradation and ameliorating the microclimate in severe environmental conditions are the initial goals of the construction of protective forest stands [4,5]. The analysis of the costs associated with land degradation is a very important indicator for agroforestry research, since it is crucial for understanding farmers’ investments in sustainable land management and the formation of appropriate policies in the fields of agriculture and land use [6].
There is an indisputable scientific consensus in the world that protective forest stands effectively prevent land degradation [7,8,9]. At the same time, it should be taken into account that forested lands also have a positive impact on the surrounding area, providing a variety of ecosystem services [10,11,12,13]. The significance of this ecosystem service manifests itself differently at different geospatial scales [14].
At present, the approach to the assessment of ecosystem services has taken the perspective of use value, turned into a monetary valuation, and ended with an exchange value or a commodity [15]. To evaluate these services, the latest international methodologies have been developed (the concept of total economic value (TEV [16]) and stricter classifications (CICES [17]) more than before—in the Millennium Ecosystem Assessment project [18]. The main scientific problem of the international scientific community remains the search for markets for ecosystem services of natural objects [19].
In Russia, agroforestry is primarily associated with solving the problem of land degradation. The reduction in the volume of forest reclamation work and intensive agriculture has led to a significant violation of ecological equality in large agricultural territories, the destruction of natural landscapes, increased degradation and desertification of land, and reduced productivity and sustainability of agricultural landscapes [20]. Despite the recognition in the country of the role of agroforestry in solving these problems, limited attention is paid to its economic assessment in the context of the provision of ecosystem services [21,22,23]. The Volgograd region, which at present is a key region of agricultural production in Russia, is no exception.
The dry-steppe zone of chestnut soils is the largest in the Volgograd region. It accounts for 44% of agricultural land and 42.7% of arable land in the region. The zone of dry steppes within the Volga upland includes the right-bank subzone from the Volga. This includes four important agricultural areas. Over the past few years, an unfavorable environmental situation has been observed in these regions. With the system of dry farming used here, the task of obtaining the maximum number of agricultural products was put to the fore by farmers, which led to an increase in the processes of erosion and soil degradation [24]. The reduction in the already insufficient (three-times less than optimal) protective forest cover of the territory and the deterioration of the reclamation efficiency of forest plantations also contribute to the strengthening of negative trends [25].
In order to weaken and completely stop the processes of degradation and restoration of agricultural ecosystems, primarily soil cover, a program for the agroforestry of arable lands was planned in the region [26]. This program is based on the concept of inexhaustible land use, which creates an optimal regime for the protection of degraded landscapes. Within the framework of this program, the decision-making bodies are planning significant volumes of agroforestry works and large investments aimed at their implementation (about USD 374,000). Our task is to determine the return on these investments in the form of a monetary equivalent of the value, not only of the anti-degradation benefits of protective forest plantations, but also of their other most important ecosystem services under the parameters of the afforestation of the agricultural territory in the south of the Volga upland set by the program.
The main problem of this study is that, in Russia, scientific publications do not yet present a sufficient number of articles on the economic justification of forest reclamation activities on arable land from the position of providing ecosystem goods and services at the expense of forested land, both methodologically and quantitatively. In this regard, it is problematic to predict the existing regional potential of the benefits from the placement of wood components in farm systems and recommend these measures to land users as a strategy for the sustainable management of agricultural resources.
We propose the following hypothesis: if we estimate the actual potential of forest plantations on a model land plot in accordance with specific forest and vegetation conditions with typical bioengineering parameters, then these values can be extrapolated to the rest of the territory subject to afforestation. It is possible to perform this if the size of the field area is determined, which is protected by 1 hectare of forest plantation. The main condition for extrapolation is the absolute observance of the identity of natural, economic, and other conditions. At the same time, the calculations should be based on the concept of ecosystem services of agroforestry; however, they should be carefully methodologically justified, since the calculations of the economic value for some ecosystem services are conducted on the areas of the forest strips themselves, and other ecosystem service calculations are conducted on forested areas.
To date, there is a considerable gap in the methodology of assessing ecosystem services of agroforestry in Russia. Research of this kind is poorly developed, not only in economic but also political documents. Against the background of existing works devoted to the study of large forests [27,28], only a small number of studies on the economic assessment of specific, mainly anti-erosion, advantages of agroforestry [29,30,31] stand out. We also attempt to provide an economic estimation of the ecosystem services of wetlands based on international assessment methodologies [32]. It seems appropriate to conduct similar calculations for afforested land. At the same time, it is important to observe certain methodological, monetary, and other assessment frameworks, since this will allow us to conduct a benchmark analysis of the value of ecosystem services of different natural complexes within the same climatic zone in the future.
Thus, the aim of this work is an economic assessment of the effectiveness of agroforestry based on determining the value of ecosystem services of a forest-covered model land object and extrapolating the data obtained to the territory of the south of the Volga upland with natural and economic conditions identical to the model.
2. Materials and Methods
2.1. Case Study Sites
The Volga upland covers the eastern part of the right bank of the Volga, forming a watershed between the basins of the Volga and Medveditsa rivers. The upland stretches from northeast to southwest along the Volga, occupying the central part of the Volgograd region. By the nature of the relief, the Volga upland is a gently rolling plateau of varying degrees of hilly terrain, cut by ravines and gullies. The Volga upland, touching the Volga, forms two clearly designed terraces: a narrow floodplain terrace and a wide floodplain terrace [33].
The climate in the Volga upland area varies from moderately humid to sharply arid, which is explained by the considerable extent of the upland from north to south. The vegetation and soil cover of the upland is also diverse—in the same direction, there is a change in natural zones—from the forest-steppe zone to the dry-steppe zone [34].
In the southern part of the Volga upland in the dry steppe, the level of annual precipitation varies from 200 to 175 mm. The amplitude of the oscillation between the minimum and maximum temperatures is 5–9 °C. The average sum of air temperature levels higher than 10 °C is 2300–2500 °C. The duration of the frost-free period is 148 days. The hydrothermal coefficient is 0.65.
The dry-steppe zone of the Volga upland belongs to the belopolyn-romashnikovo-cereal subzone. There is a pronounced xerophytic character of plant components and mosaic vegetation cover as a whole. The soil-educational process occurs in conditions of insufficient soil moisture under the cover of mainly perennial herbaceous plants, developing mainly rod roots that travel deep into the subsurface horizons forming few roots in the upper soil horizons [35]. Thus, the soil-forming process also occurs with an insufficient supply of organic material.
2.1.1. Characteristics of the Key Research Areas
Four administrative districts of the Volgograd region are included in the right bank of the Volga in the dry-steppe zone in the south of the Volga upland area [36] (Figure 1).
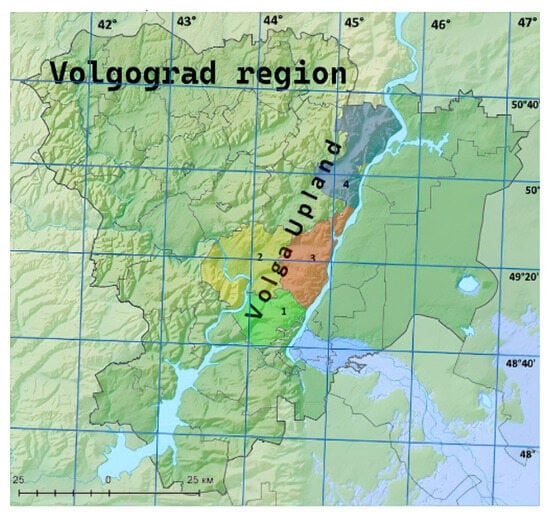
Figure 1.
Administrative districts of the Volgograd region located in the south of the Volga upland (1—Gorodishchensky district, 2—Ilovlinsky district, 3—Dubovsky district, 4—Kamyshensky district).
1. Gorodishchensky district.
The area of agricultural land in the district is 79,095 hectares. Of this, the sown area of arable land is 32,859 hectares. This is almost 9% of all arable land in the Volgograd region. The following agricultural crops are grown in the district: wheat, rye, oats, buckwheat, millet, corn, and sunflower.
2. Ilovlinsky district.
The area of agricultural land in the district is 88,282 hectares. Of this, the sown area of arable land is 15,000 hectares. This is almost 4% of all arable land in the Volgograd region. Wheat, barley, sunflower, and corn are grown in the area.
3. Dubovsky district.
The area of agricultural land in the district is 43,813 hectares. Of this, the sown area of arable land is 17,194 hectares. This is almost 5% of all arable land in the Volgograd region. Agriculture is the main economic activity in the Dubovsky district. The production direction of farms is grain–melon.
4. Kamyshinsky district.
The area of agricultural land in the district is 21,994 hectares. Of this, the sown area of arable land is 7300 hectares. This is almost 2% of all arable land in the Volgograd region. The production direction of farms is grain.
In total, there are 233.184 hectares of agricultural land in the south of the Volga upland. Of these, 31% (72,353 ha) is arable land.
The zonal soils in these administrative districts are chestnut soils. The thickness of horizons A + B1 is 28–42 cm. The humus of the chestnut soils in the Volga upland is 2.4% and gross forms of nutrients N—0.20%, P2O5—0.05%, and K2O—1.7% [37].
Geographically, the administrative research areas were located in the south of the European territory of Russia (Figure 2) and accounted for a fifth of the total agricultural production of the Volgograd region (they occupied almost 20% of the total area in the region) [36].
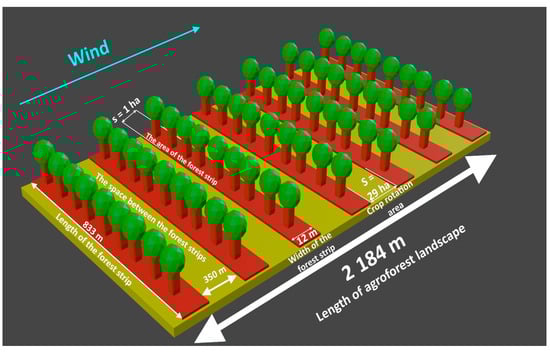
Figure 2.
Bioengineering model of agroforest landscape of the dry-steppe zone in the south of the Volga upland.
2.1.2. Bioengineering Characteristics of the Model Invested Land Plot
For the forest reclamation of the arable land in the Volgograd region, the “Development of protective afforestation in the Volgograd region until 2025” program [26] allowed us to create protective forest stands. When developing the volumes of agroforestry measures, we were guided by the instructions in force in the country for the design and cultivation of protective forest plantations using black locust or false acacia (Robinia pseudoacacia) [38,39,40].
The parameters of the zonal biotechnological model of the forested agricultural landscape developed for the soil-climatic zone of the dry steppe are presented in Appendix A. When developing this model, appropriate literary sources relevant to the subject of the study were used [41,42,43].
In general, the presented model of a forested land plot—agroforestry landscape of a dry-steppe zone with chestnut soils (Figure 2)—had a total area of 181.93 hectares and corresponded to a typical strategy for agroforestry with inter-band spaces of 30 stand heights (Hs) using precocious fast-growing tree species. The model made it possible to estimate the value of ecosystem services of agroforestry per 1 ha of forest strip and to take into account its external effects due to the spatial influence of trees on the adjacent territory. Thus, this model allowed us to calculate how many hectares of crop rotation protected 1 hectare of forest plantations.
This model of the agroforestry landscape was specially developed to apply to the soil-climatic, orographic, and natural economic conditions of the key study areas (Section 2.1.1 and Figure 1); therefore, the interpolation of the obtained unit values over the entire area of these areas was legitimate. Thus, in accordance with the planned volumes of forest reclamation works, the total area of crop rotation, which will be protected by trees, was determined in each of them. Thus, the value of ecosystem services provided not just by trees alone, but by forested lands, was calculated, which seemed more appropriate to us methodically.
At the same time, the assessment is based on obtaining forecast values, since the construction of forest strips is planned for the future—until 2025. For this purpose, the inflation coefficient was taken into account in the calculations [44].
2.2. Data Collection
The monetary valuation of the value of ecosystem services of agroforestry was performed according to the condition of their greatest importance for the recipient region of these services (agriculture and local economies in the Volgograd region).
The sum of the economic value of ecosystem services of agroforestry was its total regional ecosystem product. The equivalent of assessing the ecosystem services included in it were plant resources, cultivated crops, stabilization and control of the erosion rate, air purification, and recreation [17].
The main basic data for the monetary estimate of the provisioning ecosystem services were actual long-term data obtained from the Institute of Agroforestry, Volgograd, Russia.
Thus, as a result of the field research, the actual volume of wood harvested from forest plantations was measured, as well as the volume of additional agricultural products obtained from protected fields.
Wood resources were determined on the basis of the long-term data from scientific reports from the Department of Ecology. The value of these parameters was associated with the volume of wood harvested from protective forest stands as a result of logging and reforestation [45,46].
The cultivated crops were established on the basis of the long-term data from scientific reports from the Department of Economics regarding the additional harvest obtained from protected fields due to the reclamation effect of forest plantations [47].
The main basic data for the monetary assessment of the regulation and maintenance of ecosystem services were calculated data obtained as a result of special calculations based on the secondary literature data concerning the projected losses of the soil layer during wind erosion in forest-protected landscapes [43]. Thus, the nutrient content in a soil layer of 7.5 cm was calculated, which was lost as a result of wind erosion of an average degree per 1 hectare of the field.
In addition, special calculations were performed based on the actual data for the amount of dust filtered out by 1 tree in agroforestry systems per year [48]. Then, this value was multiplied by the total number of trees per 1 hectare of field.
The biophysical parameters of the cultural services provided by forested lands were determined on the basis of the normative data established for the natural and climatic conditions in the studied region [49].
2.3. Data Analyses
2.3.1. Methods Used for the Monetary Valuation of Ecosystem Services Provided by Forested Lands
The economic assessment of ecosystem services of forested arable lands was conducted in accordance with the CICES classification [17] in several stages.
Stage 1. Classification of ecosystem services.
At this stage, potential ecosystem services of the highest importance for the development of the region were identified. We assumed the concept of total economic value, which motivated the valuation of ecosystem benefits of various natural objects [18].
Stage 2. Definition of use values of ecosystem services.
We evaluated the most important ecosystem services of agroforestry plantations from the standpoint of the methodology of an economic assessment: direct and indirect use values (provisioning and cultural ecosystem services and regulation and maintenance ecosystem services, respectively).
Stage 3. Methodology of the economic assessment of ecosystem services.
Having determined the ecosystem services that the study focused on, the generally accepted methods used to assess the value of each of them were identified (Table 1).

Table 1.
Methodology of economic assessments of ecosystem services of afforested arable lands.
Stage 4. Data collection.
Our study used secondary data collection. A literary review of the documents and research reports containing information about the agroforestry landscapes studied as well as scientific articles and publications were used.
Stage 5. Bringing the obtained data to a single international scale of prices.
References of the unit prices are presented in [50,51,52,53,54]. The calculations were conducted in US dollars. When converting the calculated data from the local currency into dollars, the purchasing power parity (PPP) rate as of 2021 was used [55].
2.3.2. Calculation Apparatus of Monetary Valuation of Ecosystem Services in Protective Forest Plantations
The methodology for calculating the value of a regional ecosystem product provided by afforested land had certain prerequisites. Thus, the value of provisioning ecosystem services—timber resources—was evaluated based on the areas located as forest plantations. The estimation of the value of provisioning ecosystem services—cultivated crops—and regulation and maintenance services were conducted in terms of the area located in the zone of influence of protected forest plantations. Cultural service was evaluated based on both of these areas.
Therefore, for the valuation of provisioning ecosystem services—timber resources and cultural services—the area (S1, ha) directly occupied by forest strips was determined:
S1 = 10,000/L × W
In the formula, L—length of the forest strip, meters; W—width of the forest strip, meters; and 10,000—unit of conversion m2 to hectares.
For the assessment of the value of provisioning ecosystem services, cultivated crops, regulation and maintenance services, and cultural services, the area of the zone of spatial protective influence of agroforestry systems (S2, ha) was determined by the following formula:
S2 = L × 30 × H/10,000
In the formula, 30—standard of the range of influence of forest strips [43]; H—the design height of the forest strip (for dry-steppe conditions, it is assumed to be 11–12 m [38]), meters; and 10,000—unit of conversion m2 to hectares.
The regional ecosystem product (REP, USD per year) included provisioning services (PSs), regulation and maintenance services (RMSs), and cultural services (CSs):
REP = PS + RMS + CS
Provisioning services include timber resources (timber, USD per year) and agricultural products (wheat, USD per year):
PS = Timber + Wheat
These indicators are defined as follows:
Timber = (QRoundwood × Pr1 + QFirewood × Pr2)/T
In the formula, QRoundwood—the volume of wood obtained from reforestation logging, m3 per 1 ha of agroforest landscape for the term T; Pr1—market price for roundwood, USD; QFirewood—the volume of wood obtained from sanitary logging, m3 per 1 ha of agroforest landscape for the term T; Pr1—market price for firewood, USD; and T—operational service life of protective forest stands, years.
Wheat = QWheat × Pr3
In the formula, QWheat—growth of gross crop production fees charged due to the reclamation effect of protective forest plantations on protected fields, per year per 1 ha of agroforest landscape; Pr1—market price for the corresponding crop production, USD.
Regulation and maintenance services include the control of erosion rates (Controlerosion, USD per year) and micro- and regional climate regulations (Airclean, USD per year):
RMS = Controlerosion + Airclean
The value of these indicators can be defined as:
Controlerosion = (Qsoilnutrients × Cost1) × Wind
In the formula, Qsoilnutrients—the amount of nutrients contained in one ton of fertile soil mass preserved as a result of the anti-erosion ability of protective forest stands in translation to the active substance, tons per year per 1 ha of agroforest landscape [56]; Cost1—the market value of organic fertilizers (cattle manure), adequate to their compensatory amount, taking into account the purchase price, cost of transportation to the destination, and cost of unloading and fertilizing the soil, USD; and Wind—probability of wind erosion (for the dry-steppe zone, the probability of dust storms of medium intensity is 50% [34]), %.
Airclean = QDust × Cost2
In the formula, QDust—the amount of dust filtered by protective forest stands per year, tons per 1 ha of agroforest landscape; Cost2—the cost of neutralization of suspended substances with a size of 2.5 microns, including all the actual costs of operating the dust-collecting equipment, USD.
Cultural services are measured based on the current permissible recreational loads on natural agroecosystems:
CS = RC × Fee
In the formula, RC—recreational capacity (vacationers), determined on the basis of their weighted average values for three age categories of free-use forests: young, middle-aged and ripe, and ripe and overgrown stands (users per year per 1 ha of agroforest landscape); fee—the payment for people staying in nature parks, USD.
In the economic assessment of ecosystem services of protective forest plantations, the price level on the scale of 2021 for trees that reached the project height was initially used. Then, the time factor was used in the calculations, that is, the procedure for discounting the estimated data was performed in the calculations (r = 2%) [21]. This was due to the fact that the annual value of the effect of protective forest stands was not constant and varied over time—from a zero value, starting from the year of land allocation for protective forest stands, to a positive and increasing value—in subsequent years when the trees reached the design height. Thus, the average lifetime value of ecosystem services of protective forest stands was determined. For the dry-steppe condition, the operational service life for Black Locust was 30 years [48].
For the forecast values, the document used the projected average annual consumer price indices based on the official data from the Ministry of Economic Development of Russia [44].
3. Results
3.1. Monetary Valuation of the Unit Value of Ecosystem Services of Agroforestry on the Model Object of an Agroforestry Landscape
The calculations show that the regional ecosystem product, which includes the total value of all the considered ecosystem services of agroforestry conducted on chestnut soils in the dry-steppe zone in the south of the Volga upland, amounts to USD 1812 per 1 ha of agroforestry landscape per year (Table 2). This cost was calculated for forest stands that already reached the design height. From this, the highest annual economic value was for the ecosystem service, control of erosion rates, almost USD 850 per hectare of afforested land, taking into account the prevention by protective forest plantations of removing the soil layer, on average 7.5 cm, and a 50% probability of wind erosion in the studied natural area. This value confirms the main purpose of protective forest strips—to resist, first of all, the natural elements and protect the soil from degradation. The high value of the ecosystem service, control of erosion rates, is explained by the significant compensatory costs of shifting the fertility of zonal soil lost as a result of wind erosion to the level of non-eroded soil.
Table 2.
Monetary valuation of ecosystem services provided by afforested lands in the dry-steppe zone in the Volga upland (prices for 2021 per 1 ha of agroforest landscape).
The ecosystem service, provisioning, in the equivalent of wood reserves in the form of roundwood had a less significant economic value—USD 587 per year. The calculation was made on the basis of the total wood stocks accumulated by the protective forest stands of Black Locust that reached the design height for the operational service life—an average of 4 m3 per year (the operational life of the stand of this tree species under the accepted conditions was 30 years). The economic value of provisioning in the equivalent of wood in the form of firewood naturally had a cost value 13-times less than the main wood products, which was due to the low quality of the wood obtained from sanitary logging care.
The economic value of the ecosystem provisioning service in the equivalent of cultivated crops (wheat) was almost USD 182 per year. This amount was significant at the local level—for farmers who received it from each hectare of forested land in the dry-steppe zone due to an additional number of cultivated crops in the zone of influence of protective forest plantations.
Of particular importance to the local landscape and economy were regulation and maintenance, in the equivalent of air purification, and cultural services, in the equivalent of recreation. The value of these ecosystem services within the framework of the accepted conditions, respectively, was equal to USD 100 and 51 per year. These ecosystem services of agrolandscapes equipped with protective forest plantations are of great importance for the population of the region. The importance of trees as “green lungs” is well known. In treeless and sparsely wooded areas, being attractive and having the possibility of secondary use, protective forest plantations also represent a significant recreational resource of agricultural territory, both for the local population and for residents in nearby cities.
The value of ecosystem services of agroforestry in average annual (discounted) terms takes into account the period of zero impact for protective forest plantations on fields (in the first years of tree life), which is 37% lower than its annual value (when trees reach their maximum height). Thus, the economic value of ecosystem services significant for the region of protective forest plantations in the dry steppe is USD 1323 per 1 ha of agroforest landscape per year.
In general, regulation and maintenance services provide the greatest contribution to the overall structure of the total economic value of the regional ecosystem product provided by afforested lands—52% (economic value: USD 692.24 per year). In second place is provisioning services—45% (economic value of USD 593.34 per year). Cultural service has the smallest share in the overall structure of the economic value of ecosystem services of protective forest plantations—3% (economic value of USD 37.26 per year) (Figure 3).
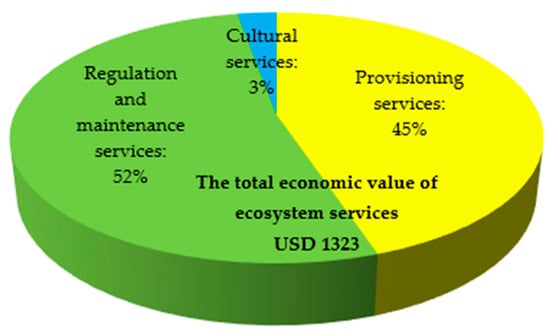
Figure 3.
The overall structure of the average annual value of the regional ecosystem product provided by 1 hectare of forest-equipped agricultural landscape in the dry steppe in the south of the Volga upland at base prices in 2021 (on average for 30 years).
3.2. Extrapolation of a Single Model Value of the Value of Ecosystem Services of Agroforestry to the Study Areas
During the extrapolation procedure, we introduced a mandatory assumption that the soil-climatic, orographic, forest-growing, and natural economic conditions of the afforested crop rotations in the studied areas in the south of the Volga upland fully corresponded to the zonal bioengineering parameters of the model afforested land plot. Thus, the model unit value of the ecosystem services of agroforestry landscapes corresponded to the conditions of a plain (slope curvature up to 2 degrees) with chestnut soils, on which forest stands reached a maximum height of 11–12 m and agricultural production consists of wheat cultivation. The economic value of ecosystem services was extrapolated in the proportion of 1:29, that is, 1 unit of the area of forest strips corresponded to 29 units of the area of the afforested landscape. The resulting area was multiplied by the average annual (discounted) model value of the regional ecosystem product.
The calculations show (Table 3) that, as a result of the implementation of forest reclamation measures planned by the Program for the Development of Protective Afforestation in the Volgograd Region on the arable lands in the studied administrative districts, located in the south of the Volga upland, the estimated economic value of ecosystem services that will begin to provide forested arable lands, starting from the period of tree crowns closing, in 2023 will be slightly higher than USD 18 million. By 2025, the value of ecosystem services of forested lands, adjusted for inflation, will increase by almost USD 1.5 million.
Table 3.
Economic assessment of ecosystem services provided by forested arable lands in the administrative districts in the Volgograd region, located in the south of the Volga upland.
In general, the phased creation of 481 hectares of protective forest plantations per year in the region by 2025 will ensure the total area of afforestation in the dry-steppe zone of the region in the south of the Volga upland by 1443 hectares. These volumes of forest reclamation measures will provide 42,000 hectares of arable land with the protective beneficial effect of trees, which will amount to almost 58% of the total arable area of the studied administrative districts in the region. This will be a significant contribution of the regional program for the development of agroforestry in the Volgograd region to solving the problem of preventing soil degradation and ensuring the sustainability of the agricultural sector.
At the same time, a sufficient justification for the need to implement this program is the projected (for 2025) value of the value equivalent of the regional total ecosystem product provided by forested land to the local community of the region in the amount of USD 20 million per year when the trees reach the design height. Of the total amount, USD 10.379 million will be spent on regulation and maintenance services, USD 8.982 million on provisioning services, and USD 0.599 million on cultural services. It should be noted that the procedure of discounting the maximum annual value of ecosystem services of afforested lands allowed us to obtain the future values.
4. Discussion
Agroforestry describes any land use system, practice, or technology where woody perennial plants are combined with agricultural crops and/or animals within a single land management unit (for example, shelterbelts, alley cropping, and integrated remnant vegetation) [57,58]. In temperate regions, agroforestry systems include many forms; however, linear plantations are recognized as the most important traditional form of agroforestry, primarily performing the functions of protection against erosion and deflation. Modern arable agroforestry deserves the most attention, since it represents a potential solution in the field of land use, which can be both environmentally and economically beneficial [59].
Agroforestry systems provide a variety of ecosystem services that create significant economic value for society [60,61]. Although it is believed that agroforestry is a land use strategy, primarily for developing countries [62], there is a significant amount of research on the effectiveness of agroforestry in relation to developed countries. For example, economic indicators of commodity ecosystem services of agroforestry (biomass production) and non-market ecosystem services and by-products (groundwater, nutrient loss, soil loss, carbon sequestration, and pollination deficiency) were evaluated in European landscapes [63]. In the temperate zone in North America, windbreaks were studied, which contributed to both the profitability of producers and the quality of the environment by increasing crop production [64]. In Canada, environmental and social benefits of windproof forest strips were also assessed [65].
Agroforestry can provide ecosystem services and multi-ecological functions, such as erosion control and the reduction in nutrient losses. However, these environmental benefits from ecosystem services are usually not converted into money and, therefore, are not included in the market value of the most profitable production system using agroforestry [5]. At the same time, it is noted that well-designed agroforestry systems are the preferred type of land use for farmers when environmental benefits are taken into account [59,66].
The measurement of ecosystem services is often a prerequisite for their assessment [67]. After quantifying ecosystem services, the following step is to determine the extent to which these services are valued by the relevant beneficiaries. The assessment of ecosystem services of agroforestry can be conceptualized as a measurement of dividends or “ecosystem income” created by agroforestry systems [68].
The reliability of the data obtained by us was confirmed by their comparison with similar works that presented identical characteristics of the studied natural objects. Unfortunately, we found that a large number of scientific studies were conducted in tropical agroforestry systems; therefore, it was not acceptable to use them as an object of comparison with our values due to the excellent climatic conditions and the environment. Of all the sources studied, the studies conducted in Canada were the closest to the type of agroforestry plantations we studied. Thus, in southern Quebec, ten ecosystem services were evaluated, all of which were of interest and directly applicable to most agricultural systems around the world: nutrient mineralization, water quality, soil quality, pollination, biological control, air quality, protection from wind, provision of wood, provision of agriculture, and the regulation of the climate. The results show a total annual margin of USD 2645 per ha per year (on average over 40 years). At the same time, the economic value of non-market ecosystem services amounted to USD 1634 per ha per year, which was higher than the economic value of marketable products (wood and agricultural products). Our value of ecosystem services was USD 1323 (on average for 30 years), which was very close to the indicated values. In addition, this study also confirmed the evaluation method, which we tested together with its regional features. Thus, the authors extrapolated the result obtained for 1 tree based on the secondary data to all trees with an area of 1 ha and obtained a calculation for 1 ha [69].
Considering the economic costs of each ecosystem service of agroforestry separately, it can be summarized that the available estimates are highly volatile. They both exceed the data we obtained and are cheaper than them. For example, the value of the air quality service, which is presented in the literature, in the temperate zone was USD 462 ha−1 year−1 (our estimate was equal to USD 100.50 ha−1 year−1) [70]. The value of the timber provision service was USD 140 ha−1 year−1 and the agriculture provision services was USD 7849 ha−1 year−1 (our estimates were equal, respectively, USD 587.24 и USD 181.5 ha−1 year−1) [71]. These differences were minor and explained by the regional peculiarities and price policies of the countries under consideration. The range of modern estimates of the values of ecosystem services of agroforestry plantations presented in the literature also allowed for more significant discrepancies in the estimated values, which was due to the different methodological aspects of the assessment. Thus, taking into account the minimum, average, and maximum values from the available data on the categories of ecosystem services of agroforestry, the values were obtained from USD 2 ha−1 year−1 to USD 35,108 ha−1 year−1 (average value: USD 2883 ha−1 year−1). This was due to the fact that each specific case was unique and the evaluation results depended not only on the chosen evaluation method, but also on a certain point of view [72].
The need for agriculture in the Volgograd region for ecosystem services of agroforestry in the south of the Volga upland is felt quite strongly, since the agricultural production of the region is concentrated here. Agroforestry systems are particularly effective, with the ability of trees to mitigate the possible effects of climate change [73]. Quantitatively, this is manifested in a decrease in soil losses and crop death during the manifestation of dust storms and abnormal droughts [74].
The cost–benefit analysis shows that agroforestry systems are more efficient than conventional agricultural land use practices. Thus, based on the estimates of farmers and experts, the costs and benefits were calculated, which showed that the two studied agroforestry systems had 1.5–2-times-higher net present values and benefit–cost (B/C) ratios than two interchangeable cultivation systems [75]. At the same time, it was found that taking into account the anti-erosion advantages of agroforestry increases the B/C ratio more than 3 times compared with its commercial margin alone [76].
5. Conclusions
Thus, the conducted studies confirm the feasibility of implementing a program of afforestation of the agricultural territory in the south of the Volga upland. In the foreseeable future, agroforest landscapes will be able to provide important ecosystem services to agriculture and residents in the region. The projected cost of these services will be at least USD 20 million a year, while for every dollar invested there will be a USD 53 return in the form of the most important ecosystem services of forested lands. Furthermore, their value will increase, taking into account the inflationary fluctuations in the country.
This study complements the few available estimates of the value of market and non-market advantages of forested land in a temperate climate. It also provides a basis for quantifying and monetizing ecosystem services of agroforestry in similar natural and economic conditions for other regions in the country. However, in the context of Russia, the management of agroforestry systems still needs to be optimized in order to make it more profitable for farmers than traditional agriculture, as is already observed in developed countries in the world.
The ecosystem values presented in this study can form some of the initial data for determining the potential changes in ecosystem services as a result of land use changes through agroforestry measures and other policy decisions. The results obtained can also be useful for determining regional priorities for investing in natural objects of agricultural landscapes. The practical policy implications that can be drawn from this work, although very specific, are at the same time common to the political issues, regardless of the main area. At the same time, the main limitation of this study should be taken into account in the form of the presence of more than one approach to the monetary assessment of the value of the ecosystem services in question, each of which can produce a different value.
Future work should focus on other natural areas, as well as on the development of a software application for automating the calculations of the economic value of a regional ecosystem product.
Funding
The article was written as part of the fulfillment of the state task of the Russian Ministry of Education and Science No. FNFE-2022-0015 to the Federal Scientific Center of Agro-ecology, Complex Melioration and Protective Afforestation Russian Academy of Sciences.
Data Availability Statement
Data available on request.
Conflicts of Interest
The authors declare no conflict of interest.
Appendix A
The main parameters of the zonal biotechnological model of the forested agricultural landscape in the dry-steppe zone are as follows:
1. Protective forest strips are created on arable land with a steepness of up to 2 degrees. They are divided into main (longitudinal) and auxiliary (transverse) forest strips. The main traffic lanes are always located parallel to each other, perpendicular to the direction of the most harmful winds prevailing in this area.
2. The zonal soils of the dry steppe are chestnut soils. In accordance with this type of soil, all the main biotechnological parameters of the agroforestry landscape are selected: length, width of protective forest stands, and inter-lane space.
3. When choosing agricultural crop rotations, they proceed from the criterion of their optimization, based on the maximum values of the productivity indicator. Winter wheat has the best indicator in the dry steppe for pure and saturated steam [41].
4. When determining the assortment of tree and shrub species, first of all, forest-growing and orographic conditions are taken into account. So, for the flat land in the dry steppe, it is recommended to plant clean stands of false acacia for the afforestation of arable land [42].
5. The height of the forest strip is an integral indicator of the windproof effect, which determines the width of the aisles. This is determined by the forest-growing conditions in natural zones, planting density, composition and age of tree species, their placement, and agrotechnics of cultivation. The protective height refers to the height of the part of the forest belt that provides direct resistance to the wind flow. In the dry steppe on chestnut soils, the design height of protective forest stands is about 11–12 m [38].
6. In accordance with the regulatory documents, the maximum permissible distances between the main protective forest stands are calculated from the condition of the effective range of their impact. Typical distance parameters are 30 heights (Hs) of forest stands [43]. Consequently, the distance between traffic lanes in the studied areas is no more than 350 m.
7. The main protective forest strips are created, as a rule, from three rows. The width of the aisles in the dry steppe is 4 m. The width of the edges on each side of the forest strip is equal to half the width of the aisle. The distance between plants in rows when planting seedlings and rooted cuttings is 1.0–1.5 m [40]. Thus, the total width of the protective forest strips is 12 m. At the same time, the length of these plantings per 1 hectare of area occupied by forest plantations is 833 m.
8. To increase the effectiveness of protective forest stands, a moderately openwork structure with a wind permeability of 30%–40% is recommended as the most effective for protecting soils from destruction by wind [43].
9. The total number of trees per 1 hectare of afforested agricultural landscape with specified bioengineering parameters of its zonal model is 3300.
References
- Adhikari, B.; Nadella, K. Ecological economics of soil erosion: A review of the current state of knowledge in Ecological Economics Reviews. Ann. N. Y. Acad. Sci. 2011, 1219, 134–152. [Google Scholar] [CrossRef] [PubMed]
- Eaton, D. The Economics of Soil Erosion: A Model of Farm Decision-Making. Discussion Paper 96–01; Environmental Economics Programme; International Institute for Environment and Development: London, UK, 1996. [Google Scholar]
- Cai, Z.; Aguilar, F.X. Economic Valuation of Agroforestry Ecosystem Services in Agroforestry and Ecosystem Services. In Agroforestry and Ecosystem Services; Udawatta, R.P., Jose, S., Eds.; Springer: Berlin/Heidelberg, Germany, 2021; pp. 477–494. [Google Scholar]
- Zheng, X.; Zhu, J.; Xing, Z. Assessment of the effects of shelterbelts on crop yields at the regional scale in Northeast China. Agric. Syst. 2016, 143, 49–60. [Google Scholar] [CrossRef]
- Torralba, M.; Fagerholm, N.; Burgess, P.J.; Moreno, G.; Plieninger, T. Do European agroforestry systems enhance biodiversity and ecosystem services? A meta-analysis. Agric. Ecosyst. Environ. 2016, 230, 150–161. [Google Scholar]
- Hein, L. Assessing the costs of land degradation: A case study for the Puentes Catchment, Southeast Spain. Land Degrad. Dev. 2007, 18, 631–642. [Google Scholar] [CrossRef]
- Jacobson, M.; Kar, S. Extent of Agroforestry Extension Programs in the United States. J. Ext. 2013, 51, 31. [Google Scholar] [CrossRef]
- Jinger, D.; Kumar, R.; Kakade, V.; Dinesh, D.; Singh, G.; Pande, V.C.; Bhatnagar, P.R.; Rao, B.K.; Vishwakarma, A.K.; Kumar, D.; et al. Agroforestry for controlling soil erosion and enhancing system productivity in ravine lands of Western India under climate change scenario. Environ. Monit. Assess. 2022, 194, 267. [Google Scholar] [CrossRef] [PubMed]
- Dollinger, J.; Jose, S. Agroforestry for soil health. Agrofor. Syst. 2018, 92, 213–219. [Google Scholar] [CrossRef]
- Zomer, R.J.; Trabuco, A.; Coe, R.; Place, F.; Noordwijk, M.; Xu, J. Trees on Farms: An Update and Reanalysis of Agroforestry’s Global Extent and Socio-Ecological Characteristics; Working Paper 179; World Agroforestry Centre (ICRAF) Southeast Asia Regional Program: Bogor, Indonesia, 2014. [Google Scholar]
- Fagerholm, N.; Torralba, M.; Burgess, P.J.; Plieninger, T. A systematic map of ecosystem services assessments around European agroforestry. Ecol. Ind. 2016, 62, 47–65. [Google Scholar] [CrossRef]
- Basu, J.P. Agroforestry, climate change mitigation and livelihood security in India. N. Z. J. For. Sci. 2014, 44, S11. [Google Scholar] [CrossRef]
- Nichols, J.D.; Lee, S.M.; Reid, R.; Grant, J.C. Ecosystem services from agroforestry systems in Australia. In Agroforestry and Ecosystem Services; Udawatta, R.P., Jose, S., Eds.; Springer: Cham, Switzerland, 2021. [Google Scholar] [CrossRef]
- Jose, S. Agroforestry for ecosystem services and environmental benefits: An overview. Agrofor. Syst. 2009, 76, 1–10. [Google Scholar] [CrossRef]
- Costanza, R.; de Groot, R.; Braat, L.; Kubiszewski, I.; Fioramonti, L.; Sutton, P.; Farber, S.; Grasso, M. Twenty years of ecosystem services: How far have we come and how far do we still need to go? Ecosyst. Serv. 2017, 28, 1–16. [Google Scholar] [CrossRef]
- Pascual, U.; Muradian, R.; Brander, L.; Gómez-Baggethun, E.; Martín-López, B.; Verma, M.; Armsworth, P.; Christie, M.; Cornelissen, H.; Eppink, F. The economics of valuing ecosystem services and biodiversity. In The Economics of Ecosystems and Biodiversity: Ecological and Economic Foundations; Taylor and Francis: London, UK, 2010; pp. 183–256. [Google Scholar]
- Haines-Young, R.; Potschin, M.B. Common International Classification of Ecosystem Services (CICES) V5.1 and Guidance on the Application of the Revised Structure; Barton in Fabis: Nottingham, UK, 2018; Available online: https://cices.eu/content/uploads/sites/8/2018/01/Guidance-V51-01012018.pdf (accessed on 10 May 2023).
- World Resources Institute. Millennium Ecosystem Assessment Ecosystems and Human Well-Being: Biodiversity Synthesis; World Resources Institute: Washington, DC, USA, 2005. [Google Scholar]
- Gómez-Baggethun, E.; de Groot, R.; Lomas, P.L.; Montes, C. The history of ecosystem services in economic theory and practice: From early notions to markets and payment schemes. Ecol. Econ. 2010, 6, 1209–1218. [Google Scholar]
- Federal State Budgetary Scientific Institution “Rosinformagrotech”. Report on the State and Use of Agricultural Land of the Russian Federation in 2021; Federal State Budgetary Scientific Institution “Rosinformagrotech”: Moscow, Russia, 2022. [Google Scholar]
- Korneeva, E.A. Efficiency of financing of forest reclamation measures for ensuring sustainable development of agricultural regions in the South of the European territory of Russia. Econ. Reg. 2020, 16, 871–883. [Google Scholar] [CrossRef]
- Manaenkov, A.S.; Korneeva, E.A. Biogeographic aspects of assessing the effectiveness of protection of arable land by forest strips. Vestn. Mosk. Universiteta. Seriya 5 Geografiya. 2021, 3, 48–54. [Google Scholar]
- Manaenkov, A.S. Forest Reclamation of Arid Zone Arenas, 2nd ed.; Publishing House of the Federal Research Center of Agroecology of the Russian Academy of Sciences: Volgograd, Russia, 2018. [Google Scholar]
- Press Committee. The System of Conducting Agro-Industrial Production in the Volgograd Region; Press Committee: Volgograd, Russia, 1997. [Google Scholar]
- Kulik, K.N. Protective forest plantations are the basis of the ecological framework of agricultural territories. Vestn. Russ. Agric. Sci. 2018, 1, 18–21. [Google Scholar]
- Federal State Budgetary Scientific Institution of Agroecology of the Russian Academy of Sciences. The Program “Development of Protective Afforestation in the Volgograd Region until 2025”; Federal State Budgetary Scientific Institution of Agroecology of the Russian Academy of Sciences: Volgograd, Russia, 2020. [Google Scholar]
- Chernyavskikh, V.; Dumacheva, E.; Lisetskii, F. Invasive activity of Galega orientalis Lam. in the presence of deposits in the southwestern part of the Central Russian Upland. Int. J. Environ. Stud. 2021, 79, 1089–1098. [Google Scholar] [CrossRef]
- Cherniavskih, V.I.; Dumacheva, E.V.; Shchedrina, J.E.; Golovkov, A.V. Experience in Creating Artificial Forest Plants in the Territory of Belgorod Region. In Proceedings of the IOP Conference Series Earth and Environmental Science, Moscow, Russia, 17–20 June 2021; p. 012057. [Google Scholar]
- Korneeva, E.A. Resource-saving efficiency of agroforestry in areas prone to deflation and desertification. Res. Crops 2023, 24, 341–345. [Google Scholar]
- Korneeva, E.A. Role of agroforestry in increasing the economic fertility of arable lands in arid regions. Res. Crops 2023, 24, 373–377. [Google Scholar]
- Manaenkov, A.S.; Korneeva, E.A. Ecological and economic efficiency of forest reclamation of agricultural lands of the Lower Volga region. Proc. Nizhnevolzhsky Agrouniversitetskiy Complex Sci. High. Prof. Educ. 2014, 4, 194–198. [Google Scholar]
- Belyaev, A.I.; Pugacheva, A.M.; Korneeva, E.A. Assessment of Ecosystem Services of Wetlands of the Volga–Akhtuba Floodplain. Sustainability 2022, 14, 11240. [Google Scholar] [CrossRef]
- Kolos. Natural and Agricultural Zoning of the USSR Land Fund; Kolos: Moscow, Russia, 1985. [Google Scholar]
- Sazhin, A.N.; Kulik, K.N.; Vasiliev, Y.I. Weather and Climate of the Volgograd Region; All-Russian Research Institute of Agroforestry: Volgograd, Russia, 2010. [Google Scholar]
- Pugacheva, A.M. The influence of homogeneous stands on the recovery of secondary virgin landsin agroforestry landscapes of dry steppes. Biol. Bull. 2021, 2, 184–192. [Google Scholar]
- Agricultural Portal. Available online: https://сельхoзпoртал.рф/analiz-posevnyh-ploshhadej/?region_id=2208&area=2®ion_child_id=3266 (accessed on 1 May 2023).
- Dobrovolsky, V.V. Geography of Soils with the Basics of Soil Science; Prosveshchenie: Moscow, Russia, 1967. [Google Scholar]
- Kolos. Instructional Instructions on the Agroforestry Arrangement of Protective Forest Plantations on the Lands of Agricultural Enterprises; Kolos: Moscow, Russia, 1983. [Google Scholar]
- Russian Agricultural Academy. Standards for the Formation of Optimal Forest Reclamation Complexes on Arable Land Taking into Account the Factors of Degradation of Agricultural Landscapes in Farms of Different Ownership Forms; Russian Agricultural Academy: Moscow, Russia, 2002. [Google Scholar]
- Federal Forestry Service of Russia. Guidelines for Reforestation and Afforestation in the Forest-Steppe, Steppe, Dry-Steppe and Semi-Desert Zones of the European Part of the Russian Federation; Federal Forestry Service of Russia: Moscow, Russia, 1994. [Google Scholar]
- Niva. Adaptive Landscape Farming System of the Volgograd Region until 2015; Niva: Volgograd, Russia, 2009. [Google Scholar]
- Mattis, G.J.; Pavlovsky, E.S.; Kalashnikov, A.F. Handbook of Agroforestry; Lesnaya Promyshlennost: Moscow, Russia, 1984. [Google Scholar]
- Dolgilevich, M.I.; Vasiliev, Y.I.; Sazhin, A.N. Windbreak Systems and Wind Erosion; Lesnaya Promyshlennost: Moscow, Russia, 1981. [Google Scholar]
- Forecast of Socio-Economic Development of the Russian Federation for 2023 and for the Planning Period of 2024 and 2025. 2023. Available online: https://www.economy.gov.ru/material/directions/makroec/prognozy_socialno_ekonomicheskogo_razvitiya/prognoz_socialno_ekonomicheskogo_razvitiya_rossiyskoy_federacii_na_2023_god_i_na_planovyy_period_2024_i_2025_godov.html (accessed on 29 May 2023).
- Pavlovsky, E.S.; Kravtsov, V.V.; Chernyavskaya, T.A. Raw materials of protective forest plantations and possible ways of their use. In Productivity of Ecosystems of Forest-Agrarian Landscapes; Pavlovsky, E.S., Ed.; All-Russian Research Institute of Agroforestry: Volgograd, Russia, 1988; pp. 47–59. [Google Scholar]
- Kravtsov, V.V. Sorting structure of wood stocks of forest strips. In Issues of Economic Assessment of Protective Forest Plantations Optimized for Productivity and Soil Protection Role; Pavlovsky, E.S., Ed.; All-Russian Research Institute of Agroforestry: Volgograd, Russia, 1990; pp. 41–44. [Google Scholar]
- Tribunskaya, V.M.; Kuzmina, T.S. Norms of Crop Increases of the Most Important Agricultural Crops from the Meliorative Influence of Protective Forest Strips; Publishing House of the Ministry of Agriculture of the USSR: Moscow, Russia, 1984. [Google Scholar]
- Mukha, T.P. The influence of forest strips on reducing the dustiness of atmospheric air in agricultural landscapes. In Protective Afforestation and Its Effectiveness; Stepanov, A.M., Ed.; All-Russian Research Institute of Agroforestry: Volgograd, Russia, 1990; pp. 104–108. [Google Scholar]
- Ivonin, V.M.; Voskoboynikova, I.V. Recreational Forest Management; Direct-Media: Moscow, Russia, 2020. [Google Scholar]
- The First Timber Industry Portal “Forest Exchange”. Available online: https://www.wood.ru/ru/index.php3?pag=board&sbi=0 (accessed on 21 May 2023).
- The Official Portal of the Grain and Flour Market of Russia and the Union of Independent States “Zerno.ru”. Available online: https://zerno.ru/node/17544 (accessed on 21 May 2023).
- The Official Trading Platform of Fertilizers “Volgsnab”. Available online: http://volgograd.rcnab.ru/navoz/ (accessed on 21 May 2023).
- Decree of the Government of the Russian Federation of 11.09.2020 No. 1393 «Rates of Payment for Negative Impact on the Environment». 2020. Available online: http://publication.pravo.gov.ru/Document/View/0001202009160021 (accessed on 21 May 2023).
- Draft Resolution of the Volgograd Region Administration Dated September 18, 2020 “On the Determination of Fees for Individuals Who Do Not Live in Settlements Located within the Boundaries of Specially Protected Natural Territories for Visiting Specially Protected Natural Territories of Regional Significance”. Available online: https://buhpressa.ru/dlya-bukhgaltera/normativnye-dokumenty/196-regionalnye-organy-vlasti/8604-proekt-postanovleniya-administratsii-volgogradskoj-oblasti-ot-18-sentyabrya-2020-g-ob-opredelenii-platy-dlya-fizicheskikh-lits-za-poseshchenie-osobo-okhranyaemykh-prirodnykh-territorij-regionalnogo-znacheniya (accessed on 29 May 2023).
- OECD Purchasing Power Parities (PPP) (Indicator). 2023. [CrossRef]
- Korneeva, E.A. Evaluation of Environmental Damage Associated with Desertification of Arid Territories on the South of European Russia. Arid. Ecosyst. 2023, 13, 59–64. [Google Scholar] [CrossRef]
- Manaenkov, A.S.; Podgaetskaya, P.M.; Podgaetsky, M.E. Specific features of the growth of few-row forests belts on chestnut soils. Vestn. Mosk. Univ. Seriya 5 Geografiya 2022, 3, 134–142. [Google Scholar]
- Reid, R.; Wilson, G. Agroforestry in Australia and New Zealand; Goddard and Dobson: Box Hill, Australia, 1985. [Google Scholar]
- Palma, J.; Graves, A.R.; Burgess, P.J.; van der Werf, W.; Herzog, F. Integrating environmental and economic performance to assess modern silvoarable agroforestry in Europe. Ecol. Econ. 2007, 63, 759–767. [Google Scholar] [CrossRef]
- Castle, S.E.; Miller, D.C.; Merten, N.; Ordonez, P.J.; Baylis, K. Evidence for the impacts of agroforestry on ecosystem services and human well-being in high-income countries: A systematic map. Environ. Evid. 2022, 11, 10. [Google Scholar]
- van Noordwijk, M. Agroforestry-Based Ecosystem Services. Land 2021, 10, 770. [Google Scholar] [CrossRef]
- Miller, D.C.; Ordoñez, P.J.; Brown, S.E.; Forrest, S.; Nava, N.J.; Hughes, K.; Baylis, K. The impacts of agroforestry on agricultural productivity, ecosystem services, and human well-being in low-and middle-income countries: An evidence and gap map. Campbell Syst Rev. 2020, 16, e1066. [Google Scholar] [CrossRef]
- Kay, М.; Graves, A.; Palma, J.H.N.; Moreno, G.; Roces-Díaz, J.V.; Aviron, S.; Chouvardas, D.; Crous-Duran, J.; Ferreiro-Domínguez, N.; de Jalón, S.G.; et al. Agroforestry is paying off—Economic evaluation of ecosystem services in European landscapes with and without agroforestry systems. Ecosyst. Serv. 2019, 36, 100896. [Google Scholar]
- Brandle, J.R.; Hodges, L.; Zhou, X.H. Windbreaks in North American agricultural systems. Agrofor. Syst. 2004, 61, 65–78. [Google Scholar]
- Kulshreshtha, S.; Kort, J. External economic benefits and social goods from prairie shelterbelts. Agrofor. Syst. 2009, 75, 39–47. [Google Scholar] [CrossRef]
- Manaenkov, A.C. Approaches to Improving the State of the Shelterbelts in the Northern Caucasus. Russ. J. For. Sci. 2023, 4, 1–15. [Google Scholar]
- Alkemade, R.; Burkhard, B.; Crossman, N.D.; Nedkov, S.; Petz, K. Quantifying ecosystem services and indicators for science, policy and practice. Ecol. Indic. 2014, 37, 161–162. [Google Scholar] [CrossRef]
- Fenichel, E.P.; Abbott, J.K.; Yun, S.D. Chapter 3—The nature of natural capital and ecosystem income. In Handbook of Environmental Economics; Dasgupta, P., Pattanayak, S.K., Smith, V.K., Eds.; Elsevier: Amsterdam, The Netherlands, 2018; Volume 4, pp. 85–142. [Google Scholar]
- Alam, M.; Olivier, A.; Paquette, A.; Dupras, J.; Revéret, J.P.; Messier, C. A general framework for the quantification and valuation of ecosystem services of tree-based intercropping systems. Agrofor. Syst. 2014, 88, 679–691. [Google Scholar] [CrossRef]
- Wilson, S.J. Ontario’s Wealth, Canada’s Future: Appre-Ciating the Value of the Greenbelt’s Eco-Services. David Suzuki Foundation, Vancouver. 2008. Available online: https://docs.yandex.ru/docs/view?tm=1695369928&tld=ru&lang=en&name=ontario-wealth-canada-future-value-greenbelt-eco-services.pdf&text=70.%20W%20ilson%2C%20S.J.%20Ontario’s%20wealth%2C%20Canada’s%20future%3A%20Appre-ciating%20the%20value%20of%20the%20greenbelt’s%20eco-services.%20David%20Suzuki%20Foundation%2C%20Vancouver%2C%202008.&url=https%3A%2F%2Fdavidsuzuki.org%2Fwp-content%2Fuploads%2F2018%2F02%2Fontario-wealth-canada-future-value-greenbelt-eco-services.pdf&lr=38&mime=pdf&l10n=ru&sign=2226f354fd36f03043f2d69ab212b200&keyno=0&nosw=1&serpParams=tm%3D1695369928%26tld%3Dru%26lang%3Den%26name%3Dontario-wealth-canada-future-value-greenbelt-eco-services.pdf%26text%3D70.%2BW%2Bilson%252C%2BS.J.%2BOntario%25E2%2580%2599s%2Bwealth%252C%2BCanada%25E2%2580%2599s%2Bfuture%253A%2BAppre-ciating%2Bthe%2Bvalue%2Bof%2Bthe%2Bgreenbelt%25E2%2580%2599s%2Beco-services.%2BDavid%2BSuzuki%2BFoundation%252C%2BVancouver%252C%2B2008.%26url%3Dhttps%253A%2F%2Fdavidsuzuki.org%2Fwp-content%2Fuploads%2F2018%2F02%2Fontario-wealth-canada-future-value-greenbelt-eco-services.pdf%26lr%3D38%26mime%3Dpdf%26l10n%3Dru%26sign%3D2226f354fd36f03043f2d69ab212b200%26keyno%3D0%26nosw%3D1 (accessed on 9 August 2023).
- Toor, I.A.; Smith, E.G.; Whalen, J.K.; Naseem, A. Tree-based intercropping in Southern Ontario, Canada. Can. J. Agric. Econ. 2012, 60, 141–154. [Google Scholar] [CrossRef]
- Brondízio, E.S.; Gatzweiler, F.W.; Zografos, C.; Kumar, M. The Socio-cultural Context of Ecosystem and Biodiversity Valuation: Chapter 4. In The Economics of Ecosystems and Biodiversity: Ecological and Economic Foundations; Kumar, P., Ed.; Routledge: New York, NY, USA, 2012; pp. 149–181. [Google Scholar]
- Young, A. Agroforestry for Soil Conservation; CTA: Wageningen, The Netherlands, 1995. [Google Scholar]
- Sahoo, S.; Lenka, B.; Raj, A.; Jhariya, M. Climate Change Impacts and Mitigation through Sustainable Agroforestry Practices; Prasad, R., Jhariya, M., Banerjee, A., Eds.; Advances in Sustainable Development and Management of Environmental and Natural Resources; Economic Outlook and Opinions; Apple Academic Press Inc.: Cambridge, MA, USA, 2021; Volume 1, pp. 265–308. [Google Scholar]
- Rahman, S.A.; Jacobsen, J.B.; Healey, J.; Roshetko, J.M.; Sunderland, T. Finding alternatives to swidden agriculture: Does agroforestry improve livelihood options and reduce pressure on existing forest? Agrofor. Syst. 2017, 91, 185–199. [Google Scholar] [CrossRef]
- Manaenkov, A.S.; Korneeva, E.A. Evaluation of the effectiveness of forest reclamation of arable lands of the Lower Volga region, subject to deflation. Proc. Nizhnevolzhsky Agrouniversitetskiy Complex Sci. High. Prof. Educ. 2012, 4, 41–46. [Google Scholar]
Disclaimer/Publisher’s Note: The statements, opinions and data contained in all publications are solely those of the individual author(s) and contributor(s) and not of MDPI and/or the editor(s). MDPI and/or the editor(s) disclaim responsibility for any injury to people or property resulting from any ideas, methods, instructions or products referred to in the content. |
© 2023 by the author. Licensee MDPI, Basel, Switzerland. This article is an open access article distributed under the terms and conditions of the Creative Commons Attribution (CC BY) license (https://creativecommons.org/licenses/by/4.0/).