Article

Forest Resource Quality and Human Activity Intensity Change and Spatial Autocorrelation Analysis in Yulin City, China

1
Ecology and Nature Conservation Institute, and the Key Laboratory of Forest Ecology and Environment of National Forestry and Grassland Administration, Chinese Academy of Forestry, Beijing 100091, China
2
Development Research Center, National Forestry and Grassland Administration, Beijing 100083, China
3
School of Economics and Management, Beijing Forestry University, Beijing 100714, China
*
Author to whom correspondence should be addressed.
These authors contributed equally to this work.
Forests 2023, 14(10), 1929; https://doi.org/10.3390/f14101929
Submission received: 25 July 2023 / Revised: 31 August 2023 / Accepted: 19 September 2023 / Published: 22 September 2023
(This article belongs to the Special Issue Changes in the Value of Forest Resources: Impacts of Human Activities)

Abstract

:
With the rapid development of society and the economy, human activities are increasing, which often brings potential threats such as a decline in forest resource quality and ecological function. In order to investigate the change in forest resource quality and human activity intensity, this study constructed a calculation model for a forest resource quality index and a human activity intensity index and conducted a quantitative analysis of the temporal and spatial changes in forest resource quality and human activity intensity in Yulin City based on sub-compartment data in 2017 and 2020. By combining spatial autocorrelation analysis, the changes in human activity intensity and spatial forest resource quality were explored, and key areas such as the prominent contradictions between humans and the land were superimposed and coupled as potential areas of concern. The results show the following: From 2017 to 2020, the forest resource quality in Yulin City improved as a whole, especially in Zizhou County, but there were increases and decreases in other regions. Human activity intensity increased as a whole, and the most obvious increase was in Hengshan District. Both the forest resource quality and human activity intensity indexes had spatial aggregation, the differences in forest resource quality between regions were reduced, and human activity intensity showed a trend towards aggregated development. The high–high cluster area for human activity intensity showed a decreasing trend, but it expanded outward in urban areas and other human-gathering areas, such as the surrounding area of Yulin City, Jingbian County, and Shenmu City. The high–high cluster area for forest resource quality showed a shrinking trend. Four specific regions were identified through a spatial coupled superposition analysis to reveal the dynamic relationship between forest resource quality and human activity intensity. The most obvious region was the Yuyang District, where the forest resource quality improved because of a reduction in the pressure of human activities on the natural environment.

1. Introduction

Humans and nature comprise a coupled system. Healthy forests are essential for human life because forests and their dynamic changes not only provide food and energy but also play a decisive role in preventing soil erosion, protecting biodiversity, and mitigating climate warming [1]. With the rapid development of cities, human activities pose a serious threat to forest resources. The irrational use of forest resources and the overexploitation of land can result in exceeding the carrying capacity of forest ecosystems and can cause negative impacts on forest resource quality to various degrees. Research indicates that one-third of the world’s nature reserves face significant pressure due to anthropogenic activities [2,3]. A total of 35.1% of the global forest structure has changed due to human factors [4]. Human activities have different degrees of influence on the extension, density, structure, species composition, and ecosystem of forests in different areas, and forest resource quality has also changed due to this influence [5,6].
Forest resources are the basic material of forestry production, so forest resource quality directly impacts forestry production and the multiple benefits of forest resources. Forest resource quality assessment can accurately understand the quality status of forest resources and provide a basis for effectively improving forest resource quality and forest management. Based on the isoperimetric theorem and isoperimetric theory, Zhang et al. (2023) attempted to propose different uniformity indicators and normalized them to positive values. The radius and central angle of each sector within the unit circle represented the value and weight of each indicator, creating a more versatile evaluation function that provided a reference for diagnosis and precise improvement of forest resource quality problems [7]. Fernando et al. (2014) used the Riparian Forest Evaluation (RFV) index to assess forest spatial continuity (in its three core dimensions: longitudinal, transversal, and vertical) and forest regeneration capacity and clarified the quality and extent of changes in riparian forests, providing a basis for strengthening the protection and management of riparian forests [8]. Based on the regional characteristics of forest resources and the needs of sustainable forest management, Wu et al. (2010) established a forest resource quality evaluation index system and a BP neural network for forest resource quality assessment and evaluated the forest resources in Hubei Province, China [9]. By referring to and analyzing forest quality indicators from domestic and foreign experts and institutions, Cao et al. (2023) constructed a concept and model of forest growth potential and calculated the forest growth potential based on the data of 110,000 forest resource sub-areas in Lin’an and Landsat 8 remote sensing data [10]. They also discussed a forest resource quality improvement program in the subregion to provide guidance for accurately improving forest resource quality and forest management [10]. In summary, forest resource quality assessment is of great significance for understanding the status of forest resources and improving forest resource quality and forest management. Different scholars adopted different methods and technologies to establish diversified index systems and assessment models for forest resource quality assessment, which provided a scientific basis for accurately improving forest resource quality and forest management. However, forest resource quality evaluation methods and models need to be constantly innovated based on the actual situation to meet new changes and needs. Strengthening the research on the relationship between forest resource quality and other factors, such as human activities, can also help us to better understand and solve the difficulties in improving forest resource quality.
A wide range of human activities on forest land contribute to climatic change, prominent among these are deforestation, desertification, industrialization, urbanization, and other socio-economic activities [11]. Human activity intensity is a comprehensive index used to describe the impact of human activities on land, and the quantitative measurement and spatial expression of it can evaluate the impact of human activities on regional ecological environments. The spatialization of human activity intensity can be used as a base to identify forest resource quality and provide a basis for forest resource protection and management. Based on a nonlinear mathematical model, Rachana et al. (2021) used numerical simulations to graphically display various parameters such as the cumulative biomass density of forest resources, density of human populations, and density of human activities and analyzed the impact of human activity intensity on forest resources and the impact on forest wildlife species [11]. Zhuoma et al. (2023) simulated a potential Holocene geographical distribution of the three dominant coniferous species in the Northeast Tibetan Plateau in response to the climate/environment and analyzed pollen records and multi-proxies for anthropogenic activities to explore human impacts on natural forest dynamics [12]. It can be seen that human activities have an important impact on the quality and distribution of forest resources. Different scholars have used different methods and techniques to quantitatively measure and spatially express human activity intensity in order to evaluate the impact of human activities on regional ecological environments. Among them, spatial cluster analysis has been used in a variety of studies. For example, Du et al. (2022) analyzed the landscape pattern characteristics of different periods and combined spatial clustering and coupling superposition with human activity intensity to identify areas where human–land conflicts are prominent [13]. Yuan et al. (2023) measured the spatial dependence and spatial effects of ecological environments and human activities by using bivariate local autocorrelation and the spatial Durbin model [14]. The spatial autocorrelation analysis was also used to explore spatial distribution characteristics and the degree of aggregation of variables, which is often used to analyze the relationship between forests and humans, geomorphic factors, the climate, and other influencing factors [15,16,17,18,19].
Yulin City is located in northwest China. According to the latest forest resource survey data, Yulin City has a forest area of about 2867 km2, with a forest coverage rate of 34.8%. However, Yulin has suffered from severe wind erosion, desertification, and soil erosion and is one of the most fragile ecological regions in China and even the world. After more than 70 years of ecological projects such as the prevention and control of desertification and returning farmland to forest, Yulin has become the first national forest city in the arid and semi-arid sandy areas of China [20]. At the same time, Yulin is a densely populated area. With the acceleration of economic development and urbanization, the population of Yulin City continues to grow, and the development and utilization intensity of forest, land, energy, and other resources will also increase, which will inevitably have a certain impact on the ecological environment and natural resources of Yulin City.
To sum up, it is of great significance to evaluate the change in forest resource quality in Yulin City and explore its relationship with human activities. The purposes of this study are as follows: (1) The index system of human activity intensity and forest resource quality was established. Based on the evaluation results, the spatial change characteristics of human activity intensity and forest resource quality in different counties from 2017 to 2020 were discussed, and the development trend and change law of the two were understood; (2) A spatial autocorrelation analysis of forest resource quality and human activity intensity was carried out, and the concentrated distribution areas of forest resource quality and human activity intensity were obtained, providing a basis for optimizing the layout and planning of forest resources and human activities; (3) The relationship between forest resource quality and human activity intensity in different counties was obtained by the coupling and superposition of concentrated distribution areas of forest resource quality and human activity intensity, which provided a scientific basis for further improving forest resource quality and ecological environment construction and management in Yulin City.

2. Materials and Methods
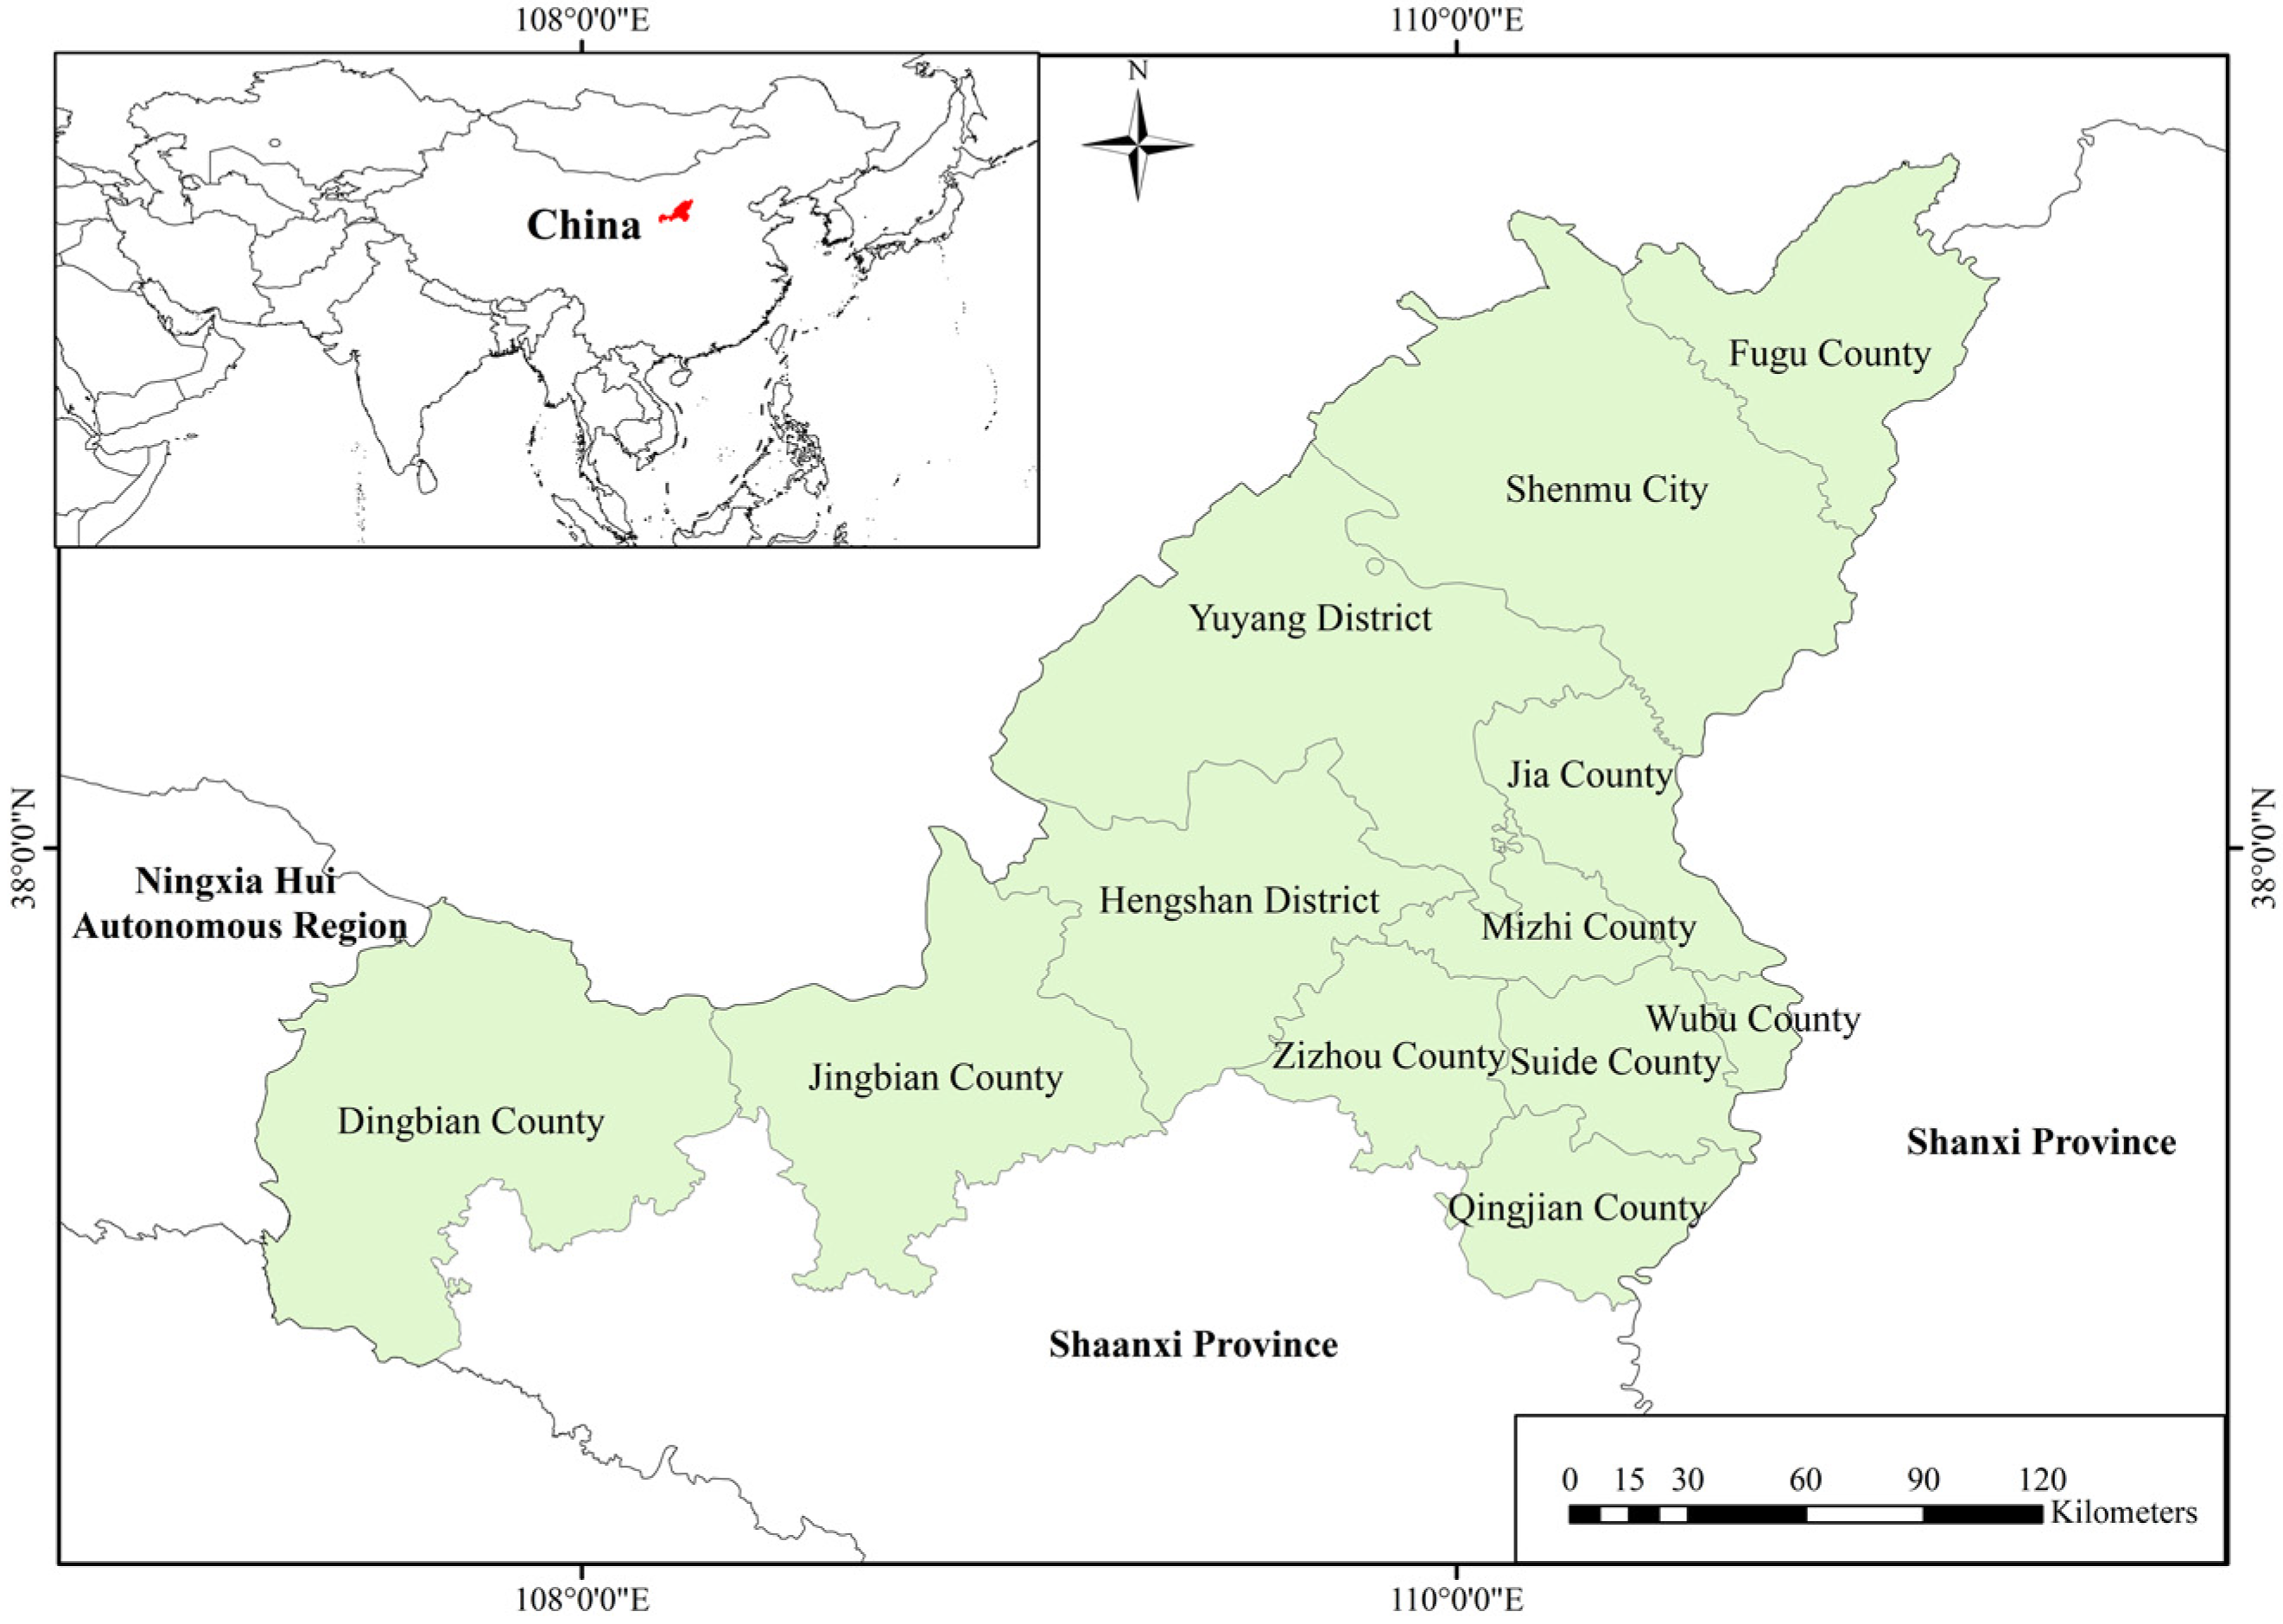
2.1. Study Area

Yulin City (located between 36°49′ and 39°35′ N and 107°15′ and 111°15′ E) is located in the transitional zone of the Mu Us Desert and the Loess Plateau, bordering the Shaanxi, Gansu, and Shanxi provinces to the east, Gansu and Ningxia Hui Autonomous Region to the west, Ordos City in Inner Mongolia to the north, Yan’an City to the south, and Shaanxi Province to the west. Yulin comprises a vast area located in the northernmost part of Shanxi Province, and it is the largest administrative region, with a length of 385 km from east to west, a width of 263 km from north to south, and a total area of 43,578 km2. Currently, it has jurisdiction over 1 city, 2 districts, and 9 counties (Figure 1).
Yulin City is in the transition between temperate and warm–temperate zones. Its climate is a typical temperate/warm–temperate continental monsoon climate, showing four distinct seasons with cold and dry winters, hot summers, short springs, and rain and heat at the same time in autumn. The average annual temperature is 10.5 °C; the annual sunshine duration is 2668 h, which is the longest sunshine time in Shaanxi Province; and the average annual precipitation is about 500 mm. Yulin City has a unique landform and abundant wildlife resources. The main vegetation types include steppes, meadows, deciduous broad-leaved shrubs, deciduous broad-leaved forests, sandy vegetation, halophyte vegetation, aquatic vegetation, and swamps. There are more than 290 species of birds (109 species of wetland waterfowl), 45 species of mammals, and 16 species of amphibians and reptiles.
According to the data from the third national land survey of Yulin City, the arbor forest land is 1637.44 km2 in size, accounting for 13.45%. The shrubland is 7497.89 km2 in size, accounting for 61.56%. The forest land is mainly distributed in Yuyang, Shenmu, Jingbian, and Hengshan, accounting for 75.79% of the Yulin forest land. The forest resources of Yulin City are mainly concentrated in the northern mountainous area and the southern hilly area. The northern mountainous area is rich in forest resources, and the main tree species are Pinus spp., Platycladus spp., and Sophora spp. The southern hilly area’s forest resources are relatively less rich, with mainly Quercus spp. and Pinus spp.

2.2. Data Acquisition and Preprocessing

Forest resource inventory data and the vector data of Yulin City were all derived from the Forestry and Grassland Bureau of Yulin City. ArcGIS 10.7 software was used to extract the raster data of related forest resource quality indicators. The data include the results of two surveys conducted in 2017 and 2020. In the survey, methods such as on-site investigation, sampling investigation, aerial image interpretation, and ground measurement were used to investigate the indicators included in the data of this study.
Advanced Spaceborne Thermal Emission and Reflection Radiometer Global Digital Elevation Model (ASTER GDEM) data from Gscloud were used as terrain data with a spatial resolution of 30 m. ArcGIS software was used to extract the slope and aspect of each grid unit from the Digital Elevation Model (DEM).
The population density data were derived from Worldpop global 100 m population grid data, with a spatial resolution of 100 m.
The road vector data from Bigemap were used to calculate the road density (road length per kilometer).
Opaque surface data from the Chinese Academy of Sciences Institute, Team LiangYun Liu, which comprise a 1985–2020 dataset of a global dynamic impervious area, were used, and these data had a resolution of 30 m.
Using ArcGIS software, the raster data of the above coordinate systems were uniformly projected to CGCS2000_3_Degree_GK_CM_108E with a unified resolution of 30 m.

2.3. Data Processing and Analysis

2.3.1. Indicator Selection

Based on sorting and considering the conclusions of the previous research results of experts and scholars, an index was assigned and standardized, and the weight was determined by the entropy weight method to establish an evaluation system of forest resource quality and human activity intensity in Yulin City.
The selection of indicators fully reflects various aspects of forest resource quality, avoids selecting highly correlated or repetitive indicators, and tries to choose irrelevant or weakly correlated indicators as much as possible. Based on the forest resource inventory data of Yulin City and combined with relevant studies [21,22,23,24,25,26], the following 8 evaluation indicators were selected: stock volume per unit area, quality grade of forest land, age group, origin, soil layer thickness, soil type, slope, and aspect. The details are as follows.
Volume per unit area: This indicator reflects the density and growth of forests. The higher the volume per unit area, the higher the yield or biomass of the forest per unit area.
Quality grade of forest land: This indicator is divided into different levels based on the productivity and protection value of forest land. This indicator can help us understand and evaluate the overall quality and distribution of forest resources.
Age group: The age structure of forests has a significant impact on forest quality and stability. The different age groups of young, middle-aged, and mature forests represent the growth stage and potential for future development of forests.
Origin: This indicator reflects different reasons behind forest formation. The origin of forests has a significant impact on the quality and distribution of forest resources. Different types of origin may have different growth conditions and productivity. For example, natural forests generally have more complex ecosystems and higher productivity than artificial forests.
Soil layer thickness: Soil is the foundation of forest growth, and soil layer thickness directly affects the growth and storage of trees. Generally speaking, the thicker the soil layer, the more nutrients and water it can provide for trees, which is beneficial for the growth and stability of forests.
Soil type: Different soil types have different effects on the growth and accumulation of trees. For example, certain soil types may be more suitable for the growth of certain tree species or have higher water and fertilizer retention properties, providing a better growth environment.
Slope: Slope can affect various aspects such as hydrology, soil erosion, and tree growth, thus having a significant impact on forest resource quality. For example, on steep slopes, soil erosion may be more severe, while on flat land, soil and hydrological conditions may be more stable.
Aspect: Different aspects are affected by different lighting and water conditions, thus having a significant impact on the growth and quality of forests. For example, the southern slope receives more light and heat than the northern slope, which is more conducive to the growth and accumulation of forests.
The reason for selecting the above 8 indicators for evaluation is that, on the one hand, they can be directly obtained from the local administrative regions’ sub-compartment data, which have corresponding rules and standards for updating in China, and are more conducive to conducting continuous research and promoting it to other regions. On the other hand, they can reflect the forest resource quality from different aspects, thus providing comprehensive evaluation results.
The quantification of human activity intensity according to relevant research [13,27], the road density, the percentage of impervious surface area, and the population density were also selected as indicators which are widely accepted as statistical indicators with a strong correlation to human activity and environmental impact.
Road density is a very tangible indicator that reflects infrastructural development. Roads usually mean vehicles, and vehicles mean human activity involving transportation and commerce.
Impermeable surface refers to the surface covered by impermeable materials, usually including surfaces with low permeability such as roofs, parking lots, and roads. The percentage of impervious surface area provides a direct indicator of the level of urbanization and infrastructure development. With urbanization typically comes a higher level of human activity and impact on natural ecosystems. It also serves as a stark indicator of the potential for environmental issues like runoff pollution and the urban heat island effect.
Population density is a clear and simple representation of human activity levels in certain areas. Naturally, where there are more people, there is usually more human activity, which likely has a bigger impact on the environment.
These indicators provide valuable information on how humans are using and changing the environment. They are relatively easy to measure and quantify compared to some other possible indicators, making them practical choices for an index.

2.3.2. Range Standardization

Due to the different data sources of each indicator and the disunity of unit dimensions, the indicators are not comparable. Therefore, in order to clarify the change trend of forest resource quality and human activity intensity, it is necessary to standardize the indicators [28]. The standardized formula is as follows:
K i = X i X m i n / X m a x X m i n
In the formula, Xi is the actual value of indicator i; Xmax is the maximum value of indicator i; Xmin is the minimum value of indicator i; and Ki is the standardized indicator value of indicator i.

2.3.3. Graded Assignment Method

Forest resource quality indexes such as the quality grade of forest land, age group, origin, and soil type are not suitable for range standardization. By referring to the relevant literature [21,22,23,24,25,26], a grading assignment method was adopted to divide the indicators that were not suitable for range standardization into 5 grades within their value range, assign corresponding scores according to their states in turn, and then standardize them (Table 1).

2.3.4. Weight Calculation

Weight is a numerical value that represents the relative importance of many factors. When evaluating multiple indicators, it is important and difficult to determine the weight of each indicator. There are many methods for determining weight, including the entropy weight method, the expert consultation method, the analytic hierarchy process, etc. [29]. The entropy weight method mainly determines weights according to the differences in sample data among evaluation objects. It is a common and objective weighting method with relatively few subjective factors, and the evaluation results are highly reliable [30]. In order to reduce randomness and improve scientific accuracy, the entropy weight method was used to calculate the weights of each evaluation index when evaluating forest resource quality and human activity intensity (Table 2).
The calculation formula for the entropy weight method is as follows:
1.
Select a sample and indicator, defined as sample i and indicator j;
2.
Normalize the indicators; heterogeneous indicators are homogenized to obtain Xij;
3.
Calculate the proportion of indicators Yij:
Y i j = X i j i = 1 m X i j
4.
Calculate the entropy value of indicator j:
e j = k i = 1 m Y i j × ln Y i j
5.
In the equation, k = 1/ln(n) > 0 satisfies the condition of eij ≥ 0;
6.
Calculate information entropy redundancy:
d j = 1 e j
7.
Calculate the weights of various indicators:
W i = d j j = 1 n d i

2.3.5. Index Evaluation Results

Forest resource quality is determined based on the index of stock volume per unit area, the quality grade of the forest land, the age group, the origin, the soil layer thickness, the soil type, the slope, and the aspect. Human activity intensity is determined based on the road density, the percentage of impervious surface area, and the population density.
I = i = 1 n X i × W i
In the formula, I is the evaluation result of the indicator for every raster point, Xi is the standardized value of indicator I, and Wi is the weight of indicator i.

2.3.6. Spatial Autocorrelation Analysis

In order to analyze the spatial variation of forest resource quality and human activity intensity, the spatial correlation was measured and tested using global spatial autocorrelation and local spatial autocorrelation.
In order to intuitively understand the spatial distribution changes in forest resource quality and human activity intensity indexes, a grid analysis was adopted in the spatial autocorrelation analysis. Grid scales of 500 m × 500 m, 1 km × 1 km, 2 km × 2 km, and 5 km × 5 km were selected as references by comprehensively considering the actual situation of the study area. After research and testing, the 1 km × 1 km grid scale was deemed to be the most advantageous for the purposes of our spatial analysis and struck an effective balance between computational efficiency and detailed analysis. In our analysis, this grid scale was capable of accurately capturing the phenomenon we were researching. When considering the coverage of the whole study area, this grid scale ensured adequate cell coverage across the entire region. Moreover, it alleviated concerns over spatial autocorrelation, rendering our analysis robust and dependable. Therefore, the 1 km × 1 km grid as an evaluation unit was determined [13]. A total of 45,684 evaluation cells were divided to measure the spatial autocorrelation analysis results of the forest resource quality and human activity intensity in network cells in 2017 and 2020.
(1)
Global spatial autocorrelation analysis
Global spatial autocorrelation analysis was mostly performed using the global Moran’s I index, the range of which is [−1, 1]. When the Moran index is greater than 0, it means that the spatial autocorrelation is positive, and when it is less than 0, the spatial autocorrelation is negative. The greater the absolute value of the Moran index, the higher the degree of correlation. When the Moran index is 0, the global space is irrelevant, indicating that the spatial distribution is irregular and belongs to a random distribution.
I = i = 1 n j = 1 n W i j X i X ¯ X j X ¯ S 2 i = 1 n j = 1 n W i j
In the formula, I represents Moran’s I index. n represents the number of grids. Xi and Xj represent the values of grid i and j, respectively. X ¯ represents the average of all grid values. Wij is the adjacency space weight matrix. S2 is the variance value of X.
The calculation formula for Moran’s I index generally used for significance testing is
Z = I E I v a r ( I )
where E(I) represents the expected value of Moran’s I index and var(I) represents the variance in Moran’s I index. The value of p corresponding to Z at the 5% significance level was compared. If p was less than 0.05, it indicated significance.
(2)
Local spatial autocorrelation analysis
The local Moran’s I index in the local autocorrelation analysis was used to calculate four types of cluster graphs: high–high, low–low, high–low, and low–high.
I i = X i j = 1 n W i j X j
In the formula, Xi and Xj represent the standardized values of the indicators and Wij is the spatial weight matrix. The significance of the local spatial autocorrelation was tested using the Zi value of the standardized statistic. When Ii > 0 and Zi > 0, then the spatial unit i is in the high–high (HH) quadrant; when Ii > 0 and Zi < 0, then the spatial unit i is in the low–low (LL) quadrant; when Ii < 0 and Zi > 0, then the spatial unit i is in the high–low (HL) quadrant; and when Ii < 0 and Zi < 0, then the spatial unit i is in the low–high (LH) quadrant.

3. Results

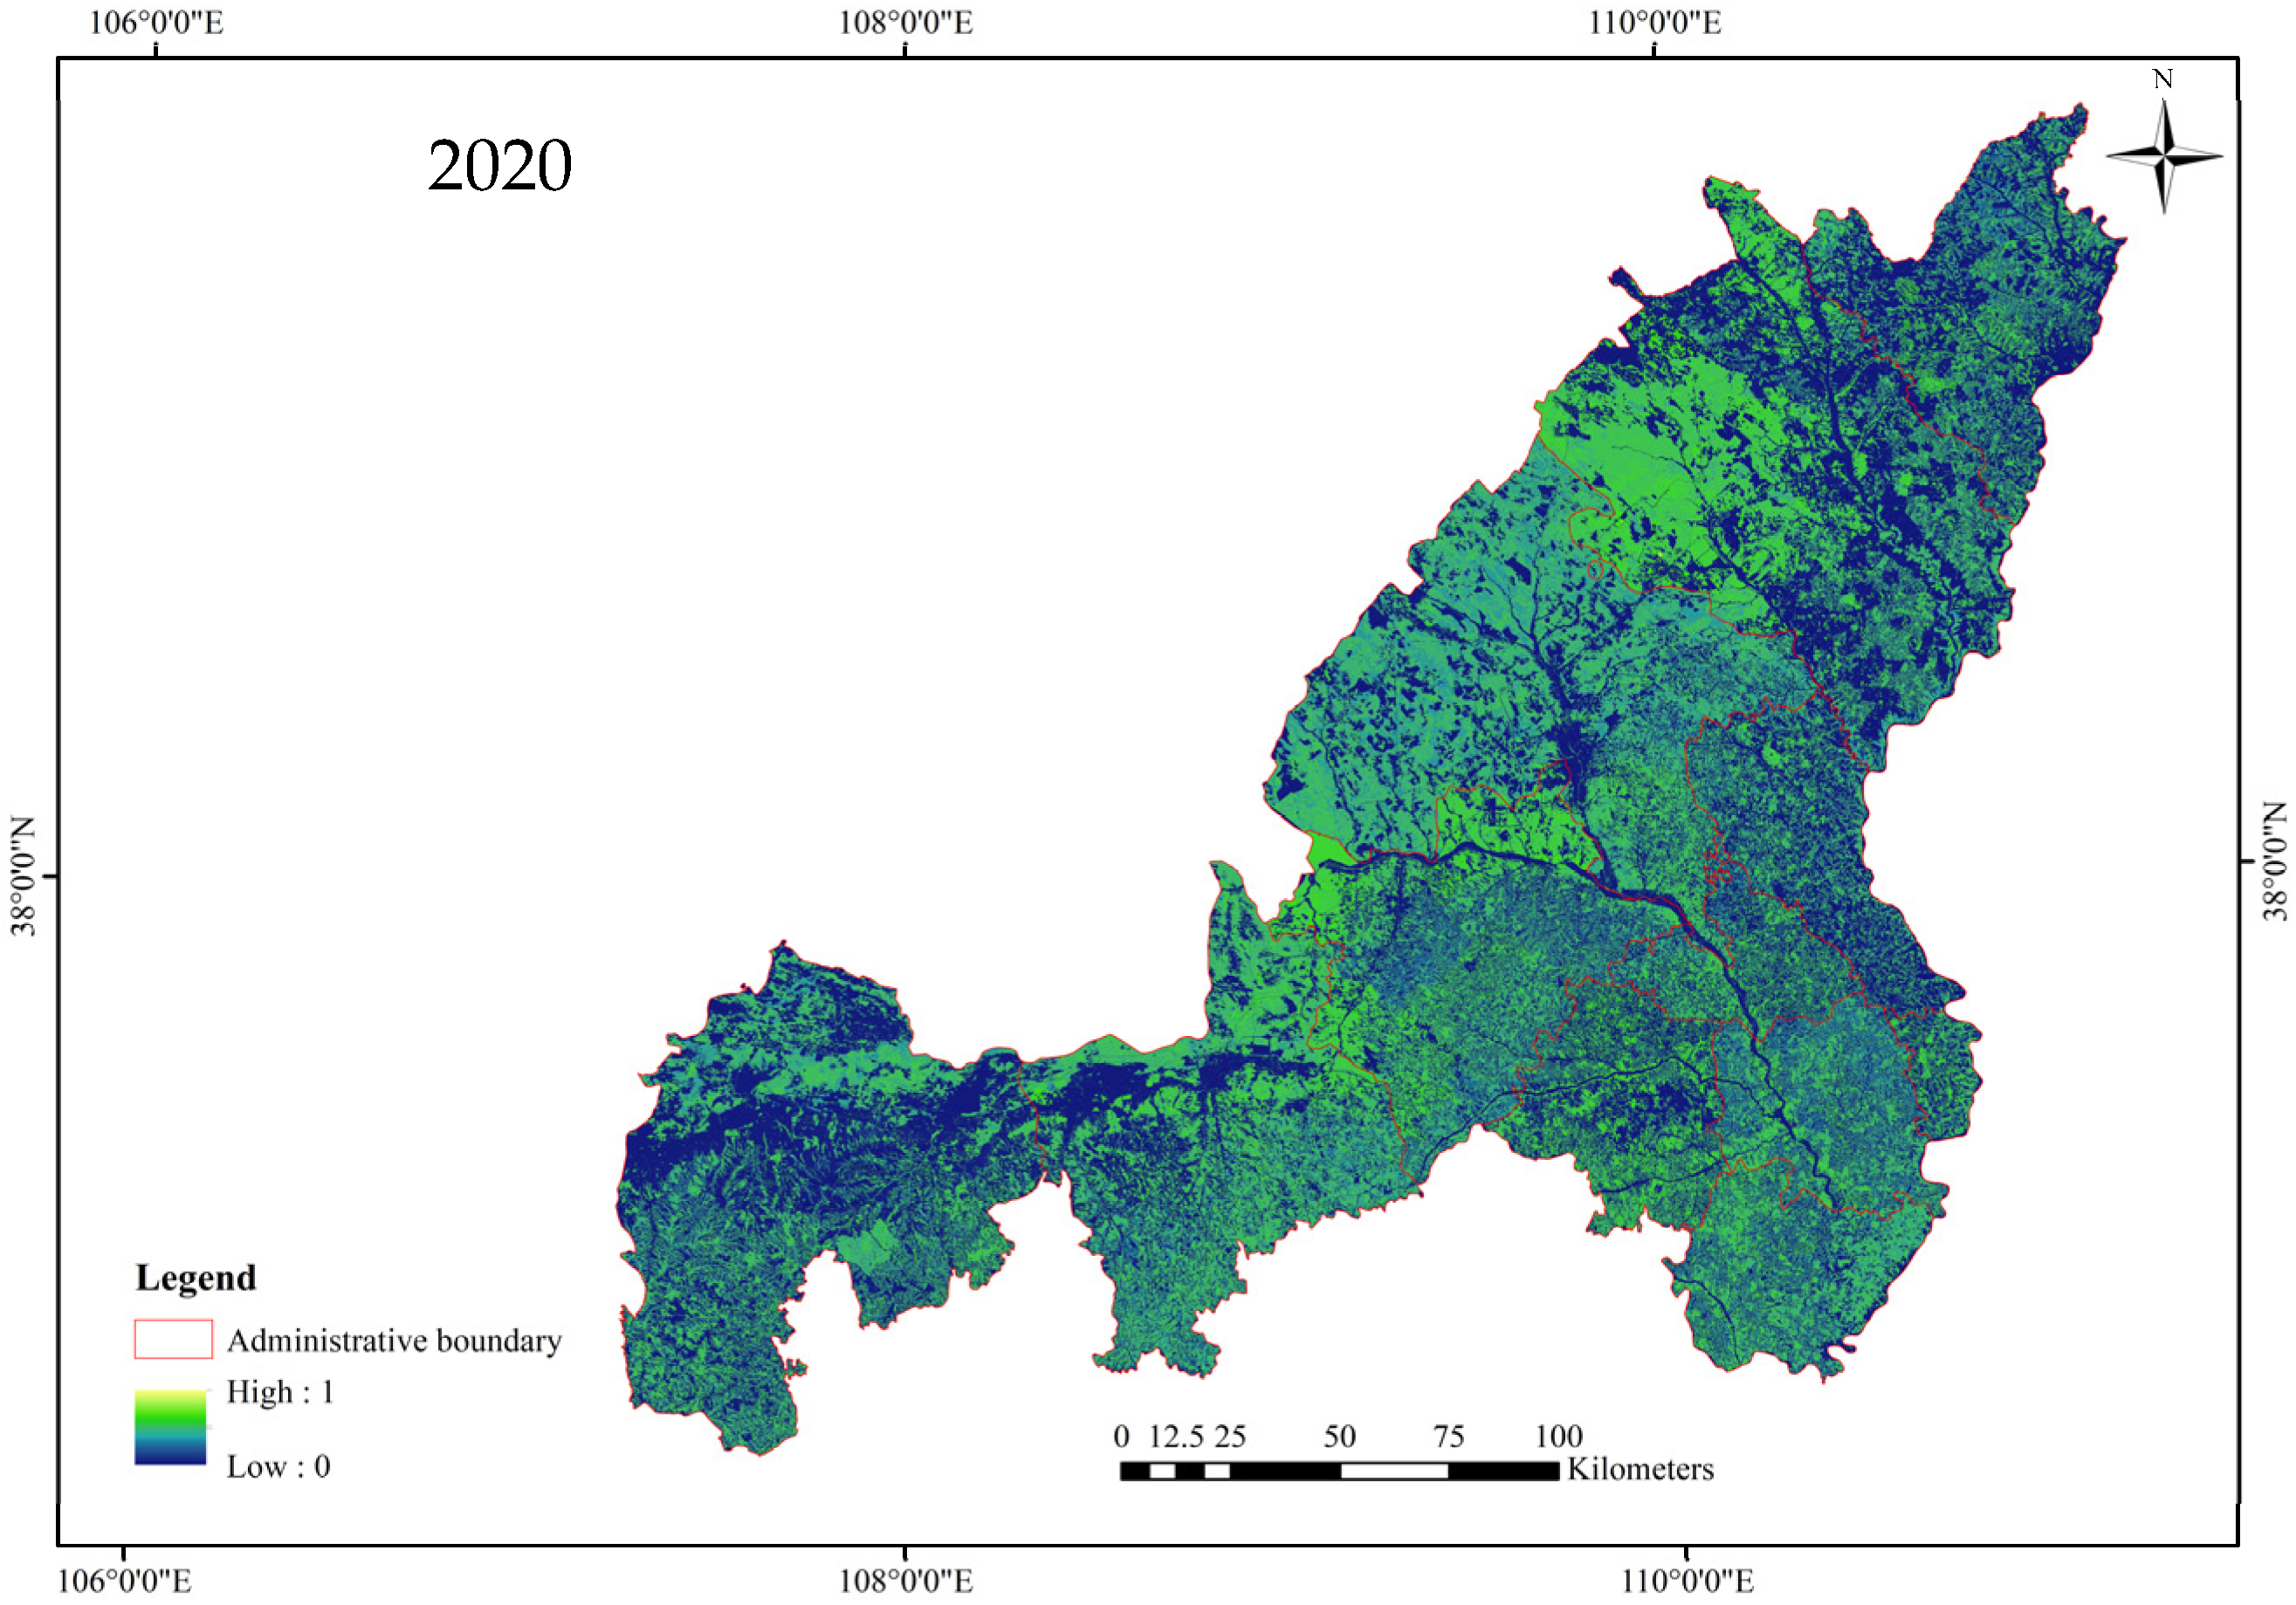
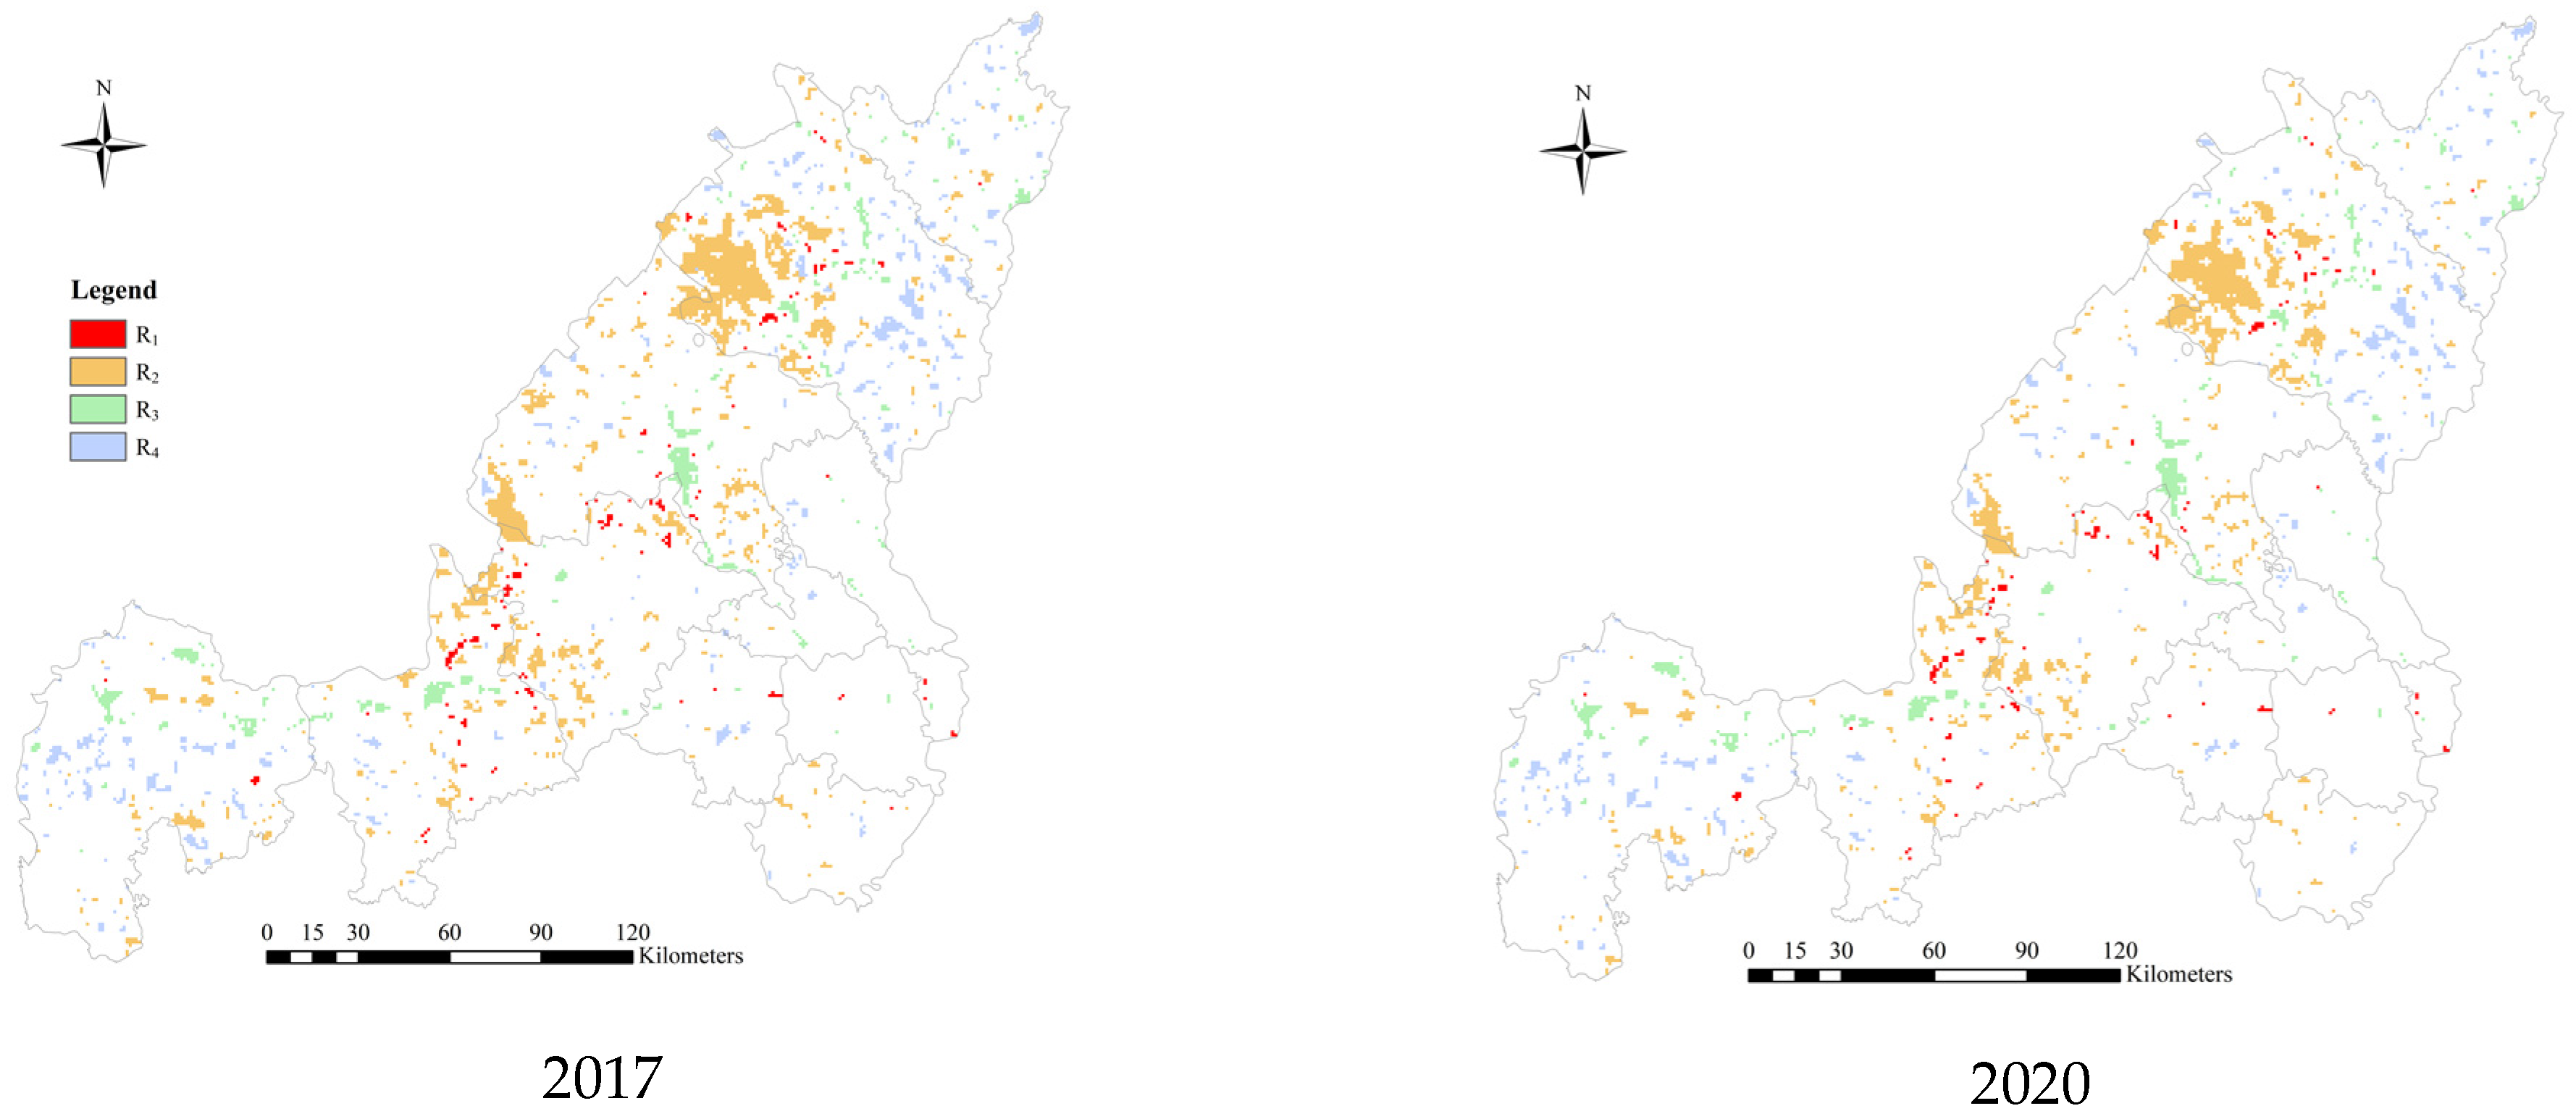
3.1. Temporal and Spatial Changes in Forest Resource Quality

According to the results of Yulin City’s forest resource quality evaluation model (Figure 2), it can be seen that in 2017, Hengshan District, Yuyang District, Jingbian County, Qingjian County, and Suide County all had a good forest resource quality status, with quality indexes above 0.1500, while Shenmu City had a poor forest resource status, with a quality index of only 0.0068. From 2017 to 2020, the forest resource quality of Yulin City showed an overall upward trend, and the average forest resource quality index increased from 0.1457 in 2017 to 0.1486 in 2020. The forest quality in Zizhou County, Wubu County, Mizhi County, Jia County, and Qingjian County increased significantly, and the forest resource quality index increased by 41.95%, 26.53%, 19.71%, 9.49%, and 9.44%, respectively. Hengshan District, Yuyang District, Fugu County, and Dingbian County showed a downward trend, and the forest resource quality index decreased by 5.08%, 3.18%, 2.69%, and 1.31%, respectively.

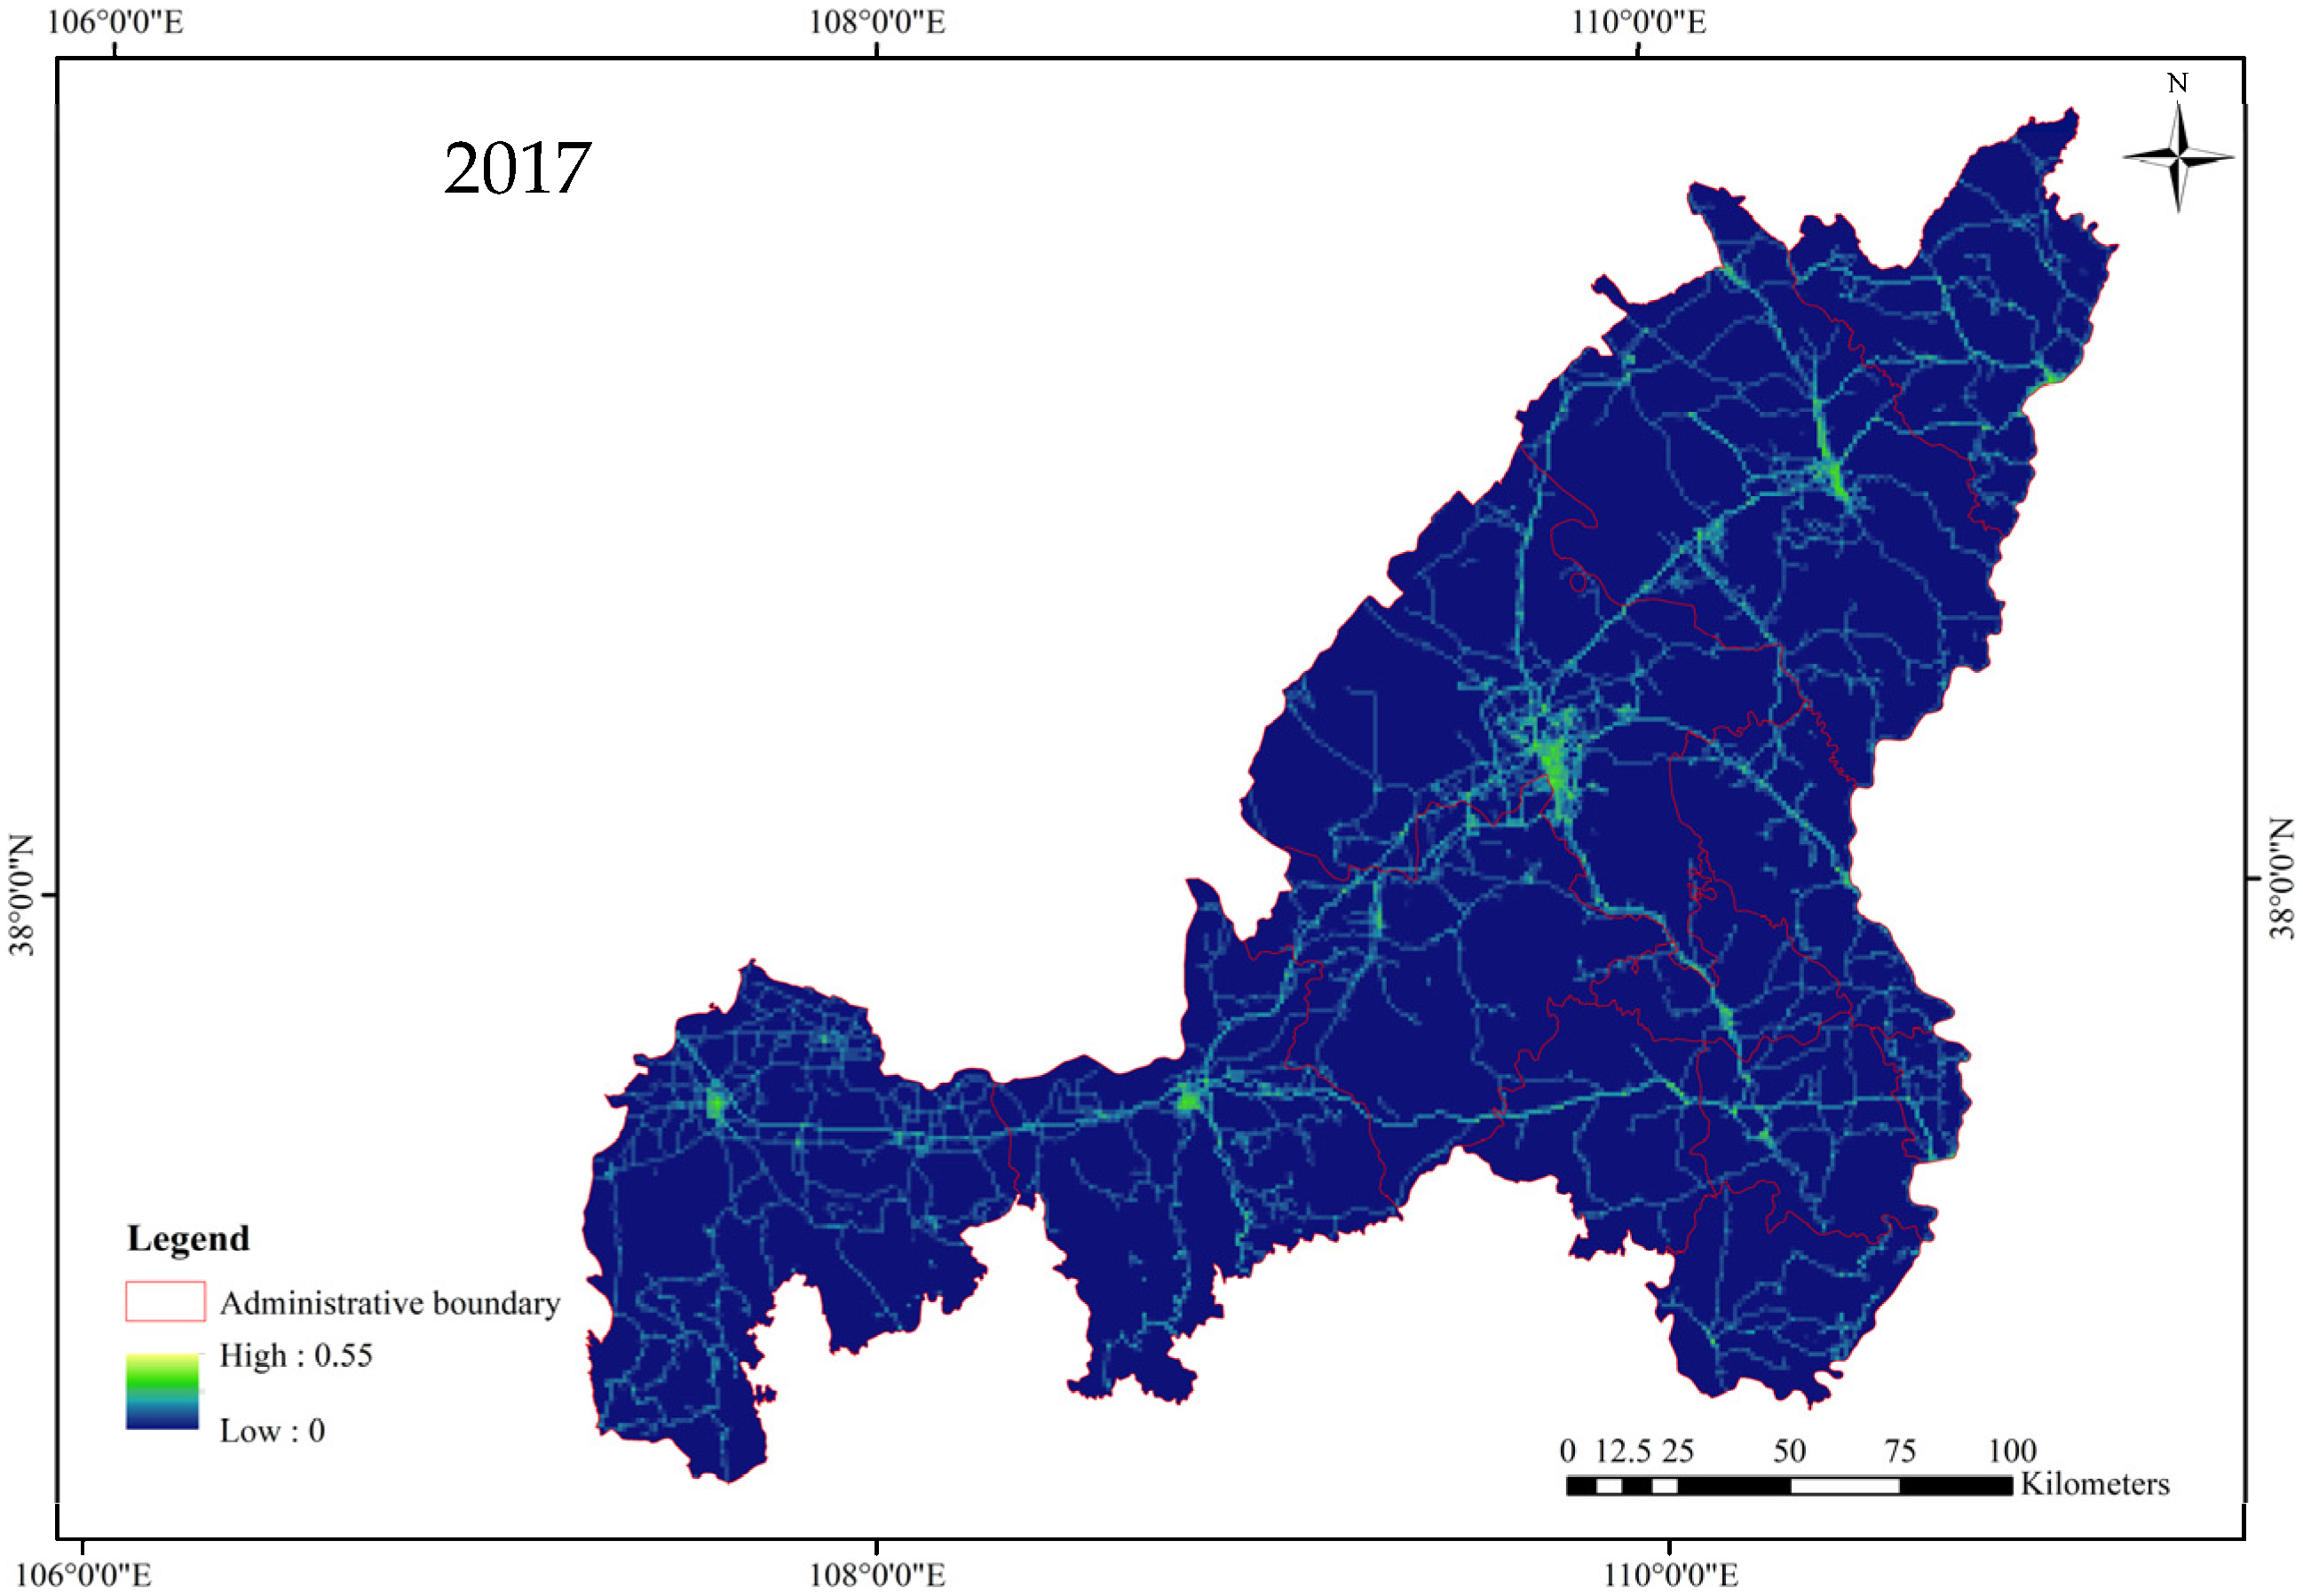
3.2. Temporal and Spatial Variation in Human Activity Intensity

According to the calculation of the human activity intensity index model and the spatial analysis, a distribution map of human activity intensity (Figure 3) was obtained. It can be seen that from 2017 to 2020, the human activity intensity in Yulin City was, on the whole, on an upward trend, and the most obvious rise was in Hengshan District, the human activity intensity index of which increased by 0.57%. Next came Fugu County, Suide County, Jingbian County, and Mizhi County, where the human activity intensity indexes increased by 0.40%, 0.34%, 0.30%, and 0.30%, respectively. The intensity index of human activities in other areas of Yulin City increased to different degrees, but the increase rate was low, at less than 0.20%. The highest human activity intensity in Yulin City was in Wubu County, the human activity intensity index of which reached 0.0119 in 2017, while the human activity intensity indexes in other areas were distributed between 0.0045 and 0.0085.

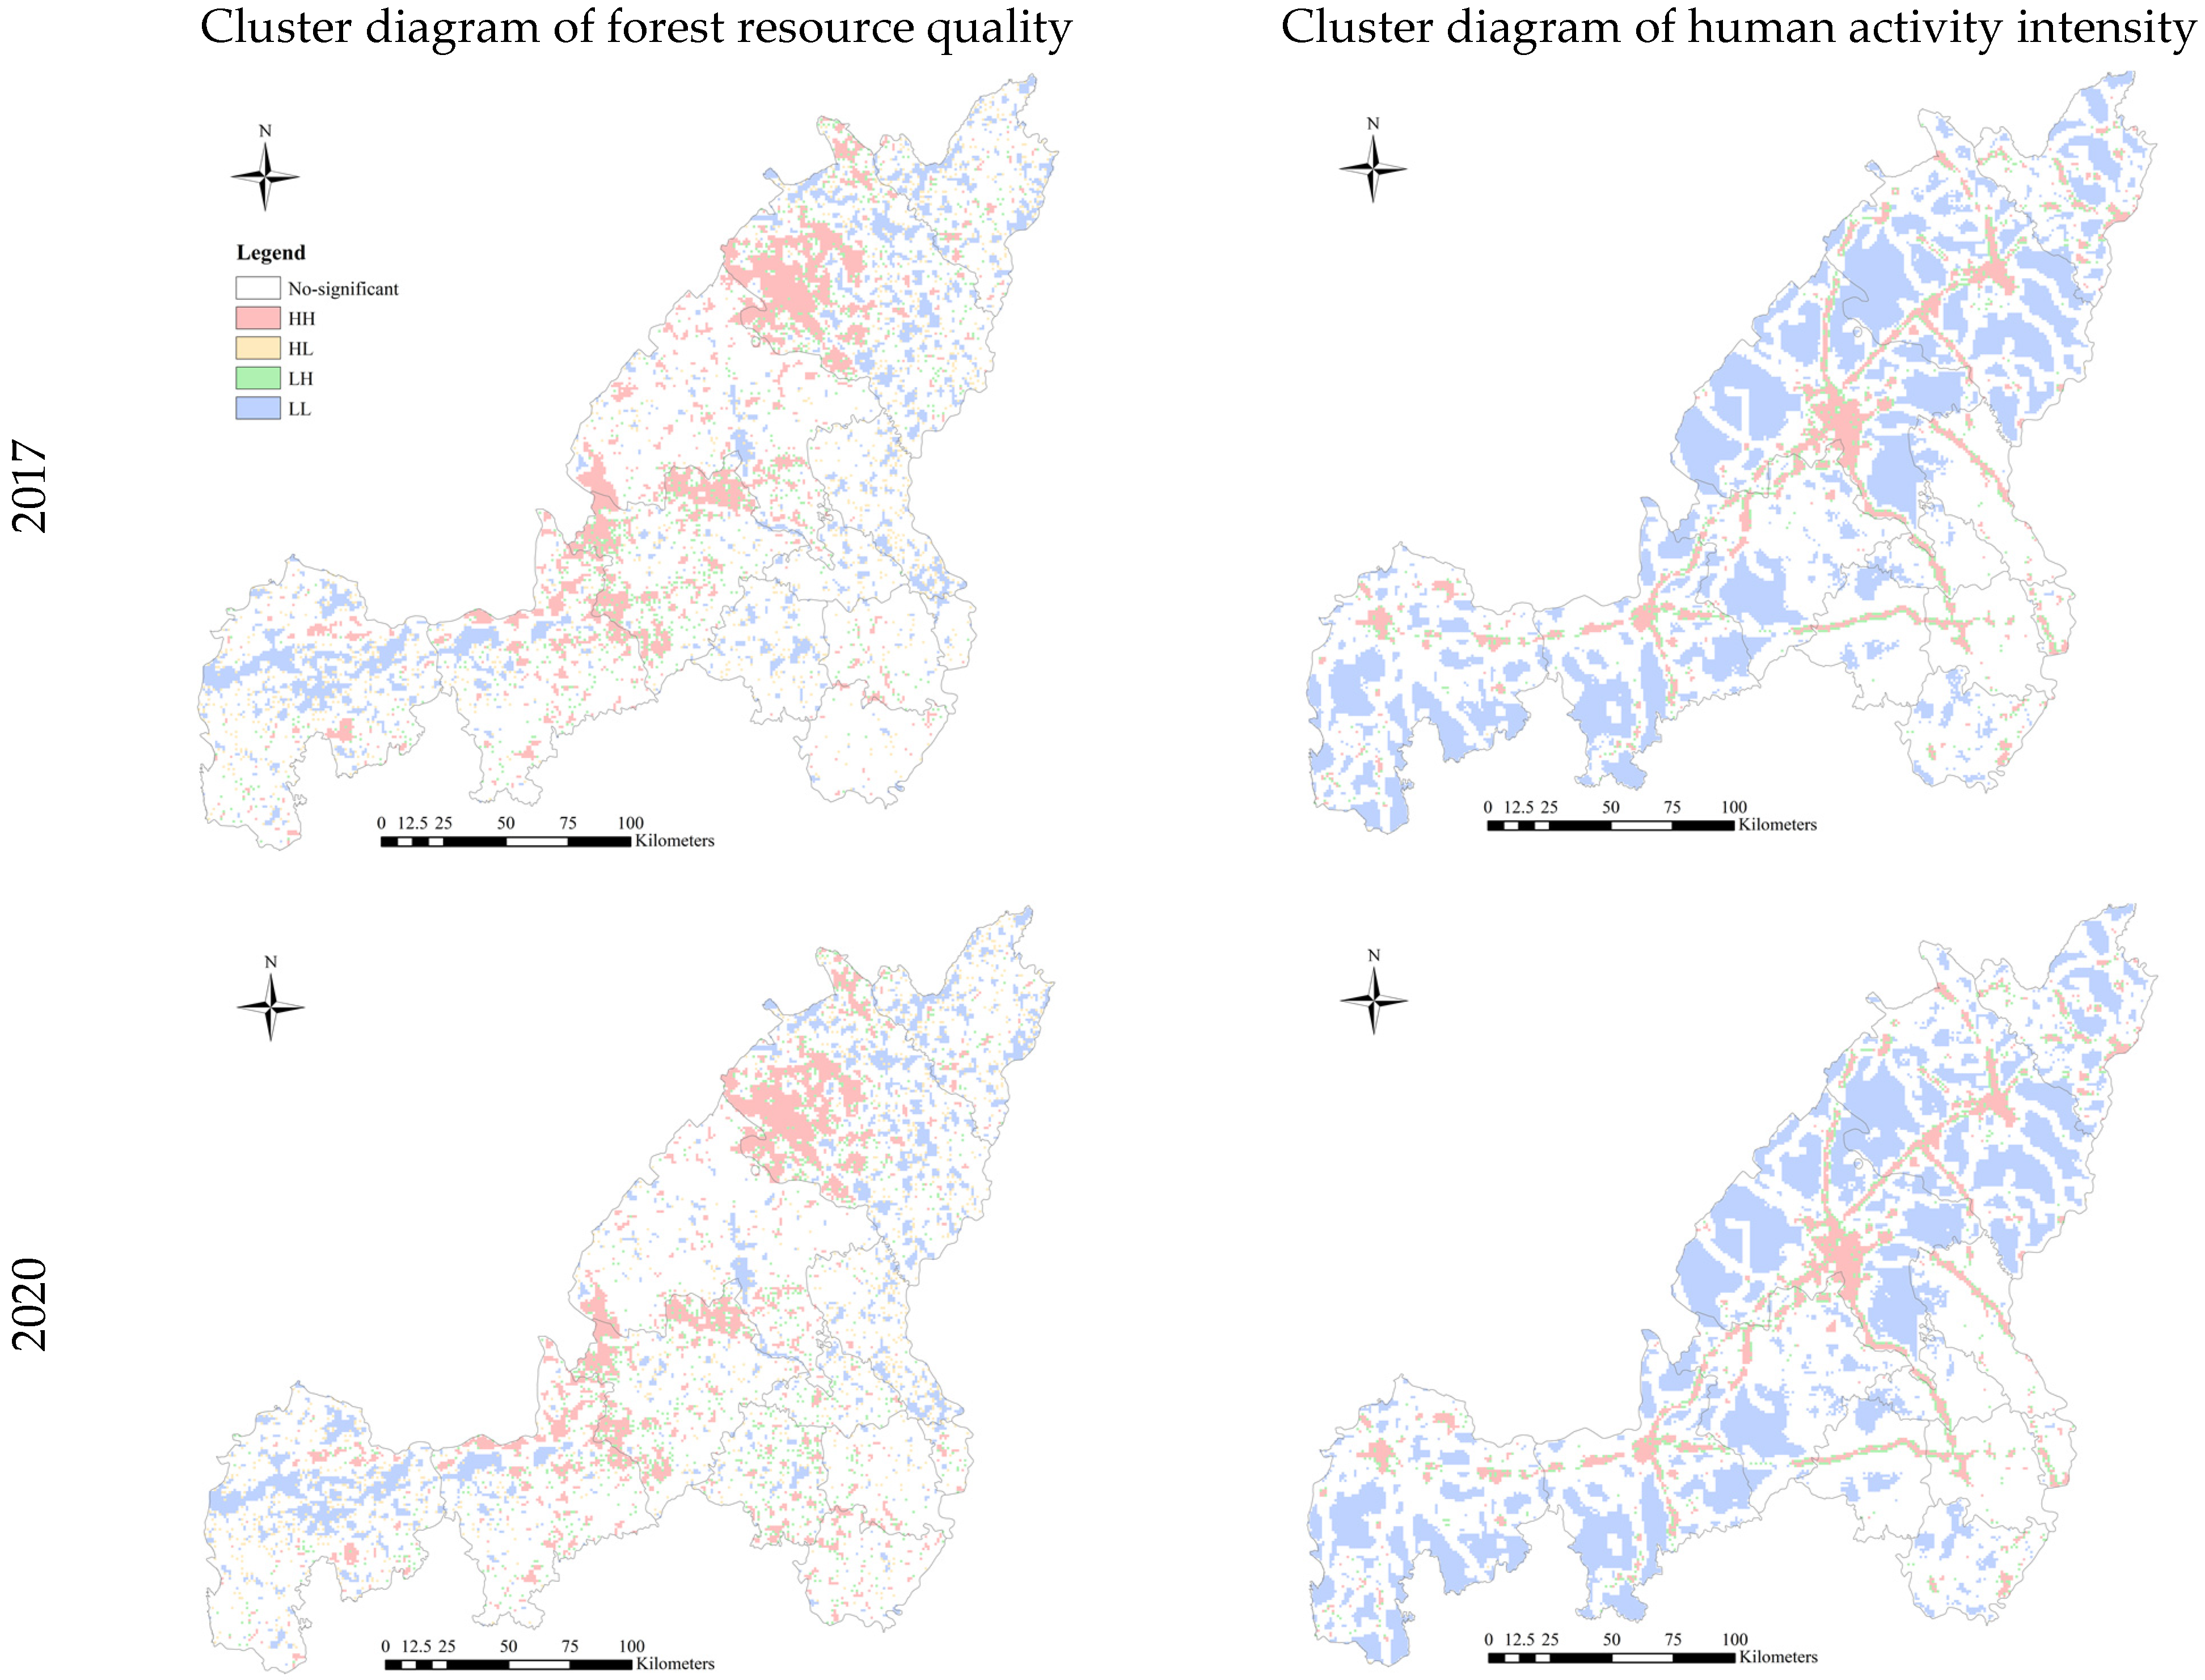
3.3. Autocorrelation Analysis of Forest Resource Quality and Human Activity Intensity

As can be seen from Table 3, the global spatial autocorrelation p values of the forest resource quality and human activity intensity indexes in 2017 and 2020 were both less than 0.01, thus passing the significance test, and the global Moran index was positive, indicating that both the forest resource quality and human activity intensity indexes experienced a spatial aggregation phenomenon and that the spatial distribution was regular. However, from 2017 to 2020, the global Moran’s I index showed a decline in forest resource quality, indicating that the forest resource quality of Yulin City developed from an aggregation state to a random state in recent years, and the difference between areas decreased. However, the global Moran’s I index of human activity intensity increased, indicating that the intensity of human activities in Yulin City showed a trend of aggregated development, and the difference between different administrative areas in Yulin city gradually increased, which is also in line with the law of population flow in the process of urbanization in our country [31].
As shown in Figure 4, compared with 2017, the HH area of human activity intensity in 2020 showed a trend of gradually extending outward in economically developed areas, but its area decreased from 2907 km2 in 2017 to 2880 km2 in 2020. The LL cluster was reduced from 13,115 km2 in 2017 to 12,972 km2 in 2020. As human activities are usually concentrated in economically developed areas, the original HH cluster area will continue to increase over time, while human activities will no longer concentrate in other areas of Yulin City.
As shown in Figure 5, the HH cluster area of the forest resource quality index decreased from 4445 km2 in 2017 to 4238 km2 in 2020, and the LL cluster area also decreased from 4337 km2 in 2017 to 4242 km2 in 2020, indicating that, although the overall average forest resource quality index in Yulin City has increased, its accumulation trend is shrinking. However, its aggregation showed a shrinking trend. This may mean that, in the process of improving the overall quality of forest resources, some high-quality forest resources are exploited or destroyed or some low-quality forest resources are improved.
According to spatial coupling and the superposition of spatial hot spots (cold spots) of human activity intensity and forest resource quality in 2017 and 2020, different types of overlapping areas were obtained. The overlapping area between the HH cluster area of human activity intensity and the HH cluster area of forest resource quality, indicating a concentrated area of human–land conflict, was denoted as R1. The overlapping area between the HH cluster area of human activity intensity and the LL cluster area of forest resource quality, indicating the main area of human activity intensity concentration and aggregation, was denoted as R2. The overlapping area between the LL cluster area of human activity intensity and the HH cluster area of forest resource quality, indicating an area suitable for the development of forest resource quality, was denoted as R3. The overlapping area between the LL cluster area of human activity intensity and the LL cluster area of forest resource quality, indicating an area of fewer human activities and a poor quality of forest resources, was denoted as R4.
As can be seen from Figure 5, the area of R2 was the largest among the different types of overlapping areas and presented a relatively obvious decreasing trend. In 2017 and 2020, the area accounted for 4.94% and 4.29% of the total study area, respectively, which represents a decrease of 15.21%. The area of R4 decreased, but the decrease was less than that of R2. The area of R4 in 2017 and 2020 accounted for 1.95% and 1.85% of the total study area, respectively, which represents a decrease of 5.4%. Differently from R2 and R4, the area of R3 increased, accounting for 1.31% and 1.35% of the study area in 2017 and 2020, respectively, which represents an increase of 3.11%. The smallest area was R1, which accounted for 0.34% and 0.36% of the total study area in 2017 and 2020, respectively, which represents an increase of 5.23%. It can be seen that the human–land conflict area in Yulin City was scattered and such conflict rarely occurred.
Among them, the increase in R1 mainly occurred in Zizhou County, and the increased area was the same as the total increased area of R1. The decrease in R2 mainly occurred in Yuyang District, and the decreased area was 60.36% of the total decreased area of R2. The increase in R3 mainly occurred in Yuyang District, and the increased area was 88.89% of the total increased area of R3. The decrease in R4 mainly occurred in Shenmu City, and the decreased area was 120.93% of the total decreased area of R4.

4. Discussion

(1) By building the forest resource quality evaluation and human activity intensity model, this study focused on the changes in the forest resource quality and the human activity intensity in Yulin City, quantitatively revealing the spatial distribution characteristics of human activity intensity, visually displaying the areas with greater forest resource destruction in the study area, and simultaneously calculating the spatial distribution in the region that needs to be focused on and protected, thus providing a basis for ecological protection. At present, China’s forest sub-compartment data have basically achieved full coverage and have been widely used in the calculation of forest naturalness, forest ecological compensation value, forest quality, and other aspects [25,32,33]. Therefore, with reference to this research method, an evaluation of national forest resource quality and human activity intensity can be further carried out. This can provide strong support for the implementation of different policies in different areas.
(2) This paper used data from 2017 and 2020; compared with other studies that only used single-year data [22,28], this study could more intuitively see the changes in human activities and forest resource quality and propose effective conservation strategies accordingly. Some studies also used data over longer periods of time to analyze the relationship between forest quality and human activities [34,35]. In future studies, we can also consider combining short-term and long-term data to reveal the relationship between human activity intensity and forest resource quality from a more comprehensive perspective.
(3) An ecological carrying capacity study based on the perspective of resources and the environment showed that the mountainous area of northern Shaanxi can be positioned as a national key ecological functional area, and the northern area of Yulin is the core area of national urbanization development, indicating that there may be a large amount of population flow and construction activities in this area, and there is a high demand for the protection and restoration of the ecological environment [36]. This study can intuitively show the areas with a greater degree of destruction of forest resources and clarify the spatial distribution that needs to be paid attention to and protected so that the research results are more meaningful for a practical application. A study on land-use data showed that the habitat quality in Yulin City presents a pattern of high quality in the east and low quality in the west [37]. A study on human activities and the change in vegetation greenness in Shaanxi Province showed that human activities have a great impact on vegetation changes and that the greenness increase in Yulin City exceeded the average level for the whole province [38]. This study further supports the quantitative revelation of the relationship between the forest resource quality and the human activity intensity in Yulin City and proves the status of the ecological environment in Yulin City and the impact of human activities on it.
(4) With the continuous development of the economy and the continuous increase in the population, if not guided, land will continue to transform into construction land, which will threaten or even seriously damage the forest resources of Yulin City. The spatial distribution characteristics of forest resource quality need to be grasped, areas where human–land conflicts are prominent need to be identified, and areas seriously disturbed by human activities in Yulin City need to be explored in order to effectively avoid protection gaps and provide a spatial reference for forest resource management in Yulin City. Differentiated spatial management and control means can promote the ordering of human activity elements in regional space and a realization of the balance between ecology and humanity [39]. It is suggested that differentiated management measures should be adopted for areas with different degrees of human disturbance in this study. For example, in the R4 area, large-scale development is restricted and ecological restoration is mainly carried out through afforestation, returning farmland to forest, and other ecological projects; in the R3 region, the forest protection work is mainly focused on mountain closure and the strengthening of forest cultivation; and in the R2 region, the development restrictions can be appropriately relaxed without damaging the ecology. In the future, it is necessary to continue to track and monitor these areas with different degrees of human disturbance, further analyze the causes and impacts, and judge the effects of corresponding policies or measures so as to better solve the problem of human–land conflict, protect and optimize the spatial layout of forest resources, and promote the sustainable use of forest resources.

5. Conclusions

Based on the sub-compartment data in Yulin City, this study calculated the temporal and spatial changes in the forest resource quality and human activity intensity by constructing an index model of forest resource quality and human activity intensity, conducting an autocorrelation analysis of forest resource quality and human activity intensity, and describing their overlapping areas and changes. The research results showed the following:
(1) From 2017 to 2020, the forest resource quality index of Yulin City increased overall, but the trends of the change in the forest resource quality in different administrative districts of Yulin City were slightly different. The forest resources in Hengshan District, Yuyang District, Jingbian County, Qingjian County, and Suide County were of good quality. The forest resource quality indexes increased in Zizhou County, Wubu County, Mizhi County, Jia County, and Qingjian County, among which the growth rate of Zizhou County was the largest, reaching 41.95%;
(2) From 2017 to 2020, the human activity intensity index of Yulin City increased overall, but the trends of the change in the human activity intensity index of different administrative districts of Yulin City were slightly different. Among them, the human activity intensity index in Hengshan District increased the fastest, reaching 0.57%, and the human activity intensity index in other areas also increased, but the growth rate was lower;
(3) Both the forest resource quality and human activity intensity indexes exhibited a spatial aggregation phenomenon. From 2017 to 2020, forest resource quality showed a decrease in aggregation, while human activity intensity showed an increase in aggregation. The human activity intensity index had a tendency to expand further in the main areas of human concentration but shrink in other areas. At the same time, differently from the increase in the overall forest resource quality index, its aggregation shrunk;
(4) Four specific areas were identified through spatial coupling and a superposition analysis to reveal the dynamic relationship between forest resource quality and human activity intensity. It can be seen that from 2017 to 2020, the area of concentrated human activity intensity (R2) decreased by 15.21%, mainly in Yuyang District. On the contrary, the area suitable for the development of forest resource quality (R3) increased slightly by 3.11%, mainly in Yuyang District, indicating that the forest resource quality in this area improved due to a reduction in the pressure of human activities on the natural environment. In addition, the area where human–land conflicts were concentrated (R1) and the area with fewer human activities and a poor quality of forest resources (R4) experienced small changes in area: 5.23% and 5.40%, respectively.

Author Contributions

C.S. and Q.Y. contributed equally to this work and were responsible for most of the writing in this contribution. K.J. gave review suggestions for the manuscript and led the research, solidified the argument, and gave review suggestions for the manuscript during the whole writing process. All authors have read and agreed to the published version of the manuscript.

Funding

This research was funded by the Development Research Center of the National Forestry and Grassland Administration “Forest quality and ecological function evaluation index system”, grant number JYFL-2021-00019; and the National Forestry and Grassland Administration “Forest and Grassland Ecological Security Research”, grant number 2130237-1905-2307.

Data Availability Statement

The data presented in this study are openly available at https://www.gscloud.cn; http://www.worldpop.org; https://data.casearth.cn; http://www.bigemap.com, accessed on 16 June 2023.

Acknowledgments

We are indebted to the anonymous reviewers and editor.

Conflicts of Interest

The authors declare no conflict of interest.

References

  1. Wei, X.X.; Liu, R.G.; Liu, Y. Forest Change in China: A Review. Chin. Geogr. Sci. 2023, 33, 489–502. [Google Scholar] [CrossRef]
  2. Jones, K.P.; Venter, O.; Fuller, R.A.; Allan, J.R.; Maxwell, S.L.; Negret, P.J.; Watson, J.E.M. One-third of global protected land is under intense human pressure. Science 2018, 360, 788–791. [Google Scholar] [CrossRef] [PubMed]
  3. Dong, Q.D.; Chen, C.N.; Li, Y.H.; Zhao, T.X.; Sun, Z.X.; Zhang, Z.; Zhu, L.Q. Assessing the Protection Effectiveness and Spillover/Leakage Effects of the National Nature Reserve Group of Funiu Mountain Area in Henan Province Based on the NPP and Human Disturbance Index. Biodivers. Sci. 2023, 31, 102–113. [Google Scholar] [CrossRef]
  4. Li, W.; Guo, W.Y.; Pasgaard, M.; Niu, Z.; Wang, L.; Chen, F.; Qin, Y.C.; Svenning, J. Human fingerprint on structural density of forests globally. Nat. Sustain. 2023, 6, 368–379. [Google Scholar] [CrossRef]
  5. Mauro, A.; Francesco, P.; Martina, V.; Antonio, S. Cultural values and forest dynamics: The Italian forests in the last 150 years. Forest Ecol. Manag. 2022, 503, 119655. [Google Scholar] [CrossRef]
  6. McMichael, C.N.H. Ecological legacies of past human activities in Amazonian forests. New Phytol. 2020, 229, 2492–2496. [Google Scholar] [CrossRef] [PubMed]
  7. Zhang, G.G.; Hui, G.Y. Comprehensive Evaluation Method of Forest Quality Based on the Accumulation and Homogeneity. Sci. Silv. Sin. 2021, 57, 77–84. [Google Scholar] [CrossRef]
  8. Fernando, M.; Roberto, M. Evaluating the quality of riparian forest vegetation: The Riparian Forest Evaluation (RFV) index. Forest Sys. 2014, 23, 259–272. [Google Scholar] [CrossRef]
  9. Wu, G.J.; Zhao, T.Z. Study on the Forest resources quality evaluation based on BP neural network. In Proceedings of the 2010 Third International Conference on Information and Computing, Wuxi, China, 4–6 June 2010; IEEE: New York, NY, USA, 2010. [Google Scholar] [CrossRef]
  10. Cao, L.J.; He, X.B.; Chen, S.; Fang, L.M. Assessing Forest Quality through Forest Growth Potential, an Index Based on Improved CatBoost Machine Learning. Sustainability 2023, 15, 8888. [Google Scholar] [CrossRef]
  11. Rachana, P.; Vinay, V.; Manju, A. Impact of human activities on forest resources and wildlife population. Comput. Ecol. Softw. 2021, 11, 83–99. [Google Scholar]
  12. Wende, Z.M.; Hou, G.L.; Chen, H.M.; Jin, S.M.; Zhuoma, L.C. Dynamic changes in forest cover and human activities during the Holocene on the northeast Tibetan plateau. Front Earth Sci. 2023, 11, 1128824. [Google Scholar] [CrossRef]
  13. Du, W.W.; Hu, Y.; Sui, M.; Yuan, C. Study on Response of Temporal and Spatial Changes of Human Activity Intensity and Landscape Pattern in Jinfo Mountain National Scenic Area. Landsc. Archit. Acad. J. 2022, 39, 28–37. [Google Scholar]
  14. Yuan, H.W.; Cai, J.; Zhang, L. Temporal and Spatial Changes of Human Activities and Habitat Quality in National Key Ecological Function Areas and Their Spatial Effects. Arid Land Geo. 2023, 46, 934–948. [Google Scholar]
  15. Gong, Z.W.; Yao, S.B.; Gu, L. Spatial Relationship and Regional Structure Analysis for the Forest Resources Growth Rate in China. For. Econ. 2015, 37, 16–20. [Google Scholar] [CrossRef]
  16. Jing, T.Z.; Li, T.Y. Spatial Patterns of Forest Insect Outbreaks: A Review. Acta Ecol. Sin. 2018, 38, 3414–3421. [Google Scholar] [CrossRef]
  17. Zeng, C.Y.; Cheng, L.H.; Mi, X.Y.; Tan, Y.B.; Xu, Q.L.; Feng, J.Q.; Hu, J. Spatial Variation of Forest Carbon Density in Mao’er Mountain, Guangxi. J. Cent. South Univ. For. Technol. 2023, 43, 91–98. [Google Scholar] [CrossRef]
  18. Liu, Y.; Zhao, J.; Zheng, X.; Ou, X.; Zhang, Y.; Li, J. Evaluation of Biodiversity Maintenance Capacity in Forest Landscapes: A Case Study in Beijing, China. Land 2023, 12, 1293. [Google Scholar] [CrossRef]
  19. Yang, P.; Zhang, X.; Hua, L. Analysis of Urban Ecological Quality Spatial Patterns and Influencing Factors Based on Remote Sensing Ecological Indices and Multi-Scale Geographically Weighted Regression. Sustainability 2023, 15, 7216. [Google Scholar] [CrossRef]
  20. Xu, L.X.; Li, Z.Z. Present Situation and Countermeasures of Improving the Quality and Efficiency of Forest Resources in Yulin City. Mod. Agric. Sci. Technol. 2021, 21, 156–157+159. [Google Scholar] [CrossRef]
  21. Guo, N.; Xing, S.H.; Ji, W.; Cui, G.F.; Ze, L.G.; Wang, M.; Xue, Q.; Jiang, X.M. A Method for Forest Resources Quality Evaluation and its Application in Miyaluo Forest Regions, Western Sichuan. Acta Ecol. Sin. 2010, 30, 3784–3791. [Google Scholar]
  22. Mo, K. The Study on Quality Assessment Indicator System of Timber Forest and Its Methods at Subcompartment Level. Ph.D. Thesis, Beijing Forestry University, Beijing, China, 2015. [Google Scholar]
  23. Tian, Y.W.; Huang, Z.L.; Xiao, W.F.; Zeng, L.Y.; Xiang, Y. Assessment on Forest Ecosystem Health of Lanlingxi Watershed Based on Matter-element Model and Subcompartment Scale. Chin. J. Ecol. 2017, 36, 1458–1464. [Google Scholar] [CrossRef]
  24. Liu, L.J.; Xie, Z.H.; Lei, M.; Shi, Y.M.; Li, S.Q.; Liu, P. Evaluation of Forest Quality Based on Analytic Hierarchy Process—A Case Study in Liuxihe Forest Farm, Guangzhou. For. Resour. Manag. 2022, 6, 89–94. [Google Scholar] [CrossRef]
  25. Mei, H.; She, C.Y.; Lu, X. Study on the Quality Assessment Index Selection of Ecological Public-welfare Forests Based on Subcompartment Scale. J. Cent. South Univ. For. Technol. 2019, 39, 14–22. [Google Scholar] [CrossRef]
  26. Zhang, B.; Wang, Z.L.; Lei, F.J. Quality Evaluation of Forest Resources Based on Analytic Hierarchy Process and Matter Element Analysis—A Case Study of Yanchuan County. J. Northwest For. Univ. 2022, 37, 208–215. [Google Scholar] [CrossRef]
  27. Hu, Z.B.; He, Y.X.; Li, Y.H.; Zhu, J.J.; Li, X.Y. Landscape pattern change in Minjiang River upper reach under effects of anthropogenic activities. Chin. J. Ecol. 2007, 26, 700–705. [Google Scholar]
  28. Wu, M.Q.; Hu, M.M.; Wang, T.; Fan, C.; Xia, B.C. Recognition of Urban Ecological Source Area Based on Ecological Security Pattern and Multi-scale Landscape Connectivity. Acta Ecol. Sin. 2019, 39, 4720–4731. [Google Scholar] [CrossRef]
  29. Wang, J.Z.; Zhang, G.H.; Nie, Z.L.; Yan, M.J. Quantintative Assessment of Human Activity Intensity in Hutuohe Catchment. J. Arid Land Resour. Environ. 2009, 23, 41–44. [Google Scholar]
  30. Bao, Y.L.; Tian, B.; Hu, Y.C.; Zhang, W.J.; Wang, C.X.; Wang, T.Y. Numerical Simulation of PM2.5 in Beijing-Tianjin-Hebei Region Based on Mixed Effect Model. Environ. Pollut. Control 2020, 42, 268–274. [Google Scholar] [CrossRef]
  31. Ma, Z.F.; Yin, S.G.; Zhang, Y.; Li, Z.J.; Wu, Q.Y. Spatial Distribution, Flowing Rules and Forming Mechanism of Inter-Cities Floating Population in China. Geogr. Res. 2019, 38, 926–936. [Google Scholar] [CrossRef]
  32. Yang, P.S.; Chen, C.H.; She, J.Y. Evaluation of Forest Naturalness of Paiya Mountain State-owned Forest Farm, Jingzhou Miao in Dong Autonomous County. J. Cent. South Univ. For. Technol. 2022, 42, 19–32. [Google Scholar] [CrossRef]
  33. Su, H.; Jiang, Z.; Yang, J. Differential Basis of Payment for Ecosystem Services of Forest Park. J. Northeast For. Univ. 2022, 50, 117–123. [Google Scholar] [CrossRef]
  34. Chen, Y. Research on the Effect of Forest Protection in Khan Ma National Nature Reserve of Daxing’anling Mountains of Inner Mongolia. Ph.D. Thesis, Beijing Forestry University, Beijing, China, 2014. [Google Scholar]
  35. Peng, Y.; Tian, X.L.; Zhang, X.P.; Teliewuhan, K.; Chen, X.; Wang, X.J.; Xu, L. Preliminary Estimation of Forest Quality in Xinjiang Based on Continuous Forest Resource Data. J. Nanjing For. Univ. Nat. Sci. Ed. 2019, 45, 96–102. [Google Scholar] [CrossRef]
  36. Wu, C.; Jiang, A.D.; Zheng, W. Study on the Measures for Optimizing China’s Provincial Territorial Space Based on the Perspective of Resource and Environmental Carrying Capacity in the New Situation. Sustainability 2022, 14, 13754. [Google Scholar] [CrossRef]
  37. Ji, Y.F.; Jia, L.J.; Yang, L.A.; Li, Y.L.; Dong, Q.H. Spatio-temporal Evolution and Prediction Analysis of Habitat Quality in Yulin City Coupled with InVEST-PLUS Model. J. Soil Water Conserv. 2023, 37, 123–132. [Google Scholar] [CrossRef]
  38. Yin, Q.D.; Liu, C.X.; Tian, Y. Spatio-Temporal Greenness and Anthropogenic Analysis in Shaanxi Based on MODIS NDVI from 2001 to 2018. Acta Ecol. Sin. 2021, 41, 1571–1582. [Google Scholar] [CrossRef]
  39. Jing, B.; Li, T.X.; Wen, B.Q.; Cheng, W.H. Population-Economy Spatial Pattern and Impact Mechanism of the Qinba Mountain Area Based on Topographic Factors. Sci. Geogr. Sin. 2020, 40, 793–803. [Google Scholar] [CrossRef]
Figure 1. Location of study area.
Forests 14 01929 g001
Figure 2. Forest resource quality index of Yulin City.
Forests 14 01929 g002aForests 14 01929 g002b
Figure 3. Intensity index of human activity in Yulin City.
Forests 14 01929 g003aForests 14 01929 g003b
Figure 4. Cluster map of forest resource quality and human activity intensity.
Forests 14 01929 g004
Figure 5. Forest resource quality and human activity intensity clusters, coupled and superimposed spatially.
Forests 14 01929 g005
Table 1. Forest resource quality index system and weight.
IndicatorWeightAssigned Value
12345
Volume per unit area0.4529Directly standardized by Formula (1)
Quality grade of forest land0.0949VIVIIIIII
Age group0.0968OtherYoung forestHalf-mature forestNear-mature forest; overmature forestMature forest
Origin0.1281OtherPlanted forestNatural forest
Soil layer thickness0.1112Directly standardized by Formula (1)
Soil type0.1015Saline stony soilAcidic stony soil; neutral stony soil; calcareous stony soil;
acidic coarse bone soil
White pulped brown coniferous forest soilYellow cinnamon soil; white pulped yellowish-brown soil
Slope0.0006Directly standardized by Formula (1)
Aspect0.0140SouthSoutheast; southwestEast; west; flat groundNortheast; northwestNorth
Table 2. Human activity intensity index system and weight.
IndexWeightMethod of Calculation
Road density0.2389Length of road/area (m/km2)
Percentage of impervious surface area0.2499Impervious surface area/area (%)
Population density0.5112Number of people/area (people/km2)
Table 3. Global Moran’s I for forest resource quality and human activity intensity in Yulin City.
Forest Resource QualityHuman Activity Intensity
Global Moran’s IpZGlobal Moran’s IpZ
20170.2124<0.0186.080.5083<0.01206.11
20200.1972<0.0179.960.5103<0.01206.94
Disclaimer/Publisher’s Note: The statements, opinions and data contained in all publications are solely those of the individual author(s) and contributor(s) and not of MDPI and/or the editor(s). MDPI and/or the editor(s) disclaim responsibility for any injury to people or property resulting from any ideas, methods, instructions or products referred to in the content.

