Brief Report

WGCNA Reveals Genes Associated with Lignification in the Secondary Stages of Wood Formation

1
State Key Laboratory of Tree Genetics and Breeding, Northeast Forestry University, Harbin 150040, China
2
Key Lab Saline Alkali Vegetat Ecol Restorat, Northeast Forestry University, Harbin 150040, China
*
Author to whom correspondence should be addressed.
Forests 2023, 14(1), 99; https://doi.org/10.3390/f14010099
Submission received: 16 November 2022 / Revised: 29 December 2022 / Accepted: 30 December 2022 / Published: 4 January 2023
(This article belongs to the Special Issue Advances in Ecological Genomics of Forest Trees)

Abstract

:
The lignified tissue in the secondary stem is the main source of wood. In this study, we applied RNA-Seq analysis to the poplar stems in three developmental stages, including primary stem (PS), transitional stem (TS), and secondary stem (SS), to identify a total of 2028 genes that were highly expressed in the SS. Gene annotation indicated that the functions of these genes are mainly involved in cell wall biosynthesis, xylem development, and programmed cell death (PCD) processes. Subsequently, we explored the expression pattern of these genes at various developmental stages in the horizontal direction of the wood by ASPwood. The expression of these genes was modularized and correlated with the percentage of lignified xylem, using weighted gene co-expression network analysis (WGCNA). Among the genes, as many as 690 were identified as directly associated with lignification in the SS. In addition, the gene promoter cis-elements and protein interactions were predicted by PlantRegMap and STRING, respectively. The results were introduced into a co-expression network to confirm their relationship. We eventually found 54 TFs dominating this network, of which ADOF1, ATMYB3, AtbZIP44 (Potri.005G231300), ANAC043, ATWRKY40, ATEBP (Potri.010G006800), ARF5, anac075, RAP2.1, ARF16, AT- HSFB3, Potri.014G050000 (from WRKY family), HAT22, AT-HSFB2B, and AtWRKY20 had extremely high connectivity, which may play an important role in the lignification of wood formation at secondary stages.

1. Introduction

Wood has been a major building material since ancient times, and it is a renewable resource that is essential as mankind develops. Land plants produce about 56 billion metric tons of carbon every year, and about half of that is stored in tree species. Most of the tree biomass is wood, which is an important carbon sequestration reservoir, and carbon storage in wood is crucial for balancing the atmospheric carbon dioxide level. Wood formation involves a variety of biological processes that require synergistic regulation among multiple molecular mechanisms, which is focused on the construction, validation, and resolution of hierarchical transcriptional regulatory networks to date. For example, the transcription factors (TFs) that dominate secondary cell wall (SCW) formation in the hierarchical transcriptional regulatory network are mainly NAC and MYB members [1,2,3], and these TFs together with their downstream structural genes associated with SCW biosynthesis and programmed cell death (PCD) dominate the wood formation process. In addition, miRNA regulation [4,5,6,7], alternative splicing [8,9], epigenetic regulation [10,11], and other forms of regulation are also involved in the wood formation process. For instance, the transgenic plants overexpressing PtoMYB156 showed reduced secondary wall thickness of xylem fibres as well as cellulose, lignin, and xylose content compared to wild-type plants [4]. Intron-mediated alternative splicing of wood-associated NAC transcription factor 1B in poplar regulates cell wall thickening during fibre development [12]. Bisulfite sequencing and transcriptome sequencing of MYB, NAC, and FASCICLIN-LIKE AGP 13 showed that the location of cytosine methylation in genes may influence the expression of various transcripts of corresponding genes, which in turn may play an important role in the regulation of lignification [13]. In conclusion, wood formation is a multifaceted, complex biological process that includes numerous molecular mechanisms to be elucidated.
Based on previous studies, in terms of the longitudinal growth of the tree, wood formation can be broadly divided into three stages. With the portion near the apical meristems, where cells primarily undergo primary cell wall division, expansion, and synthesis, are primary stems (PSs) that represent the beginning stages of wood formation. In contrast, the basal stem cells undergoing SCW biosynthesis, lignification, and PCD are secondary stems (SSs), representing the late stages of wood formation. In addition, segments intermediate to PSs and SSs, where cells synthesize SCW components in the inner part of the primary wall, are transitional stems (TSs), representing the intermediate stage of wood formation [14,15,16,17]. For perennial trees, however, the SS is the main source of wood production. On the other hand, based on the horizontal direction of the wood’s development, the cells of the cut surface can be divided into three stages or three categories [18]. The first category is the secondary phloem cells located in the outermost layer and formed by the outward development of cambium cells; the second category is cambium cells; the third category is the xylem cells formed by the inward development of cambium cells [19,20]. These xylem cells can be divided into two categories, where the part close to the cambium is less lignified, and the cells that still have differentiation activity are defined as expansive xylem. The cells further away from the xylem, which have undergone lignification, are known as lignified xylem, and this part is the main source of wood. Based on the horizontal and vertical divisions of the tree, we learn the lignified xylem of the secondary stem is directly related to wood formation. Most current studies on the subject are from a single perspective, horizontal or vertical. Relatively few studies have combined the two aspects to explore the expression of wood formation genes in specific parts of the tree trunk.
Transcriptome sequencing can reveal the relative relationships between genes at the molecular level and is an important tool for studying gene regulation, gene expression, as well as epigenetic and other molecular-level issues [21,22,23,24,25]. Weighted gene co-expression network analysis, which has been widely used in the field of biology [26,27,28,29], has also been used to explore the complex relationships between genes. In this study, we used the WGCNA to explore the transcriptome sequencing results from horizontal and vertical classification of wood formation. The search of gene clusters directly related to the lignified xylem at secondary stages of wood formation enriches molecular mechanisms of wood formation.

2. Results

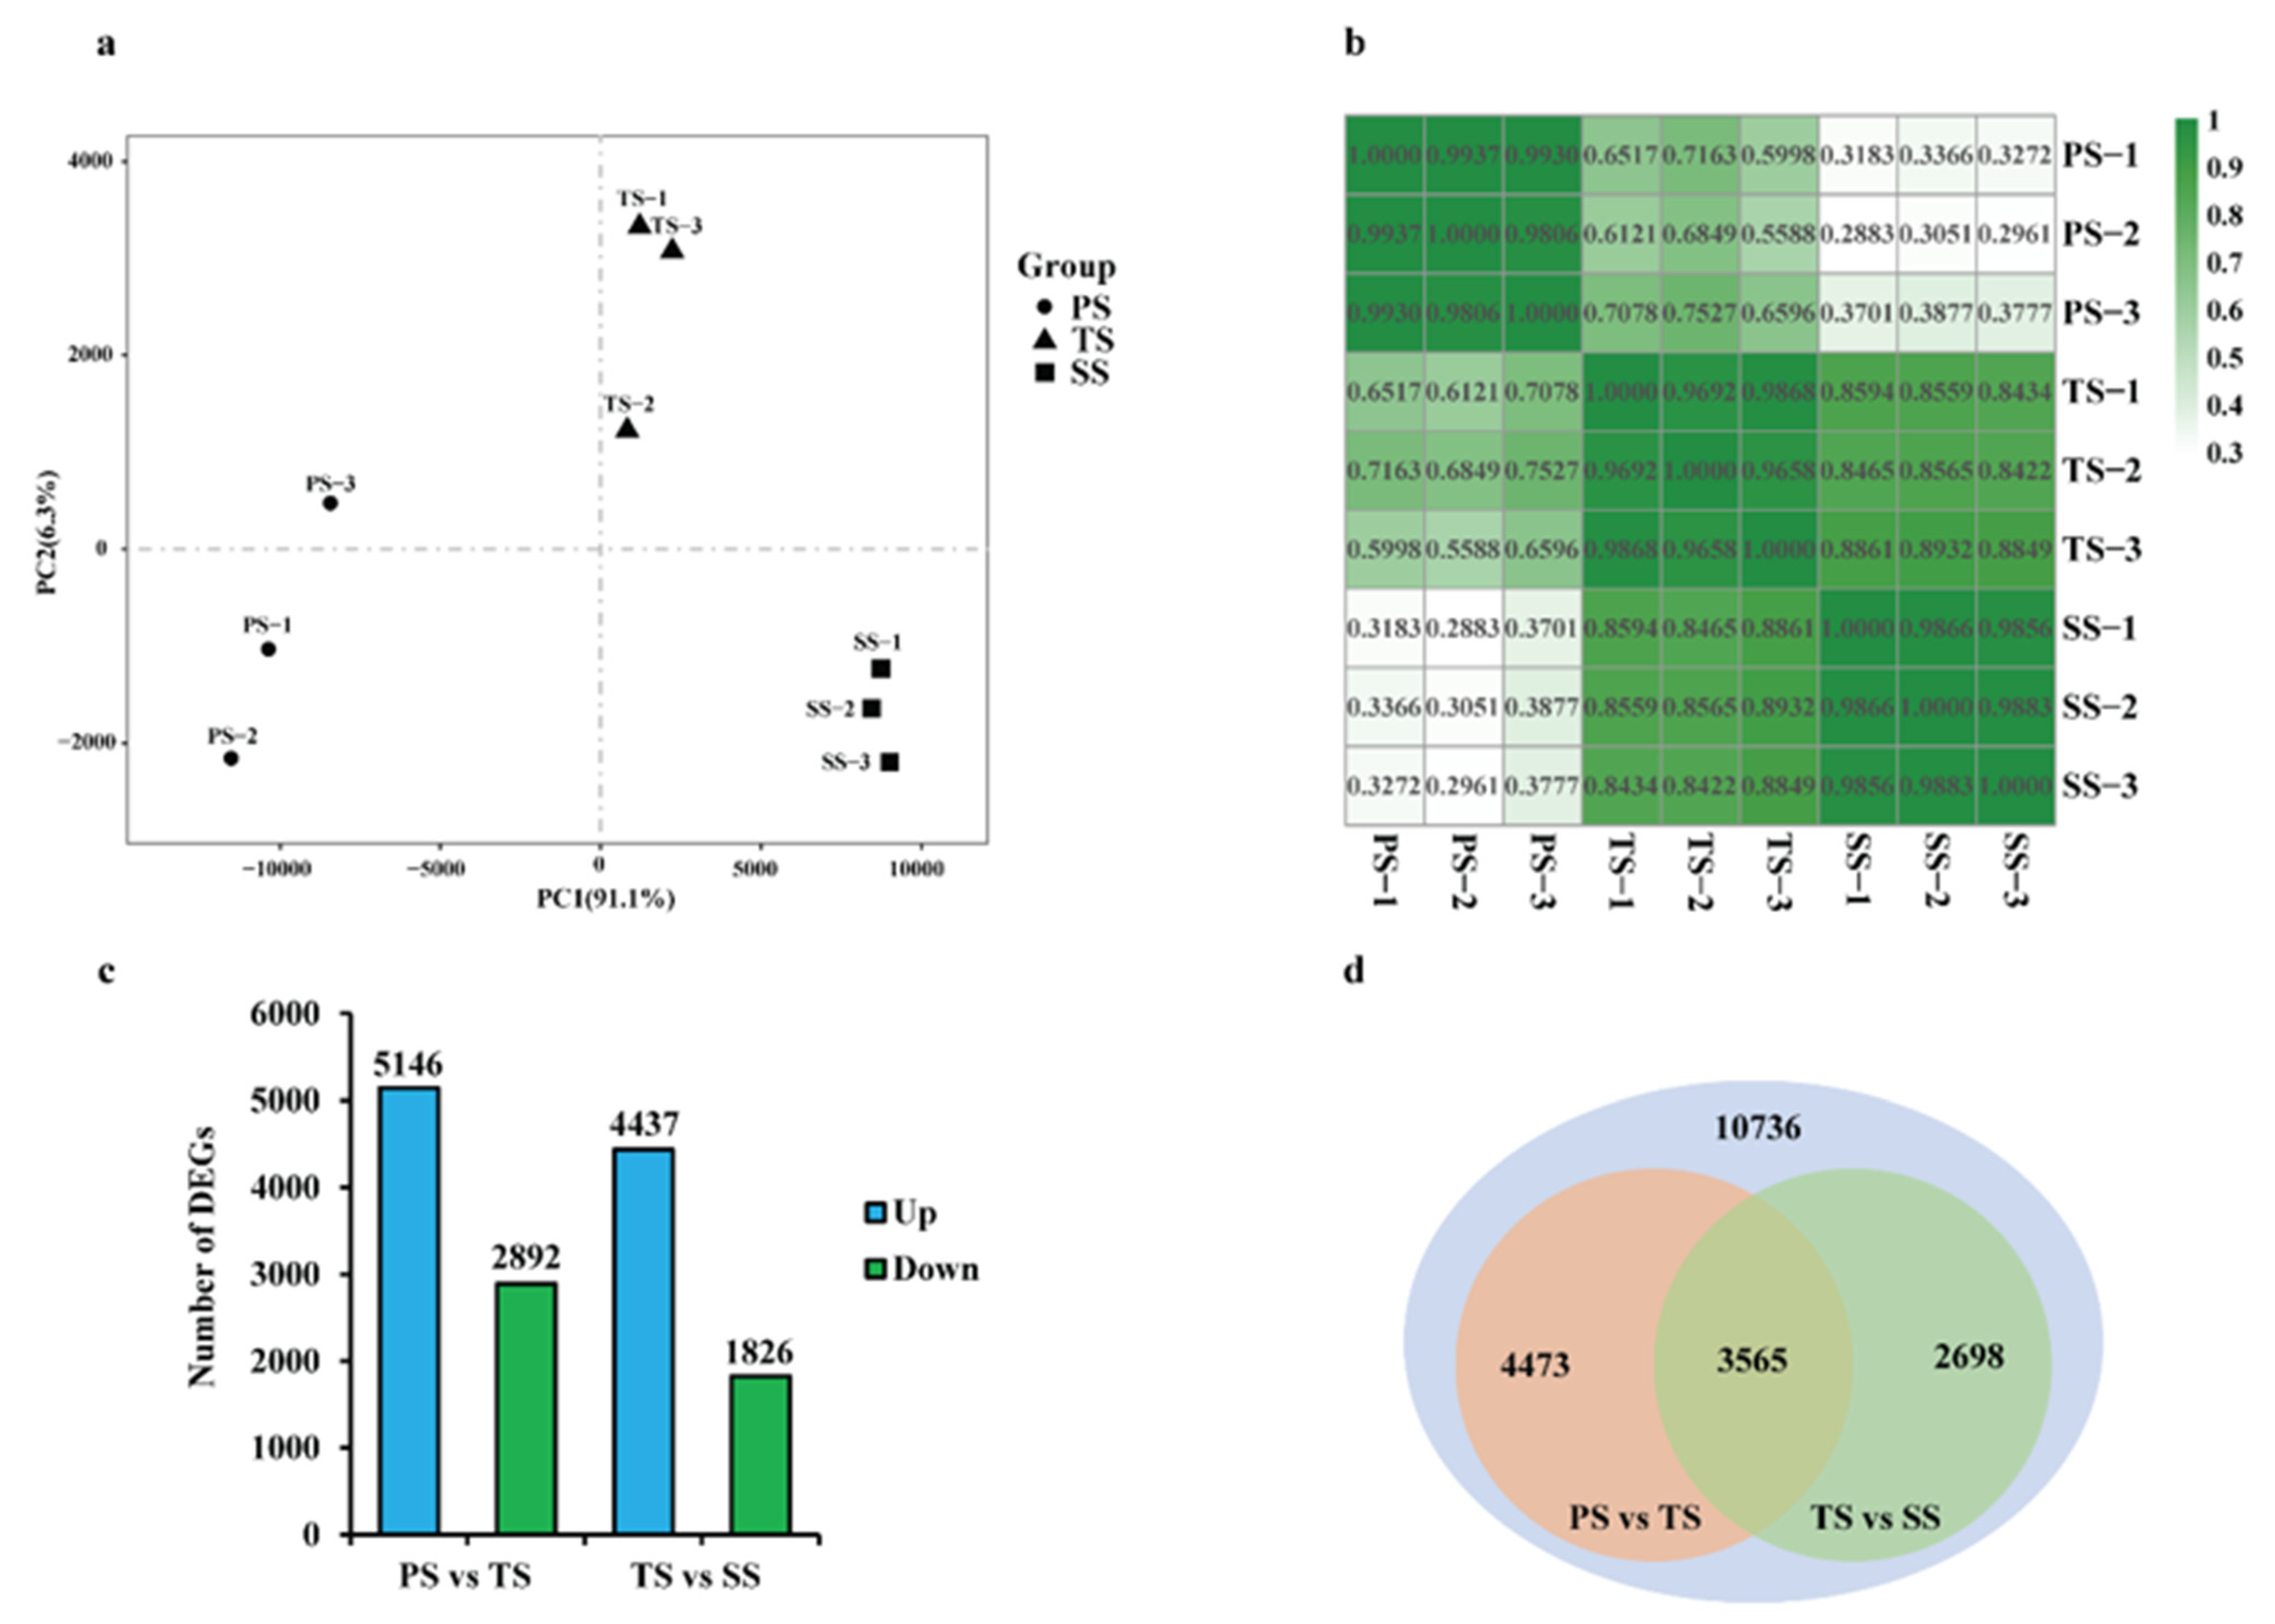
2.1. RNA-Seq Data Collection and Normalization of Poplar Stems during Various Stages of Wood Formation

We downloaded the RNA-Seq data of the primary stems (PS), transitional stems (TS) and secondary stems (SS) of poplar from the Sequence Read Archive (SRA) database. The gene data statistics obtained by Wang et al. [16] showed that an average of 29, 276, 29, 181, and 28, 195 genes were obtained from PS, TS, and SS, respectively (Table S1). We performed Nr annotation of all the genes using Omicshare tools (https://www.omicshare.com/ accessed on 18 September 2022). A total of 32,559 single genes were functionally annotated, representing 78.2% of all acquired genes (Table S2). In addition, the mRNA abundance of all genes at three developmental stems were shown in Table S2. Previous studies that have verified the expression pattern of some genes quantified by qPCR agreed with the RNA-seq results [10,16], indicating the reliability of the data. In previous studies, the validity of using the plastochron indices method to classify the main stems of poplars into different developmental stages has been examined [10]. In the study, we further explored the relationships of all genes identified from the PS, the TS, and the SS by performing principal component analysis (PCA). The results showed that the genes from the PS and the SS were farther apart, the genes from the TS were in the middle of those from the PS and the SS, and the genes from the TS were closer to those from the SS (Figure 1a). The Pearson correlation among samples indicated a closer relationship of the genes from the TS and the SS (Figure 1b), which may be due to the characterization of secondary growth in both stages [10].
To guarantee the differential nature of gene expression contained in the modules obtained by WGCNA, we firstly normalized the RNA-Seq data. Differential expression analysis was performed for all genes using a limma package. Genes with FDR ≤ 0.05 and log2 fold change ≥ 0.5 were prepared for WGCNA. The results showed that there were a total of 8038 differentially expressed genes between the PS and TS, of which 5, 146 were up-regulated and 2892 were down-regulated (Figure 1c, Table S3). In addition, 6263 differentially expressed genes between the TS and SS were found, of which 4437 were up-regulated and 1826 were down-regulated (Figure 1c, Table S4). We then merged the differentially expressed genes obtained into the two groups, the PS vs. the TS and the TS vs. the SS, including a total of 10,736 genes, to form a file containing FPKM information of all genes for WGCNA (Figure 1d, Table S5).

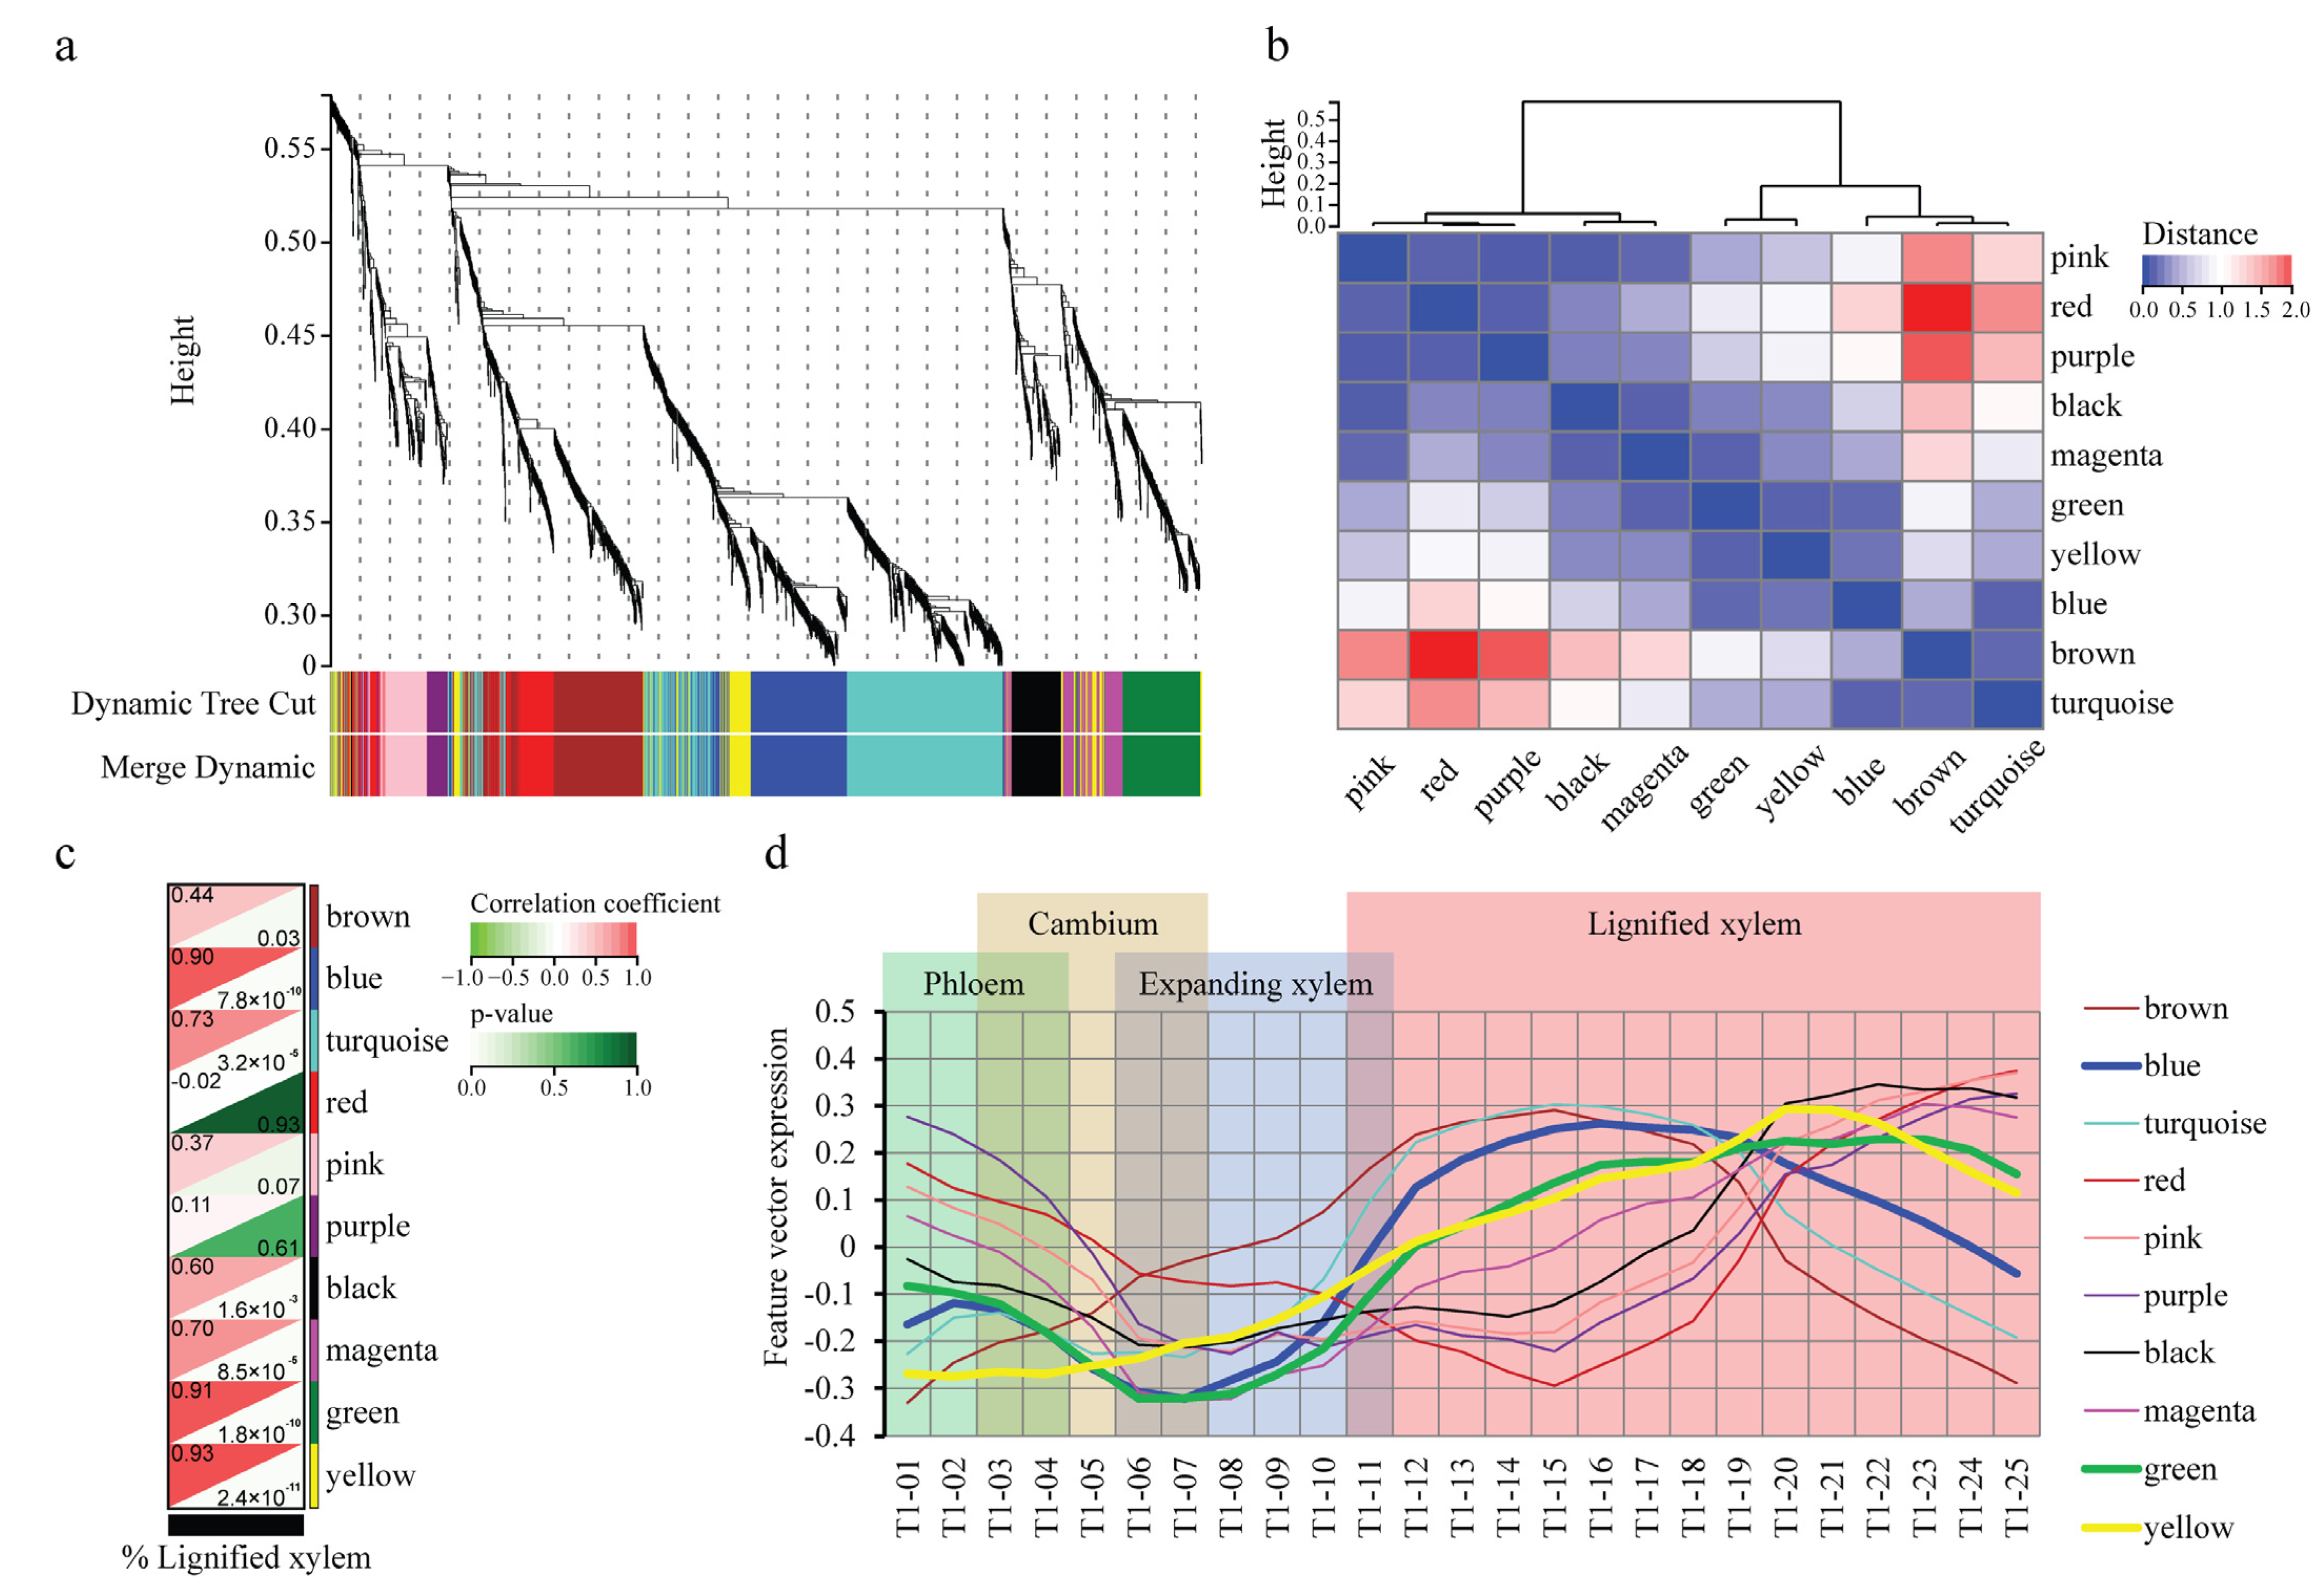
2.2. WGCNA Reveals Modules Related to Different Stages of Poplar Wood Formation

To explore the co-regulatory factors that function at different stages of wood formation, we performed WGCNA of the 10,736 genes, which were grouped into four co-expressed modules with their pairwise correlation evaluation (Figure 2, Tables S6–S9). The four modules could be gathered into two clusters (Figure 2b) that had a high degree of interaction connectivity. Of all the modules, the brown module contained the most genes (3156), followed by the blue module (2028) and the black module (100), and the pink module contained the fewest genes (87). Based on the expression pattern of the modules’ eigengene (ME), we could find that the eigengenes in black and pink modules have a relatively high expression level in the TS (Figure 3a,d,e,h), indicating that they are likely to function during the transition stage of wood formation. The expression pattern of eigengenes in the blue module showed a continuously increasing trend from the PS to the SS, reaching a maximum in the SS, indicating that those genes may function in the secondary stage of wood formation (Figure 3b,f). The expression pattern of the eigengenes in the brown module displayed an opposite trend to those in the blue module, indicating that these genes were likely to function in the primary stage of wood formation (Figure 3c,g).
To detect the biological functions of the genes within the four modules related to wood formation, we performed GO enrichment analysis covered by each module. The three most abundant of significantly enriched biological processes in the black module were cell wall organization or biogenesis, carbohydrate metabolic process, and polysaccharide metabolic process (Table S10). Some significantly enriched biological processes in the black module were the symbolization of the transition stage of wood formation (Figure 4). For example, the enriched biological processes were involved in plant-type SCW biogenesis, lignin biosynthetic process, cell wall polysaccharide biosynthetic process, and so on. The pink module was also enriched in several typical biological processes that related to the transition stage of wood formation (Table S13 and Figure 4), such as cell wall modification, plant-type cell wall organization or biogenesis, plant-type cell wall modification, etc. It suggests that these genes in black and pink modules were likely to play an important role in the transition stage of wood formation. In addition, the GO enrichment indicates that the three most abundant of significantly enriched biological processes were responses to stimulus, regulation of cellular process, and to chemicals in the blue module (Table S11). It also included the biological processes associated with the secondary stages of wood formation, such as cell wall macromolecule biosynthetic process, xylem development, PCD, and regulation of cell death (Figure 4), indicating that the genes in the blue module may play an important role in the late stages of wood formation. The GO enrichment shows that the three most abundant of significantly enriched biological processes were the organic substance metabolic process, the primary metabolic process, and the cellular metabolic process in the brown module (Table S12). Most of the significant GO terms are biological processes associated with the primary development of wood formation in this module (Figure 4), such as regulation of meristem growth, asymmetric cell division, cytokinesis, and plant epidermal cell differentiation.
Overall, the eigengenes in the brown module were mainly related to the biological processes associated with the primary stage of wood formation, while the eigengenes in the black, pink and blue modules were mostly related to the biological processes involved in the transition of the secondary stage in wood formation. However, the black and pink modules do not contain as many biological processes related to lignification as the blue module, probably because the lignification degree of the SS is much higher than that of the TS, which is also suggested in the tissue sections of the PS, TS, and SS by Zhang et al. [10]. Therefore, we performed further analysis of the eigengenes in the blue module to explore lignification-related genes.

2.3. WGCNA Reveals Genes Associated with Lignification

To study the genes associated with lignification in the SS high expression module (SSHE/blue module), we obtained a high-resolution expression atlas derived for the eigengenes of the SSHE module, referred to as the “AspWood” database [18]. In the study, we profiled the expression patterns of 1930 genes, representing 95.17% of all eigengenes in the SSHE module (Table S14). Based on WGCNA, these genes were grouped into 10 co-expression modules, which were then assessed for their pairwise correlation (Figure 5a,b). Of all the modules, the turquoise module contained the most eigengenes (469 genes), and the magenta module had the fewest members (95 genes) (Table S15). To further identify the gene modules associated with lignification, we obtained data from the ASPwood on the %lignified xylem from T1-01 to T1-25 [19] and estimated their correlation among each module and the %lignified xylem. The results showed that the expression level of eigengenes in the three modules, including the blue module (329 genes), the green module (176 genes) and the yellow module (185 genes), was strongly and significantly positively correlated with the rate of lignified xylem (Correlation ≥ 0.90, p-value ≤ 0.05) (Figure 5c, Figures S1–S3). In particular, the eigengenes in the three modules were highly expressed in the lignified xylem, while lowly expressed in the phloem (Figure 5d), cambium and expanding xylem, suggesting that these genes may have important functions in the lignified xylem.
We then performed a GO enrichment analysis of all eigengenes in blue, green and yellow modules to clarify their functions. The results showed that a total of 149 significantly enriched GO terms were obtained, including 126 biological process related terms, 11 cellular component related terms and 12 molecular function related terms (Table S16). In the biological process category, the three most abundant significantly enriched terms were regulation of the biological process, response to chemical process, and the organic cyclic compound biosynthetic process. In the cellular component category, the three most abundant significantly enriched terms were cell periphery, plasma membrane, and anchoring junction. In the molecular function category, the three most abundant significantly enriched terms were cation binding, metal ion binding, and transition metal ion binding. In addition, we identified multiple significantly enriched biological processes associated with lignification, including 11 processes associated with the cell wall or SCW biosynthetic, biogenesis or metabolic processes; eight associated with xylem development, lignin and xylan synthesis; and five involved in cell death or PCD (Table S16, Figure 6). Overall, the eigengenes in the three modules were highly expressed in the lignified xylem, which also function in lignification-related biological processes.

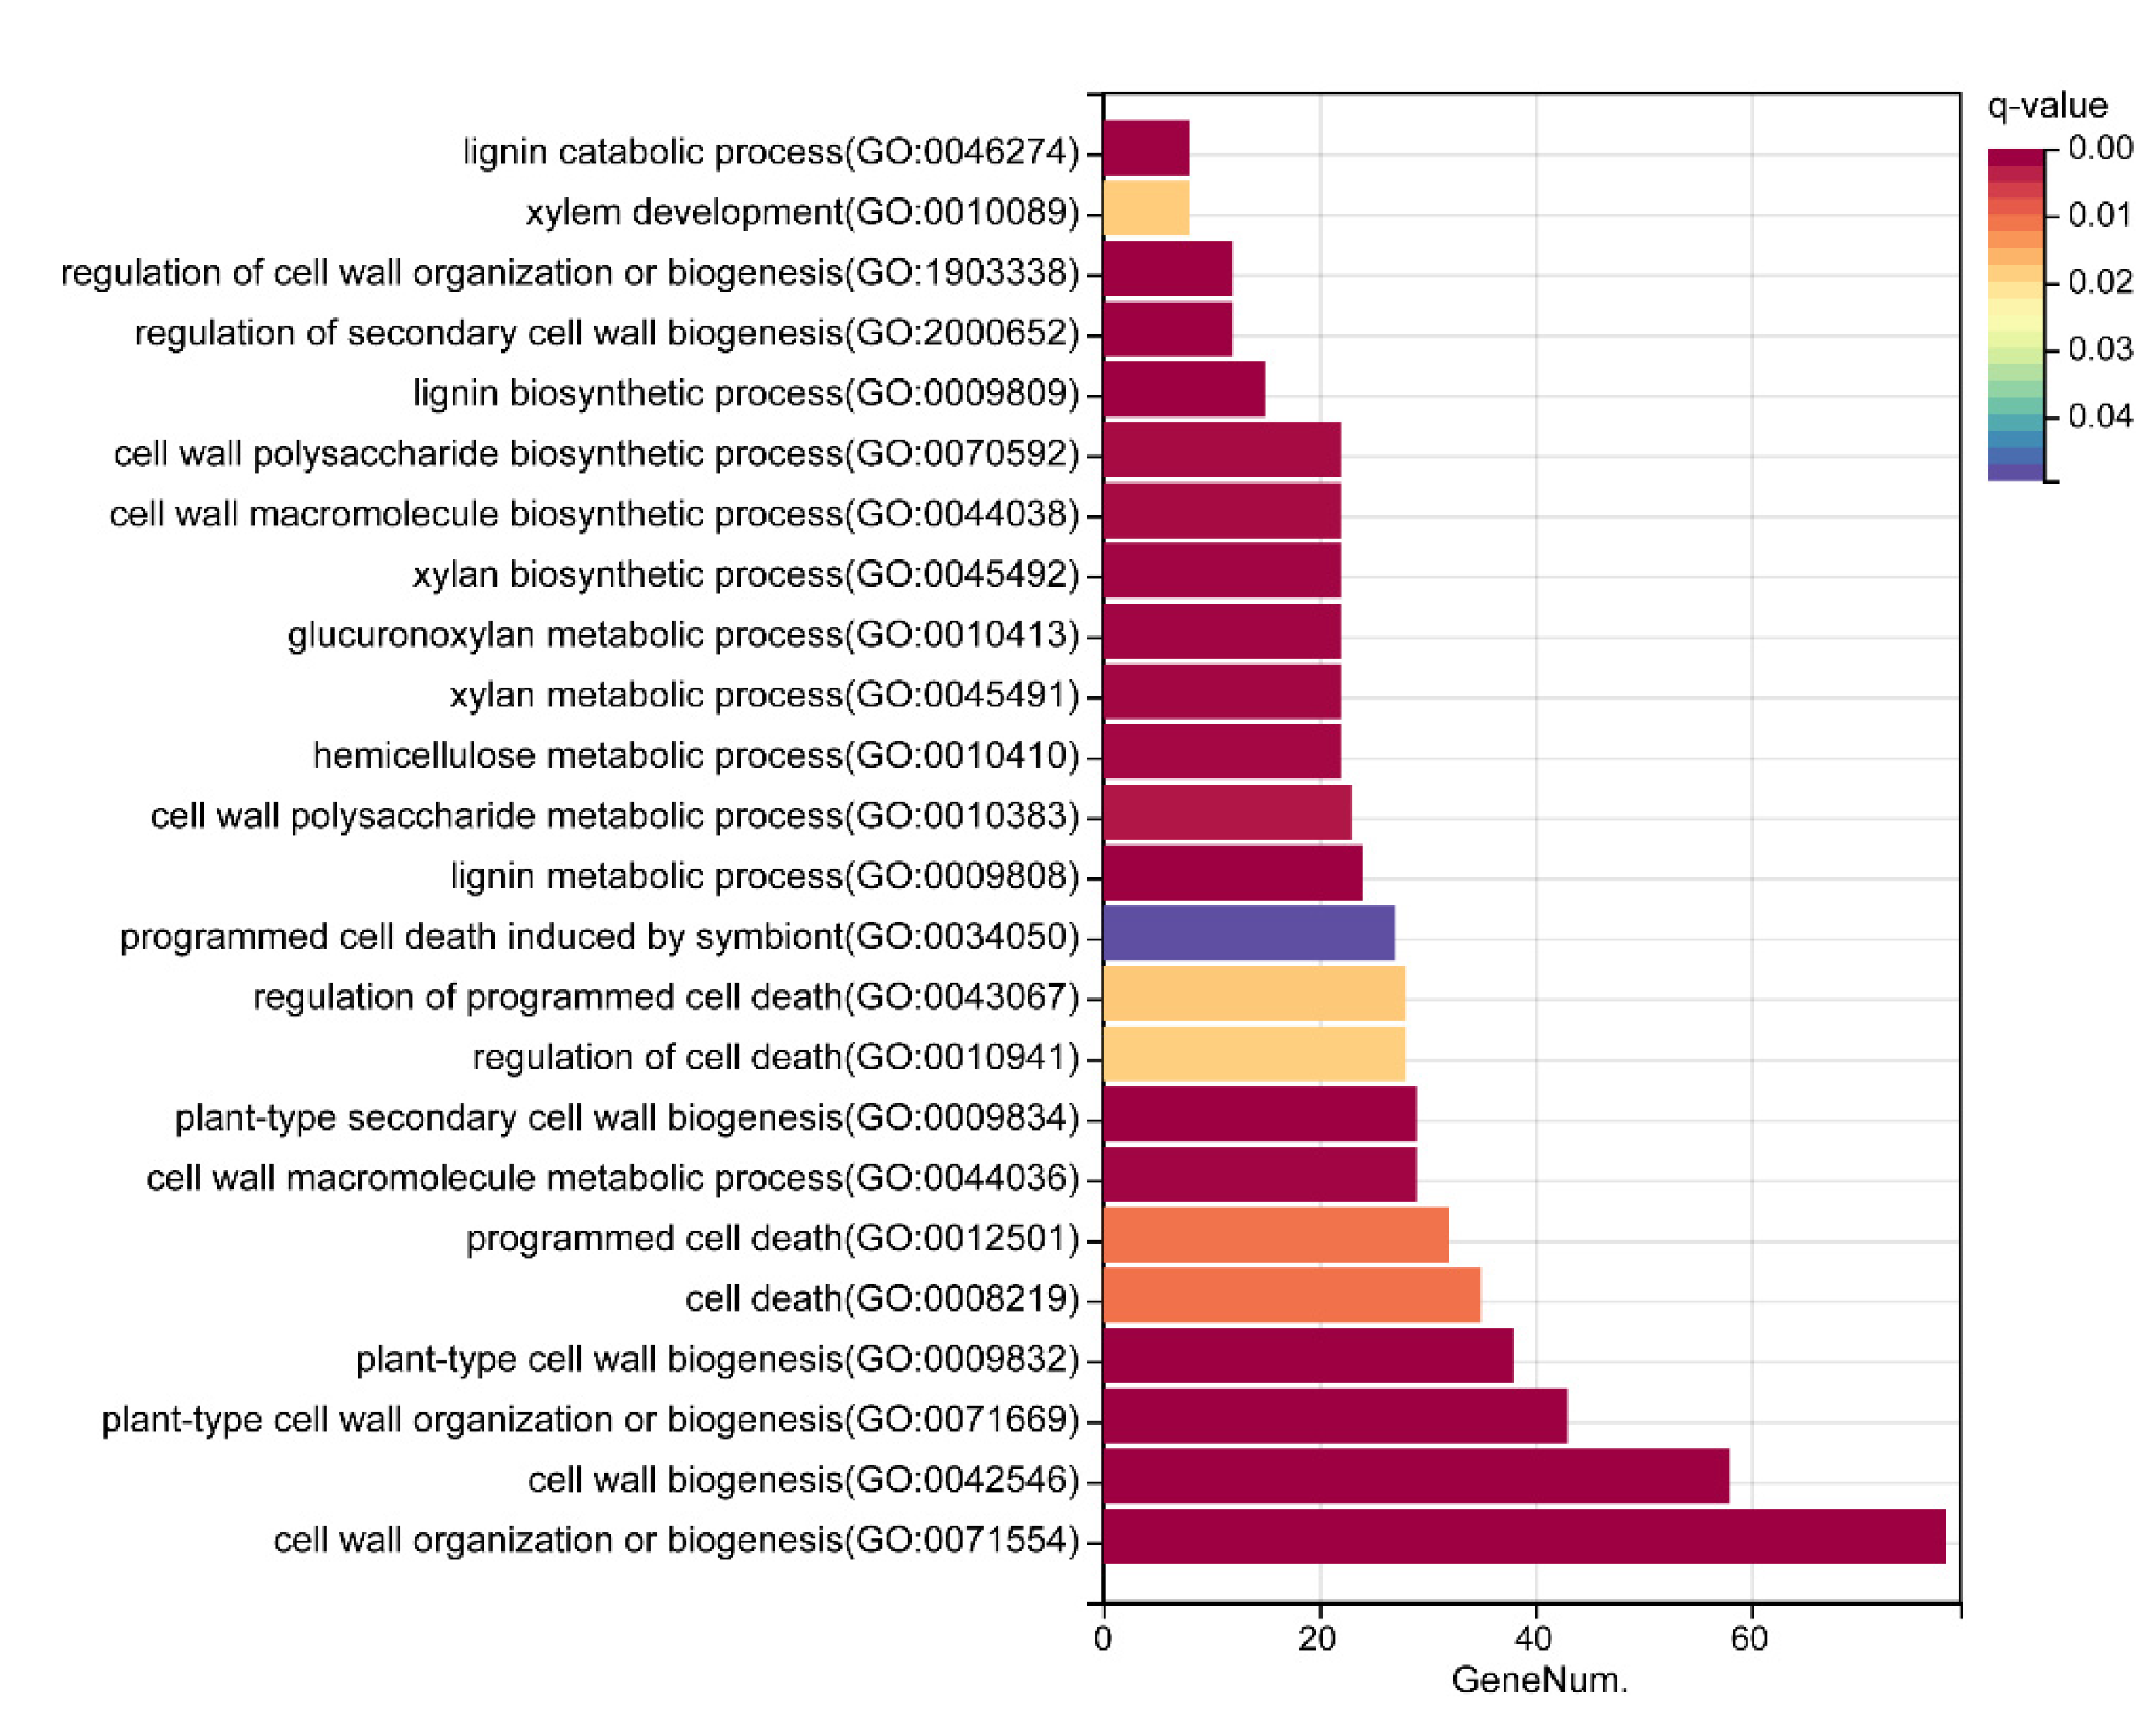
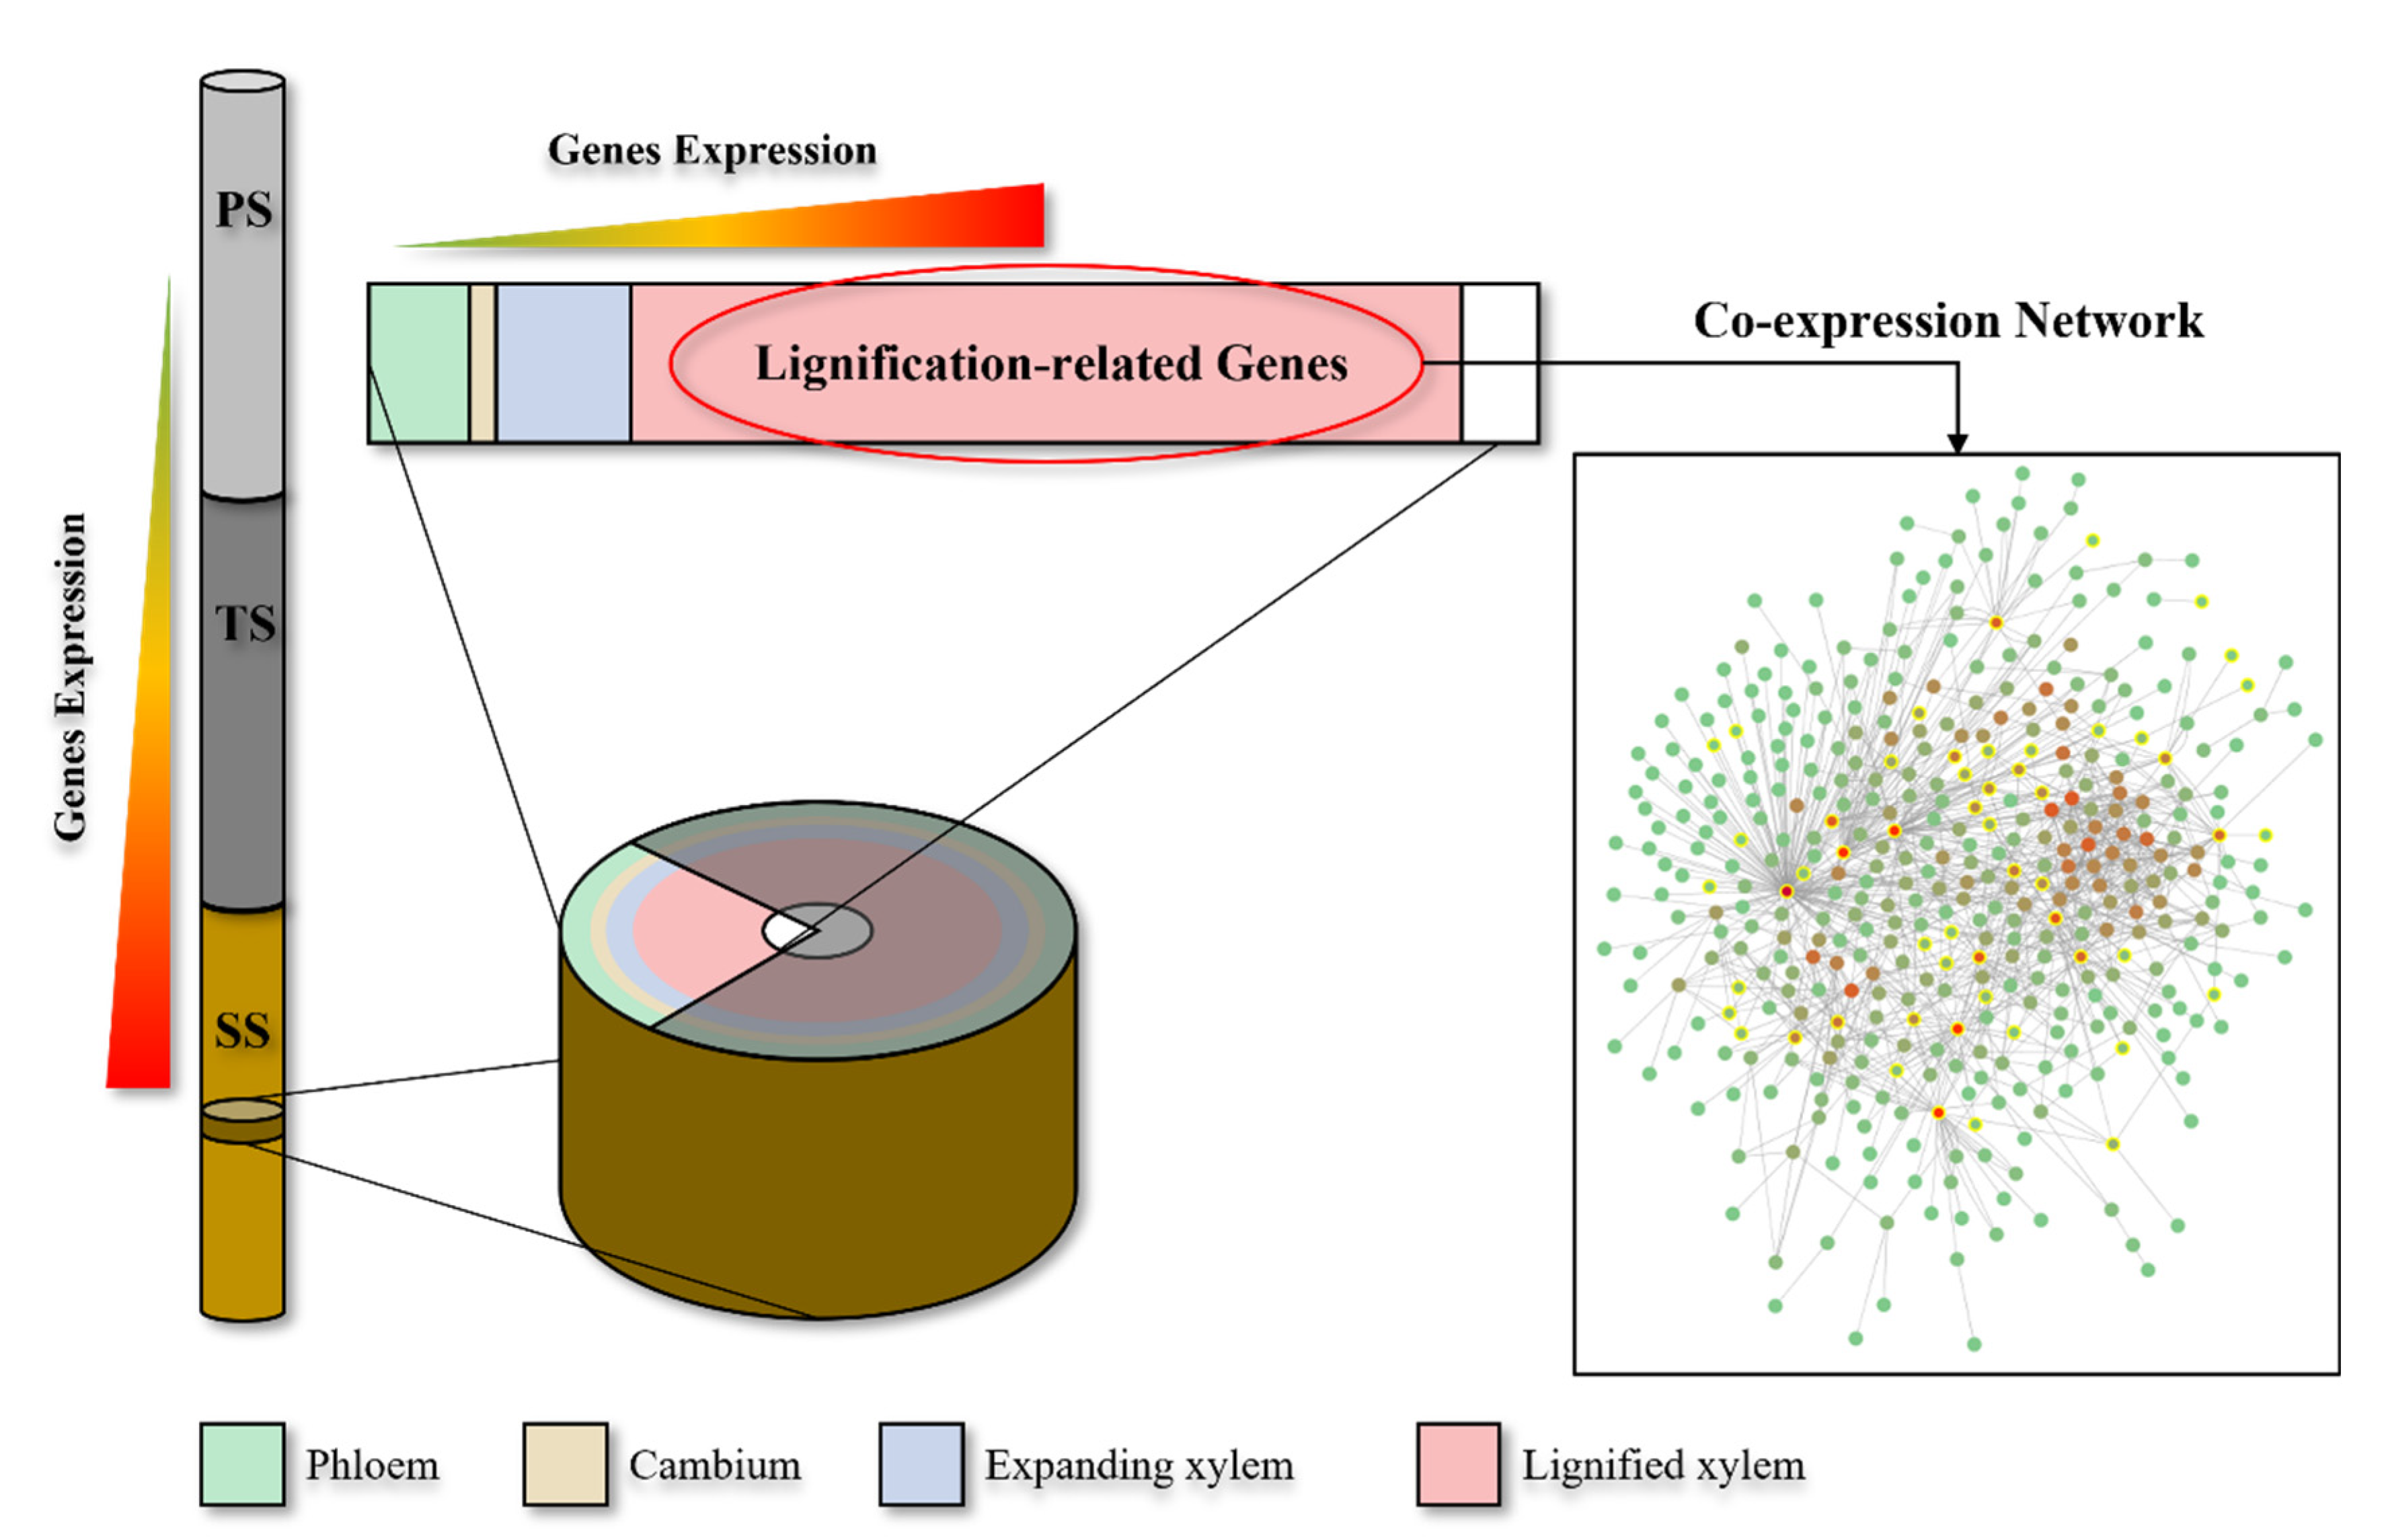
2.4. The Construction and Functional Analysis of the Co-Expression Network of the Modules Related to the Lignification of the Secondary Stem in Wood Formation

In the study, we introduced predicted results from two online sites, PlantRegMap [30] and STRING, for identifying the promoter cis-elements of downstream genes and protein interactions, respectively. We obtained 420 and 518 linkage relationships between genes pairs by PlantRegMap and STRING, respectively. These linkage pairs can also be found in the co-expression network; all such pairs have weight values greater than 2.0, indicating that these linkage pairs were strongly correlated. Then, the tripartite results were integrated to form a new and highly interactive co-expression network (Figure S4, Table S17, and Table S18), which contained a total of 417 protein-coding genes, including 54 transcription factors (TFs). These TFs had a high degree of connectivity in the network, acting as network hubs. In addition, some proteins predicted by STRING had high connectivity clusters and were likely interacted (Figure S4). For example, P8, P9, P10, P60, P61, and P63 had a high degree of connectivity. They were at the bottom of the network and directly involved in regulating lignification-related biological processes.
To further elucidate network function, we first extracted all of the TFs (Figure 7) from the co-expression network. Most of those TFs came from MYB (9 genes), ERF (5 genes), HD-ZIP (5 genes), and WRKY (5 genes) families, and all of those families have been reported to be involved in biological processes related to lignification in plants [31,32,33,34,35,36]. Of all the TFs, 15 were highly connected, including ADOF1, ATMYB3, AtbZIP44 (Potri.005G231300), ANAC043, ATWRKY40, ATEBP (Potri.010G006800), ARF5, anac075, RAP2.1, ARF16, AT-HSFB3 (Potri.014G050000) (from WRKY family), HAT22, AT-HSFB2B, and AtWRKY20 (Figure 7, Table 1). They were likely to act as key regulatory genes during the lignification of secondary stems. In addition, we obtained genes in the blue, green, and yellow modules involved in the lignification biological processes based on GO enrichment analysis, and we captured the linkage relationships between the genes in the co-expression network. As shown in Figure 8 and Table S19, the co-expression network related to lignification can be roughly divided into four clusters, with Cluster 1 mainly consisting of 7 GO terms involved in cell wall/SCW biosynthesis (GO1-GO5, GO10-11), Cluster 2 consisting of 8 GO terms involved in the cell wall macromolecule/polysaccharide biosynthetic/metabolic and xylan/hemicellulose biosynthetic/metabolic process (GO6-9, GO12-14, GO18). The interaction between clusters 1 and 2 was strong, while it was independent between Cluster 3 and 4, with Cluster 3 mainly consisting of GO terms related to cell death and PCD (GO20-24) and Cluster 4 mainly consisting of GO terms related to lignin biosynthesis and metabolism (GO15-17). As shown in Figure 8, there were 15 TFs directly linked to GO terms in cluster 1, namely TF7 (IRX11/KNAT7), TF9 (ANAC043), TF10 (ANAC073), TF13-20 (MYBs), TF27-29 (HD-ZIPs) and TF53 (ARF5), suggesting that these TFs and surrounding structural genes were associated with cell wall/SCW biosynthesis. We also found that TF7 (IRX11), TF10 (ANAC073), TF18 (ATMYB61), TF29 (ATHB-8), and surrounding structural genes were connected to GO terms of both cluster 1 and 2. TF9 (ANAC043) was connected to GO terms of both cluster 1 and 3. In addition, Cluster 3 contained a total of four TFs, TF1 (ATWRKY40), TF35 (ATEBP, Potri.010G006800), TF36 (ATEBP, Potri.008G210900) and TF39 (AtEIN3). Among them, TF1 and TF35 were from WRKY and ERF families, respectively, which had high connectivity. Finally, we found a single TF related to Cluster 4, TF9 (ANAC043), yet it was more closely connected to Cluster 1. However, Cluster 4 contained several structural genes with high connectivity, namely P8 (ATCAD4), P9 (ATOMT1), P10 (CCOAMT), P60 (ATC4H, Potri.013G157900), P61 (ATC4H, Potri.019G130700), P62 (ATCCR1, Potri.001G046100), P63 (ATCCR1, Potri.003G181400), P64 (ATPAL1, Potri.006G126800), P65 (ATPAL1, Potri.008G038200), P66 (ATPAL1, Potri.010G224200), and P67 (ATPAL1, Potri.016G091100). All of these genes have been reported as functional genes in the lignin synthesis [37,38,39,40,41,42,43,44].

2.5. Confirmation of RNA-Seq Profiles by Quantitative PCR

To verify the accuracy of RNA-Seq results, we used qPCR to quantify the relative expression level of 15 hub genes in SSHE/blue module of co-expression network. As shown in Figure S5, qPCR results were highly consistent with RNA-seq results (Table S20). All of the 15 genes were highly expressed in SS by RNA-Seq analysis (Figure 3b), and qPCR results showed that these 15 genes were significantly up-regulated in the SS, which demonstrated the reliability of the RNA-Seq.

3. Discussion

3.1. Candidate Genes Directly Related to Lignification of Secondary Stem

So far, the study of lignification continues to be a hot topic in woody plants, and it is directly related to wood formation and yield. The vertical segments of a less than one-year-old poplar include all processes of wood formation, which can be divided into three phases, including beginning (PS), middle (TS), and late (SS) phases (Figure 9). In the study, we first identified a total of 2028 genes highly expressed in poplar SS by RNA-Seq. The functions of these genes were mainly involved in cell wall biosynthesis, xylem development and PCD processes in the late stage of wood formation (Figure 4 and Table S11), which is consistent with previous findings [14,15]. Subsequently, WGCNA was performed to profile the expression of these genes in the horizontal direction of SS (Figure 9). By correlation analysis with %lignified xylem data, we obtained three significant positive correlation modules including blue, green, and yellow modules, which were consistently highly expressed in the lignified xylem. The three modules contain a total of 690 eigengenes (Table S15) and GO enrichment of these genes revealed the presence of multiple plant lignification processes, such as cell wall biosynthesis, xylem development, and PCD (Table S16, Figure 6). The eigengenes reflect the physiological characteristics of the lignified xylem and may likewise be essential in the lignification of SS in wood formation.

3.2. Co-Expression Network and Gene Function Related to Lignification of Secondary Stem in Poplar

In the study, we combined the co-expression relationships between genes, the binding relationships between TFs and promoter cis-elements of downstream genes, and the protein interaction relationships to obtain a comprehensive regulatory network associated with lignification of SS in wood formation (Figure S4, Tables S17 and S18). To clarify the network, we first extracted all TFs in the network, with the central region being TFs with connectivity >14. Among them, we found that 15 of these TFs had been reported to be involved in biological processes related to lignification (Table 1). As we know, the deposition of secondary walls requires coordinated expression of secondary wall biosynthetic genes, and the process was controlled by secondary wall transcriptional network. In this transcriptional network, the secondary wall associated NAC and MYB TFs act as top-level and second-level master switches, respectively, which together activate a suite of downstream TFs and secondary wall biosynthetic genes [1,37]. Among the TFs we identified, two NAC genes, ANAC043 and ANAC073/SND2, have previously been reported to be involved in secondary wall thickening in poplar and Arabidopsis [1,37,45,47]. Eight other genes from the MYB family have also been reported to be potentially involved in transcriptional regulation during SCW deposition (Table 1) [1,37,45,47,48]. IXR11/KNAT7 and ASL11 have been reported to be involved in the process of SCW thickening in Arabidopsis [1,37,45]. In addition, three TFs from HD-ZIP family were reported to be possibly associated with the secondary xylem and phloem [49,50]. In conclusion, the specifically highly expressed TFs in the lignified xylem act as hubs in the co-expression network, suggesting that they are likely to function in the lignification process by regulating structural genes directly affecting the secondary stage of wood formation.
In the study, a total of 19 TFs were included in the GO-extracted network, five of which were highly concatenated, namely, TF1 (ATWRKY40), TF9 (ANAC043), TF10 (ANAC073), TF35 (ATEBP, Potri.010G006800) and TF53 (ARF5). The five genes were highly expressed in the lignified xylem of SS and the structural genes linking to them had similar expression pattern, which indicated that the TFs were likely to play a regulatory role in lignification process by regulating the expression of downstream structural genes. In addition, some structural genes in the network had high connectivity. For example, P310 (ATMAP70-5), linked to Clusters 1 and 2, is a microtubule-associated protein, which is associated with SCW pattern during xylem differentiation [51,52]. MAPK pathways play crucial roles in developmental and adaptive responses, and also regulates plant cell death [53,54]. P89 (ATMAPK3), a mitogen-activated protein kinase, had the highest connectivity of the structural genes directly linked to Cluster 3. We also identified three structural genes, including P92 (ATLMCO4/PtrLAC17, Potri.008G064000), P93 (ATLMCO4/PtrLAC27, Potri.010G193100) and P94 (LAC11/PtrLAC16) that were all linked to Clusters 1, 2, and 4, which had high connectivity in the co-expression network. The three laccases were reported to be preferentially expressed in developing the xylem and may be used for monolignol polymerization [37,55]. Interestingly, most of the structural genes that were directly linked to Cluster 4 had high connectivity, which can be regarded as an important control point in regulating carbon flux of lignin biosynthesis. For example, the downregulation of CCRs leads to decreased lignin content and changes the lignin composition [38,39,40,41,42,43,44]. The other genes with high connectivity were also reported to be involved in lignin synthesis [56]. Overall, these structural genes were highly expressed in the lignified xylem of SS, which may be regulated by TFs to function in the lignification process.

4. Conclusions

In this study, we identified a total of 2028 genes that were highly expressed in secondary stages of wood formation in the poplar by WGCNA. Among them, the expression patterns of 1930 genes in phloem, cambium, expanding xylem and lignified xylem were profiled using the ASPwood database, which can be divided into 10 modules using WGCNA. In addition, the correlation relationships of the modules with corresponding %lignified xylem of different cut layers reported by ASPwood were analyzed, with three modules showing a significant positive correlation with %lignified xylem. GO enrichment revealed that the genes in the three modules were mainly involved in lignification-related biological processes. Moreover, the relationships between the genes obtained by WGCNA were calibrated using PlantRegMap and STRING, respectively, resulting in a comprehensive co-expression network associated with lignification. The network contained a total of 54 TFs, 15 of which had extremely high connectivity; these act as central hub genes in the lignification process in the secondary stage of wood formation.

5. Materials and Methods

5.1. RNA-Seq Data Collection

RNA-Seq data of poplar stems at three development stages, including primary stems, (PS), transitional stems (TS), and secondary stems (SS), with three respective biological replicates were downloaded from the Sequence Read Archive (SRA) database with the accession number PRJNA628501.

5.2. Gene Differential Expression Analysis

Differential expression analysis of genes was performed using limma in R package (version 3.40.6) [57]. Based on expression profile dataset, the genes with an expression value of 0, which were present in ≥50% of all samples, were removed. A more relaxed threshold of FDR ≤ 0.05 and log2 fold change ≥ 0.5 was used for filtering differentially expressed genes for WGCNA analysis.

5.3. Weighted Gene Co-Expression Network Analysis

We constructed co-expression networks using WGCNA in R package [58], which is a scale-free network construction method that identifies clusters of genes with highly correlated expression profiles. We estimated Pearson correlation coefficients between genes based on FPKM values, converting the correlation matrix into an adjacency matrix. Hierarchical clustering and dynamic tree cut function were used to detect modules, grouping all genes into clusters. For high reliability of the results, the minimum number of genes was set to 30 and the sensitivity was set to 3.0. Gene significance (GS) and module membership (MM) were calculated to correlate modules with phenotypic data. The information of corresponding module genes was extracted for further analysis.

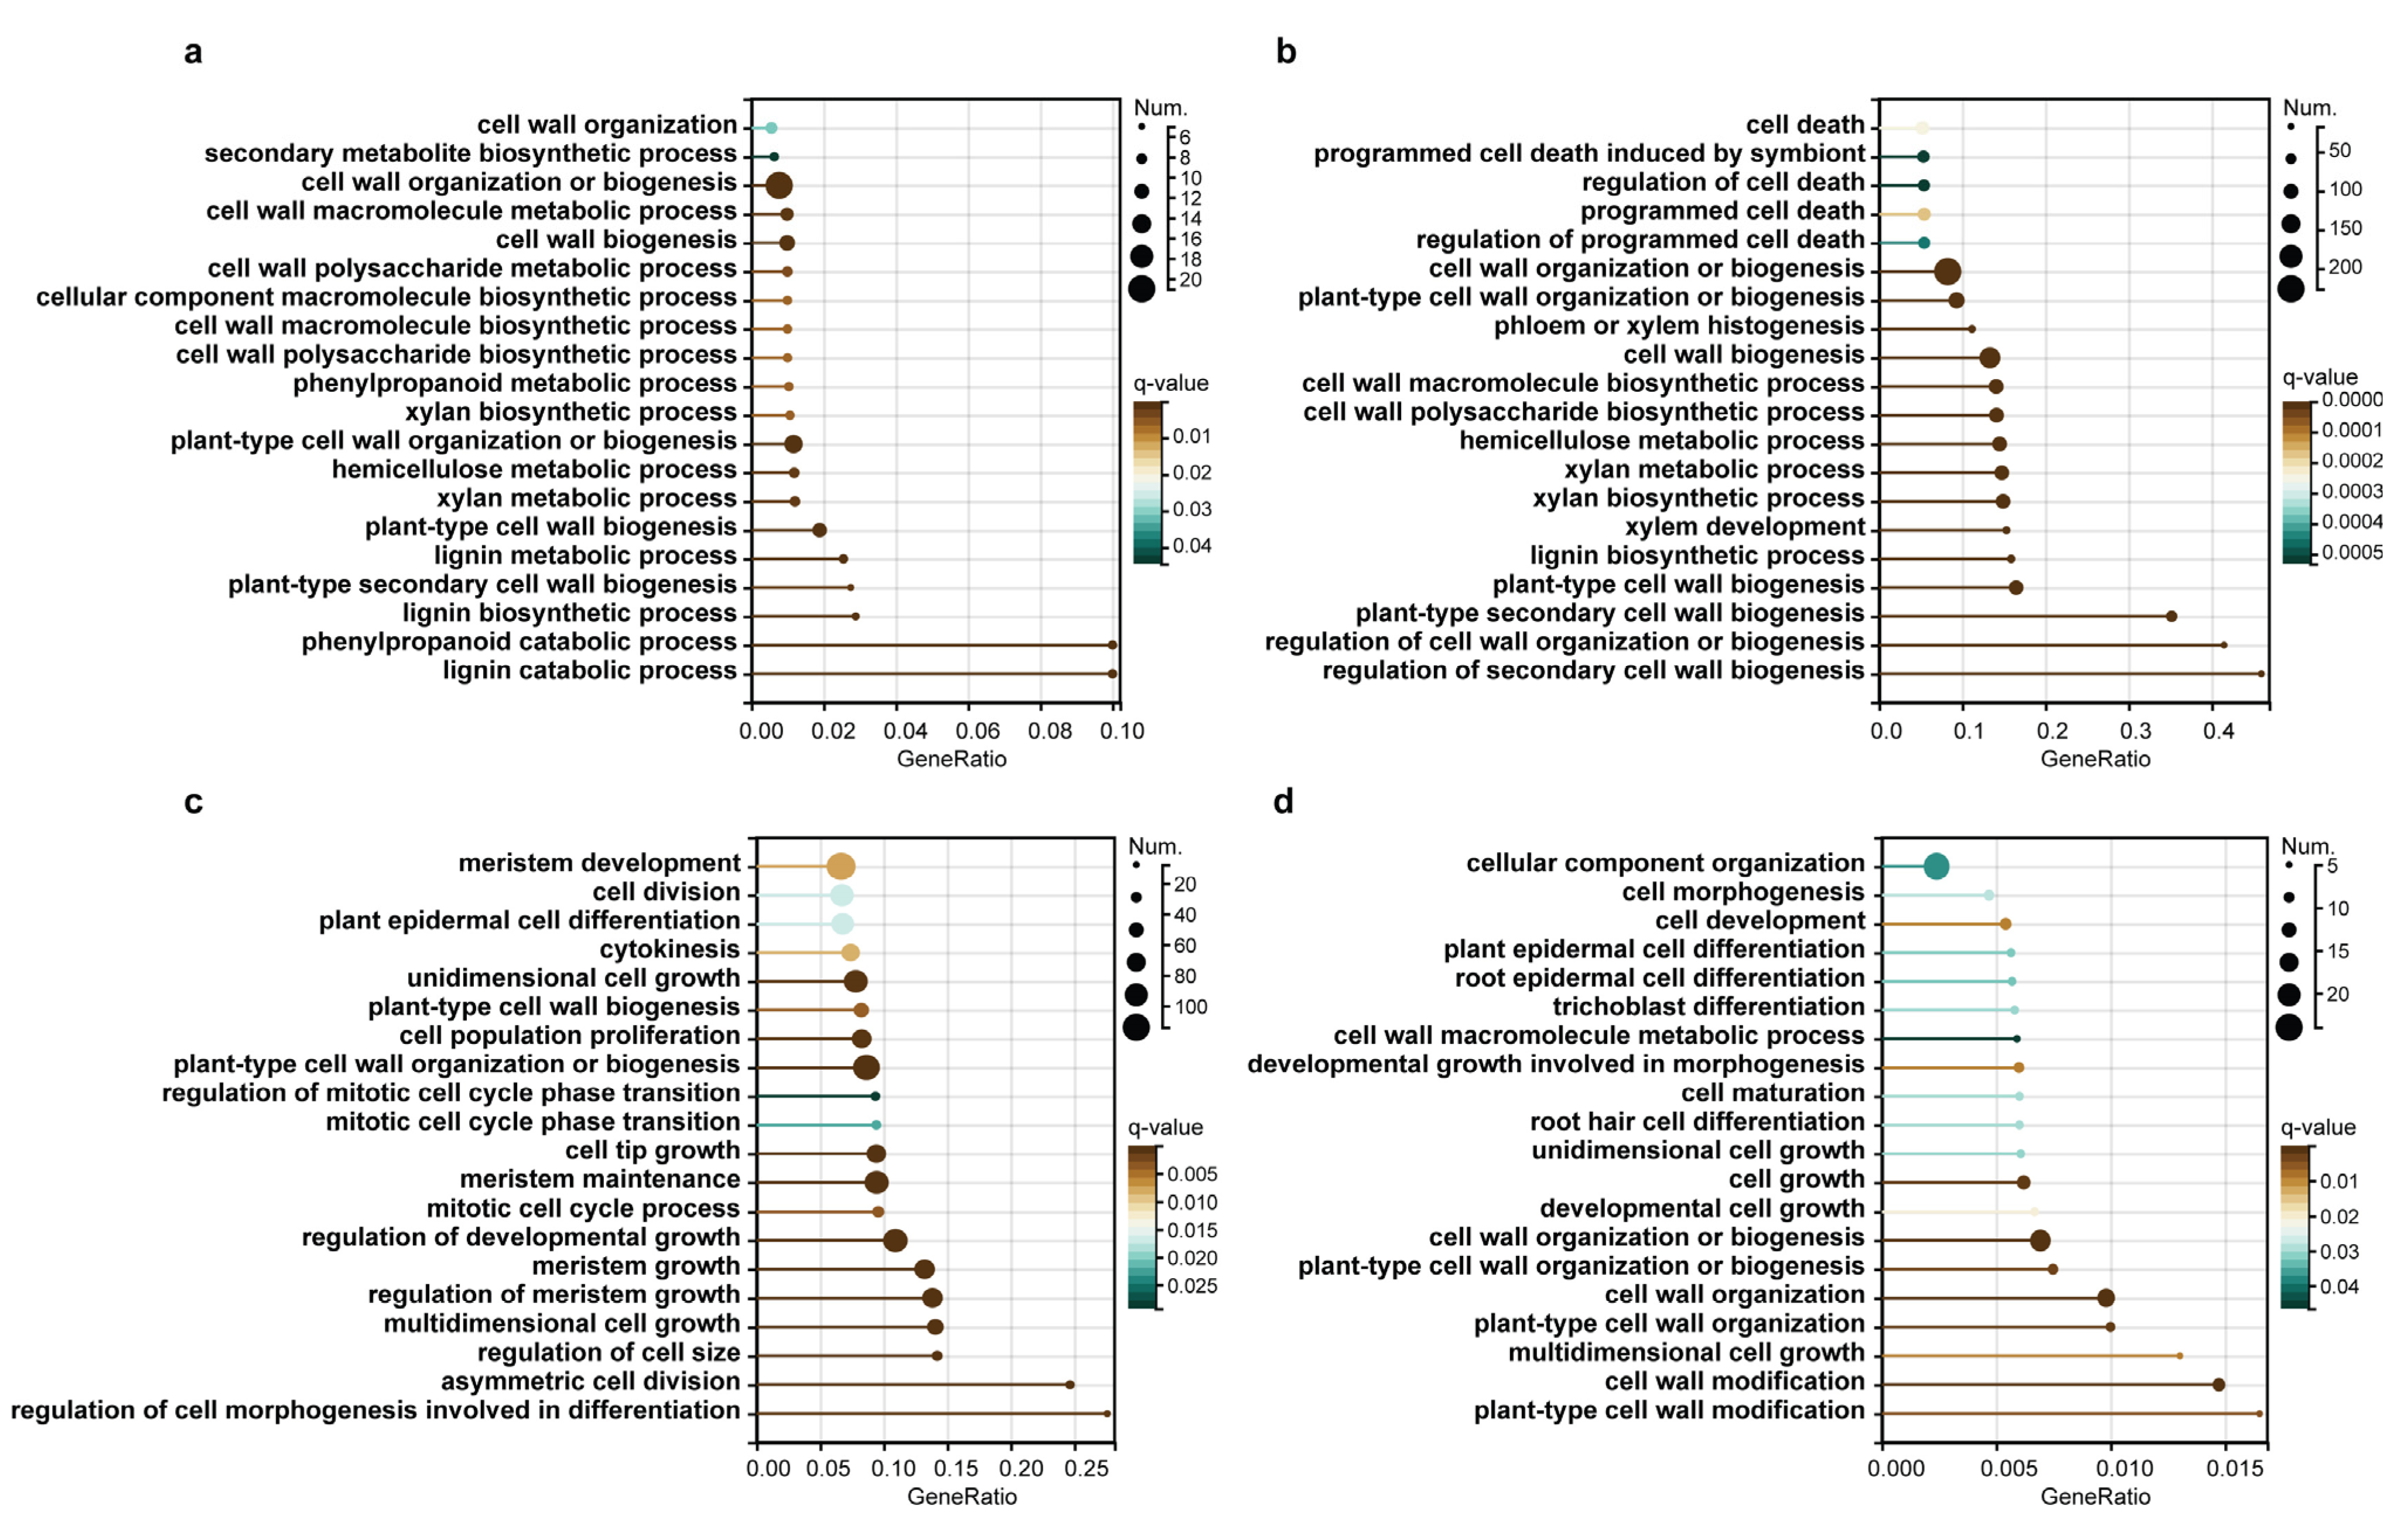
5.4. Gene Annotation and GO Enrichment Analysis

Genes obtained in RNA-Seq were annotated using Nr annotation tool in Omicshare tools (https://www.omicshare.com/, accessed on 18 September 2022). GO enrichment was performed using a free online data analysis platform, Pop’s Pipes [59]. And GO enrichment results were represented as three separate hierarchies of molecular function, biological process and cellular component, with q-value ≤ 0.05 as significantly enriched. The results were visualized using TBtools [60].

5.5. Downstream Target Gene Prediction and Protein Interaction Relationship Prediction

All the genes in blue, green and yellow modules in co-expression network were submitted to PlantRegMap [30]. Gene relationship network was obtained by predicting cis-elements in the promoters of downstream target genes. String database [61] (https://string-db.org/, accessed on 20 September 2022), a searchable tool that includes known and predicted protein interactions for 2031 species, were used for protein interaction prediction. Amino acid sequences of the genes were extracted from the genome of Populus trichocarpa (Version 4.1) in Phytozome [62] using TBtools. All sequences were submitted to STRING to predict protein interactions. In addition, co-expression network was visualized and their connectivity was calculated using Cytoscape [63].

5.6. qRT-PCR Analysis

Total RNA (isolated from RNA-Seq samples) was used for synthesizing first-strand cDNA (Hifair® miRNA 1 st Strand cDNA Synthesis Kit, Yeasen, China). Hieff® qPCR SYBR® Green Master Mix (Yeasen, China) was applied to identify genes expression patterns, and Ptractin was used as endogenous reference gene. 2−ΔΔCT relative quantification method was used to analyze the relative changes of gene expression. Standard errors and standard deviations were calculated from three replicates.

Supplementary Materials

The following supporting information can be downloaded at: https://www.mdpi.com/article/10.3390/f14010099/s1, Figure S1: Relationship between gene significance (GS) and module membership (MM) for blue module. Figure S2: Relationship between gene significance (GS) and module membership (MM) for green module. Figure S3: Relationship between gene significance (GS) and module membership (MM) for yellow module. Figure S4: Co-expression networks of genes associated with lignification in secondary stages of wood formation. Figure S5: qPCR validation of 15 hub genes from RNA-seq results. Table S1: Number of genes obtained from each sample in PS, TS and SS statistics. Table S2: Expression and annotation of genes in PS, TS and SS samples. Table S3: Differentially expressed genes in PS vs TS. Table S4: Differentially expressed genes in TS vs SS. Table S5: Expression of all differentially expressed genes in PS vs TS and TS vs SS. Table S6: Expression of eigengenes in the black module. Table S7: Expression of eigengenes in the blue module. Table S8: Expression of eigengenes in the brown module. Table S9: Expression of eigengenes in the pink module. Table S10: GO terms for significant enrichment of eigengenes in the black module. Table S11: GO terms for significant enrichment of eigengenes in the blue module. Table S12: GO terms for significant enrichment of eigengenes in the brown module. Table S13: GO terms for significant enrichment of eigengenes in the pink module. Table S14: Expression patterns of genes in ASPwood, which highly expressed in secondary stages of wood formation. Table S15: Classification of the modules formed by the 1930 genes expressed in ASPwood. Table S16: Significant enrichment GO terms of all eigengenes in blue, green and yellow modules. Table S17: Relationships between genes revealed by WGCNA, PlantRegMap and STRING together. Table S18: The information corresponding to the nodes in Figure S4. Table S19: The information corresponding to the nodes in Figure 8. Table S20: qPCR analysis of hub transcription factors in co-expression networks in PS, TS and SS.

Author Contributions

R.W. and G.Q.: Designed research, Funding acquisition, Methodology. Y.W. and Y.G.: Conducted the experiments, Analyzed the data and wrote the manuscript. M.X. and T.J.: Performed the statistical analysis and qRT-PCR. W.Z. and P.Y.: Cultured the plant material. All authors have read and agreed to the published version of the manuscript.

Funding

This work was supported by the National Key Research and Development Program of China (No. 2021YFD2200203) and the Fundamental Research Funds for the Central Universities (2572018CL03).

Institutional Review Board Statement

Not applicable.

Informed Consent Statement

Not applicable.

Data Availability Statement

The datasets used and analyzed in this study are available in Sequence Read Archive (SRA, https://www.ncbi.nlm.nih.gov/sra, accessed on 29 December 2022) at NCBI at National Center for Biotechnology Information. The accession numbers for RNA-seq data is PRJNA628501.

Conflicts of Interest

The authors declare no conflict of interest.

References

  1. Zhong, R.; McCarthy, R.L.; Lee, C.; Ye, Z.H. Dissection of the transcriptional program regulating secondary wall biosynthesis during wood formation in poplar. Plant Physiol. 2011, 157, 1452–1468. [Google Scholar] [CrossRef] [PubMed] [Green Version]
  2. Takata, N.; Awano, T.; Nakata, M.T.; Sano, Y.; Sakamoto, S.; Mitsuda, N.; Taniguchi, T. Populus NST/SND orthologs are key regulators of secondary cell wall formation in wood fibers, phloem fibers and xylem ray parenchyma cells. Tree Physiol. 2019, 39, 514–525. [Google Scholar] [CrossRef] [PubMed]
  3. Yao, W.; Li, C.; Lin, S.; Wang, J.; Zhou, B.; Jiang, T. Transcriptome analysis of salt-responsive and wood-associated NACs in Populus simonii × Populus nigra. BMC Plant Biol. 2020, 20, 317. [Google Scholar] [CrossRef] [PubMed]
  4. Yang, L.; Zhao, X.; Ran, L.; Li, C.; Fan, D.; Luo, K. PtoMYB156 is involved in negative regulation of phenylpropanoid metabolism and secondary cell wall biosynthesis during wood formation in poplar. Sci. Rep. 2017, 7, 41209. [Google Scholar] [CrossRef] [Green Version]
  5. Ong, S.S.; Wickneswari, R. Characterization of microRNAs expressed during secondary wall biosynthesis in Acacia mangium. PloS ONE 2012, 7, e49662. [Google Scholar] [CrossRef] [Green Version]
  6. Cao, J.F.; Zhao, B.; Huang, C.C.; Chen, Z.W.; Zhao, T.; Liu, H.R.; Hu, G.J.; Shangguan, X.X.; Shan, C.M.; Wang, L.J.; et al. The miR319-Targeted GhTCP4 Promotes the Transition from Cell Elongation to Wall Thickening in Cotton Fiber. Mol. Plant 2020, 13, 1063–1077. [Google Scholar] [CrossRef]
  7. Du, Q.; Avci, U.; Li, S.; Gallego-Giraldo, L.; Pattathil, S.; Qi, L.; Hahn, M.G.; Wang, H. Activation of miR165b represses AtHB15 expression and induces pith secondary wall development in Arabidopsis. Plant J. 2015, 83, 388–400. [Google Scholar] [CrossRef]
  8. Xu, P.; Kong, Y.; Song, D.; Huang, C.; Li, X.; Li, L. Conservation and functional influence of alternative splicing in wood formation of Populus and Eucalyptus. BMC Genom. 2014, 15, 780. [Google Scholar] [CrossRef] [Green Version]
  9. Chen, M.X.; Zhang, K.L.; Zhang, M.; Das, D.; Fang, Y.M.; Dai, L.; Zhang, J.; Zhu, F.Y. Alternative splicing and its regulatory role in woody plants. Tree Physiol. 2020, 40, 1475–1486. [Google Scholar] [CrossRef]
  10. Zhang, Y.; Liu, C.; Cheng, H.; Tian, S.; Liu, Y.; Wang, S.; Zhang, H.; Saqib, M.; Wei, H.; Wei, Z. DNA methylation and its effects on gene expression during primary to secondary growth in poplar stems. BMC Genom. 2020, 21, 498. [Google Scholar] [CrossRef]
  11. Ali, S.; Ehtram, A.; Arora, N.; Manjunath, P.; Roy, D.; Ehtesham, N.Z.; Hasnain, S.E. The M. tuberculosis Rv1523 Methyltransferase Promotes Drug Resistance Through Methylation-Mediated Cell Wall Remodeling and Modulates Macrophages Immune Responses. Front. Cell. Infect. Microbiol. 2021, 11, 622487. [Google Scholar] [CrossRef] [PubMed]
  12. Zhao, Y.; Sun, J.; Xu, P.; Zhang, R.; Li, L. Intron-mediated alternative splicing of WOOD-ASSOCIATED NAC TRANSCRIPTION FACTOR1B regulates cell wall thickening during fiber development in Populus species. Plant Physiol. 2014, 164, 765–776. [Google Scholar] [CrossRef] [PubMed] [Green Version]
  13. Wang, Q.; Ci, D.; Li, T.; Li, P.; Song, Y.; Chen, J.; Quan, M.; Zhou, D.; Zhang, D. The Role of DNA Methylation in Xylogenesis in Different Tissues of Poplar. Front. Plant Sci. 2016, 7, 1003. [Google Scholar] [CrossRef] [PubMed] [Green Version]
  14. Prassinos, C.; Ko, J.H.; Yang, J.; Han, K.H. Transcriptome profiling of vertical stem segments provides insights into the genetic regulation of secondary growth in hybrid aspen trees. Plant Cell Physiol. 2005, 46, 1213–1225. [Google Scholar] [CrossRef] [PubMed] [Green Version]
  15. Dharmawardhana, P.; Brunner, A.M.; Strauss, S.H. Genome-wide transcriptome analysis of the transition from primary to secondary stem development in Populus trichocarpa. BMC Genom. 2010, 11, 150. [Google Scholar] [CrossRef] [Green Version]
  16. Wang, R.; Reng, M.; Tian, S.; Liu, C.; Cheng, H.; Liu, Y.; Zhang, H.; Saqib, M.; Wei, H.; Wei, Z. Transcriptome-wide identification and characterization of microRNAs in diverse phases of wood formation in Populus trichocarpa. G3 Genes|Genomes|Genet. 2021, 11, jkab195. [Google Scholar] [CrossRef]
  17. Liu, J.; Hai, G.; Wang, C.; Cao, S.; Xu, W.; Jia, Z.; Yang, C.; Wang, J.P.; Dai, S.; Cheng, Y. Comparative proteomic analysis of Populus trichocarpa early stem from primary to secondary growth. J. Proteom. 2015, 126, 94–108. [Google Scholar] [CrossRef]
  18. Sundell, D.; Street, N.R.; Kumar, M.; Mellerowicz, E.J.; Kucukoglu, M.; Johnsson, C.; Kumar, V.; Mannapperuma, C.; Delhomme, N.; Nilsson, O.; et al. AspWood: High-Spatial-Resolution Transcriptome Profiles Reveal Uncharacterized Modularity of Wood Formation in Populus tremula. Plant Cell 2017, 29, 1585–1604. [Google Scholar] [CrossRef] [Green Version]
  19. Johnsson, C.; Fischer, U. Cambial stem cells and their niche. Plant Sci. 2016, 252, 239–245. [Google Scholar] [CrossRef]
  20. Mellerowicz, E.J.; Baucher, M.; Sundberg, B.; Boerjan, W. Unravelling cell wall formation in the woody dicot stem. Plant Mol. Biol. 2001, 47, 239–274. [Google Scholar] [CrossRef]
  21. Chen, J.; Pan, A.; He, S.; Su, P.; Yuan, X.; Zhu, S.; Liu, Z. Different MicroRNA Families Involved in Regulating High Temperature Stress Response during Cotton (Gossypium hirsutum L.) Anther Development. Int. J. Mol. Sci. 2020, 21, 1280. [Google Scholar] [CrossRef] [PubMed] [Green Version]
  22. Zou, Y.; Chen, G.; Jin, J.; Wang, Y.; Xu, M.; Peng, J.; Ding, Y. Small RNA and Transcriptome Sequencing Reveals miRNA Regulation of Floral Thermogenesis in Nelumbo nucifera. Int. J. Mol. Sci. 2020, 21, 3324. [Google Scholar] [CrossRef] [PubMed]
  23. Yao, W.; Li, C.; Fu, H.; Yang, M.; Wu, H.; Ding, Y.; Li, L.; Lin, S. Genome-Wide Analysis of SQUAMOSA-Promoter-Binding Protein-like Family in Flowering Pleioblastus pygmaeus. Int. J. Mol. Sci. 2022, 23, 14035. [Google Scholar] [CrossRef] [PubMed]
  24. Wang, C.; Gao, C.; Wang, L.; Zheng, L.; Yang, C.; Wang, Y. Comprehensive transcriptional profiling of NaHCO3-stressed Tamarix hispida roots reveals networks of responsive genes. Plant Mol. Biol. 2014, 84, 145–157. [Google Scholar] [CrossRef]
  25. Chen, X.; Xia, J.; Xia, Z.; Zhang, H.; Zeng, C.; Lu, C.; Zhang, W.; Wang, W. Potential functions of microRNAs in starch metabolism and development revealed by miRNA transcriptome profiling of cassava cultivars and their wild progenitor. BMC Plant Biol. 2015, 15, 33. [Google Scholar] [CrossRef] [PubMed] [Green Version]
  26. El-Sharkawy, I.; Liang, D.; Xu, K. Transcriptome analysis of an apple (Malus × domestica) yellow fruit somatic mutation identifies a gene network module highly associated with anthocyanin and epigenetic regulation. J. Exp. Bot. 2015, 66, 7359–7376. [Google Scholar] [CrossRef] [Green Version]
  27. Chen, Q.; Zhang, R.; Li, D.; Wang, F. Transcriptomic and Coexpression Network Analyses Revealed Pine Chalcone Synthase Genes Associated with Pine Wood Nematode Infection. Int. J. Mol. Sci. 2021, 22, 11195. [Google Scholar] [CrossRef]
  28. Zhang, M.; Cheng, W.; Yuan, X.; Wang, J.; Cheng, T.; Zhang, Q. Integrated transcriptome and small RNA sequencing in revealing miRNA-mediated regulatory network of floral bud break in Prunus mume. Front. Plant Sci. 2022, 13, 931454. [Google Scholar] [CrossRef]
  29. Zhang, Y.; Luo, J.; Liu, Z.; Liu, X.; Ma, Y.; Zhang, B.; Chen, Y.; Li, X.; Feng, Z.; Yang, N.; et al. Identification of hub genes in colorectal cancer based on weighted gene co-expression network analysis and clinical data from The Cancer Genome Atlas. Biosci. Rep. 2021, 41, BSR20211280. [Google Scholar] [CrossRef]
  30. Tian, F.; Yang, D.C.; Meng, Y.Q.; Jin, J.; Gao, G. PlantRegMap: Charting functional regulatory maps in plants. Nucleic Acids Res. 2020, 48, D1104–D1113. [Google Scholar] [CrossRef]
  31. Hu, Q.; Xiao, S.; Wang, X.; Ao, C.; Zhang, X.; Zhu, L. GhWRKY1-like enhances cotton resistance to Verticillium dahliae via an increase in defense-induced lignification and S monolignol content. Plant Sci. 2021, 305, 110833. [Google Scholar] [CrossRef] [PubMed]
  32. Miyamoto, T.; Takada, R.; Tobimatsu, Y.; Suzuki, S.; Yamamura, M.; Osakabe, K.; Osakabe, Y.; Sakamoto, M.; Umezawa, T. Double knockout of OsWRKY36 and OsWRKY102 boosts lignification with altering culm morphology of rice. Plant Sci. 2020, 296, 110466. [Google Scholar] [CrossRef] [PubMed]
  33. Xiao, R.; Zhang, C.; Guo, X.; Li, H.; Lu, H. MYB Transcription Factors and Its Regulation in Secondary Cell Wall Formation and Lignin Biosynthesis during Xylem Development. Int. J. Mol. Sci. 2021, 22, 3560. [Google Scholar] [CrossRef] [PubMed]
  34. Zhang, Q.; Wang, L.; Wang, Z.; Zhang, R.; Liu, P.; Liu, M.; Liu, Z.; Zhao, Z.; Wang, L.; Chen, X.; et al. The regulation of cell wall lignification and lignin biosynthesis during pigmentation of winter jujube. Hortic. Res. 2021, 8, 238. [Google Scholar] [CrossRef] [PubMed]
  35. Zeng, J.K.; Li, X.; Xu, Q.; Chen, J.Y.; Yin, X.R.; Ferguson, I.B.; Chen, K.S. EjAP2-1, an AP2/ERF gene, is a novel regulator of fruit lignification induced by chilling injury, via interaction with EjMYB transcription factors. Plant Biotechnol. J. 2015, 13, 1325–1334. [Google Scholar] [CrossRef]
  36. Bang, S.W.; Lee, D.K.; Jung, H.; Chung, P.J.; Kim, Y.S.; Choi, Y.D.; Suh, J.W.; Kim, J.K. Overexpression of OsTF1L, a rice HD-Zip transcription factor, promotes lignin biosynthesis and stomatal closure that improves drought tolerance. Plant Biotechnol. J. 2019, 17, 118–131. [Google Scholar] [CrossRef] [Green Version]
  37. Ye, Z.-H.; Zhong, R. Molecular control of wood formation in trees. J. Exp. Bot. 2015, 66, 4119–4131. [Google Scholar] [CrossRef] [Green Version]
  38. Goujon, T.; Ferret, V.; Mila, I.; Pollet, B.; Ruel, K.; Burlat, V.; Joseleau, J.P.; Barrière, Y.; Lapierre, C.; Jouanin, L. Down-regulation of the AtCCR1 gene in Arabidopsis thaliana: Effects on phenotype, lignins and cell wall degradability. Planta 2003, 217, 218–228. [Google Scholar] [CrossRef]
  39. Leplé, J.C.; Dauwe, R.; Morreel, K.; Storme, V.; Lapierre, C.; Pollet, B.; Naumann, A.; Kang, K.Y.; Kim, H.; Ruel, K.; et al. Downregulation of cinnamoyl-coenzyme A reductase in poplar: Multiple-level phenotyping reveals effects on cell wall polymer metabolism and structure. Plant Cell 2007, 19, 3669–3691. [Google Scholar] [CrossRef] [Green Version]
  40. Liu, L.; Stein, A.; Wittkop, B.; Sarvari, P.; Li, J.; Yan, X.; Dreyer, F.; Frauen, M.; Friedt, W.; Snowdon, R.J. A knockout mutation in the lignin biosynthesis gene CCR1 explains a major QTL for acid detergent lignin content in Brassica napus seeds. Theor. Appl. Genet. 2012, 124, 1573–1586. [Google Scholar] [CrossRef]
  41. Ruel, K.; Berrio-Sierra, J.; Derikvand, M.M.; Pollet, B.; Thévenin, J.; Lapierre, C.; Jouanin, L.; Joseleau, J.P. Impact of CCR1 silencing on the assembly of lignified secondary walls in Arabidopsis thaliana. New Phytol. 2009, 184, 99–113. [Google Scholar] [CrossRef] [PubMed]
  42. Van Acker, R.; Leplé, J.C.; Aerts, D.; Storme, V.; Goeminne, G.; Ivens, B.; Légée, F.; Lapierre, C.; Piens, K.; Van Montagu, M.C.; et al. Improved saccharification and ethanol yield from field-grown transgenic poplar deficient in cinnamoyl-CoA reductase. Proc. Natl. Acad. Sci. USA 2014, 111, 845–850. [Google Scholar] [CrossRef] [PubMed] [Green Version]
  43. Van der Rest, B.; Danoun, S.; Boudet, A.M.; Rochange, S.F. Down-regulation of cinnamoyl-CoA reductase in tomato (Solanum lycopersicum L.) induces dramatic changes in soluble phenolic pools. J. Exp. Bot. 2006, 57, 1399–1411. [Google Scholar] [CrossRef] [Green Version]
  44. Barakat, A.; Yassin, N.B.; Park, J.S.; Choi, A.; Herr, J.; Carlson, J.E. Comparative and phylogenomic analyses of cinnamoyl-CoA reductase and cinnamoyl-CoA-reductase-like gene family in land plants. Plant Sci. 2011, 181, 249–257. [Google Scholar] [CrossRef] [PubMed]
  45. Zhong, R.; Lee, C.; Zhou, J.; McCarthy, R.L.; Ye, Z.H. A battery of transcription factors involved in the regulation of secondary cell wall biosynthesis in Arabidopsis. Plant Cell 2008, 20, 2763–2782. [Google Scholar] [CrossRef] [Green Version]
  46. Zhang, Q.; Luo, F.; Zhong, Y.; He, J.; Li, L. Modulation of NAC transcription factor NST1 activity by XYLEM NAC DOMAIN1 regulates secondary cell wall formation in Arabidopsis. J. Exp. Bot. 2020, 71, 1449–1458. [Google Scholar] [CrossRef]
  47. Wang, H.H.; Tang, R.J.; Liu, H.; Chen, H.Y.; Liu, J.Y.; Jiang, X.N.; Zhang, H.X. Chimeric repressor of PtSND2 severely affects wood formation in transgenic Populus. Tree Physiol. 2013, 33, 878–886. [Google Scholar] [CrossRef] [PubMed]
  48. Kim, D.; Jeon, S.J.; Yanders, S.; Park, S.C.; Kim, H.S.; Kim, S. MYB3 plays an important role in lignin and anthocyanin biosynthesis under salt stress condition in Arabidopsis. Plant Cell Rep. 2022, 41, 1549–1560. [Google Scholar] [CrossRef]
  49. Du, J.; Miura, E.; Robischon, M.; Martinez, C.; Groover, A. The Populus Class III HD ZIP transcription factor POPCORONA affects cell differentiation during secondary growth of woody stems. PloS ONE 2011, 6, e17458. [Google Scholar] [CrossRef] [Green Version]
  50. Zhu, Y.; Song, D.; Sun, J.; Wang, X.; Li, L. PtrHB7, a class III HD-Zip gene, plays a critical role in regulation of vascular cambium differentiation in Populus. Mol. Plant 2013, 6, 1331–1343. [Google Scholar] [CrossRef]
  51. Oda, Y.; Fukuda, H. Secondary cell wall patterning during xylem differentiation. Curr. Opin. Plant Biol. 2012, 15, 38–44. [Google Scholar] [CrossRef]
  52. Goodson, H.V.; Jonasson, E.M. Microtubules and Microtubule-Associated Proteins. Cold Spring Harb. Perspect. Biol. 2018, 10, a022608. [Google Scholar] [CrossRef]
  53. Vilela, B.; Pagès, M.; Lumbreras, V. Regulation of MAPK signaling and cell death by MAPK phosphatase MKP2. Plant Signal. Behav. 2010, 5, 1497–1500. [Google Scholar] [CrossRef] [Green Version]
  54. Wu, Q.; Jackson, D. Detection of MAPK3/6 Phosphorylation During Hypersensitive Response (HR)-Associated Programmed Cell Death in Plants. Methods Mol. Biol. (Clifton NJ) 2018, 1743, 153–161. [Google Scholar] [CrossRef]
  55. Lu, S.; Li, Q.; Wei, H.; Chang, M.J.; Tunlaya-Anukit, S.; Kim, H.; Liu, J.; Song, J.; Sun, Y.H.; Yuan, L.; et al. Ptr-miR397a is a negative regulator of laccase genes affecting lignin content in Populus trichocarpa. Proc. Natl. Acad. Sci. USA 2013, 110, 10848–10853. [Google Scholar] [CrossRef] [Green Version]
  56. Shi, R.; Sun, Y.H.; Li, Q.; Heber, S.; Sederoff, R.; Chiang, V.L. Towards a systems approach for lignin biosynthesis in Populus trichocarpa: Transcript abundance and specificity of the monolignol biosynthetic genes. Plant Cell Physiol. 2010, 51, 144–163. [Google Scholar] [CrossRef] [Green Version]
  57. Ritchie, M.E.; Phipson, B.; Wu, D.; Hu, Y.; Law, C.W.; Shi, W.; Smyth, G.K. limma powers differential expression analyses for RNA-sequencing and microarray studies. Nucleic Acids Res. 2015, 43, e47. [Google Scholar] [CrossRef]
  58. Langfelder, P.; Horvath, S. WGCNA: An R package for weighted correlation network analysis. BMC Bioinform. 2008, 9, 559. [Google Scholar] [CrossRef] [Green Version]
  59. Li, X.; Gunasekara, C.; Guo, Y.; Zhang, H.; Lei, L.; Tunlaya-Anukit, S.; Busov, V.; Chiang, V.; Wei, H. Pop’s Pipes: Poplar gene expression data analysis pipelines. Tree Genet. Genomes 2014, 10, 1093–1101. [Google Scholar] [CrossRef]
  60. Chen, C.; Chen, H.; Zhang, Y.; Thomas, H.R.; Frank, M.H.; He, Y.; Xia, R. TBtools: An Integrative Toolkit Developed for Interactive Analyses of Big Biological Data. Mol. Plant 2020, 13, 1194–1202. [Google Scholar] [CrossRef]
  61. Von Mering, C.; Huynen, M.; Jaeggi, D.; Schmidt, S.; Bork, P.; Snel, B. STRING: A database of predicted functional associations between proteins. Nucleic Acids Res. 2003, 31, 258–261. [Google Scholar] [CrossRef] [PubMed]
  62. Goodstein, D.M.; Shu, S.; Howson, R.; Neupane, R.; Hayes, R.D.; Fazo, J.; Mitros, T.; Dirks, W.; Hellsten, U.; Putnam, N.; et al. Phytozome: A comparative platform for green plant genomics. Nucleic Acids Res. 2012, 40, D1178–D1186. [Google Scholar] [CrossRef] [PubMed]
  63. Shannon, P.; Markiel, A.; Ozier, O.; Baliga, N.S.; Wang, J.T.; Ramage, D.; Amin, N.; Schwikowski, B.; Ideker, T. Cytoscape: A software environment for integrated models of biomolecular interaction networks. Genome Res. 2003, 13, 2498–2504. [Google Scholar] [CrossRef]
Figure 1. (a) The Principal Component Analysis (PCA) of RNA-seq data. The PCA two-dimensional scatter plot represents the gene expression patterns in the PS, the TS and the SS. Axis: X = PC1: PCA Component 1 (91.1% variance); Y = PC2: PCA Component 2 (6.3% variance). (b) The Pearson correlation analysis between samples. (c) Statistics on the number of differentially expressed genes in the PS vs. the TS and the TS vs. the SS. (d) Venn diagram showing the combined set of differential genes for the PS vs. the TS and the TS vs. the SS. The PS, TS and SS represent the primary stems, transitional stems and secondary stems of poplar, respectively.
Forests 14 00099 g001
Figure 2. WGCNA reveals modules related to primary stems (PS), transitional stems (TS) and secondary stems (SS) of wood formation. (a) Clustering dendrogram of genes, with dissimilarity based on topological overlap, together with assigned module colors. (b) Heatmaps showing Pearson correlation among eigengenes of co-expressed gene modules. The Pearson correlation coefficients were colored according to the score.
Forests 14 00099 g002
Figure 3. The co-expressed gene modules associated with primary stems (PS), transitional stems (TS), and secondary stems (SS) in the WGCNA analysis. (ad) The barplot displaying the normalized eigengene expression for module black (a), module blue (b), module brown (c), and module pink (d). (eh) The heatmaps showing the expression pattern of eigengenes within module black (de), module blue (f), module brown (g), and module pink (h).
Forests 14 00099 g003
Figure 4. Typical biological processes of significant GO terms for eigengenes of different modules. (a) Go terms of black modules. (b) Go terms of blue modules. (c) Go terms of brown modules. (d) Go terms of pink modules. The x-axis represents enriched Gene Ratio. The y-axis represents GO term. q-value ≤ 0.05 indicates significant enrichment. The size of each circle represents the number of the gene, and color represents q-value.
Forests 14 00099 g004
Figure 5. The WGCNA reveals modules related to the lignified xylem of the secondary stem in wood formation. (a) Clustering dendrogram of genes, with dissimilarity based on topological overlap, together with assigned module colors. (b) Heatmaps showing the Pearson correlation among eigengenes of co-expressed gene modules. The Pearson correlation coefficients were colored according to the score. (c) The heat map of the correlation between different modules and %lignified xylem. (d) The line chart represents the expression patterns of the different modular feature vectors in the phloem, cambium, expanding xylem and the lignified xylem during the horizontal development of the poplar. The thickened lines represent modules with a correlation coefficient ≥ 0.9 and a p-value ≤ 0.05 for modules with %lignified xylem.
Forests 14 00099 g005
Figure 6. Typical biological processes of significant GO terms for all genes from the blue, green, and yellow modules. The x-axis represents the numbers of genes. The y-axis represents the GO term. The color represents q-value; q-value ≤ 0.05 indicates significant enrichment.
Forests 14 00099 g006
Figure 7. Transcription factors from the co-expression networks associated with lignification in secondary stages of wood formation. The node color represents the connectivity of the gene. The pink line indicates that the relationship between genes was confirmed in STRING and the blue line indicates that the relationship between genes was confirmed in PlantRegMap. The thickness of the line represents weight value.
Forests 14 00099 g007
Figure 8. A network of genes contained in lignification-related GO terms. The Grey line indicates the relationship between the gene and the GO term, the pink line indicates that the relationship between genes was confirmed in STRING, the blue line indicates that the relationship between genes was confirmed in PlantRegMap. The node size represents the connectivity. Please refer to Table S19 for node information.
Forests 14 00099 g008
Figure 9. Schematic representation of the construction of a co-expression network of lignification-related genes in the secondary stage of wood formation. The PS, TS and SS represent primary, transitional, and secondary stems of wood formation, respectively.
Forests 14 00099 g009
Table 1. Poplar TFs related to lignification in co-expression networks.
LabelID of Populus TrichocarpaSymbolID of ArabidopsisFunction and References
TF7Potri.001G112200IXR11/KNAT7AT1G62990Downstream transcription factors regulated by PtrWND [1,37,45]
TF9Potri.014G104800ANAC043AT2G46770Regulating the formation of secondary cell walls in Arabidopsis [46]
TF10Potri.004G049300ANAC073/SND2AT4G28500PtrWND-regulated downstream TFs; dominant repression of PtSND2/NAC073 causes a reduction in secondary wall thickening in transgenic poplar wood [1,37,45,47]
TF12Potri.019G081500ATMYB3AT1G22640Involved in lignin biosynthesis under salt stress in Arabidopsis [48]
TF13Potri.012G039400ATMYB52AT1G17950Involved in the regulation of secondary cell wall biosynthesis in Arabidopsis [45]
TF14Potri.001G099800AtMYB103AT1G63910Downstream transcription factors regulated by PtrWND [1,37,45]
TF15Potri.001G118800AtMYB42AT4G12350Downstream transcription factors regulated by PtrWND [1,37,45]
TF16Potri.003G114100AtMYB42AT4G12350Downstream transcription factors regulated by PtrWND [1,37,45]
TF17Potri.015G033600ATMYB52AT1G17950Involved in the regulation of secondary cell wall biosynthesis in Arabidopsis [45]
TF19Potri.005G186400ATMYB52AT1G17950Involved in the regulation of secondary cell wall biosynthesis in Arabidopsis [45]
TF20Potri.015G129100AtMYB85AT4G22680Downstream transcription factors regulated by PtrWND [1,37,45]
TF21Potri.013G156200ASL11/LBD15AT2G40470Downstream transcription factors regulated by PtrWND [1,37]
TF27Potri.001G188800ATHB-15AT1G52150Overexpression of a microRNA-resistant form causes delayed differentiation of secondary xylem and phloem fibres [49]
TF28Potri.003G050100ATHB-15AT1G52150Overexpression of a microRNA-resistant form causes delayed differentiation of secondary xylem and phloem fibres [49]
TF29Potri.018G045100ATHB-8AT4G32880Regulates differentiation of secondary xylem and phloem [50]
Disclaimer/Publisher’s Note: The statements, opinions and data contained in all publications are solely those of the individual author(s) and contributor(s) and not of MDPI and/or the editor(s). MDPI and/or the editor(s) disclaim responsibility for any injury to people or property resulting from any ideas, methods, instructions or products referred to in the content.

