Abstract
The adaptation to climatic variability and spatiotemporal distinctions in floristic and microbial assembly is important in forest ecology, especially in the context of biological diversity and functional traits. We investigated climatic variables, plant traits, edaphic properties, and microbial dimensions from various plots with an elevation gradient in a broad-leaved-Korean pine mixed forest. With increasing elevation, isothermality significantly increased; however, temperature and precipitation seasonality, as well as the mean temperature of the warmest quarter, significantly declined. Furthermore, high elevation sites were characterized by increased stand basal areas (Ba) and ectomycorrhizal (EM) tree abundance but featured decreases in the abundance of arbuscular mycorrhizal (AM) trees and the values of community-weighted mean (CWM) foliar traits (e.g., leaf area, leaf nitrogen content and leaf phosphorus content). Moreover, soil nutrient status, fungal and bacterial diversity indices, fungal saprotrophs, and bacterial function groups related to nitrite oxidation, ammonia oxidation, and nitrate denitrification were all negatively correlated to the elevation increment. In contrast, high elevation sites were characterized by enhanced EM growth and bacterial nitrogen fixation groups. Correlation analysis showed that the microbial diversity and relative abundances of microbial functional groups in soil were significantly influenced by climatic variability, CWM foliar traits and soil nutrient status. These findings demonstrate that the forces driving biological processes along climatic gradients are predictably in tandem with, but related to different extents, to the spatial compartmentalization of climatic variability in forest ecosystems at local scales.
1. Introduction
Forests are being exposed to climatic change, which has been increasing in intensity at a global scale over the past century. Additionally, forests have been deviating substantially in terms of diversity and in sustaining terrestrial ecosystem functions such as photosynthetic carbon fixation and nutrient immobilization. Concerns over the detrimental effects of warming and drought on the diversity and function associated with vegetation and soil microbiome have promoted extensive studies and have become a global priority [1,2,3]. However, the coevolutionary mechanisms underlying the above- and belowground community assembly under increasing climatic variation remain a universally open question, especially in the context of biological adaptation along various spatiotemporal gradients.
Plant distributions (e.g., Douglas fir) were significantly influenced by climatic variability (isothermality and precipitation seasonality) [4,5,6]. Isothermality, i.e., diurnal temperature oscillation relative to the annual temperature oscillation, represents thermal ‘stability’ or ‘evenness’ relative to annual variations in temperature. High isothermality occurs mainly in regions with lower annual temperatures and may have a negative effect on resilience and may negatively influence the distribution of species richness and plant growth [7,8]. In addition, hydraulic stress caused by low precipitation can trigger vegetation ecophysiological responses in controlling water loss by transpiration, such as stomatal regulation, reducing forest productivity. This resistance to drought maintains forest stability and function over time [7].
Due to changing traits of specific host trees, belowground nutrient cycling activities may be accelerated when undergoing high climatic variability through the initiation of a nutrient cycling feedback cascade, which involves a reduction in symbiotic nitrogen and phosphorus acquisition and the stimulation of free-living saprotrophic exploitation [9,10,11]. Moreover, soil nutrient contents (e.g., total carbon, nitrogen and phosphorus) are essential for vegetation growth and important variables that relate to key ecosystem services. It has also been demonstrated that increased variability in rainfall and soil water content significantly affects soil nutrient availability (e.g., readily available nitrogen) [12]. Furthermore, soil elemental stoichiometry (e.g., carbon to nitrogen ratios) determines belowground microbial community activity and structure due to N availability as well as specific carbon-nitrogen stoichiometry in different microbial groups (10 for fungal cells but only 4 for bacterial cells) [12,13]. Moreover, nearby soil available nutrient (e.g., labile nitrogen) reallocation may change the aboveground foliar stoichiometry (the higher the labile nitrogen acquisition, the lower the foliar carbon/nitrogen ratios) [14].
Forest assembly processes and functions vary not only by climatic variances but also by spatial heterogeneity [15]. Of many spatially varied forest gradients, elevation-mediated constraints (e.g., high to low leaching processes and temperature variation) play important roles in determining vegetation traits, soil properties and microbial responses [16,17,18,19]. This likely occurs because (1) precipitation and temperature may change along the elevation gradient and (2) nutrients leach out from higher to lower altitude sites [19,20,21]. Soil bacterial alpha diversity has also been observed to decrease from elevations of 1400–1800 m to 1000–1200 m, which is probably due to decreases in the abundances of certain symbiotic species caused by temperature change [22].
Vegetation traits (e.g., leaf morphology and stand density), soil physicochemical properties (e.g., nutrient status) and microbial dimensions (e.g., diversity and function) are widely employed to understand the survival, development and function of forest ecosystems [23,24]. Less dynamic forests and poorer soils are always accompanied by lower specific leaf area, whereas fast-growing species with high specific leaf areas prefer resource-rich niches [25,26]. Foliar traits (e.g., nitrogen and phosphorus contents) are highly relevant to soil nutrient status (e.g., soil nitrogen and phosphorus contents) and determines belowground microbially mediated residue metabolism [27,28]. Furthermore, bacteria-dominated communities are closely correlated with light-demanding, fast-growing, nitrogen-exploitative plant traits (i.e., high growth rates, leaf nitrogen contents and specific leaf areas) [29,30]. Moreover, soil microbial functional groups play pivotal roles in the acquisition and partitioning of nitrogen and phosphorus and are closely associated with vegetation adaptation, assembly, and productivity, e.g., the enhancement of soil phosphorus acquisition by symbiotic mycorrhizal fungi [31,32].
In summary, the morphology and phenology of forest ecosystems profoundly change along elevation gradients with varying climatic variables. In particular, increased climatic stress may change forest composition, diversity and function. Additionally, the concentrations of soil nutrients may vary along altitudinal gradients because of climatic variability and leaching processes of soluble nutrients. In our previous studies [33,34], we have revealed how plant traits and soil nutrient status respond to environmental changes in a local-scale forest ecosystem of northeastern China. Yet we lack an understanding of how climatic variability will impact forest ecology at the local scale, including soil nutrient status, plant traits, and microbial community function and diversity. We hypothesized that biological diversity and function should exhibit distinct or even contrasting recruitment trajectories due to different biological legacies along elevation gradients varying in climatic variables. This study aimed to combine data on soil properties and microbiomes and floristic traits to determine the distinct effects of elevation-mediated climatic change on ecosystem assembly processes and traits in a temperate mixed forest at local scales.
2. Materials and Methods
2.1. Study Site, Elevation Gradient and Climatic Variables
Temperate mixed forests are separately located in eight sites (40.9–44.1° N, 124.8–128.2° E) in Jilin and Liaoning provinces of northeastern China, including LianHuaShan (lhs), HuangNiHe (hnh), LongWan (lw), BaiShiLazi (bsl), LaoTuDing (ltd), SongJiangHe (sjh), XiPo (xipo), and JiaoCuoDai (jcd) (Table 1, Figure 1). These forests contain zonal vegetation gradients and are home to the broad-leaved Korean pine (Pinus koraiensis). Each plot (0.6–1 ha) was divided into nonoverlapping 20 m × 20 m subplots (15, 20 and 25 replicates in ltd, bsl and each of the remaining plots, respectively). The elevation in the plots ranges from 653.0 m to 1107.1 m, which equals an elevation gradient of 454.1 m (Table 1). The mean annual temperature ranges from 1.16–4.18 °C, and the mean annual precipitation ranges from 660–1000 mm. The soil is classified as dark brown forest soil (Food and Agriculture Organization of the United Nations (FAO) soil classification system) [35]. Forests in the study area have been protected from human disturbances since the implementation of Natural Forest Protection in 1998 and vary in successional stages from early to mature climax forest communities [35]. We first mapped the distribution of natural broad-leaved Korean pine forest with satellite imagery and then established permanent plots in 8 suitable locations following the 50 ha forest plot field protocol as carried out in Panama (Barro Colorado Island, BCI) from July 2012 to July 2013 [36]. A total of six bioclimatic variables were obtained from the WorldClim 2.1 dataset for 1970–2000 (https://www.worldclim.org/data/worldclim21.html (accessed on 30 November 2022)) (Table 1). The climatic variables were downloaded at a 30 arcsec resolution (~1 km2). In particular, an isothermality value of 100 represents a site where the diurnal temperature range is equivalent to the annual temperature range. Values less than 100 indicate a smaller level of diurnal temperature variability (monthly means are equivalent to maximum temperature–minimum temperature) relative to the temperature variability during the year (maximum temperature of the warmest month–minimum temperature of the coldest month) [37].

Table 1.
The descriptive summary of the studied plots.
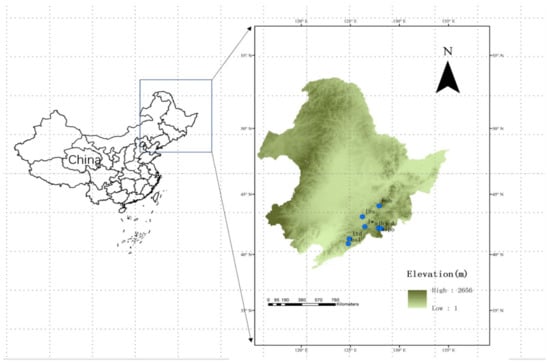
Figure 1.
The study area and distribution of forest sites in northeastern China. Eight study sites include LianHuaShan (lhs), HuangNiHe (hnh), LongWan (lw), BaiShiLazi (bsl), LaoTuDing (ltd), SongJiangHe (sjh), XiPo (xipo), and JiaoCuoDai (jcd).
2.2. Vegetation Variables
Two successive censuses were carried out in 2012–2013 and 2017–2018. Within each subplot, we investigated all individual trees (diameters at breast height (DBH) > 1 cm) and recorded nearly 23,000 stems affiliated with 81 species, 46 genera and 26 families in total [33]. Plant diversity (i.e., functional diversities), functional trait composition and stand structural attribute data were used to represent the multiple biotic predictors in each 20 m × 20 m subplot. Stand basal area (Ba) was calculated via the summation of the basal areas of all individual trees in each subplot [34]. In addition, tree species in this temperate forest were classified into two major mycorrhizal types: ectomycorrhizal (EM) and arbuscular mycorrhizal (AM) species. Tree-mycorrhizal associations were determined based on previous studies [38,39]. The ratio of the Ba of the same mycorrhizal type to total stand Ba indicates the proportion of the tree species of the mycorrhizal type in the community (i.e., EM and AM trees). We investigated physiological and morphological vegetation characteristics, such as the leaf area (LA), leaf phosphorus content (LPC) and leaf nitrogen content (LNC) [26]. The detailed measurement approaches for these functional traits are described in Yuan et al. [40]. The community-weighted mean (CWM) of the functional trait values was calculated with LA, LPC and LNC. The CWM of each trait value (CWM.LA, CWM.LPC and CWM.LNC) within each plot was weighted by the species’ relative Ba [36,41] and was calculated by the FD package in R 3.6.1 [42].
2.3. Soil Collection, DNA Extraction, and Molecular and Bioinformatic Analyses
In August 2018, composite soil samples were created by thoroughly mixing five randomly selected soil cores. These cores contained the top 10 cm of soil, were collected from each 20 m × 20 m subplot, were transported at 4 °C, sieved (<2 mm) and either stored at −80 °C for DNA extraction or air-dried for chemical property analyses. As previously reported [33,43], we measured soil chemical properties including soil capillary water retention (WC), total carbon stock (TCS), total nitrogen stock (TNS), total phosphorus stock (TPS), total potassium stock (TKS) and readily available nitrogen (AN).
Soil genomic DNA was extracted from 0.25 g of a soil sample using the MoBio PowerSoil® DNA Isolation Extraction Kit (MoBio, Carlsbad, CA, USA). The DNA quality assessment was based on 260/280 nm and 260/230 nm absorbance ratios obtained with a NanoDrop Life Spectrophotometer (NanoDrop, Wilmington, NC, USA). The final obtained DNA was stored at −40 °C until use. The internal transcribed spacer (ITS) sequence of 18S rRNA was amplified using the barcoded fusion primers ITS1 (5′-CTTGGTCATTTAGAGGAAGTAA-3′) and ITS2 (5′-GCTGCGTTCTTCATCGATGC-3′), and the universal primers 515F (5′-GTGCCAGCMGCCGCGG-3′), and 907R (5′-CCGTCAATTCMTTTRAGTTT-3′) with a unique barcode were selected for the V4–V5 region of bacterial 16S rRNA gene amplification [44]. Polymerase chain reaction (PCR) was carried out with the Gene Amp PCR-System 9700 (Applied Biosystems, Foster City, CA, USA). Amplified sequencing was performed with 300PE MiSeq (Illumina, San Diego, CA, USA) at Shanghai Majorbio Biopharm Biotechnology Co., Ltd. (Shanghai, China).
Data processing was carried out using QIIME (version 1.7) (http://qiime.org/tutorials/tutorial.html (accessed on 30 November 2022)). All sequence reads were trimmed and assigned to each sample based on their barcodes. High quality sequences (length > 200 bp, without ambiguous bases (“N”), and above average base quality score (>25)) were used for the downstream analysis. The sequences were clustered into operational taxonomic units (OTUs) using UPARSE (version 7.1, http://drive5.com/uparse/ (accessed on 30 November 2022)) at a 97% threshold pairwise identity. Singletons and doubletons were removed during OTU selection. The aligned 18S rRNA and 16S rRNA gene sequences were subjected to a chimera check using the UCHIME algorithm. With the use of obisample script, each sample was subsampled to a depth of 30,053 reads for 18S rRNA and 30,057 reads for 16S rRNA sequences. Alpha diversity analyses (e.g., Shannon, Simpson, and Inver_Simpson) were performed by running a workflow on QIIME (script “core_diversity_analyses.py”). We used FUNGuild v1.0 [45] and FAPROTAX [46] to identify the metabolic and ecologically relevant functions for the 16S rDNA OTUs and the ITS OTUs, respectively.
2.4. Statistical Analyses
Differences in normally distributed data (Shapiro–Wilk test) were assessed via one-way analysis of variance (ANOVA) (Tukey’s honestly significant difference (HSD) test); otherwise, an unpaired Kruskal–Wallis test was applied via functions within R software (R Development Core Team, 2019, version 3.6.1). Corrplot was carried out in R to reveal the relationships among variables. Differences among sites were presented with the help of boxplerk and boxplert functions in R.
3. Results
3.1. Climatic Variability along the Elevation Gradient
There was an elevation gradient of 454.1 m across the eight plots, which ranged from 653.0 m (lhs) to 1107.1 m (jcd) (Table 1; Figure 1). The highest site (jcd) had the lowest temperature values, such as the mean annual temperature (1.2 °C), max temperature of the warmest month (22.5 °C), and mean temperature of the warmest quarter (15.9 °C) (Table 1). Precipitation in the driest month was also the lowest at jcd (4 mm/year) (Table 1). In contrast, the site at the lowest elevation (lhs) had the highest values of temperature and precipitation, such as temperature seasonality (CV equal to 1388.5%), annual temperature range (50 °C) and precipitation during the driest month (8 mm/year) (Table 1). Somewhat surprisingly, the middle elevation site (bsl) had extreme temperature and precipitation values, including the highest mean annual temperature (4.2 °C) and precipitation seasonality (105.8%) and the lowest temperature seasonality (1223.2%), annual temperature range (44.9 °C) and mean diurnal range (11.4 °C) (Table 1). Interestingly, isothermality presented a stepwise increase from the site with the lowest elevation (lhs, 23.9) to the site with highest elevation (jcd, 26.6) (Table 1). All the above climatic parameters were extremely correlated with elevation, with the highest correlations of isothermality (R = 0.979), mean temperature of the warmest quarter (R = −0.821) and temperature seasonality (R = −0.812) (Figure S1).
3.2. Soil Nutrient Status
Soil nutrient contents declined along the elevation gradient (Figure 2). In particular, the TNS (1.30–4.68 Mg/ha) and TPS (0.18–0.60 Mg/ha) gradually declined along the elevation gradient by 72.17% and 69.05 (Figure 2), respectively. The contents of TCS, AN and WC were also lowest at the highest elevation site (jcd), with values of 23.67 Mg/ha, 245.90 mg/kg, and 860.57 t/hm2 (Figure 2), respectively. Additionally, the highest values were encountered at lower elevation sites. For instance, the contents of TCS and AN were highest at the third lowest site (lw), with values of 68.83 Mg/ha and 948.58 mg/kg (Figure 2), respectively; the WC content was highest (1311.93 t/hm2) at the plot with the second lowest elevation (hnh) (Figure 2). In contrast, the TKS content presented an increase along higher elevation gradients, and its values were nearly lowest at lw (7.57 Mg/ha), increased stepwise from bsl (10.35 Mg/ha) to sjh (19.24 Mg/ha), and then reached the highest value of 22.93 Mg/ha at the highest elevation site (jcd) (Figure 2).
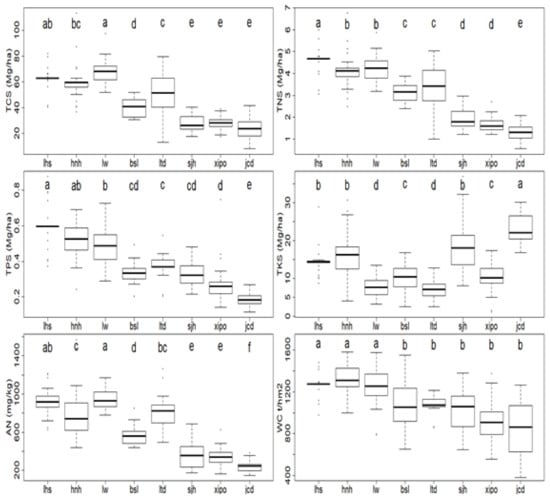
Figure 2.
Soil nutrient status along the elevation gradient. Chemical properties include total carbon stock (TCS), total nitrogen stock (TNS), total phosphorus stock (TPS), total potassium stock (TKS), readily available nitrogen (AN), and soil capillary water retention (WC). Different letters (a–f) indicate significant differences among different sampling plots. Mg denotes Megagram.
3.3. Plant Traits
Plant traits showed clear distinctions along this elevation gradient (Figure 3). The higher sites (e.g., xipo, jcd) had the largest Ba values (42.97–49.31 m2/ha) and relative abundance of EM trees (84.95%–92.54%) but significantly declined with the relative abundance of AM trees (5.83%–13.68%), as well as the values of CWM.LA (18.03–19.51 cm2), CWM.LNC (1.76%–1.78%), and CWM.LPC (1.57%–1.75%) (Figure 3). However, lower elevation sites (e.g., lhs, hnh and lw) presented contrasting tendencies, with lower Ba values (24.77–31.32 m2/ha) and EM tree proportion (28.89%–36.65%), but higher values of AM trees (52.30%–68.62%), CWM.LA (61–54–108.13 cm2), CWM.LNC (2.13%–2.23%), and CWM.LPC (1.78%–1.86%) (Figure 3). From the lower (lw) to the highest site (jcd), Ba and EM tree proportions increased nearly 1.0-fold (24.8–49.3) and 2.2-fold (28.9%–92.5%) (Figure 3), respectively. In contrast, AM tree proportion presented a 91.5% decrease from the lower (lw, 68.8%) to the highest elevation site (jcd, 5.8%) (Figure 3). Decreasing trends were also encountered with plant function traits along the elevation gradient: CWM.LA, CWM.LNC and CWM.LPC declined 83.3% (108.1 cm2 (lw) to 18.0 cm2 (jcd)), 24.8% (2.3 (ltd) to 1.8 (jcd)) and 15.8% (1.8 (lhs) to 1.6 (xipo)) (Figure 3), respectively.
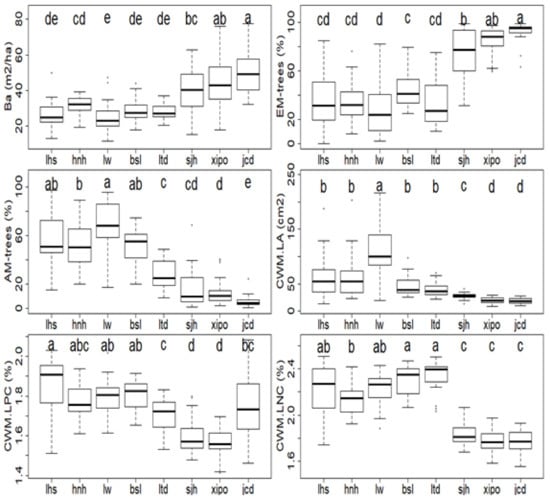
Figure 3.
Plant traits along the elevation gradient. Plant traits include the basal area of all individual trees (Ba), relative abundances of ectomycorrhizal (EM) and arbuscular mycorrhizal (AM) trees, and community weighted means of leaf area (CWM.LA), leaf nitrogen content (CWM.LNC), and leaf phosphorus content (CWM.LPC). Different letters (a–e) indicate significant differences among different sampling plots.
3.4. Microbial Diversity, Composition and Function
From the 18S rRNA and 16S rRNA gene sequences, we found 9519 fungal OTUs and 6121 bacterial OTUs from the 0–10 cm depth of soil (after rarefaction). Fungal and bacterial alpha diversity indices significantly changed with elevation (Figure 4). For instance, the fungal Chao1 index decreased 49.1% from the lower site (hnh, 1806.9) to the higher site (sjh, 919.4) (Figure 4). The bacterial Shannon index (H) decreased 27.7% from the lowest site (lhs, 5.0) to the higher site (sjh, 3.6) (Figure 4).
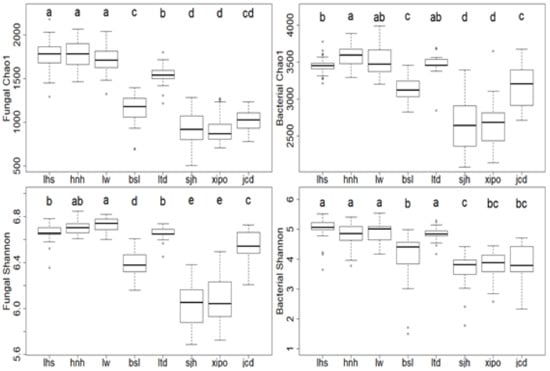
Figure 4.
Microbial diversity along the elevation gradient. Different letters (a–e) indicate significant differences among different sampling plots.
All fungal OTUs were assigned to six phyla: Basidiomycota, Ascomycota, Zygomycota, Rozellomycota, Chytridiomycota, and Glomeromycota. Across eight plots, the dominant fungal phyla with high relative abundance on average ranked as Basidiomycota (23.5%–63.2%), Ascomycota (19.9%–41.4%), Zygomycota (9.4%–24.0%), and Rozellomycota (0.5%–4.1%) (Figure S2). We did not find a clear elevation-mediated trend with these fungal phyla, though contrasting trends were encountered between Basidiomycota and Ascomycota, whose relative abundances presented a 1.7-fold increase but a 51.9% decline from hnh to lw, respectively (Figure S2). The eight plots were encountered with about 12 dominant bacterial phyla (whose most abundant OTUs being greater than 0.5%), with the majority of OTUs assigning to Proteobacteria (32.4%–38.8%), Acidobacteria (20.3%–34.0%), and Actinobacteria (7.4%–19.2%) (Figure S3). No clear elevation-mediated trend was found with these bacterial phyla (Figure S3).
Of the fungal functional groups, the relative abundances of EM, saprotrophs and pathogens ranged from 3.2%–45.2%, 3.2%–9.4%, and 0.1%–2.9% (Figure 5), respectively. Particularly, EM significantly increased 13.2-fold from the lower site (lw, 3.2%) to the higher site (sjh, 45.2%) (Figure 5). Reverse trends occurred with the saprotrophs and pathogens: the former presented a 65.9% decline from lw (9.4%) to sjh (3.2%); the latter showed a 95.4% decrease from lw (2.9%) to sjh (0.1%) (Figure 5). No clear elevation trend was observed with AM, whose relative abundances were less than 0.2% across the 8 sampling sites (Figure 5).
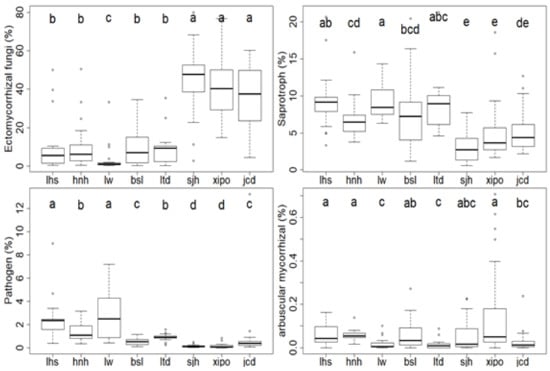
Figure 5.
Fungal function groups along the elevation gradient. Function groups include ectomycorrhizal (EM), saprotroph, arbuscular mycorrhizal (AM), and pathogen. Different letters (a–e) indicate significant differences between the three different disturbance levels.
Of the bacterial functional groups, the aerobic chemoheterotrophy and chemoheterotrophy were the most abundant and ranged from 11.7%–15.5% and 12.9%–16.2% (Figure 6), respectively. A weak elevation trend occurred with these two function groups. For the chemoheterotrophy, for example, the relative abundances ranked highest at the lowest sites of lhs and hnh (15.8% and 15.3%, respectively), slightly lower at the middle sites of lw and bsl (14.3% and 14.8%, respectively), and lowest at the higher site sjh (12.9%) (Figure 6).
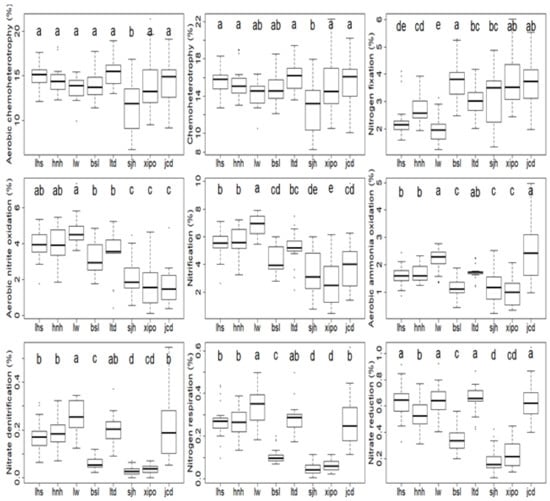
Figure 6.
Bacterial function groups along the elevation gradient. Different letters (a–e) indicate significant differences among different sampling plots.
The nitrogen fixation function group of bacteria generally increased its relative abundance along the elevation gradient, being lowest at the lower site of lw (2.0%), increasing at the middle sites of ltd and sjh (3.0% and 3.2%, respectively), and reaching the highest level at the highest sites of xipo and jcd (3.8% and 3.7%, respectively) (Figure 6). The rest of the nitrogen cycling function groups of bacteria generally encountered decreasing trends along the elevation gradient. For instance, the aerobic nitrite oxidation group was most abundant at the lower site of lw (4.7%), decreased at the middle sites of bsl and ltd (3.2% and 3.5%, respectively), and ranked lowest at the highest site (1.6% at jcd) (Figure 6). A very similar trend occurred with the nitrification function group, whose relative abundance ranked highest at lw plot (6.9%), lower at bsl and ltd plots (4.3% and 5.2%, respectively), and lowest at xipo plot (2.6%) (p < 0.05) (Figure 6).
4. Discussion
In this study, isothermality and mean diurnal temperature range were strongly and significantly positively correlated with the elevation gradient (R = 0.979 and R = 0.511, respectively, Table 1 and Figure S1). In contrast, the remaining climatic variables, such as temperature seasonality, mean temperature of the warmest quarter, annual temperature range and mean annual temperature, all declined significantly with elevation (Table 1 and Figure S1). Therefore, much of the variance in our forest composition and diversity and function along the elevation gradient could be explained by the effects of climatic variability at local scales. As previously reported, significant influences of isothermality and temperature (and/or precipitation) seasonality on geographical ranges of specific forests can be found at both global and regional scales [4].
Overall, isothermality, temperature seasonality and precipitation variability had dominant effects on plant traits, soil nutrient status, and microbial community diversity and function (Figure 7). Of these climatic variables, isothermality indicates the diurnal temperature oscillation relative to the annual temperature oscillation. Precipitation variation is closely related to the drought tolerance of species and their distribution along the elevation gradient. High isothermality can work in tandem with decreasing precipitation and temperature to generate stressful conditions, limit plant growth and slow the recovery rate [7,8]. Therefore, increased isothermality but decreased temperature and precipitation along the current elevation gradient can enhance the physiological stress on plants, allowing lower nutrient cycling rates in forests (Figure 2 and Figure 3). In addition, growth constraints along elevation gradients seemed more severe in the context of limited soil nutrient and water contents, which significantly decreased with elevation (Figure 2). Probably due to the direct high to low translocation of weathering mineral-bound nutrients (nitrogen, phosphorus and bases) [20], soil nutrient contents were significantly decreased at higher elevation sites (Figure 2). The significantly increased nitrogen fixation groups along elevation, accompanied by declines in remaining nitrogen cycling function groups in bacteria (Figure 6), strongly confirmed that soil nitrogen deficiency had occurred at higher elevation sites.
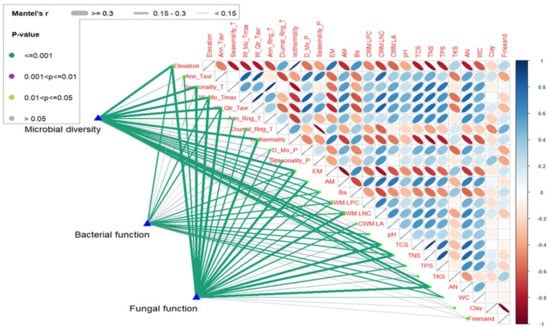
Figure 7.
Relationships between environmental variables and microbial community diversity and function composition. Pairwise comparisons of environmental factors with a color gradient denote Spearman’s correlation coefficients. Microbial diversity and function composition are related to each environmental factor by the Mantel test. The environmental variables include the mean annual temperature (Ann_Tavr), temperature seasonality (Seasonality_T), maximum temperature of the warmest month (W_Mo_Tmax), mean temperature of the warmest quarter (W_Quart_Tavr), annual temperature range (Ann_Rng_T), mean diurnal temperature range (Diurnal_Rng_T), isothermality (isothermality, precipitation of the driest month (D_Mo_P) and precipitation seasonality (Seasonality_P).
Such growth constraints due to increasing elevation may reduce plant physiological attributes such as evapotranspiration and photosynthetic rates, that confer vulnerability to decreased temperature and precipitation [7]. As a result, we found declined community-weighted mean foliar traits (e.g., CWM.LA, CWM.LNC and CWM.LPC) at high elevation sites (Figure 3). Isothermality and mean annual temperature are the most decisive factors influencing the suitable niche of ectomycorrhizal fungus (Suillus lakei) [6]. EM and its host abundances increased with elevation (Figure 3 and Figure 5), probably because of their high adaptation to nutrient stress by mobilizing nitrogen and phosphorus from organic polymers [47]. The ectomycorrhizal partner Douglas fir is the most important limiting factor influencing the present potential distribution of S. lakei [6]. Stand basal area (Ba) indicates the aboveground biomass increment over decades and can be highly related to Douglas fir occupation [48], which explains the significantly increased Ba at high elevation sites (Figure 3).
Higher temperature and edaphic nutrient status contribute positively to aboveground diversity and biomass. Together with slightly higher temperatures and high nutrient contents (e.g., TCS, TNS, TPS) (Table 1, Figure S1 and Figure 2), lower elevation sites are more likely to recruit fast-growing trees, expedite photosynthetic production and allocation, and promote microbial activity [16,27,49,50,51]. Additionally, lower elevation sites might be more easily exposed to logging activities or other human disturbances and thus tend to recruit pioneers with light-promoted and fast-growing traits (e.g., high leaf nitrogen content and leaf area) [52,53,54]. Compared to their higher elevation counterparts, lower elevation plots should be characterized by higher leaf area and nutrient contents (e.g., CWM.LA, CWM.LNC, CWM.LPC) (Figure 3). High photosynthetic capacity promotes carbon fluxes by rapidly advancing roots and increases belowground biodiversity and nutrient cycling activities [55,56,57]. Thus, soil nutrient stocks such as TCS, TNS and TPS were positively correlated with the CWM values of leaf carbon and nitrogen contents (Figure 7). Such higher nutrient status was definitely associated with higher relative abundance of AM trees (Figure 3), as AM fungi can significantly reduce soil nitrogen and phosphorus losses via nutrient immobilization in biomass and increment in soil aggregation stability [58].
Climate variability and habitat availability act as filters for the species distribution [5]. Furthermore, changes in climatic variables may influence the quality and turnover of soil organic matter. In particular, approximately 80% of the variance in soil organic carbon is explained by isothermality, precipitation seasonality and vegetation cover [59]. Both nutrient status (both soil and plant) and microbial community diversity (Figure 2, Figure 3 and Figure 4) presented a steep decline in response to increasing isothermality, which is consistent with the fact that the probability of the occurrence of the species may be reduced with larger temperature variability within an average month relative to the year [37], whereas less variable temperatures (i.e., reduced seasonality and a limited annual range) may be associated with greater tree and understory species diversity [60].
5. Conclusions
Our findings confirm the hypothesis that nutrient enrichment and the increases in air-temperature and precipitation from high to low elevations result in greater nutrient cycling activities of plant and diversified microbial communities. Higher contents of nitrogen and potassium in soil are associated with more diverse communities because both of these elements occur at higher concentrations in mixed stands due to less stress of climatic variability. These may shed light on the interactions and underlying bioclimatic variables that resulted in the correlations between the above- and belowground biologic communities as well as their concurrent adaptations to rapid global climate change.
Supplementary Materials
The following supporting information can be downloaded at: https://www.mdpi.com/article/10.3390/f14010098/s1, Figure S1 Spearman’s correlation relationships between elevation and climatic variables. Figure S2 Fungal phylum groups along the elevation gradient. Figure S3 Bacterial phylum groups along the elevation gradient.
Author Contributions
Conceptualization, J.Y.; methodology, J.Y.; software, J.Y.; validation, J.Y. and L.C.; formal analysis, J.Y.; investigation, S.L.; resources, S.L.; data creation, S.L.; writing—original draft preparation, Z.B.; writing—review and editing, Z.B., S.T., H.S. and Y.L.; visualization, Z.B.; supervision, Z.B.; project administration, Z.B.; funding acquisition, Z.B. All authors have read and agreed to the published version of the manuscript.
Funding
This research was funded by National Key R&D Program of China (grant number 2022YFF1300505) and the National Natural Science Foundation of China (grant number 42230515).
Data Availability Statement
Dataset and associated R codes used in the main results are available upon reasonable request to the corresponding author.
Conflicts of Interest
The authors declare that they have no known competing financial interest or personal relationships that could have appeared to influence the work reported in this paper.
References
- Cutler, N.A.; Arroniz-Crespo, M.; Street, L.E.; Jones, D.L.; Chaput, D.L.; DeLuca, T.H. Long-Term Recovery of Microbial Communities in the Boreal Bryosphere Following Fire Disturbance. Microb. Ecol. 2017, 73, 75–90. [Google Scholar] [CrossRef] [PubMed]
- Schuldt, A.; Assmann, T.; Brezzi, M.; Buscot, F.; Eichenberg, D.; Gutknecht, J.; Hardtle, W.; He, J.S.; Klein, A.M.; Kuhn, P.; et al. Biodiversity across trophic levels drives multifunctionality in highly diverse forests. Nat. Commun. 2018, 9, 2989. [Google Scholar] [CrossRef] [PubMed]
- Hong, Y.; Zhou, Q.; Hao, Y.; Huang, A.C. Crafting the plant root metabolome for improved microbe-assisted stress resilience. New Phytol. 2021, 234, 1945–1950. [Google Scholar] [CrossRef] [PubMed]
- Huang, E.; Chen, Y.; Fang, M.; Zheng, Y.; Yu, S.; Bjorkman, A. Environmental drivers of plant distributions at global and regional scales. Glob. Ecol. Biogeogr. 2021, 30, 697–709. [Google Scholar] [CrossRef]
- Kiedrzyński, M.; Zielińska, K.M.; Kiedrzyńska, E.; Jakubowska-Gabara, J. Regional climate and geology affecting habitat availability for a relict plant in a plain landscape: The case ofFestuca amethystinaL. in Poland. Plant Ecol. Divers. 2014, 8, 331–341. [Google Scholar] [CrossRef]
- Pietras, M.; Litkowiec, M.; Golebiewska, J. Current and potential distribution of the ectomycorrhizal fungus Suillus lakei ((Murrill) A.H. Sm. & Thiers) in its invasion range. Mycorrhiza 2018, 28, 467–475. [Google Scholar] [CrossRef]
- Maure, L.A.; Diniz, M.F.; Coelho, M.T.P.; Souza de Oliveira, M.P.; Ribeiro, M.C.; da Silva, F.R.; Hasui, É.; Disney, M.; Hernández-Stefanoni, J. Predicting resilience and stability of early second-growth forests. Remote Sens. Ecol. Conserv. 2022, 8, 477–491. [Google Scholar] [CrossRef]
- Garris, H.W.; Mitchell, R.J.; Fraser, L.H.; Barrett, L.R. Forecasting climate change impacts on the distribution of wetland habitat in the Midwestern United states. Glob. Change Biol. 2015, 21, 766–776. [Google Scholar] [CrossRef]
- Kyaschenko, J.; Clemmensen, K.E.; Karltun, E.; Lindahl, B.D. Below-ground organic matter accumulation along a boreal forest fertility gradient relates to guild interaction within fungal communities. Ecol. Lett. 2017, 20, 1546–1555. [Google Scholar] [CrossRef]
- Karpati, A.S.; Handel, S.N.; Dighton, J.; Horton, T.R. Quercus rubra-associated ectomycorrhizal fungal communities of disturbed urban sites and mature forests. Mycorrhiza 2011, 21, 537–547. [Google Scholar] [CrossRef]
- Veselá, P.; Vašutová, M.; Edwards-Jonášová, M.; Cudlín, P. Soil Fungal Community in Norway Spruce Forests under Bark Beetle Attack. Forests 2019, 10, 109. [Google Scholar] [CrossRef]
- Peri, P.L.; Rosas, Y.M.; Ladd, B.; Toledo, S.; Lasagno, R.G.; Martínez Pastur, G. Modeling Soil Nitrogen Content in South Patagonia across a Climate Gradient, Vegetation Type, and Grazing. Sustainability 2019, 11, 2707. [Google Scholar] [CrossRef]
- Six, J.; Frey, S.D.; Thiet, R.K.; Batten, K.M. Bacterial and Fungal Contributions to Carbon Sequestration in Agroecosystems. Soil Sci. Soc. Am. J. 2006, 70, 555. [Google Scholar] [CrossRef]
- Hewitt, R.E.; Chapin, F.S., 3rd; Hollingsworth, T.N.; Taylor, D.L. The potential for mycobiont sharing between shrubs and seedlings to facilitate tree establishment after wildfire at Alaska arctic treeline. Mol. Ecol. 2017, 26, 3826–3838. [Google Scholar] [CrossRef]
- Baraloto, C.; Hérault, B.; Paine, C.E.T.; Massot, H.; Blanc, L.; Bonal, D.; Molino, J.-F.; Nicolini, E.A.; Sabatier, D. Contrasting taxonomic and functional responses of a tropical tree community to selective logging. J. Appl. Ecol. 2012, 49, 861–870. [Google Scholar] [CrossRef]
- Mayor, J.R.; Sanders, N.J.; Classen, A.T.; Bardgett, R.D.; Clement, J.C.; Fajardo, A.; Lavorel, S.; Sundqvist, M.K.; Bahn, M.; Chisholm, C.; et al. Elevation alters ecosystem properties across temperate treelines globally. Nature 2017, 542, 91–95. [Google Scholar] [CrossRef]
- Lin, Y.-T.; Hu, H.-W.; Whitman, W.B.; Coleman, D.C.; Chiu, C.-Y. Comparison of soil bacterial communities in a natural hardwood forest and coniferous plantations in perhumid subtropical low mountains. Bot. Stud. 2014, 55. [Google Scholar] [CrossRef]
- Meng, H.; Li, K.; Nie, M.; Jia, R.W.; Zhe, X.Q.; Chang, M.F.; Jia, K.C.; Ji, D.G.; Li, B. Responses of bacterial and fungal communities to an elevation gradient in a subtropical montane forest of China. Appl. Microbiol. Biotechnol. 2013, 97, 2219–2230. [Google Scholar] [CrossRef]
- Mukai, M.; Aiba, S.-i.; Kitayama, K. Soil-nutrient availability and the nutrient-use efficiencies of forests along an altitudinal gradient on Yakushima Island, Japan. Ecol. Res. 2016, 31, 719–730. [Google Scholar] [CrossRef]
- Swinfield, T.; Both, S.; Riutta, T.; Bongalov, B.; Elias, D.; Majalap-Lee, N.; Ostle, N.; Svatek, M.; Kvasnica, J.; Milodowski, D.; et al. Imaging spectroscopy reveals the effects of topography and logging on the leaf chemistry of tropical forest canopy trees. Glob. Chang. Biol. 2020, 26, 989–1002. [Google Scholar] [CrossRef]
- Dahlgren, R.A.; Driscoll, C.T. The effects of whole-tree clear-cutting on soil processes at the Hubbard Brook Experimental Forest, New Hampshire, USA. Plant Soil 1994, 158, 239–262. [Google Scholar] [CrossRef]
- Lin, Y.T.; Chiu, C.Y. Elevation gradient of soil bacterial communities in bamboo plantations. Bot. Stud. 2016, 57, 8. [Google Scholar] [CrossRef] [PubMed]
- Gallagher, R.V.; Falster, D.S.; Maitner, B.S.; Salguero-Gomez, R.; Vandvik, V.; Pearse, W.D.; Schneider, F.D.; Kattge, J.; Poelen, J.H.; Madin, J.S.; et al. Open Science principles for accelerating trait-based science across the Tree of Life. Nat. Ecol. Evol. 2020, 4, 294–303. [Google Scholar] [CrossRef] [PubMed]
- Yang, T.; Tedersoo, L.; Soltis, P.S.; Soltis, D.E.; Gilbert, J.A.; Sun, M.; Shi, Y.; Wang, H.; Li, Y.; Zhang, J.; et al. Phylogenetic imprint of woody plants on the soil mycobiome in natural mountain forests of eastern China. ISME J. 2019, 13, 686–697. [Google Scholar] [CrossRef] [PubMed]
- ter Steege, H.; Pitman, N.C.; Phillips, O.L.; Chave, J.; Sabatier, D.; Duque, A.; Molino, J.F.; Prevost, M.F.; Spichiger, R.; Castellanos, H.; et al. Continental-scale patterns of canopy tree composition and function across Amazonia. Nature 2006, 443, 444–447. [Google Scholar] [CrossRef]
- Subedi, S.; Hogan, J.A.; Ross, M.S.; Sah, J.P.; Baraloto, C. Evidence for trait-based community assembly patterns in hardwood hammock forests. Ecosphere 2019, 10, e02956. [Google Scholar] [CrossRef]
- Angst, G.; Mueller, K.E.; Eissenstat, D.M.; Trumbore, S.; Freeman, K.H.; Hobbie, S.E.; Chorover, J.; Oleksyn, J.; Reich, P.B.; Mueller, C.W. Soil organic carbon stability in forests: Distinct effects of tree species identity and traits. Glob. Change Biol. 2019, 25, 1529–1546. [Google Scholar] [CrossRef]
- Chai, Y.; Cao, Y.; Yue, M.; Tian, T.; Yin, Q.; Dang, H.; Quan, J.; Zhang, R.; Wang, M. Soil Abiotic Properties and Plant Functional Traits Mediate Associations Between Soil Microbial and Plant Communities During a Secondary Forest Succession on the Loess Plateau. Front. Microbiol. 2019, 10, 895. [Google Scholar] [CrossRef]
- de Vries, F.T.; Manning, P.; Tallowin, J.R.B.; Mortimer, S.R.; Pilgrim, E.S.; Harrison, K.A.; Hobbs, P.J.; Quirk, H.; Shipley, B.; Cornelissen, J.H.C.; et al. Abiotic drivers and plant traits explain landscape-scale patterns in soil microbial communities. Ecol. Lett. 2012, 15, 1230–1239. [Google Scholar] [CrossRef]
- Fanin, N.; Kardol, P.; Farrell, M.; Kempel, A.; Ciobanu, M.; Nilsson, M.C.; Gundale, M.J.; Wardle, D.A. Effects of plant functional group removal on structure and function of soil communities across contrasting ecosystems. Ecol. Lett. 2019, 22, 1095–1103. [Google Scholar] [CrossRef]
- van der Heijden, M.G.; Bardgett, R.D.; van Straalen, N.M. The unseen majority: Soil microbes as drivers of plant diversity and productivity in terrestrial ecosystems. Ecol. Lett. 2008, 11, 296–310. [Google Scholar] [CrossRef]
- Nasto, M.K.; Alvarez-Clare, S.; Lekberg, Y.; Sullivan, B.W.; Townsend, A.R.; Cleveland, C.C. Interactions among nitrogen fixation and soil phosphorus acquisition strategies in lowland tropical rain forests. Ecol. Lett. 2014, 17, 1282–1289. [Google Scholar] [CrossRef]
- Liu, S.; Yuan, Z.; Ali, A.; Sanaei, A.; Mao, Z.; Ding, F.; Zheng, D.; Fang, S.; Jia, Z.; Tao, Z.; et al. Anthropogenic Disturbances Shape Soil Capillary and Saturated Water Retention Indirectly via Plant Functional Traits and Soil Organic Carbon in Temperate Forests. Forests 2021, 12, 1588. [Google Scholar] [CrossRef]
- Yuan, Z.; Wang, S.P.; Ali, A.; Gazol, A.; Ruiz-Benito, P.; Wang, X.G.; Lin, F.; Ye, J.; Hao, Z.Q.; Loreau, M. Aboveground carbon storage is driven by functional trait composition and stand structural attributes rather than biodiversity in temperate mixed forests recovering from disturbances. Ann. For. Sci. 2018, 75. [Google Scholar] [CrossRef]
- Chen, L.; Wang, L.; Baiketuerhan, Y.; Zhang, C.; Zhao, X.; von Gadow, K. Seed dispersal and seedling recruitment of trees at different successional stages in a temperate forest in northeastern China. J. Plant Ecol. 2014, 7, 337–346. [Google Scholar] [CrossRef]
- Yuan, Z.; Ali, A.; Wang, S.; Gazol, A.; Freckleton, R.; Wang, X.; Lin, F.; Ye, J.; Zhou, L.; Hao, Z.; et al. Abiotic and biotic determinants of coarse woody productivity in temperate mixed forests. Sci. Total Environ. 2018, 630, 422–431. [Google Scholar] [CrossRef]
- Amissah, L.; Mohren, G.M.J.; Bongers, F.; Hawthorne, W.D.; Poorter, L. Rainfall and temperature affect tree species distribution in Ghana. J. Trop. Ecol. 2014, 30, 435–446. [Google Scholar] [CrossRef]
- Mao, Z.; Corrales, A.; Zhu, K.; Yuan, Z.; Lin, F.; Ye, J.; Hao, Z.; Wang, X. Tree mycorrhizal associations mediate soil fertility effects on forest community structure in a temperate forest. New Phytol. 2019, 223, 475–486. [Google Scholar] [CrossRef]
- Brundrett, M.C.; Tedersoo, L. Evolutionary history of mycorrhizal symbioses and global host plant diversity. New Phytol. 2018, 220, 1108–1115. [Google Scholar] [CrossRef]
- Yuan, Z.; Wang, S.; Gazol, A.; Mellard, J.; Lin, F.; Ye, J.; Hao, Z.; Wang, X.; Loreau, M. Multiple metrics of diversity have different effects on temperate forest functioning over succession. Oecologia 2016, 182, 1175–1185. [Google Scholar] [CrossRef]
- Ali, A.; Yan, E.R.; Chang, S.X.; Cheng, J.Y.; Liu, X.Y. Community-weighted mean of leaf traits and divergence of wood traits predict aboveground biomass in secondary subtropical forests. Sci. Total Environ. 2017, 574, 654–662. [Google Scholar] [CrossRef] [PubMed]
- Laliberté, E.; Legendre, P. A distance-based framework for measuring functional diversity from multiple traits. Ecology 2010, 91, 299–305. [Google Scholar] [CrossRef] [PubMed]
- Bai, Z.; Yuan, Z.Q.; Wang, D.M.; Fang, S.; Ye, J.; Wang, X.G.; Yuan, H.S. Ectomycorrhizal fungus-associated determinants jointly reflect ecological processes in a temperature broad-leaved mixed forest. Sci. Total Environ. 2020, 703, 135475. [Google Scholar] [CrossRef] [PubMed]
- Jiang, Y.; Lei, Y.; Yang, Y.; Korpelainen, H.; Niinemets, Ü.; Li, C. Divergent assemblage patterns and driving forces for bacterial and fungal communities along a glacier forefield chronosequence. Soil Biol. Biochem. 2018, 118, 207–216. [Google Scholar] [CrossRef]
- Nguyen, N.H.; Song, Z.; Bates, S.T.; Branco, S.; Tedersoo, L.; Menke, J.; Schilling, J.S.; Kennedy, P.G. FUNGuild: An open annotation tool for parsing fungal community datasets by ecological guild. Fungal Ecol. 2016, 20, 241–248. [Google Scholar] [CrossRef]
- Louca, S.; Parfrey, L.W.; Doebeli, M. Decoupling function and taxonomy in the global ocean microbiome. Science 2016, 353, 1272–1277. [Google Scholar] [CrossRef]
- Jones, D.L.; Nguyen, C.; Finlay, R.D. Carbon flow in the rhizosphere: Carbon trading at the soil–root interface. Plant Soil 2009, 321, 5–33. [Google Scholar] [CrossRef]
- Lwila, A.S.; Mund, M.; Ammer, C.; Glatthorn, J. Site conditions more than species identity drive fine root biomass, morphology and spatial distribution in temperate pure and mixed forests. For. Ecol. Manag. 2021, 499, 119581. [Google Scholar] [CrossRef]
- Yin, Y.; Yan, Z. Variations of soil bacterial diversity and metabolic function with tidal flat elevation gradient in an artificial mangrove wetland. Sci. Total Environ. 2020, 718, 137385. [Google Scholar] [CrossRef]
- Liu, J.; Jia, X.; Yan, W.; Zhong, Y.; Shangguan, Z. Changes in soil microbial community structure during long-term secondary succession. Land Degrad. Dev. 2020, 31, 1151–1166. [Google Scholar] [CrossRef]
- George, P.B.L.; Lallias, D.; Creer, S.; Seaton, F.M.; Kenny, J.G.; Eccles, R.M.; Griffiths, R.I.; Lebron, I.; Emmett, B.A.; Robinson, D.A.; et al. Divergent national-scale trends of microbial and animal biodiversity revealed across diverse temperate soil ecosystems. Nat. Commun. 2019, 10, 1107. [Google Scholar] [CrossRef] [PubMed]
- Sawada, Y.; Aiba, S.-I.; Takyu, M.; Repin, R.; Nais, J.; Kitayama, K. Community dynamics over 14 years along gradients of geological substrate and topography in tropical montane forests on Mount Kinabalu, Borneo. J. Trop. Ecol. 2015, 31, 117–128. [Google Scholar] [CrossRef]
- Higgins, M.A.; Asner, G.P.; Perez, E.; Elespuru, N.; Alonso, A. Variation in photosynthetic and nonphotosynthetic vegetation along edaphic and compositional gradients in northwestern Amazonia. Biogeosciences 2014, 11, 3505–3513. [Google Scholar] [CrossRef]
- Jia, G.; Yu, X.; Fan, D.; Jia, J. Mechanism Underlying the Spatial Pattern Formation of Dominant Tree Species in a Natural Secondary Forest. PLoS ONE 2016, 11, e0152596. [Google Scholar] [CrossRef]
- Penone, C.; Allan, E.; Soliveres, S.; Felipe-Lucia, M.R.; Gossner, M.M.; Seibold, S.; Simons, N.K.; Schall, P.; van der Plas, F.; Manning, P.; et al. Specialisation and diversity of multiple trophic groups are promoted by different forest features. Ecol. Lett. 2019, 22, 170–180. [Google Scholar] [CrossRef]
- García de Leon, D.; Davison, J.; Moora, M.; Opik, M.; Feng, H.; Hiiesalu, I.; Jairus, T.; Koorem, K.; Liu, Y.; Phosri, C.; et al. Anthropogenic disturbance equalizes diversity levels in arbuscular mycorrhizal fungal communities. Glob. Change Biol. 2018, 24, 2649–2659. [Google Scholar] [CrossRef]
- Bai, Z.; Ye, J.; Wei, Y.-L.; Yan, S.-K.; Yuan, H.-S. Soil depth-dependent C/N stoichiometry and fungal and bacterial communities along a temperate forest succession gradient. Catena 2021, 207, 105613. [Google Scholar] [CrossRef]
- Qiu, Q.; Bender, S.F.; Mgelwa, A.S.; Hu, Y. Arbuscular mycorrhizal fungi mitigate soil nitrogen and phosphorus losses: A meta-analysis. Sci. Total Environ. 2022, 807, 150857. [Google Scholar] [CrossRef]
- Peri, P.; Rosas, Y.; Ladd, B.; Toledo, S.; Lasagno, R.; Martínez Pastur, G. Modelling Soil Carbon Content in South Patagonia and Evaluating Changes According to Climate, Vegetation, Desertification and Grazing. Sustainability 2018, 10, 438. [Google Scholar] [CrossRef]
- Castaño-Santamaría, J.; López-Sánchez, C.A.; Obeso, J.R.; Barrio-Anta, M. Structure, environmental patterns and impact of expected climate change in natural beech-dominated forests in the Cantabrian Range (NW Spain). For. Ecol. Manag. 2021, 497, 119512. [Google Scholar] [CrossRef]
Disclaimer/Publisher’s Note: The statements, opinions and data contained in all publications are solely those of the individual author(s) and contributor(s) and not of MDPI and/or the editor(s). MDPI and/or the editor(s) disclaim responsibility for any injury to people or property resulting from any ideas, methods, instructions or products referred to in the content. |
© 2023 by the authors. Licensee MDPI, Basel, Switzerland. This article is an open access article distributed under the terms and conditions of the Creative Commons Attribution (CC BY) license (https://creativecommons.org/licenses/by/4.0/).