Abstract
Mangroves are a key type of protected coastal wetland, with a range of benefits such as protection from wave damage, sand fixation, water purification and ecological tourism. As the academic knowledge of mangroves has gradually increased, the use of remote sensing to monitor their dynamic changes in China has become a hot topic of discussion and has received attention in academic circles. Remote sensing has also provided necessary auxiliary decision-making suggestions and data support for the scientific and rational conservation, restoration and management of mangrove resources. In this paper, we used Landsat satellite series data combined with the normalized difference vegetation index (NDVI) and adaptive threshold partitioning (OTSU method) to monitor mangrove dynamics in coastal China from 1986 to 2021 based on Google Earth Engine (GEE), with three main results. (1) Based on the massive data and efficient computational capability of the GEE platform, we achieved large-scale interannual mangrove distribution extraction. The overall classification accuracy for 2019 exceeded 0.93, and the mangrove distribution extraction effect was good. (2) The total mangrove area and the mean patch size in China showed overall increasing trends, and Guangdong and Guangxi were the top two provinces in China in terms of the largest mangrove area. (3) Except for Dongzhaigang National Nature Reserve, the mangrove areas in other national mangrove reserves mainly showed increasing trends, confirming the effectiveness of the reserves. Data on the spatial structure and area trends of mangroves in China can provide scientific references for mangrove conservation and development, and serve in the further restoration of mangrove ecosystems.
1. Introduction
Mangroves are woody plant communities that grow on intertidal mudflats along tropical and subtropical coasts [1]. Mangroves not only have direct economic value as food, building materials, fuelwood and medicine, but also possess socio-ecological value [2,3], and play important roles in protecting from wave damage and fixing sand, promoting siltation and land formation, reducing marine pollution, purifying water, protecting marine species diversity and promoting the global carbon cycle, ecotourism and science education [4,5,6,7]. Therefore, it is important to study the changes to and distribution of mangroves.
Remote-sensing data have the advantages of wide coverage and a fast updating speed, and are widely used in national-scale mangrove resource surveys. For example, Giri et al. [8] used Landsat imagery and combined supervised and unsupervised classification methods to map the global mangrove distribution, giving an extracted mangrove area in China of 14,853 ha; Wu et al. [9] combined Landsat imagery and HJ-1 CCD data to obtain the mangrove area in China in 2010. However, due to the limitations of computational efficiency and data volume, studies involving the long-term series monitoring of mangrove changes usually use only three to five time-phases of remote sensing images with a long-term interval. For example, Li et al. [10] used aerial images and SPOT images to extract mangrove data in Guangxi for the years 1960, 2001, 2007 and 2010 and analyze their evolutionary mechanisms; Liao et al. [11] used Landsat images to study the changes in the mangroves in Hainan protected areas over a long time-series of 30 years; Jia et al. [12] extracted the mangrove area in China for the years 1973, 1980, 1990, 2000, 2010 and 2015 using Landsat-series satellite image data to analyze its change pattern; and Wong et al. [13] used SRTM and Landsat imagery to estimate the above-ground biomass loss of mangroves due to deforestation in North Borneo, Malaysia, from 2000 to 2015. In addition, studies that have monitored the multi-temporal dynamics of all mangroves in China have summarized and assembled mostly scholars’ findings for analysis: Lin et al. [14] summarized the area of mangroves in China extracted from other scholars’ work and analyzed the trends of mangrove changes in China and within each province; and Yang et al. [15] summarized the data of Chinese mangroves before 2013 and analyzed the changes of mangroves during that period, encountering problems such as a lack of unified data sources and inconsistent extraction standards. The methods of mangrove change detection based on remote sensing data mainly include visual interpretation, the threshold method, pixel-based classification, object-based image analysis (OBIA), multi-temporal classification, machine learning, etc. [12,16,17]. Among them, the combination of the spectral index and the threshold method is one of the most widely used and effective methods [18,19]. Compared with other methods, the spectral index-based method is simpler and more flexible, it is suitable for large-scale change detection, and different thresholds can be used for different regions.
Google Earth Engine (GEE) is one of the world’s most advanced information processing cloud platforms, which can perform cloud computing of remote-sensing images and other Earth observation data [20]. It plays an important role in large-scale geographic data processing and long-term change monitoring [21]. For example, Xiong et al. [22] combined Sentinel-2 and Landsat-8 data from 2015 to 2016 to map the extent of agricultural land across Africa based on GEE; Nguyen et al. [23] used GEE and Landsat images to analyze the spatial variation of mangroves in the Thanh Hoa and Nghe An provinces, Vietnam from 1973 to 2020. GEE has various application areas, including forest and vegetation research [24], and also plays an important role in the extraction of mangrove data with its data-processing cloud platform. For example, Diniz et al. [19] proposed the modular mangrove recognition index (MMRI) for mangroves based on Landsat TOA images and used it to analyze the dynamic changes of mangroves in Brazil during 1985–2018 based on GEE, and Bhargava et al. [25] studied the erosion and progradation of mangroves in the Sundarbans and French Guiana based on GEE. The extraction and analysis of mangroves in China based on GEE have been carried out: Chen et al. [26] combined Landsat satellite image data and Sentinel-1 SAR data to generate a mangrove distribution map in China in 2015; Wang et al. [27] used Landsat-7 ETM+ and Landsat-8 OLI time-series remote-sensing images to map the distribution of coastal wetlands in China in 2018 based on GEE; and Zhao et al. [28] mapped mangroves in China at a 10 m resolution in 2017 using Sentinel SAR and optical time-series imagery. However, most of these studies focused on one or a few years, with little analysis of interannual dynamic changes.
In this paper, we selected the southeast coast of China as the research object, used medium-resolution remote-sensing data (Landsat) to determine the ranges of mangroves using the normalized difference vegetation index (NDVI), and extracted them using the Otsu threshold segmentation algorithm (OTSU algorithm) to obtain the interannual dynamics of mangrove distribution and a long time-series in China for 1986–2021 based on GEE. The results complement the continuous interannual variation monitoring data of the unified data sources for Chinese mangroves, provide a scientific basis for the conservation, restoration and management of mangroves, and provide a reference for the ecological protection of environments.
2. Materials and Methods
2.1. Study Area
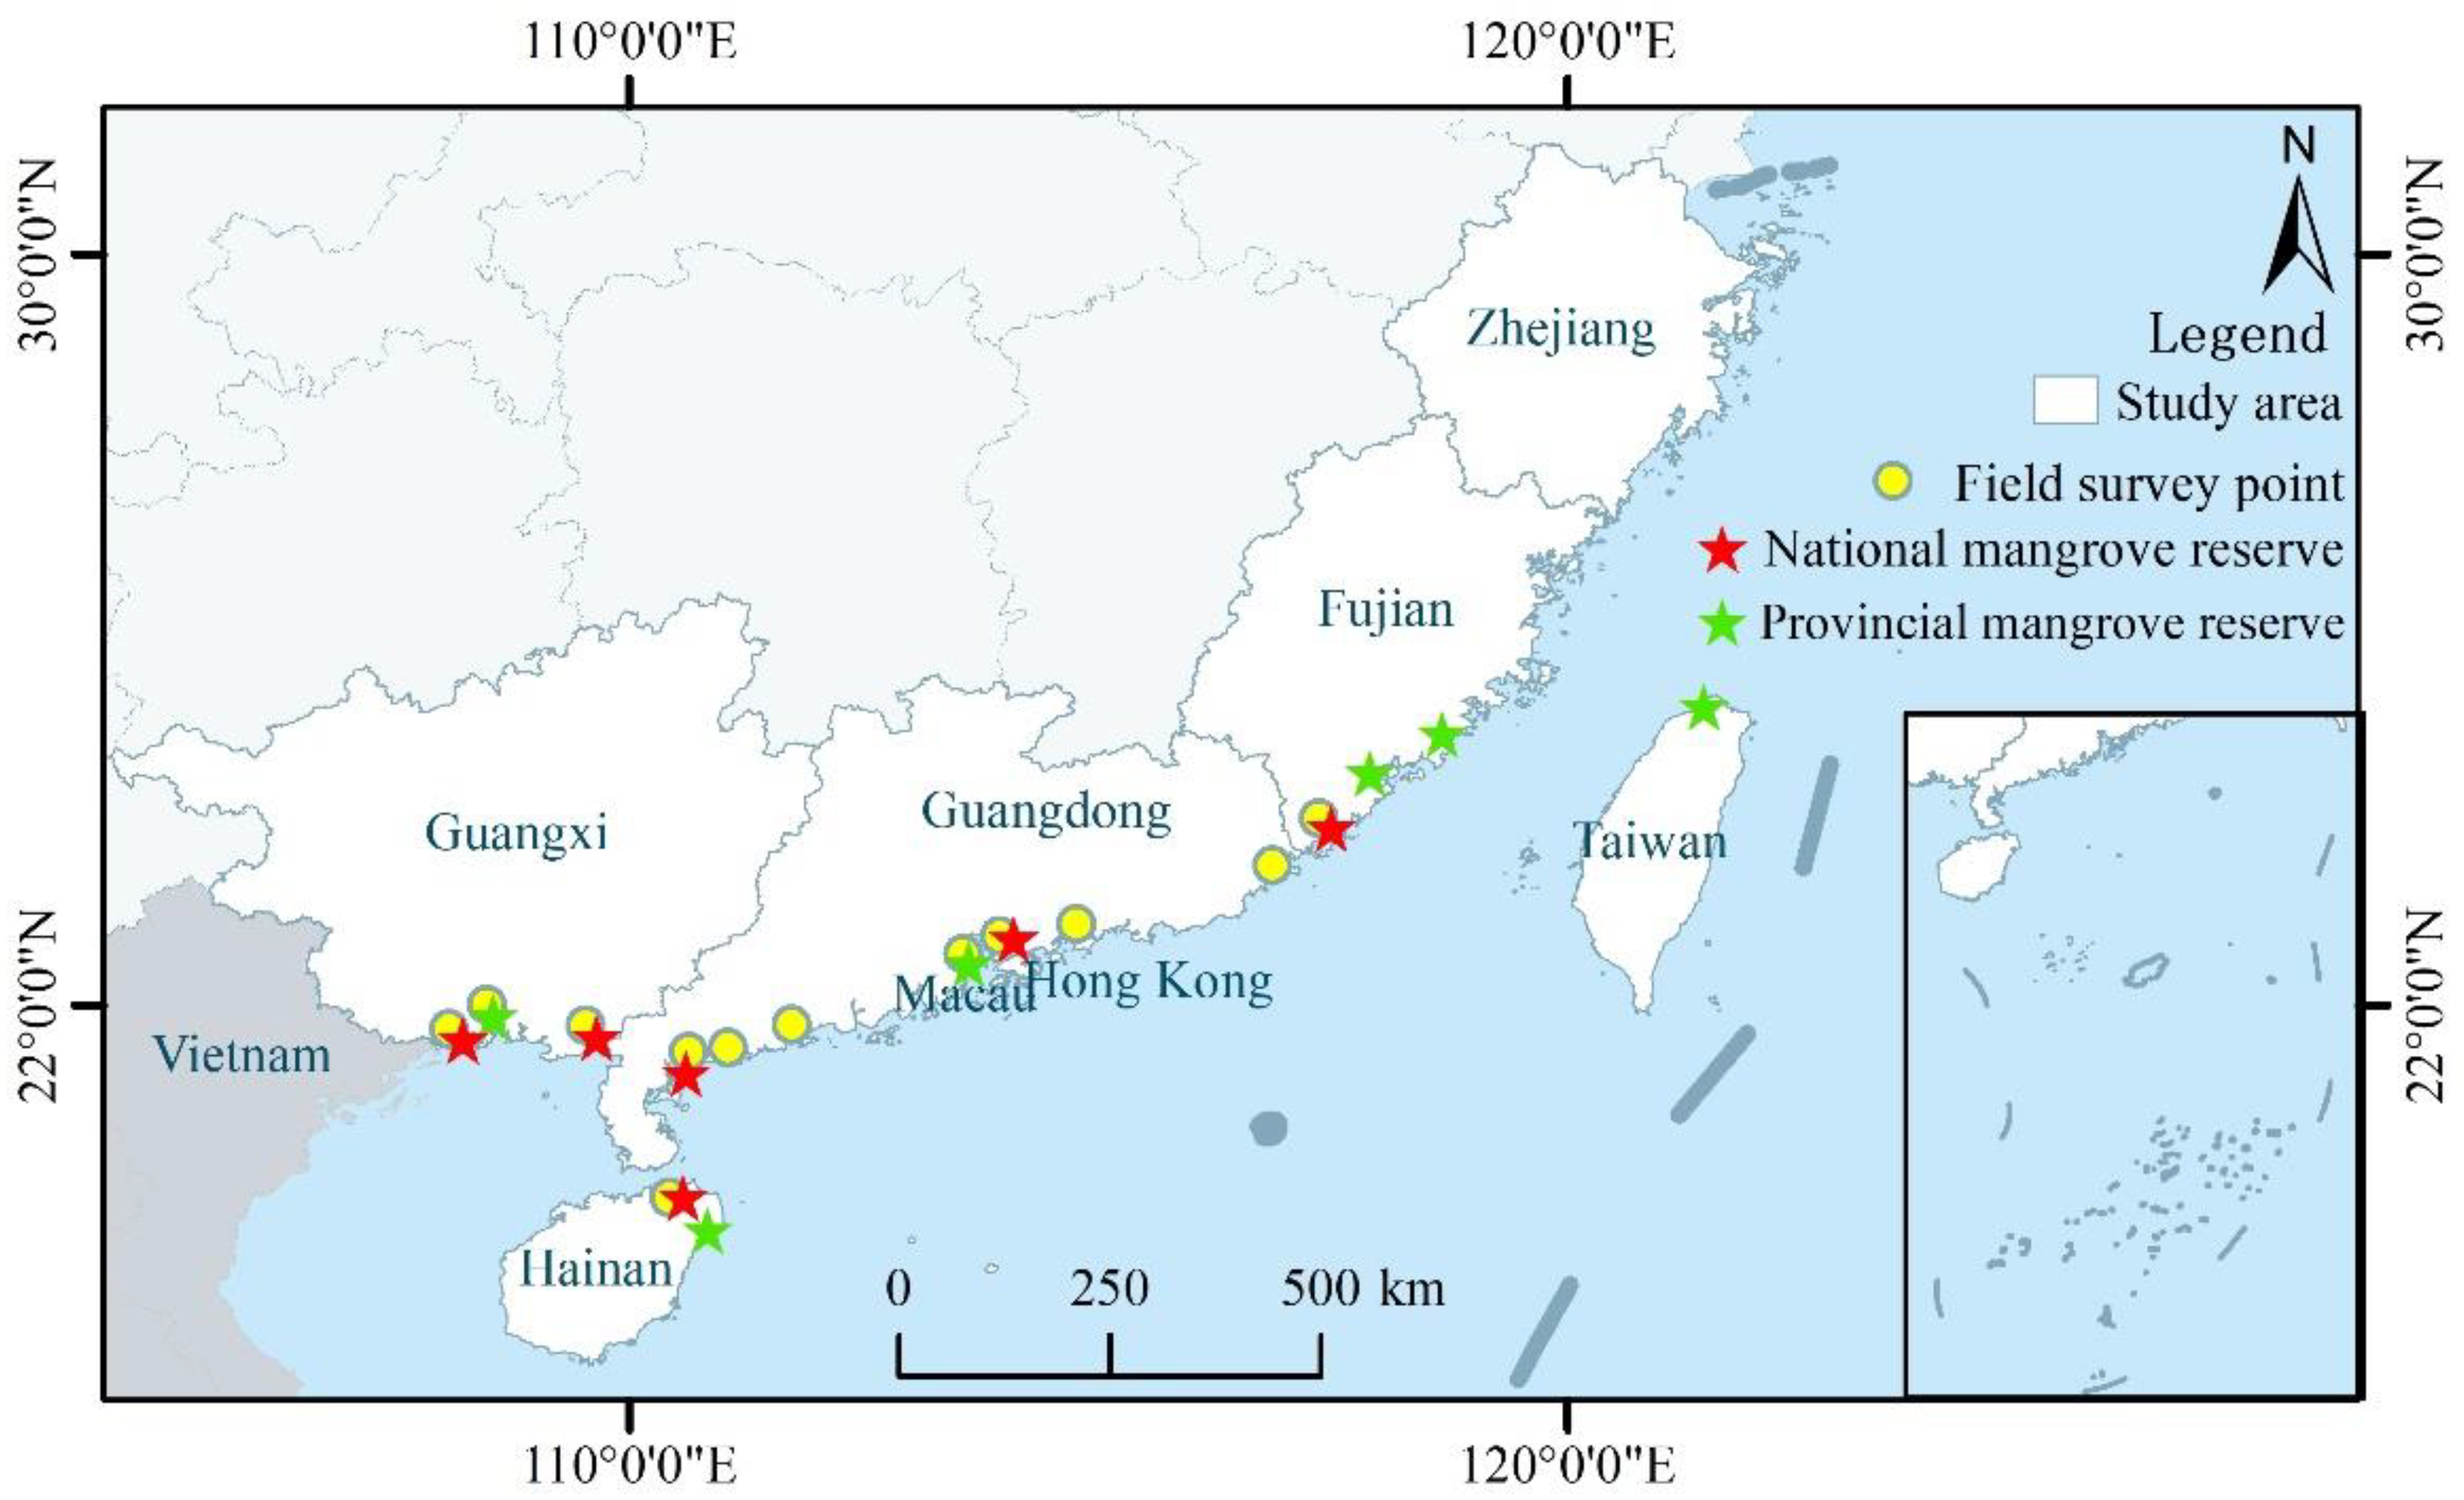
Mangrove-growing areas in China are mainly distributed in the Guangxi Zhuang Autonomous Region, Guangdong, the Hainan province, the Fujian province, the Zhejiang province, Hong Kong and Taiwan [29,30], which are located within 18°12′–30°09′ N and 108°03′–122°00′ E. The mangrove species in China mainly include Kandelia candel, Aegiceras corniculatum, Bruguiera gymnorhiza, Excoecaria agallocha, Avicennia marina, Rhizophora stylosa, Sonneratia apetala, etc. [31]. In addition, the number of mangrove species gradually decreases from south to north in coastal cities. The climate is mainly tropical and subtropical maritime monsoon, with warm and humid winters, hot and rainy summers, abundant precipitation, high relative humidity, average annual temperatures of 17.7–25.4 °C and an average annual rainfall of 1200–2200 mm. There are seven national mangrove nature reserves and six provincial mangrove nature reserves in China (Figure 1) [29].
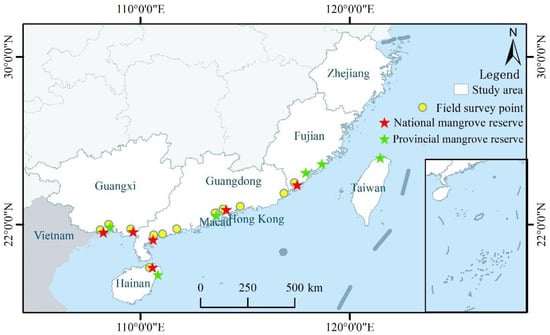
Figure 1.
The location of the study area and coastal cities where previous field surveys have been conducted.
2.2. Data
2.2.1. Landsat Data
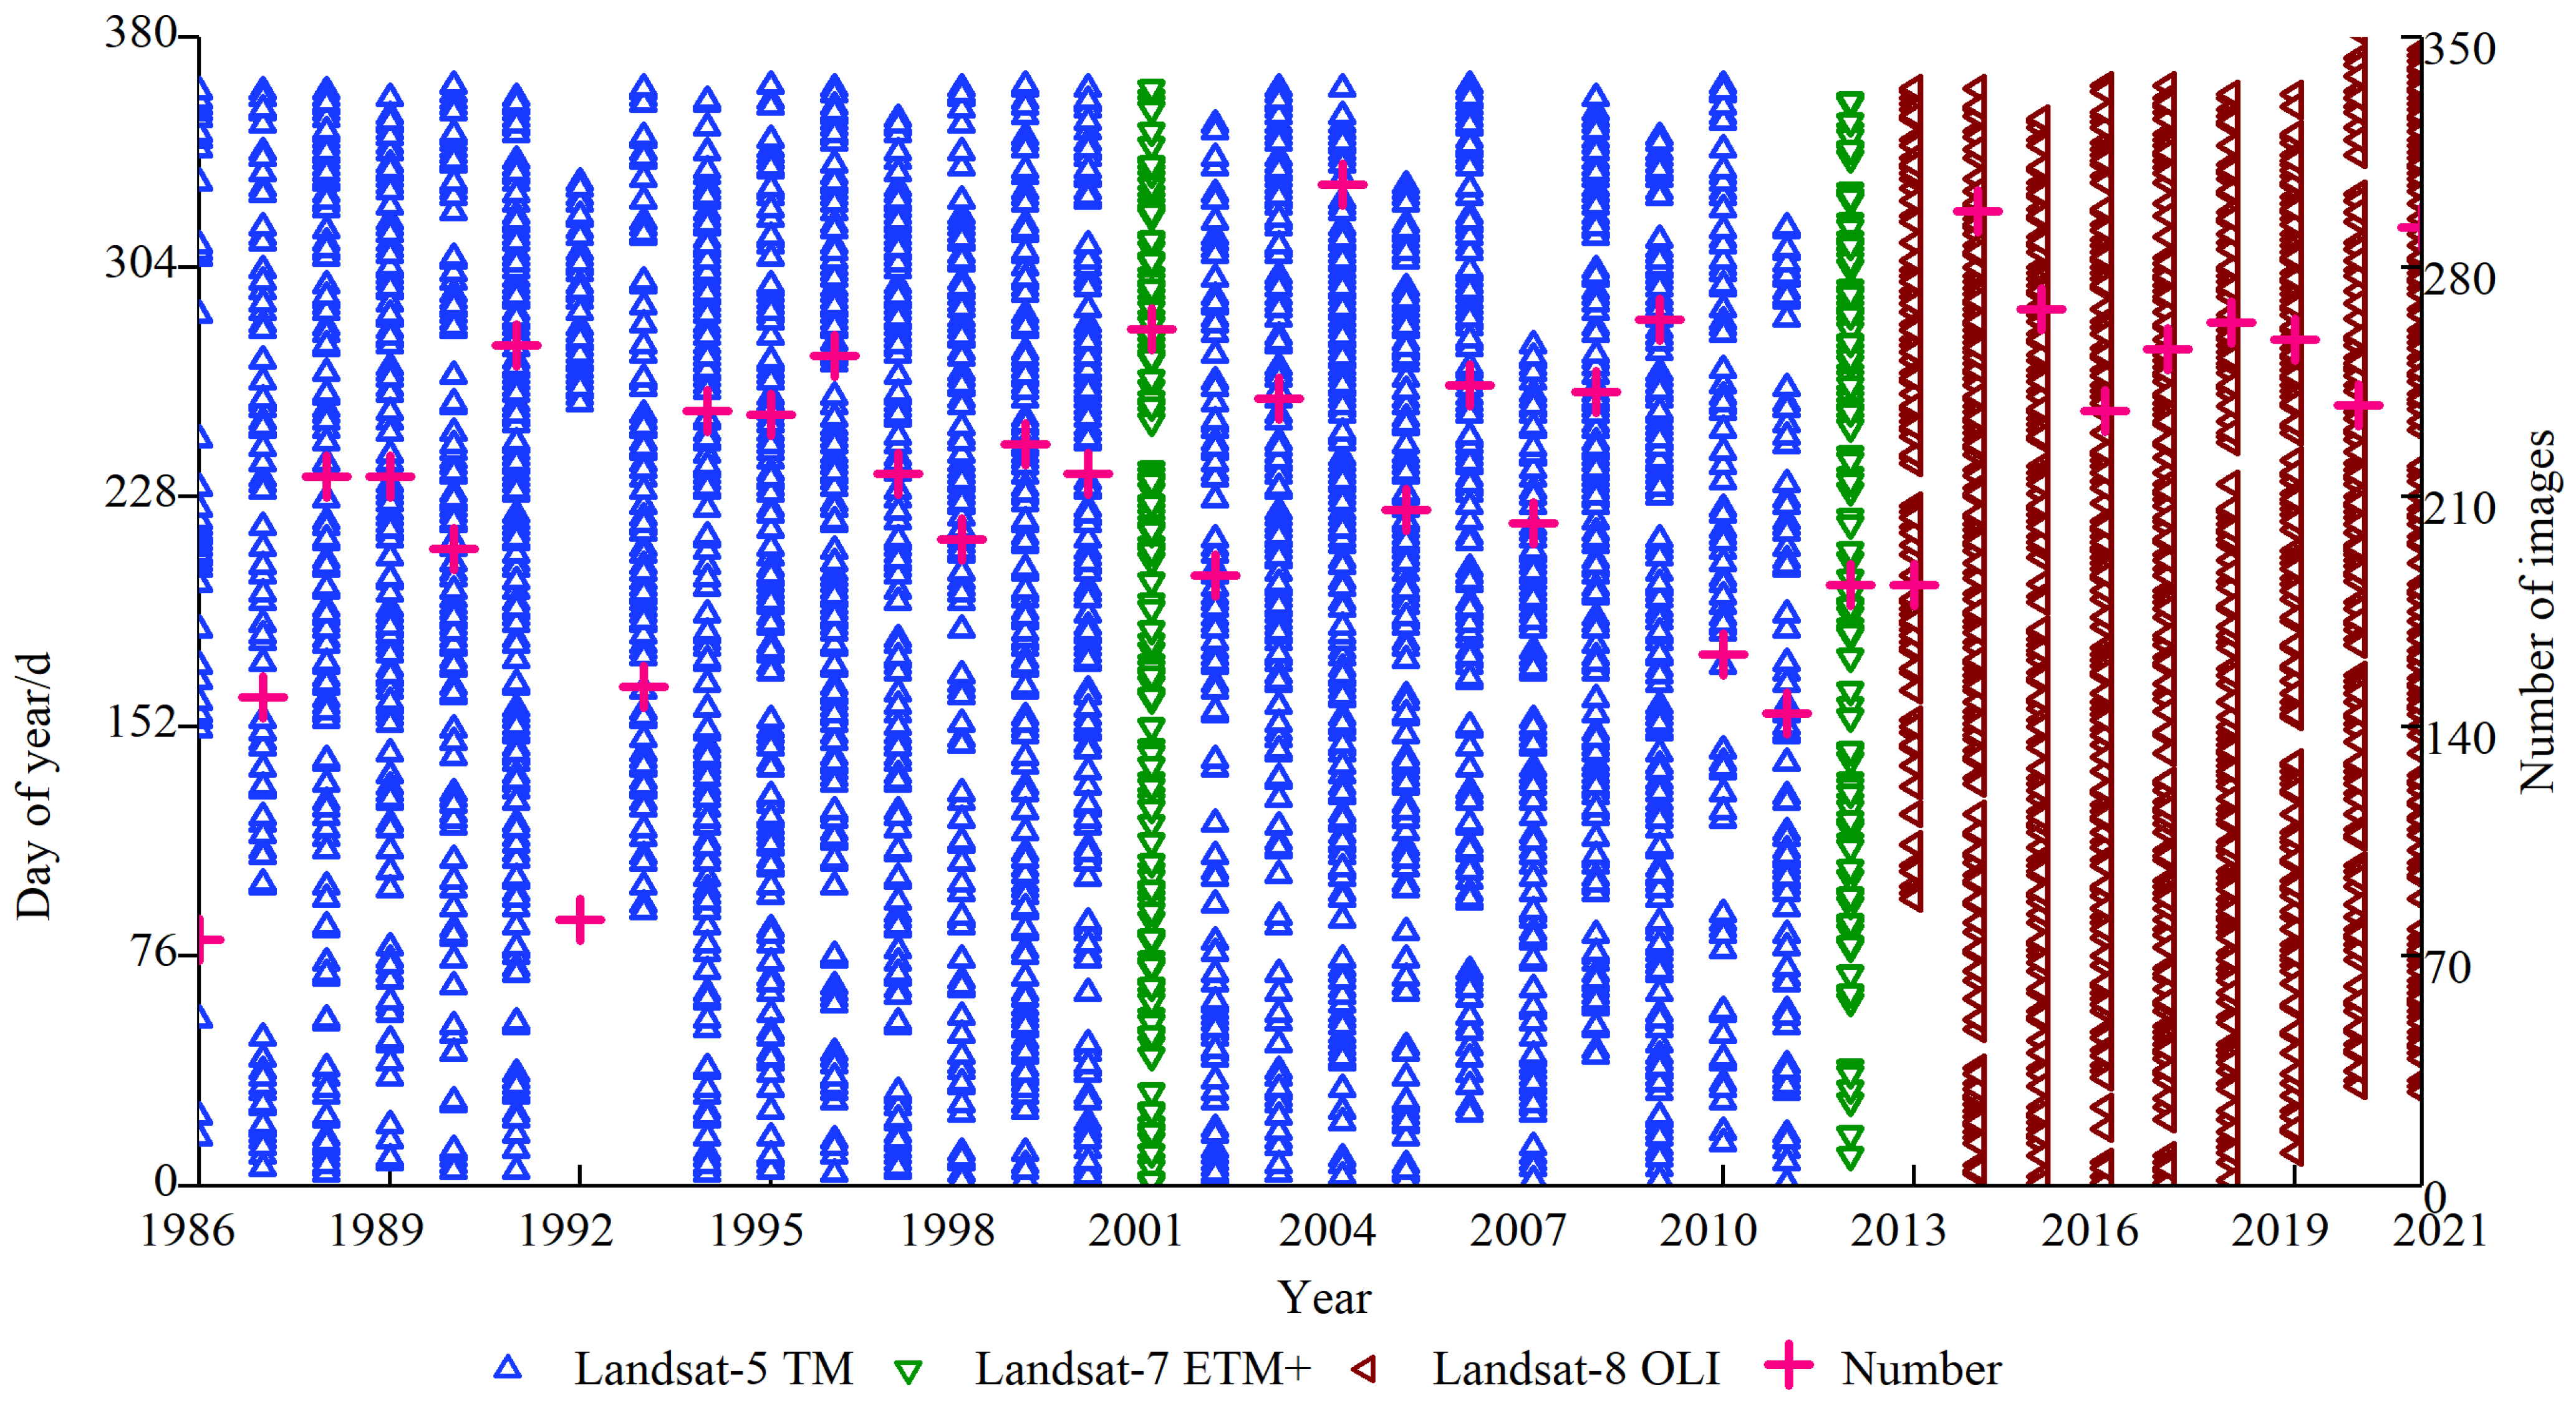
Surface reflectance (SR) data from Landsat-4 and subsequent Landsat-series satellites are available on GEE. This dataset was atmospherically corrected from the original data, while the resolution in the thermal infrared band was resampled to make the resolution uniform with the visible band. In this paper, we used the SR data of Landsat-5 TM, Landsat-7 ETM+ and Landsat-8 OLI in the study area for 1986–2021 provided by GEE, including the red, green, blue, NIR, SWIR 1 and SWIR 2 bands in six bands with a spatial resolution of 30 m. The dates and amount of data collected are shown in Figure 2.
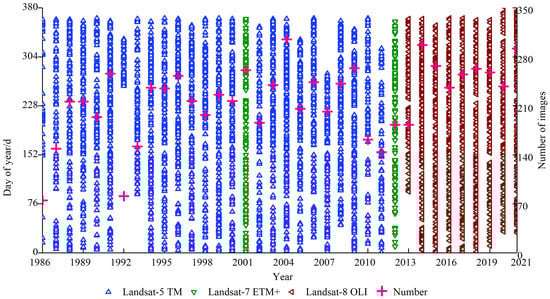
Figure 2.
Landsat-series remote-sensing data used in this paper.
2.2.2. Auxiliary Data
- Global mangrove distribution (GMF)
The GMF is the first data product to map the distribution of mangroves on a global scale. The product performs a preliminary supervised classification of 1000 Landsat TOA images for 1997–2000, using a large number of ground samples as input, and then generates the final results using manual visual interpretation [8]. The GMF provides a detailed description of the mangrove resources in each country, and provides a solid foundation for subsequent remote-sensing extraction studies of mangroves on a regional basis. The product is available through the NASA website (https://sedac.ciesin.columbia.edu/data/set/lulc-global-mangrove-forests-distribution-2000, accessed on 1 September 2022) and is included in the GEE archive data.
- Global mangrove watch (GMW)
The GMW is a collection of global mangrove distribution data extracted by Aberystwyth University and Earth Observation et al. [32]. The global mangrove distribution data were extracted using ALOS PALSAR and Landsat data, which first provided the global mangrove distribution map with 2010 as the baseline, and then combined with JERS-1 SAR, ALOS PALSAR and ALOS-2 PALSAR-2 data to finally obtain the global mangrove distribution maps for each of the years 1996, 2007, 2008, 2009, 2010, 2015 and 2016.
In this paper, we refer to the results of GMF and GMW data for many years, combine Google Earth images with the data from Gaofen-1 and other field surveys, visually judge and map the mangrove growth area (i.e., the possible growth range of mangroves), further exclude other features from the study area and try to retain only a few feature types of mangroves, water bodies and a small number of mudflats and impermeable surfaces, so as to improve the extraction efficiency of mangroves. The subsequent experiments were conducted based on this mangrove growth area.
- Field survey data
Since 2012, we have conducted a series of field surveys on mangroves in several coastal cities, including Zhangzhou, Shantou, Huizhou, Shenzhen, Zhuhai, Yangjiang, Maoming, Zhanjiang, Beihai, Qinzhou, Fangchenggang and Haikou (Figure 1). These field survey data was mainly used to select sample data combined with other auxiliary data.
2.3. Research Methodology
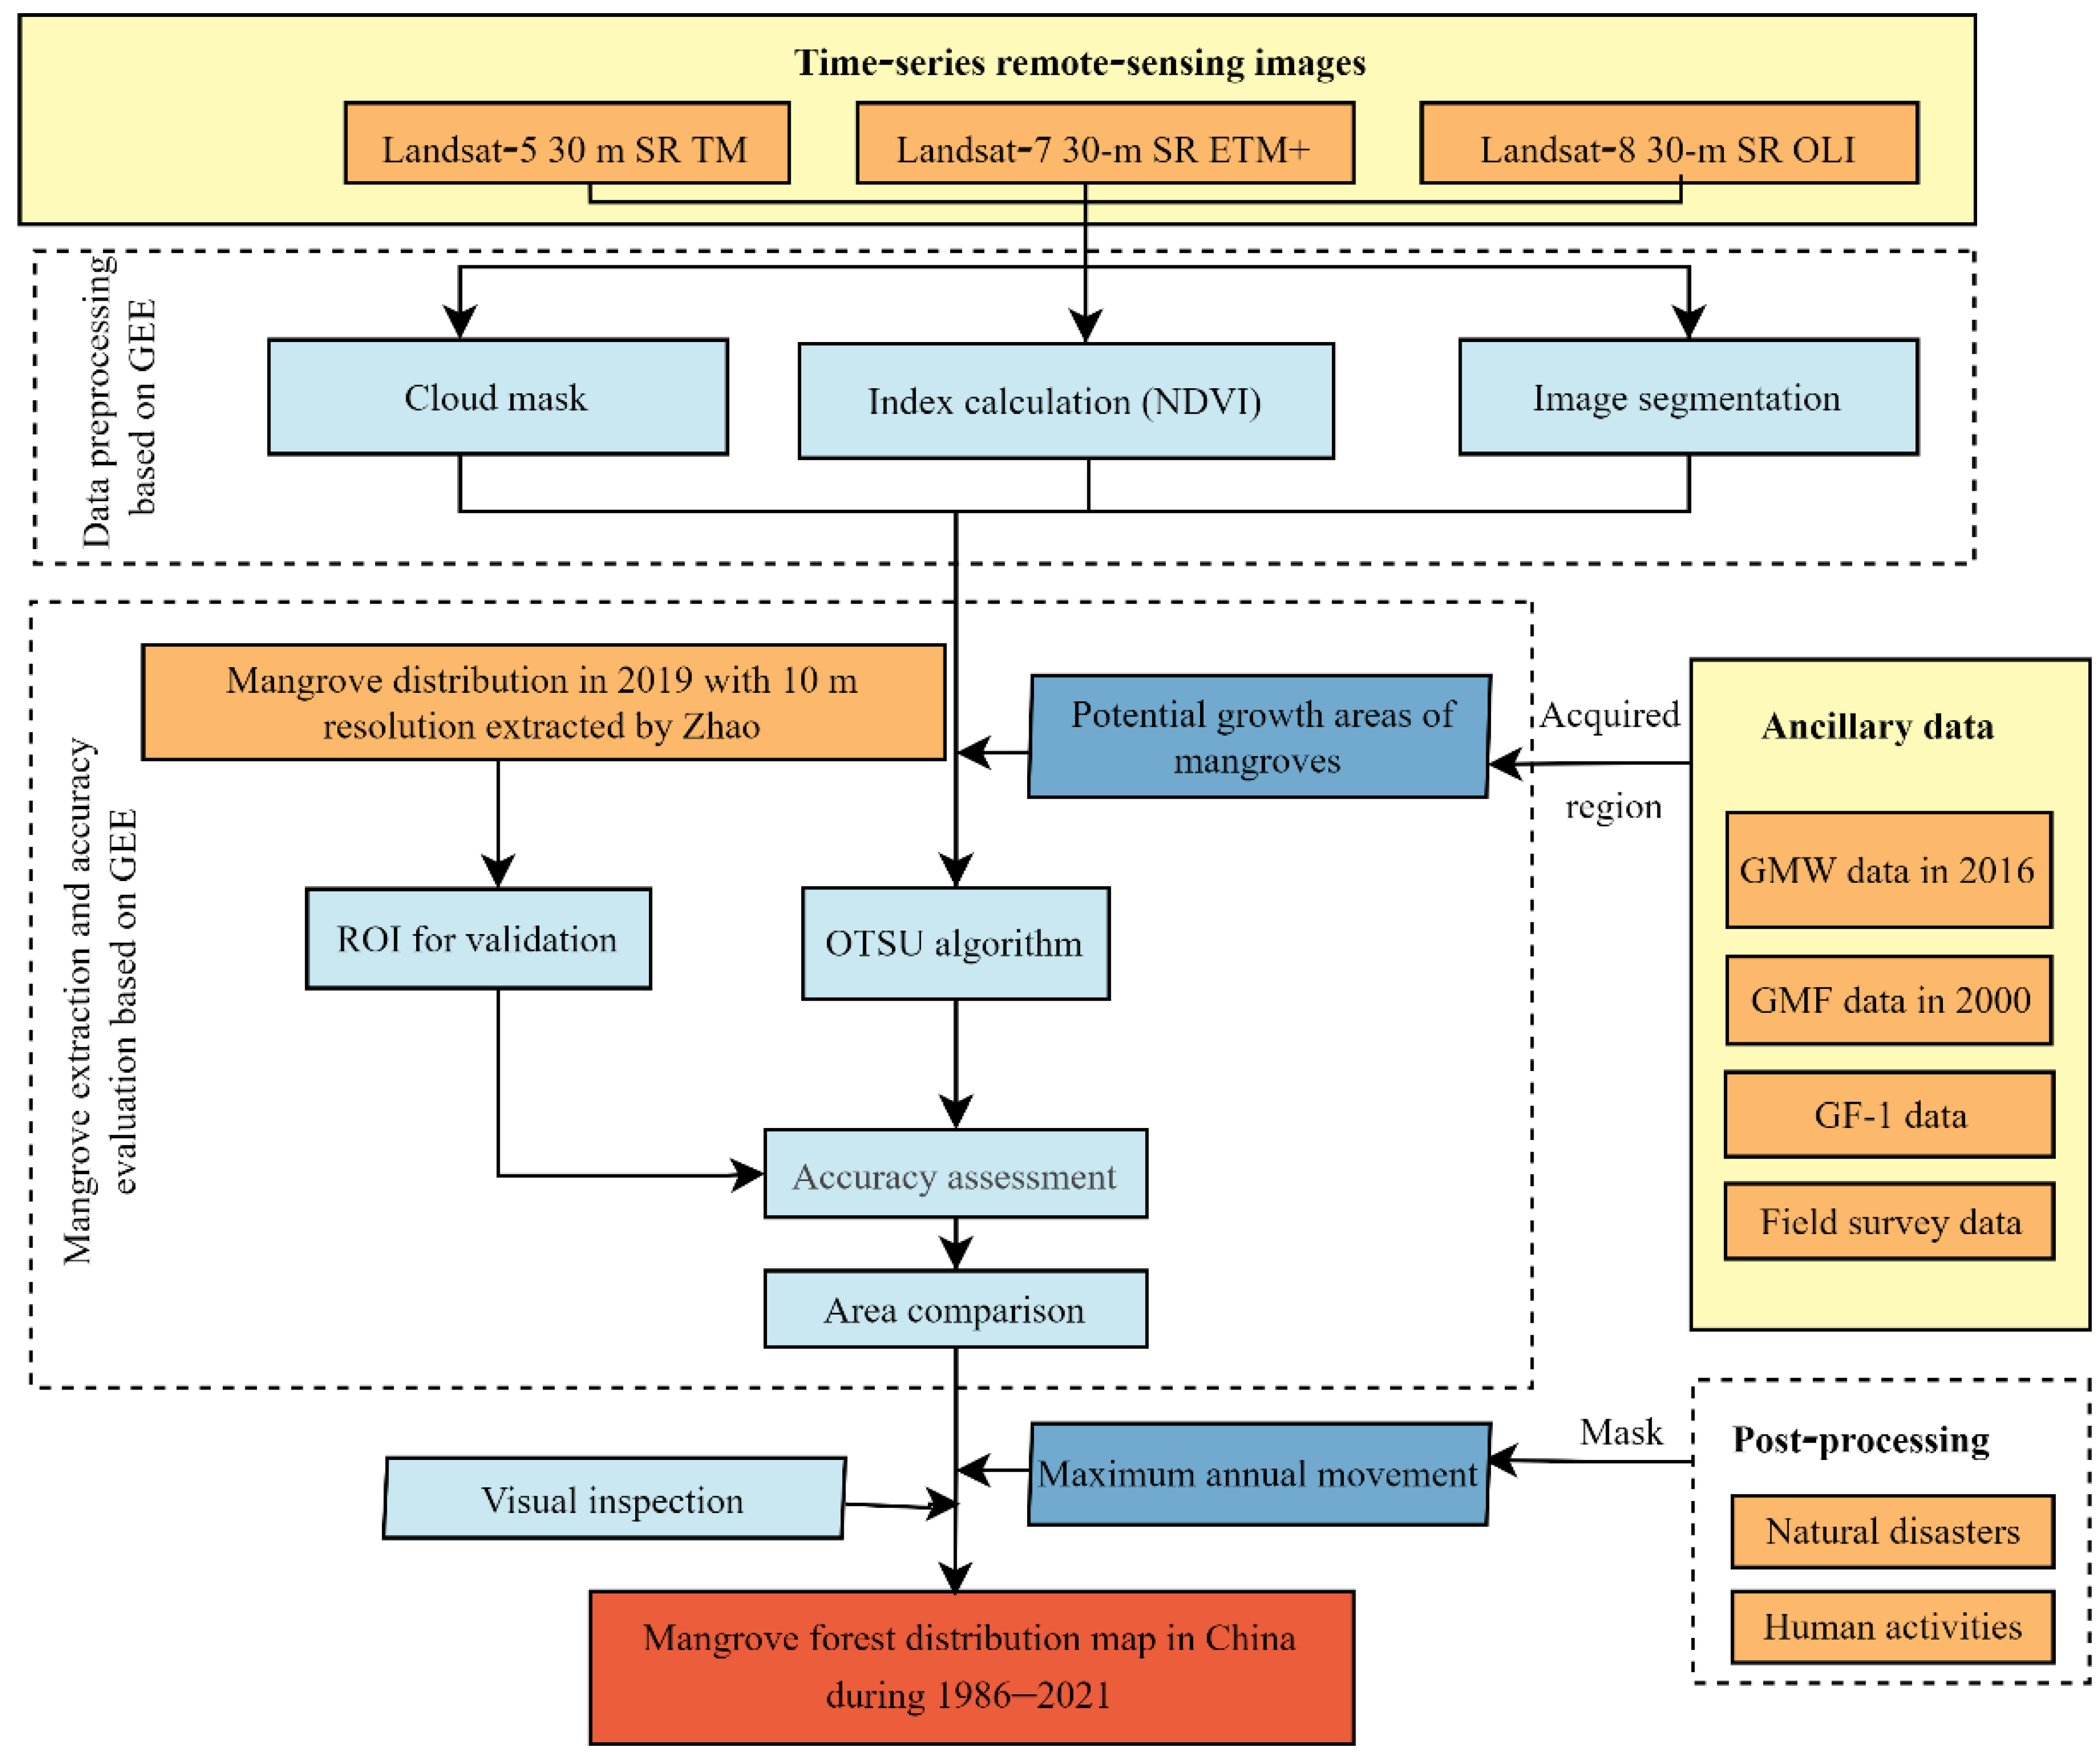
In this paper, based on the Landsat data stored on the GEE for 1986–2021, the NDVI was calculated by band calculation within the mangrove growth area. The index range for mangrove extraction was initially determined by combining with the OTSU algorithm, then the range was manually adjusted to achieve the optimal extraction effect through subsequent processing, and finally the 1986–2021 interannual Chinese mangrove distribution was obtained. A flow chart of the study is given in Figure 3.

Figure 3.
Flowchart.
2.3.1. Image Pre-Processing
The original Landsat TM, ETM+ and OLI images were generally calibrated by metadata to obtain the top-of-atmosphere reflectance (TOA) of the image. To obtain the surface reflectance (SR), The Landsat-5 TM and Landsat-7 ETM+ images were then processed using the Landsat Ecosystem Disturbance Adaptive Processing System (LEDAPS) [33], and the Landsat-8 OLI images were processed using the Landsat Surface Reflectance Code (LaSRC) [34,35] for atmospheric correction. Landsat-4 and subsequent satellites were directly used in this paper for analysis.
The coastal region of southeast China has a predominantly subtropical climate with humid and cloudy rain throughout the year, so the obtained Landsat image data usually contained a large number of clouds and cloud shadows, which is inconvenient for subsequent calculations. In this paper, we used the CFMask (C function of mask) algorithm [36] to calculate images with less than 50% of clouds per year, and took the median value of each image element in each unit to further remove invalid image elements and construct the dataset with very few clouds, so that the final effective image elements were almost free of clouds and cloud shadows.
2.3.2. Exponential Band Calculation
The NDVI [37] is an index to describe vegetation growth by calculating the ratio of the difference and the sum of NIR and red bands, which can be used for vegetation extraction. An NDVI value greater than 0 indicates that the image has vegetation, and the larger the value is, the higher is the vegetation coverage. The range of NDVI values varies for different types of vegetation. The formula is as follows:
where NIR is the near-infrared band and RED is the red band of the image.
2.3.3. Adaptive Threshold Segmentation—OTSU Method
In order to improve the efficiency of large-scale mangrove extraction, this paper used the characteristic index NDVI for threshold classifications to extract mangroves based on the acquisition of mangrove growth areas. The methods of visual discrimination to adjust the segmentation thresholds or to build the threshold rule-set based on the measured sample data are less applicable to large-scale feature extraction. Therefore, in this paper, we used the method of automatically obtaining feature index segmentation thresholds based on simplifying the land type by mapping the growth area. The OTSU algorithm, first proposed by Japanese scholar Otsu in 1979, is a typical image segmentation algorithm with an adaptive determination of thresholds, which is simple in principle, easy to implement and suitable for separating target features from background values in images [38]. The OTSU algorithm is most often applied to items such as water [39,40,41], vegetation [42,43,44] and impervious surface extractions [45,46].
In this paper, the threshold segmentation and mangrove extraction based on Landsat-series images were carried out in mangrove growth areas. Since only mangroves, water bodies and a small number of mudflats and impervious surfaces were included, the feature categories were relatively simple, so the OTSU algorithm combined with the feature indices was selected for adaptive threshold segmentation to classify the features in the mangrove growth areas into mangrove and non-mangrove categories.
2.3.4. Post-Processing
The extracted results were processed to remove patches that were isolated and less than a certain area value. For a certain year, the patches in the extracted results that belonged to mangroves were determined according to changes in the mangrove distributions in the first three years and the last three years of this study. By combining with relevant papers and references from various provinces and cities [47,48,49,50,51], we set the maximum annual movement of the mangrove and seawater demarcation line to the land by natural disasters and damage such as human logging, and corrected the results of each year by establishing the corresponding buffer zone.
2.3.5. Annual Rate of Mangrove Area
Referring to the Food and Agriculture Organization (FAO), the calculation method for the annual rate of change in the mangrove area was derived from the compound interest method [52]. In this study, the annual rate of change in the mangrove area was used to compare the differences between mangrove areas in two different periods in the same region. The formula of the annual rate of mangrove area change is as follows:
where A1 and A2 are the mangrove area at time t1 and t2, respectively.
2.3.6. Calculation of Mean Patch Size (MPS)
The MPS was used to analyze the changes in the spatial structure of mangroves in China and the provinces for 1986–2021 [53]. The formula is as follows:
where MPS is in units of ha, A is the total area of mangroves in this period and N is the number of patches in a certain period. The MPS was mainly used to describe the degree of mangrove fragmentation; in the case of the same total area of mangroves, the greater the number of mangrove patches, the larger the MPS value and the higher the degree of fragmentation.
2.3.7. Classification Accuracy Evaluation
Taking 2019 as an example, we combined the data with the 2019 mangrove distribution map of China developed by Zhao et al. [16]. We performed a sample selection of interannual synthetic cloud-free images within the mangrove growth area. Zhao et al. extracted the mangroves in China in 2019 based on Sentinel data with a resolution of 10 m, and the overall classification accuracy was 97.0 ± 0.2%. Therefore, the sample selection was reliable with reference to the data of Zhao et al. We combined the data of Zhao et al. and field survey data (Figure 1) to select a total of 2720 mangrove and 2340 non-mangrove samples in the mangrove growth area based on GEE in 2019 by visual interpretation, for a total of 5060 samples, and the number of samples in each province is detailed in Table 1.

Table 1.
Number of mangrove and non-mangrove samples by province.
Some sample points were randomly selected to determine the value range of the NDVI, and the remaining sample points were used to evaluate the results in the later accuracy evaluation. Based on the test samples and confusion matrices, the producer’s accuracy, user’s accuracy, overall accuracy (OA) and Kappa coefficient were calculated as follows:
where nij denotes the number of samples classified into category i (i = 1, 2, …, k) in the result and category j (j = 1, 2, …, k) in the reference data set, denotes the number of samples classified into category i in the result, and denotes the number of samples classified into category j in the reference data set.
3. Results
3.1. Evaluation of Result Classification Accuracy
3.1.1. Accuracy Evaluation
The final mangrove classification results for 2019 had an OA of 93.38% and a Kappa coefficient of 86.73%. The user’s and producer’s accuracies of the mangrove class exceeded 92%, indicating that the mangrove extraction method combined with the OTSU algorithm was feasible and met the analysis requirements. The detailed accuracies are shown in Table 2. In addition, due to a strip missing in the Landsat ETM+ images for 2012 and some missing image problems in the fused interannual images, the accuracy of the data from 2012 was affected.
Table 2.
Accuracy of mangrove extraction in 2019.
3.1.2. Area Comparison
The values of the mangrove areas extracted in this paper were close to the values extracted by other scholars, with less than 1% deviation in 2018, 2019 and 2020 (Table 3), further indicating that these extracted results were reliable and met the analysis requirements.
Table 3.
Comparison of mangrove areas in existing Chinese countries.
3.2. Evaluation of Mangrove Results in China over The Last 36 Years
In order to more intuitively describe the distribution, area and patch changes of mangroves in China, we analyzed the changes of mangroves in China on three scales (nation, typical provinces and national mangrove reserves) from large to small, and focused on the changes to mangroves in various national mangrove reserves to further evaluate the protection effect of mangroves. The overall Chinese mangrove forest was analyzed from three perspectives: distribution changes, area changes and patch changes from 1986 to 2021.
3.2.1. Overall Distribution and Changes of Mangroves
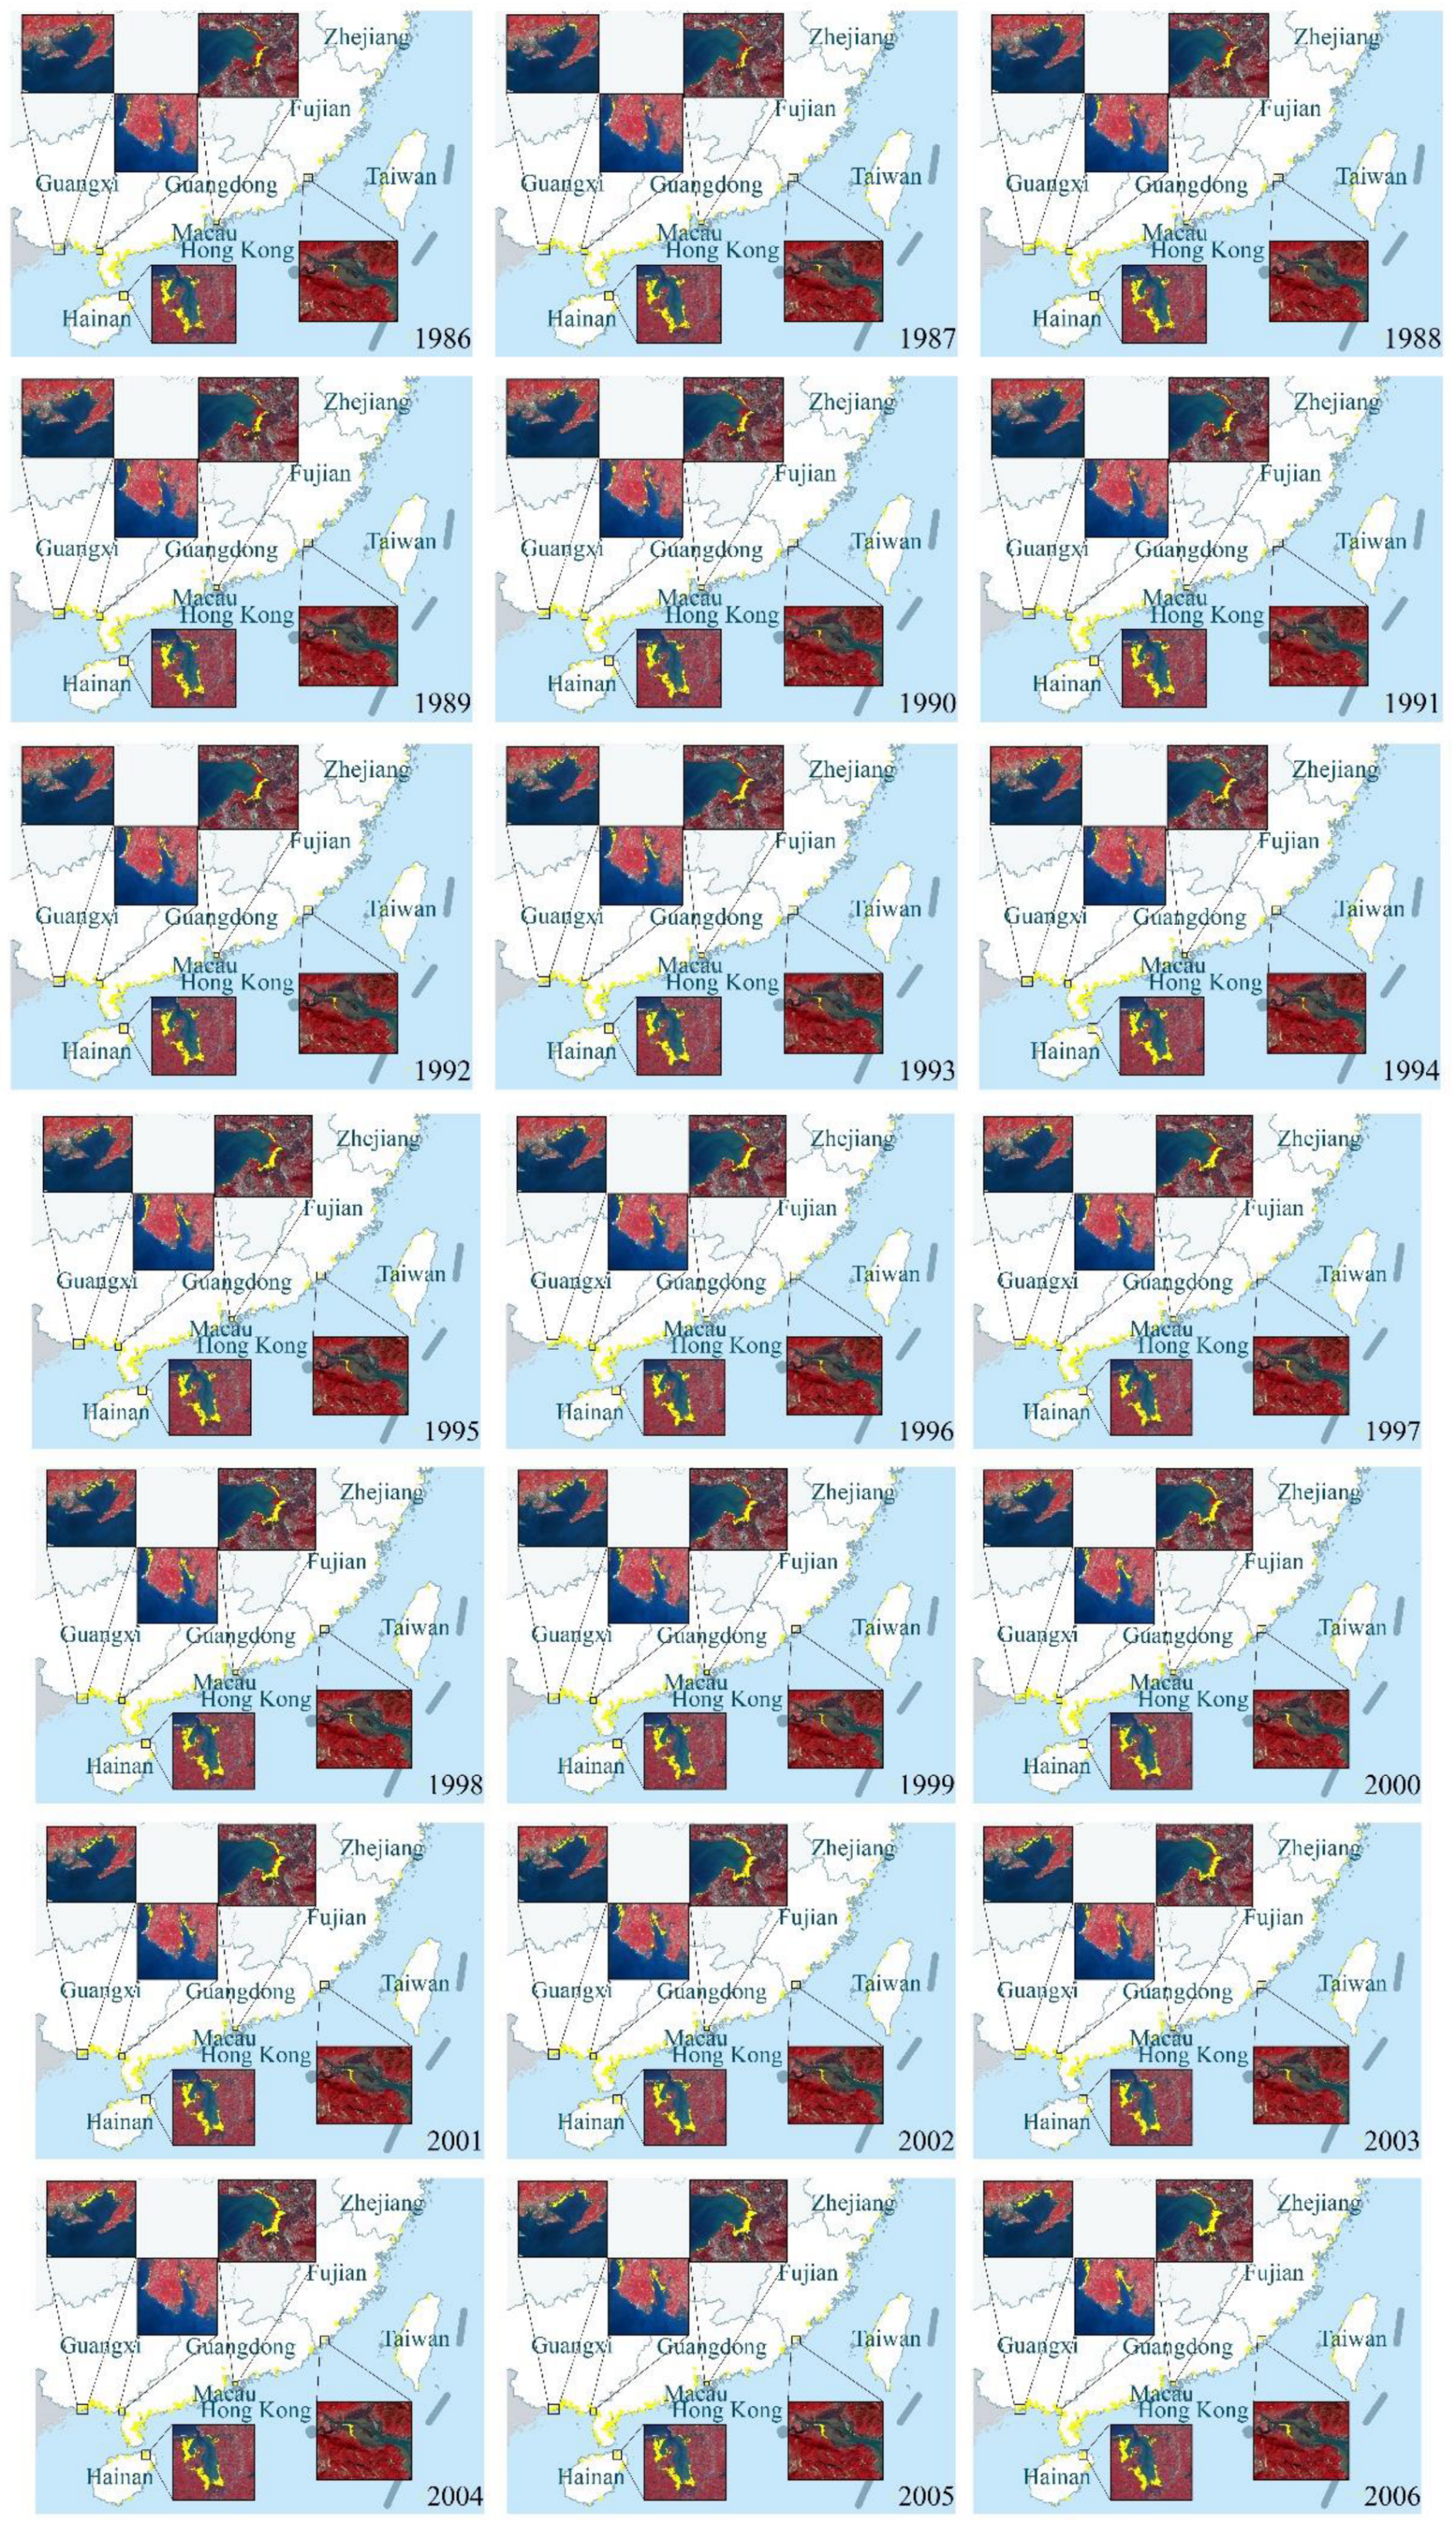
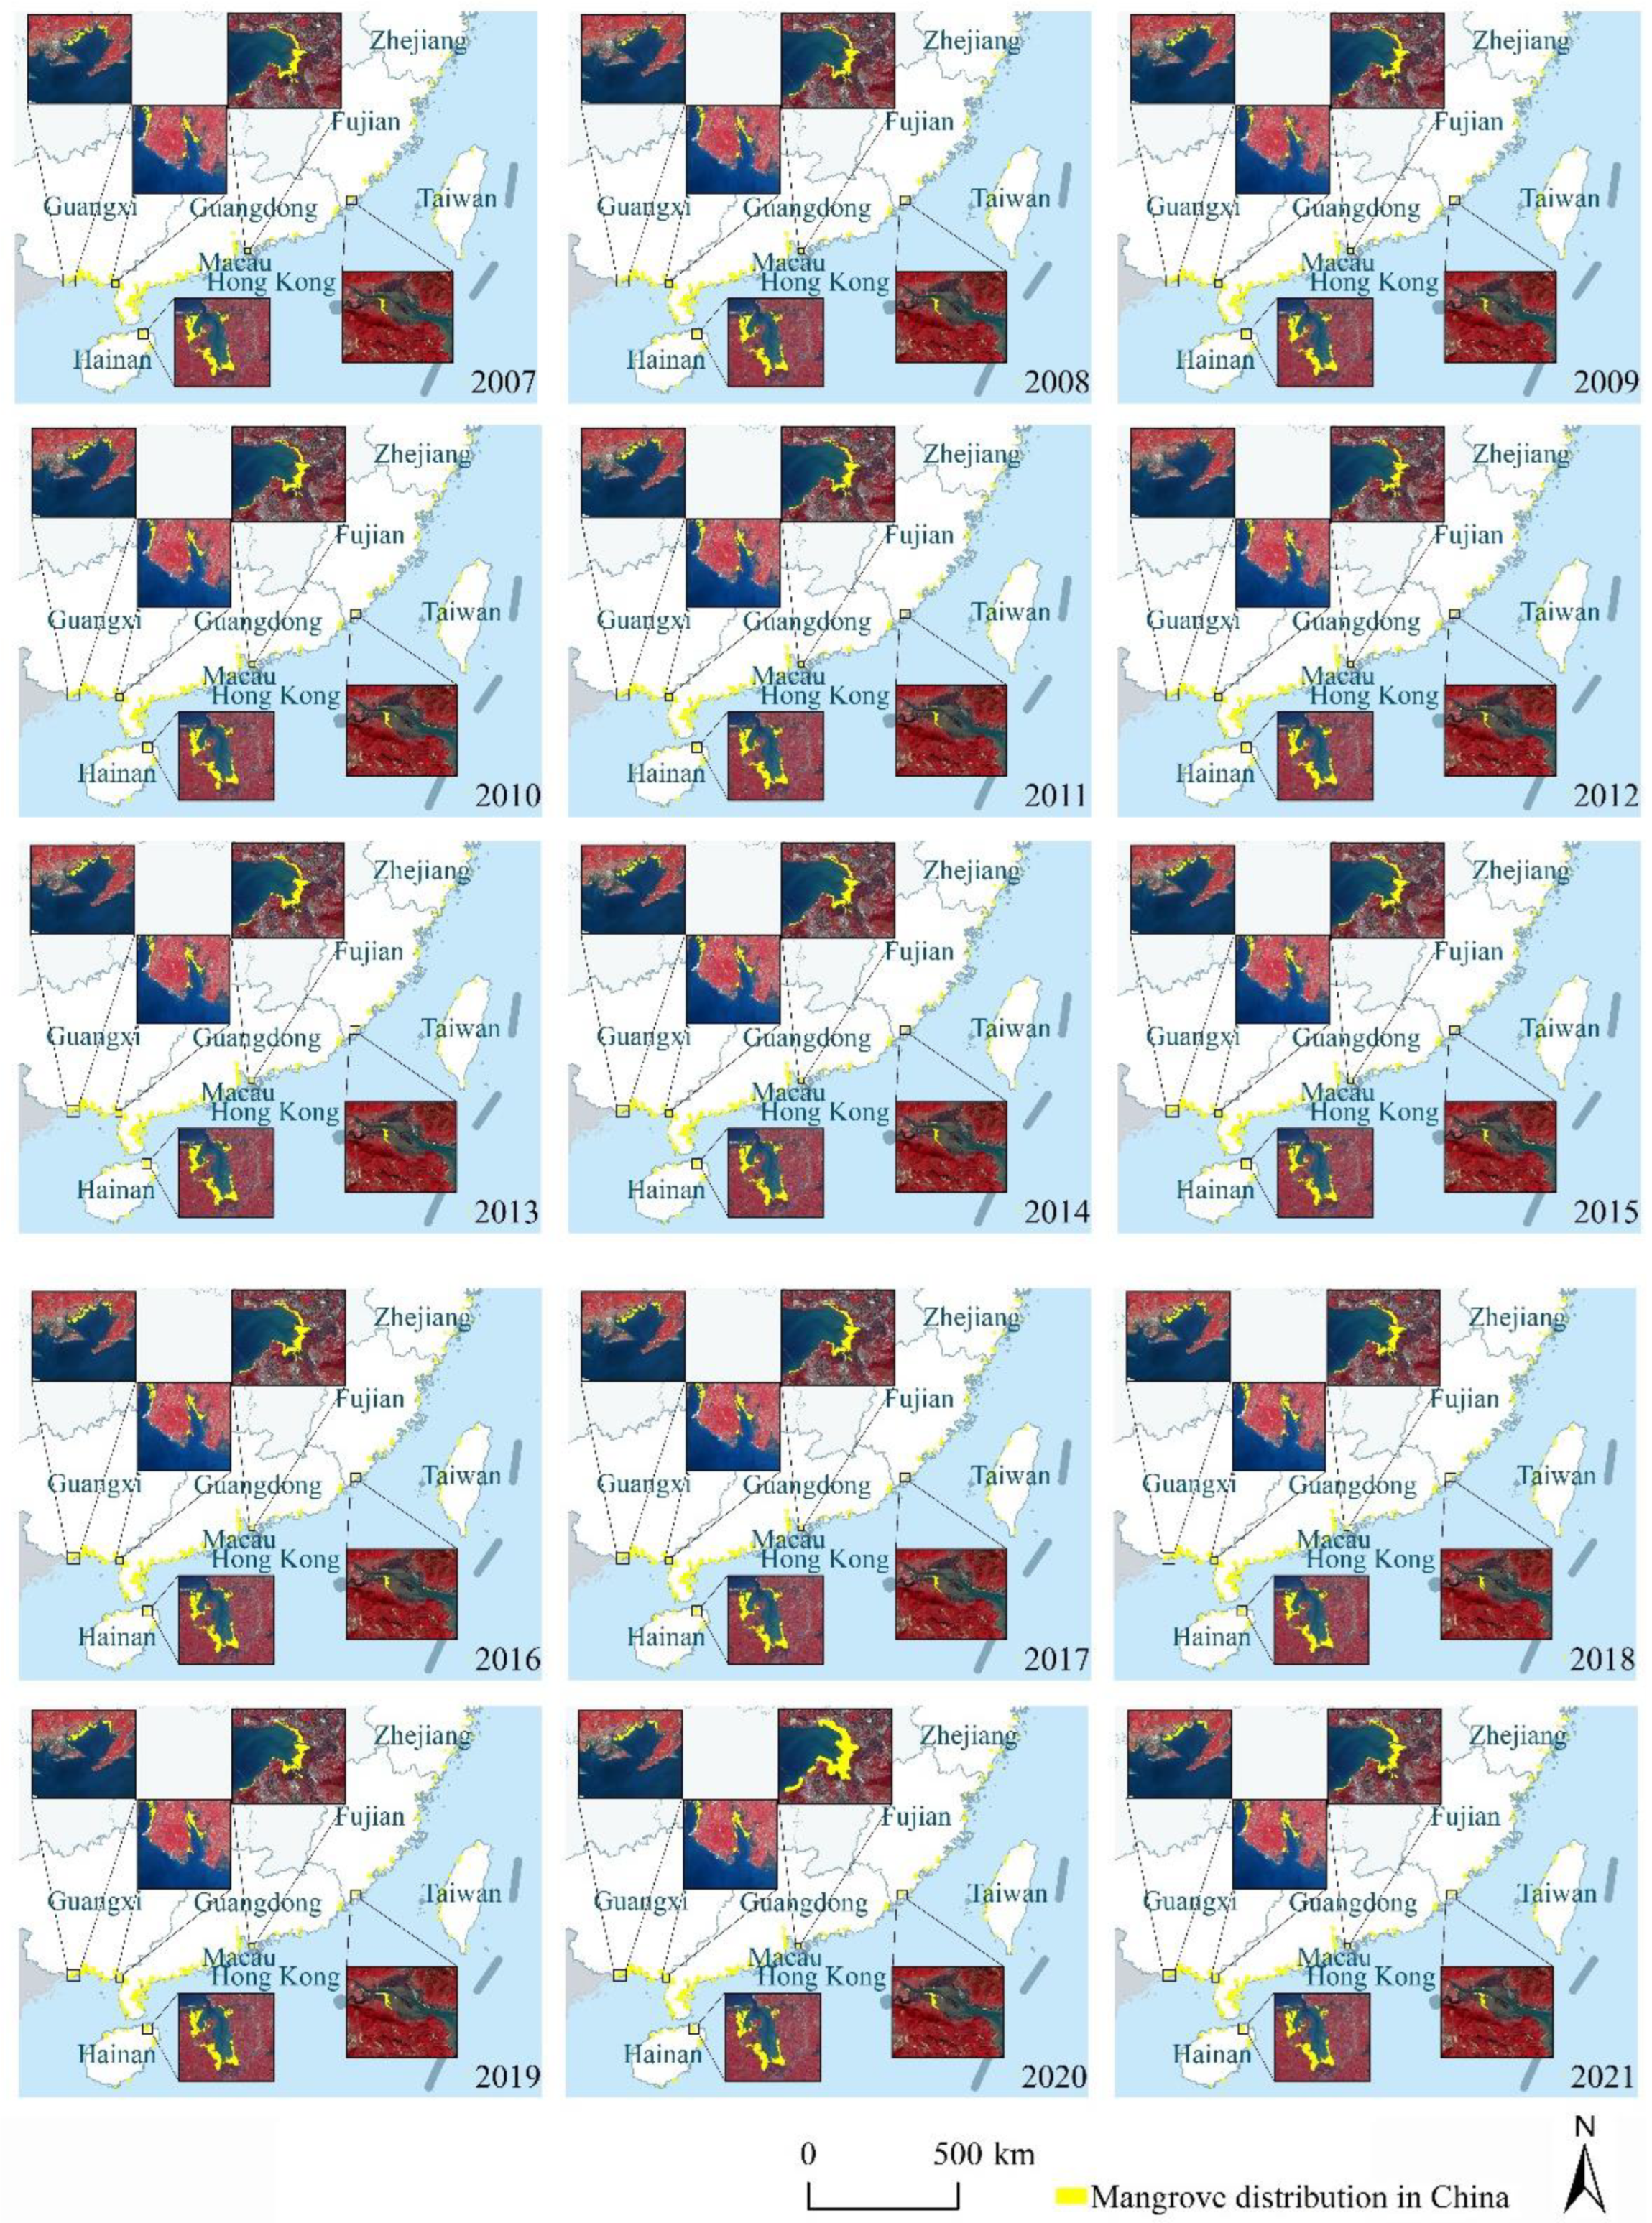
The mangrove classification results were extracted to obtain the distribution of mangroves in China for 1986–2021 (Figure 4). China contains seven national mangrove reserves: Zhanjiang Mangrove National Nature Reserve (ZMNR), Futian Mangrove National Nature Reserve (FMNR), Shankou Mangrove Nature Reserve (SMNR), Beilunhekou National Nature Reserve (BNNR), Dongzhaigang National Nature Reserve (DNNR), Zhangjiangkou National Mangrove Nature Reserve (ZNNR) and Mai Po Mangrove National Nature Reserve (MMNR). In order to more visually show the distribution changes of mangroves during the study period, except for the ZMNR due to its long coastline, we enlarged the other six national mangrove reserves; among them, the FMNR and the MMNR are displayed in close proximity to each other.
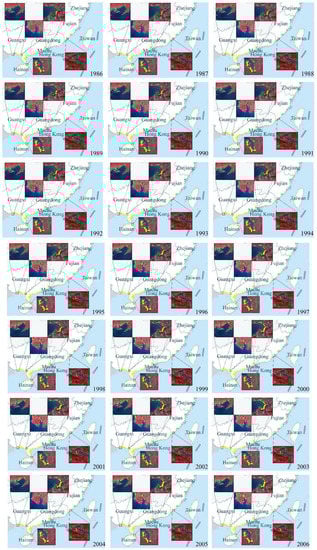
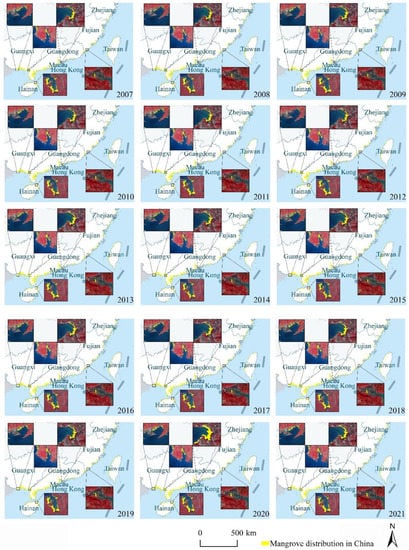
Figure 4.
Mangrove distribution in China during 1986–2021.
For the average annual area of mangroves in each province during the 10-year period of 1990–2000, the top three provinces with the largest area were Guangdong, Guangxi and Hainan, and the rest were Taiwan, Fujian, Hong Kong and Zhejiang (Figure 4). From the perspective of change, the mangrove areas in places such as Hainan and Taiwan changed less and were basically stable. The mangrove areas in Guangdong, Fujian, Zhejiang and Guangxi all showed different degrees of increase. Before 1990, the mangroves in Guangdong and Fujian all showed some degree of disappearance, while Hainan’s mangroves first partially disappeared and then recovered again in 1990.
Before 1990, the total area of mangroves in Guangdong and Hainan accounted for about 60% of the total area of mangroves in the country, so their area changes had a slightly greater impact on the overall mangrove area changes in China. During 1990–2000, the mangroves in Guangxi showed several significant changes, with a general upward trend and a sudden increase in 1993, and they remained basically unchanged after 1997. After 2000, Guangxi saw a decrease in its mangroves in 2004, and Hainan saw a large decrease in 2003, but the rest of the time the mangroves in these provinces were basically unchanged, while the mangroves in other regions mainly increased steadily. The mangroves in Fujian and Guangxi alternately increased and decreased, but in general, they mainly increased, with the magnitude of changes gradually decreasing with time. In Zhejiang province, a large increase in mangroves occurred after 2005, and a large decrease occurred around 2015, followed by another increase. These changes resulted in a much larger distribution range than that before 2015, which was related to local mangroves being artificially introduced.
3.2.2. Analysis of Changes in Mangrove Area and Landscape Pattern
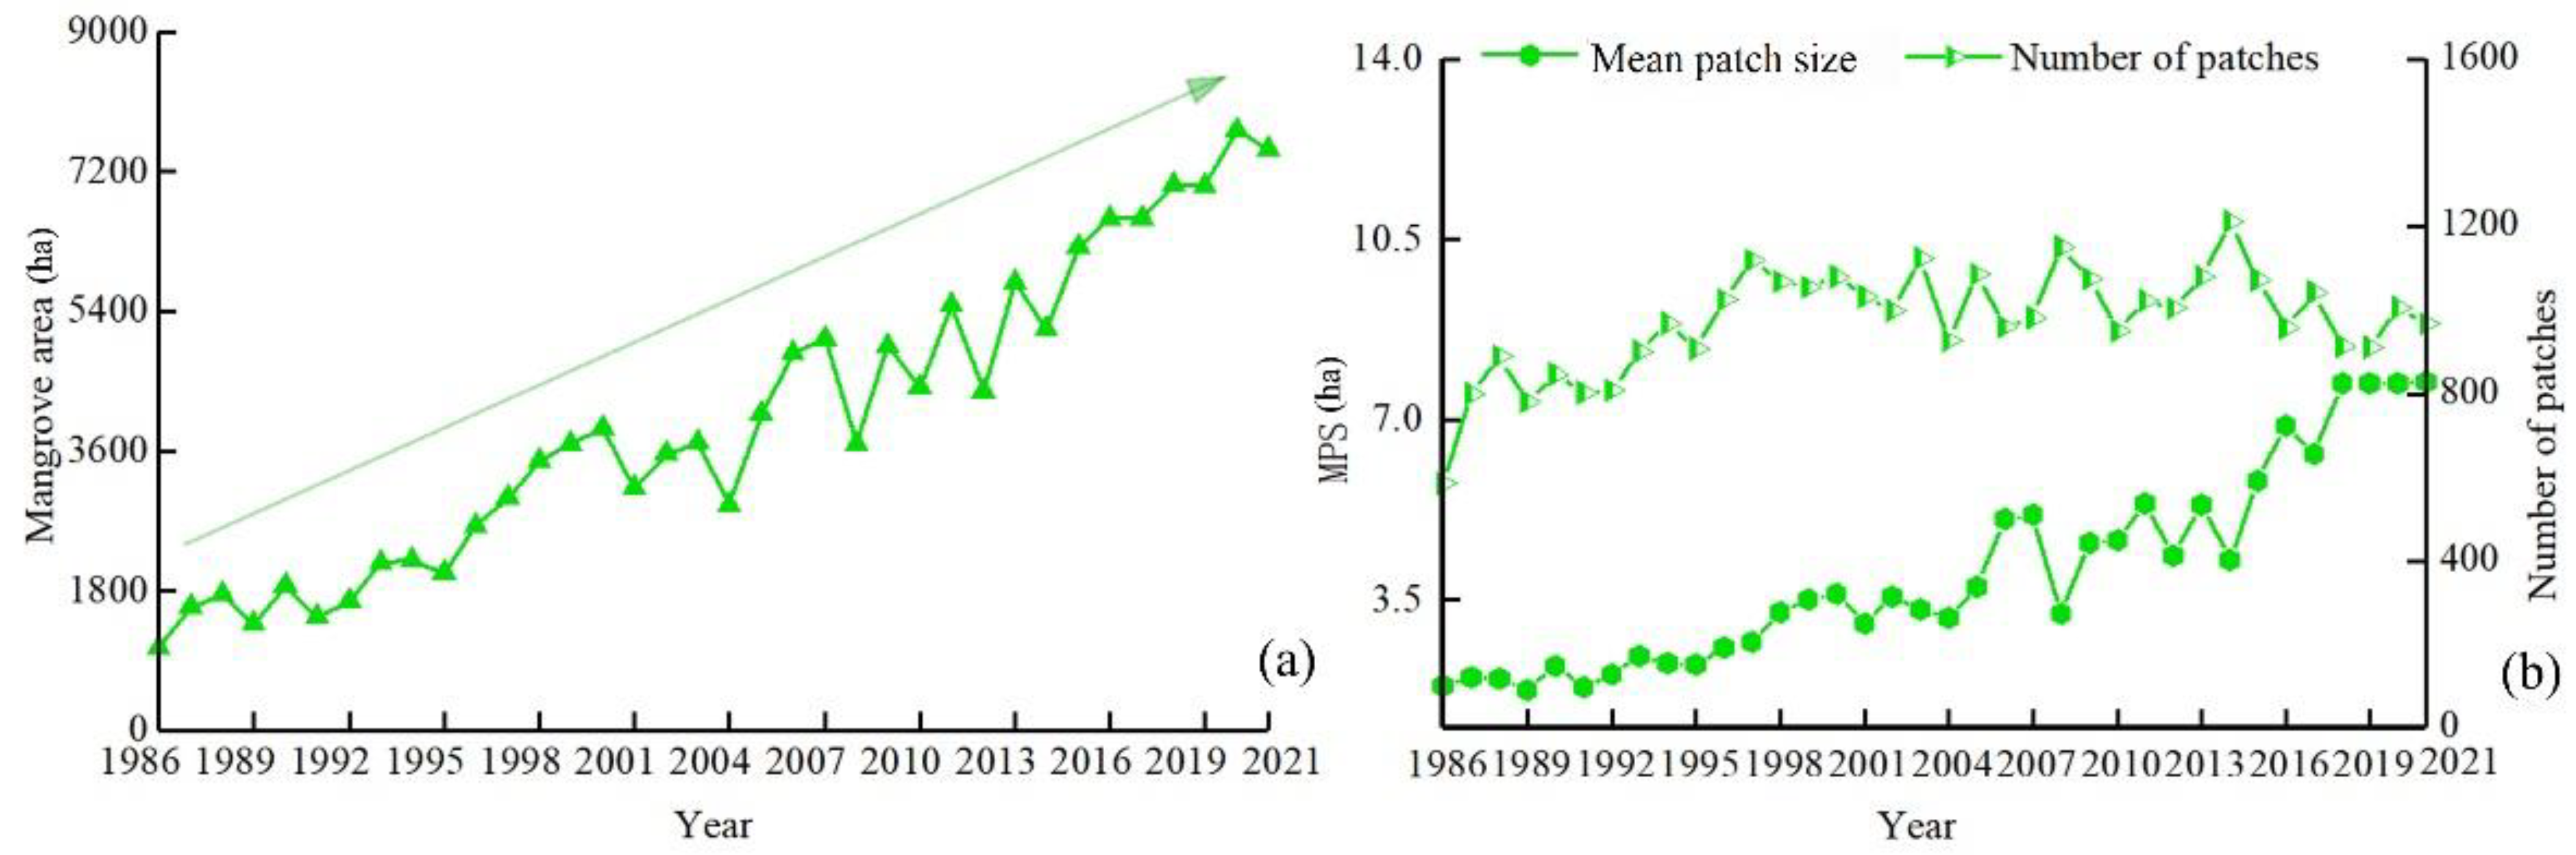
For 1986–2021, the overall change in mangrove area in China showed an upward trend, from 10,835.29 ha in 1986 to 27,427.21 ha in 2020, with the total area increasing nearly twofold. During 1986–1991, there was no obvious change; the China mangrove area basically remained at 111,000 ha. After 1991, the total mangrove area showed a relatively gentle upward trend. After 1990, China’s national mangrove reserves were basically established, which was consistent with the time point of another increase in the results, indicating that the establishment of mangrove reserves played a positive role in the protection and restoration of mangroves. During 1999–2013, the mangrove area in China showed a large change with a general upward trend, reaching a small peak of 22,873.65 ha in 2013 and then maintaining a relatively stable and gentle upward change until 2021. The total mangrove area reached its maximum in 2020 with 27,898.97 ha, which represented a total increase of 5025.56 ha compared with 2013, with an average annual growth of 717.94 ha.
For 1986–2021, the number of mangrove patches in China was relatively stable, mainly within 3500–6000, and the MPS showed a general upward trend (Figure 5). As shown in Figure 5b, from 1986 to 2021, the changes in the MPS of mangroves in China generally reflected two stages. During the first stage from 1986 to 2001, the average annual MPS of mangroves was 2.91 ± 0.16 ha, showing a stable state on the whole. In the second stage from 2001 to 2021, the MPS showed a continuous upward trend, increasing from 3.0 ha to nearly 6.0 ha during the past 20 years. The trends in the MPS were consistent with the change trend of the area of mangroves and corresponding number of patches during 1986–2001, which indicated that the fragmentation degree of mangrove patches was high compared with recent decades. Both the mangrove area and the MPS showed an upward trend during 2001–2021, and the former increased faster than the latter. This was mainly because, since 2000, China has begun to pay more and more attention to the protection of mangroves and has carried out large-scale restoration planting. Thus, the fragmentation of mangroves decreased, while the corresponding MPS of mangroves increased.
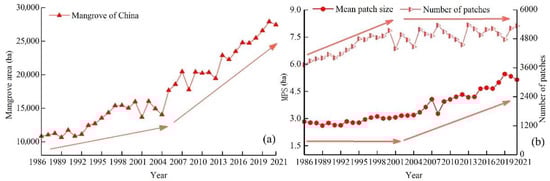
Figure 5.
(a) Mangrove area and (b) the number of mangrove patches and MPS in China during 1986–2021.
As shown in Table 4, the area change of mangroves generally showed an increasing trend during 1986-2021, while the annual change rate of mangroves was small. During 1980–2005, the annual rate of change to the mangrove area in China was basically higher than the global average annual rate of −0.77% and Vietnam’s average annual rate of −1.37%, as provided in the 2007 FAO report [54]. From 2000 to 2012, the average annual rate of change to the mangrove area in Southeast Asia was −0.18% [55]. During this period, only the annual rates in 2000–2001 and 2007–2008 were less than −0.1%, as they were −0.14% and −0.13%, respectively, but these values were still higher than the average annual rate in Southeast Asia.
Table 4.
Change area and annual rate of mangrove change in China.
3.2.3. Mangrove Distribution and Changes in Typical Provinces
Guangdong and Guangxi are the top two provinces in China in terms of mangrove area. These two provinces were taken as typical provinces for the analysis of their change patterns and mangrove spatial distribution characteristics.
- Analysis of mangrove changes in Guangdong
The mangroves in Guangdong accounted for 35–45% of the total mangrove area in China. The area fluctuated within 4500–12,000 ha and the average mangrove area was higher than that of other provinces in China over the last 36 years. The distribution of mangroves in the coastal cities of Guangdong was uneven, with the majority being mainly distributed in Zhanjiang (western Guangdong), where the mangrove area was about 60% of the total mangrove area in Guangdong. The mangroves in this province were distributed across a total of 14 cities, including Yangjiang, Jiangmen, Zhuhai, Guangzhou, Shenzhen, Zhongshan, Shantou, Shanwei, Maoming, Chaozhou, Dongguan, Huizhou, Jieyang and Zhanjiang. The overall trend of mangrove changes in Guangdong during 1986–2021 was first stable and then increasing. In 1986, there were 4565.52 ha of mangroves in Guangdong, and the area decreased to 3757.54 ha in 1989, a total decrease of 807.97 ha (Figure 6a). In the following five years, the mangrove area basically remained at 4200 ha. After 2005, the area again increased significantly, stabilizing at over 8000 ha after 2012; after this, it increased slowly and slightly. This was closely related to Guangdong’s active afforestation activities and strengthening of the management and protection of mangroves [56]. For example, in 2007, Yangjiang City planted 6.67 ha of mangroves in Yangdong County and 54 ha of mangroves in Jiangcheng District, and Taishan City planted 333.33 ha of mangroves during 2008–2010.
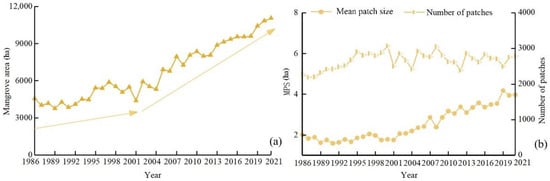
Figure 6.
(a) Mangrove area and (b) the number of mangrove patches and MPS in Guangdong during 1986–2021.
For 1986–2021, the number of mangrove patches and the MPS in Guangdong both showed an increasing trend, and the change in MPS was greater than that in the number of patches; the total number of patches in Guangdong was in the range of 2000–2400 (Figure 6b). During 1986–1989, the MPS showed a decreasing trend; the number of patches changed little and the mangrove patches mainly shrank. In 2002, the MPS recovered to the same size as in 1986 and, in the following four years, remained stable and even increased slightly, but the number of patches changed drastically. The changes to mangrove patches in Guangdong were mainly because of mangrove patches appearing in areas where there was previously no mangrove or disappearing in areas where there previously was a mangrove; the mangrove patches were in an unstable state. During 2008–2012, the MPS increased and the number of patches gradually decreased, mainly due to the merging of mangrove patches. Subsequently, the MPS in Guangdong increased slowly until 2021, with a maximum of 4.18 ha in 2019, which represented an increase of 2.17 ha compared with 1986.
- Analysis of mangrove changes in Guangxi Zhuang Autonomous Region
The mangroves in Guangxi were mainly distributed in the Beihai, Qinzhou and Fangchenggang cities, with areas of 1000–8000 ha. From 1986 to 2021, the total mangrove area in Guangxi showed an increasing trend with large fluctuations, and the proportion of the total mangrove area in China increased from 10.10% to 27.40%. During 1986–1996, the mangrove area in Guangxi changed little and remained within 1000–2000 ha (Figure 7a). During 1997–2000, the area increased rapidly, reaching a peak of 3892.78 ha in 2000. During this period, the mangroves in Guangxi were damaged by Oligochroa cantonella in 2004 [57], and the area of Avicennia marina (a mangrove species) was greatly reduced. After 2017, Guangxi further increased its mangrove protection; the Guangxi Beilun River Estuary Protected Area Management Office increased mangrove pest detection and replanted 0.83 ha of mangroves in the same year; the Qinzhou City Government issued policies related to mangrove protection in May 2017, further improving the Mao Weihai Mangrove Nature Reserve management mechanisms and increasing funding; and at the same time, the cities of Qinzhou, Beihai and Fangchenggang found that there was encroachment on the nature reserve and immediately formulated rectification plans, suspended all construction involving the occupation of mangrove projects and actively carried out replanting activities. The mangrove area in Guangxi maintained a fast upward trend during 2017–2021 (Figure 7a), reaching a maximum of 7837.17 ha in 2020 for the three decades compared with 1065.95 ha in 1986, which represented an increase of 6771.23 ha.
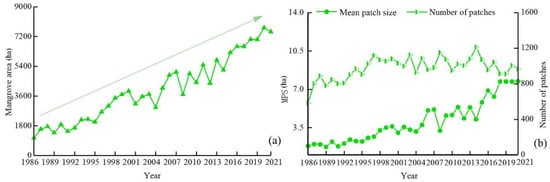
Figure 7.
Changes in (a) mangrove area and (b) the number of mangrove patches and MPS in Guangxi for 1986–2021.
During 1986–2021, the range of total mangrove patches in Guangxi was mainly 800–1200 patches, with no obvious tends in change; the range of the MPS was 1.70–8.00 ha, which showed an increasing change trend (Figure 7b). During the study period, the Guangxi mangrove patches were dominated by changes in expansion. During 1986–1988, the number of mangrove patches increased rapidly, and the MPS remained basically the same; the total mangrove area in Guangxi also increased rapidly during this period, and the mangrove patches were dominated by the addition of new patches. During 1988–2004, the MPS and the number of patches both increased to some extent, and the patch changes were dominated by the expansion of patches and the addition of new patches in areas where there were previously no mangroves. The mean area of mangrove patches in Guangxi during 2004–2021 fluctuated, the number of patches varied around 1000 and the changes to mangrove patches were mainly expansions in size. In 2021, the Guangxi MPS reached a maximum for the 30 years of 7.74 ha, which was three times the value in 1986, and the fragmentation of mangroves was greatly reduced.
3.2.4. Changes to National Mangrove Reserves in China over 36 Years
During the research period, the changes in the number and area of patches were more influenced by human disturbance, such as a reduction in the number of patches caused by artificial destruction, and an increase in the area of individual patches caused by artificial repair and area protection. Therefore, we mapped the total mangrove areas in each national mangrove reserve during the study period and analyzed the trends. Considering that the results of 2012 were affected by the missing bands in the Landsat ETM+ data, the mangrove distributions during 1986–2021 were compared, except for 2012, and four categories of mangroves were marked as the focus of the study: “increased mangroves,” “disappearing mangroves,” “never-changed mangroves” and “ever-changed mangroves.” The term “ever-changed mangroves” refers to mangroves that were lost during 1986–2020, but were present again in 2021. We collated the above four categories to show the mangrove dynamics in each reserve.
- ZMNR
The ZMNR is located in Guangdong and encompasses the entire Zhanjiang area, with mangroves scattered and evenly distributed along the coast of Zhanjiang City. The number of mangroves is relatively large, with areas ranging within 2000–6500 ha (Figure 8) and accounting for about 60% of the mangroves in Guangdong. The mangrove area in the ZMNR decreased slightly during 1986–1989, and then showed an overall increasing trend, which was consistent with the establishment of the ZMNR in 1990. The mangrove area in the ZMNR significantly increased to 3959.89 ha in 2015 and slightly decreased in 2013, mainly because of O. cantonella damage after June 2012, which led to the extensive drying of mangroves. Since 2017, there has been a clearing of the mangrove protection zone farming ponds in Zhanjiang and, during 2017–2021, the mangrove area of the ZMNR increased steadily, reaching a maximum of 6468.42 ha in 2020, representing an increase of 3364.68 ha compared to 1986 (Figure 8). This proves that mangrove reserve construction has been effective.
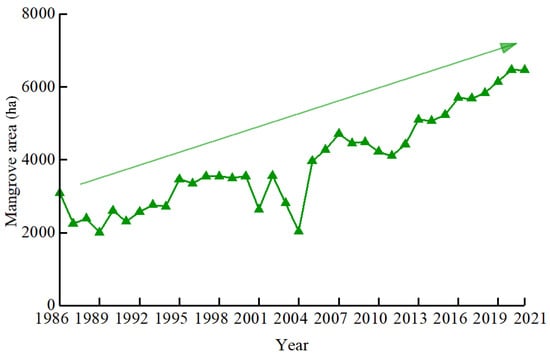
Figure 8.
Mangrove area in ZMNR during 1986–2021.
- FMNR
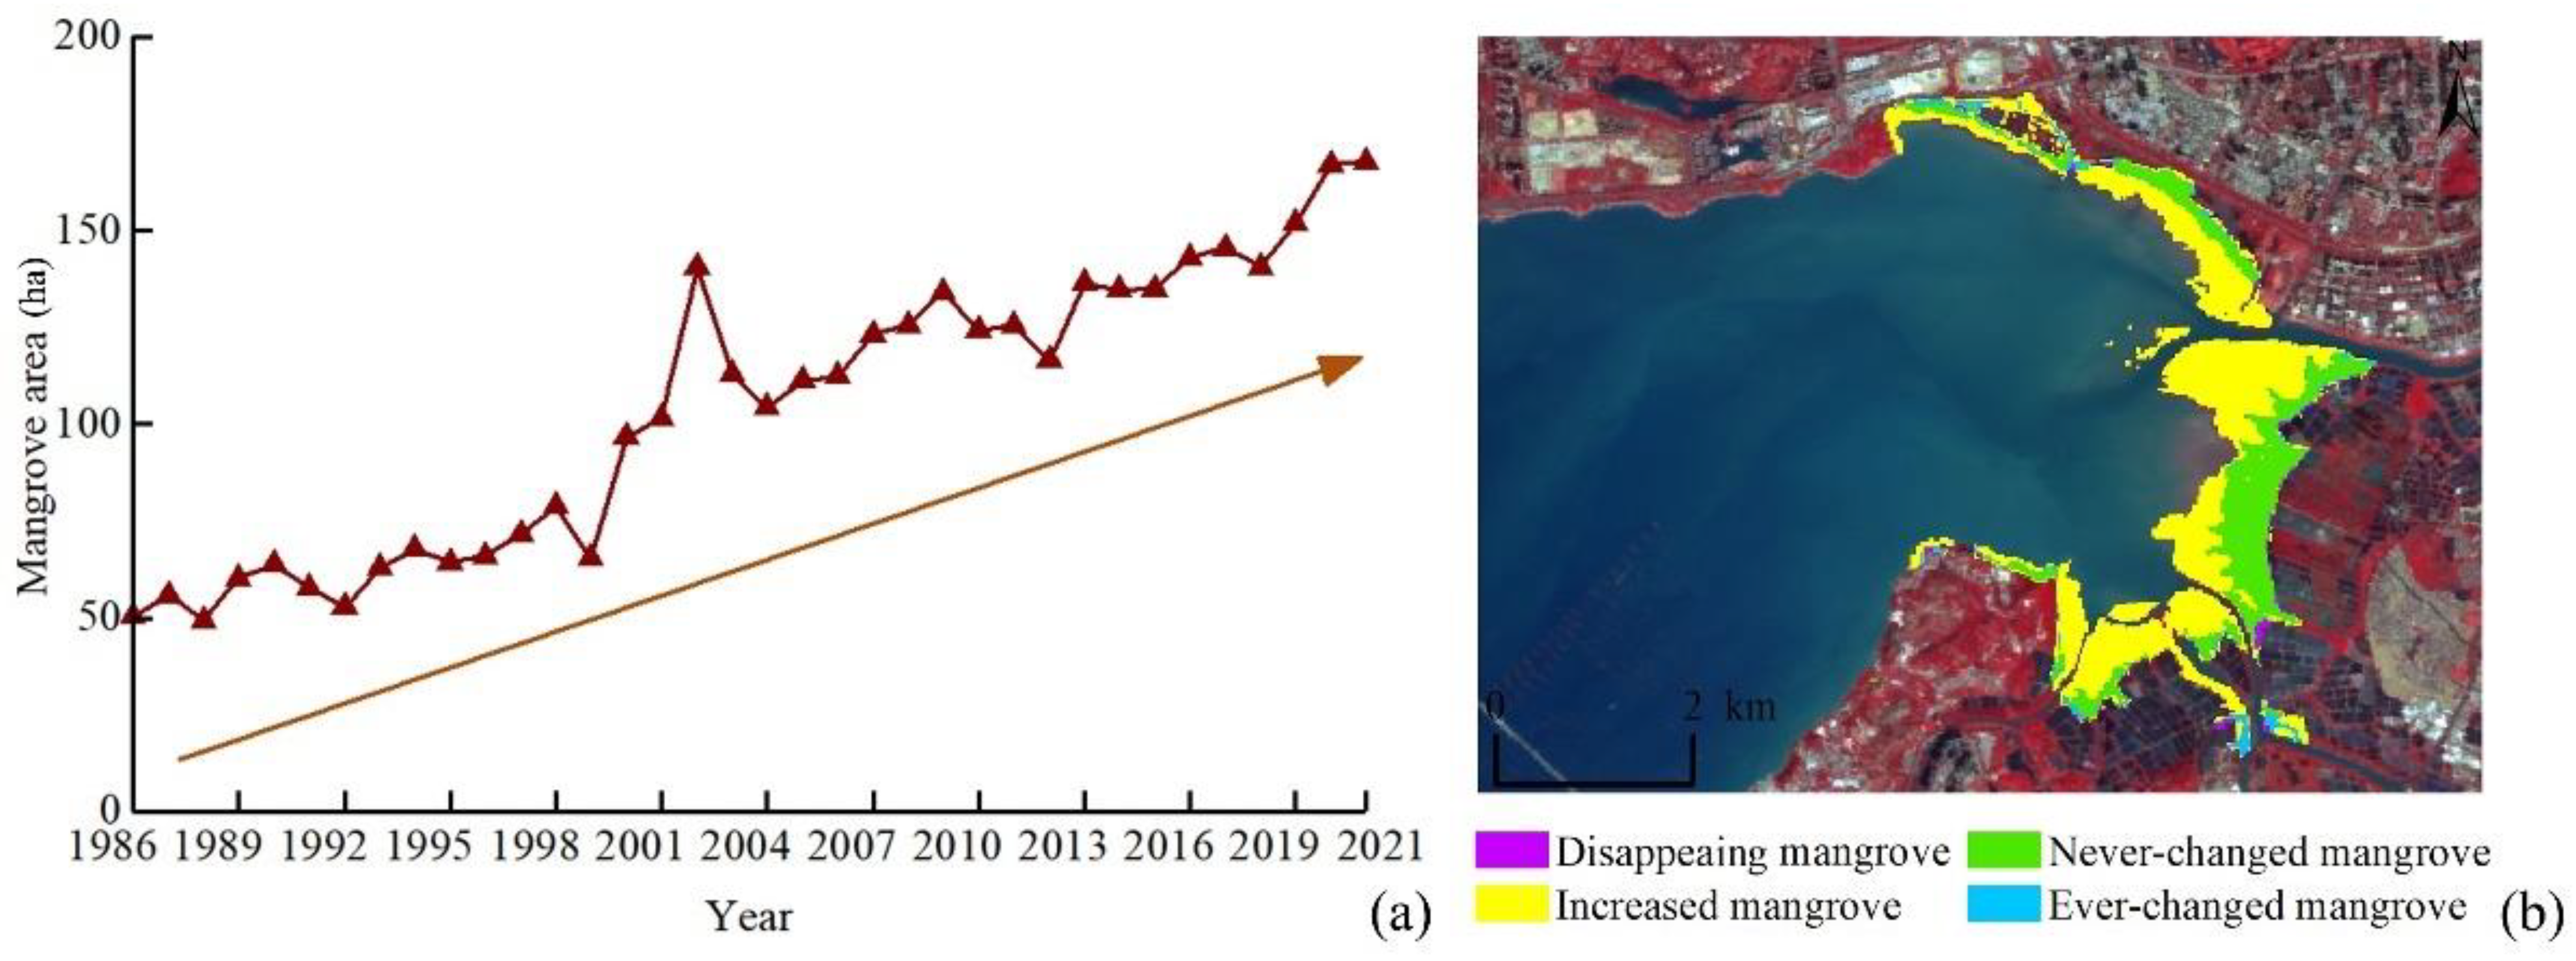
The FMNR is located in Shenzhen, Guangdong. It was established in 1984 and is the only national nature reserve in China that is located within an urban area. During 1986–2021, the area of mangroves in the reserve showed a relatively gentle increasing trend. The FMNR Management Regulations, which strictly prohibited the discharge of pollutants within the mangrove reserve and its peripheral zone, also explicitly prohibited the unauthorized cutting of mangroves, resulting in the mangrove area in the reserve reaching 140.31 ha in 2002. The “Eleventh Five-Year Plan” planned for more new mangroves in Shenzhen, and the Shenzhen Futian Mangrove Restoration Demonstration Project was launched in 2007. The mangrove area in the FMNR maintained an upward trend during 2005–2009, and reached a small peak of 134.01 ha in 2009 (Figure 9). In the past 10 years, the mangrove area in the FMNR showed a trend of decreasing and then increasing, and reached a maximum area of 167.82 ha in 2021, which was about 3.3 times that in 1986. The increased mangroves mainly extended toward the sea, and some mangroves on the northwest side extended toward the inland side; a central area extended along the river bank in the center of the reserve, and the distribution of mangroves in this area did not change.
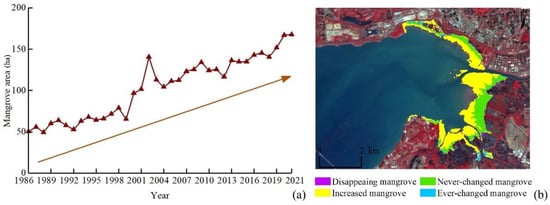
Figure 9.
(a) Mangrove area of FMNR and (b) changes to mangroves in FMNR and MMNR during 1986–2021.
- MMNR
The MMNR is located in the northwest of Yuen Long District, New Territories, Hong Kong, adjacent to Futian District, Shenzhen, and is separated only by the Shenzhen River and Deep Bay (Shenzhen Bay). During 1986–2021, changes to the mangrove area in the MMNR were divided into two phases: the first during 1986–2007, with a slow upward trend, when the mangrove area reached 422.35 ha in 2007; and the second during 2008–2021, when the growth rate of the mangrove area decreased significantly and then remained basically unchanged, fluctuating within 425–460 ha. The mangrove area reached a maximum of 456.16 ha in 2021, which represented an increase of 283.54 ha compared with 1986 (Figure 10). During 1986–2021, the mangroves in the MMNR mainly expanded, and the new part was mainly distributed in the southwest and north sides near the Futian District of Shenzhen, extending from inland to the sea. There were few mangroves of the disappearing and ever-changed types, and those of the never-changed type were mainly distributed on the east side of the reserve, radiating toward the sea.
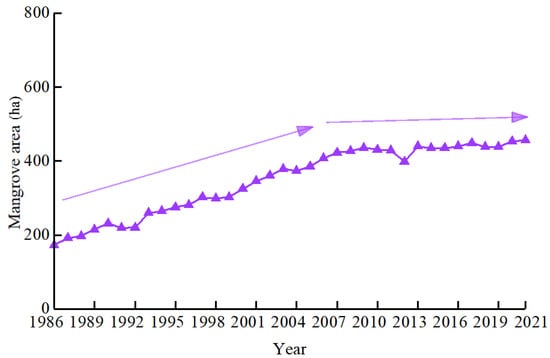
Figure 10.
Mangrove area in MMNR during 1986–2021.
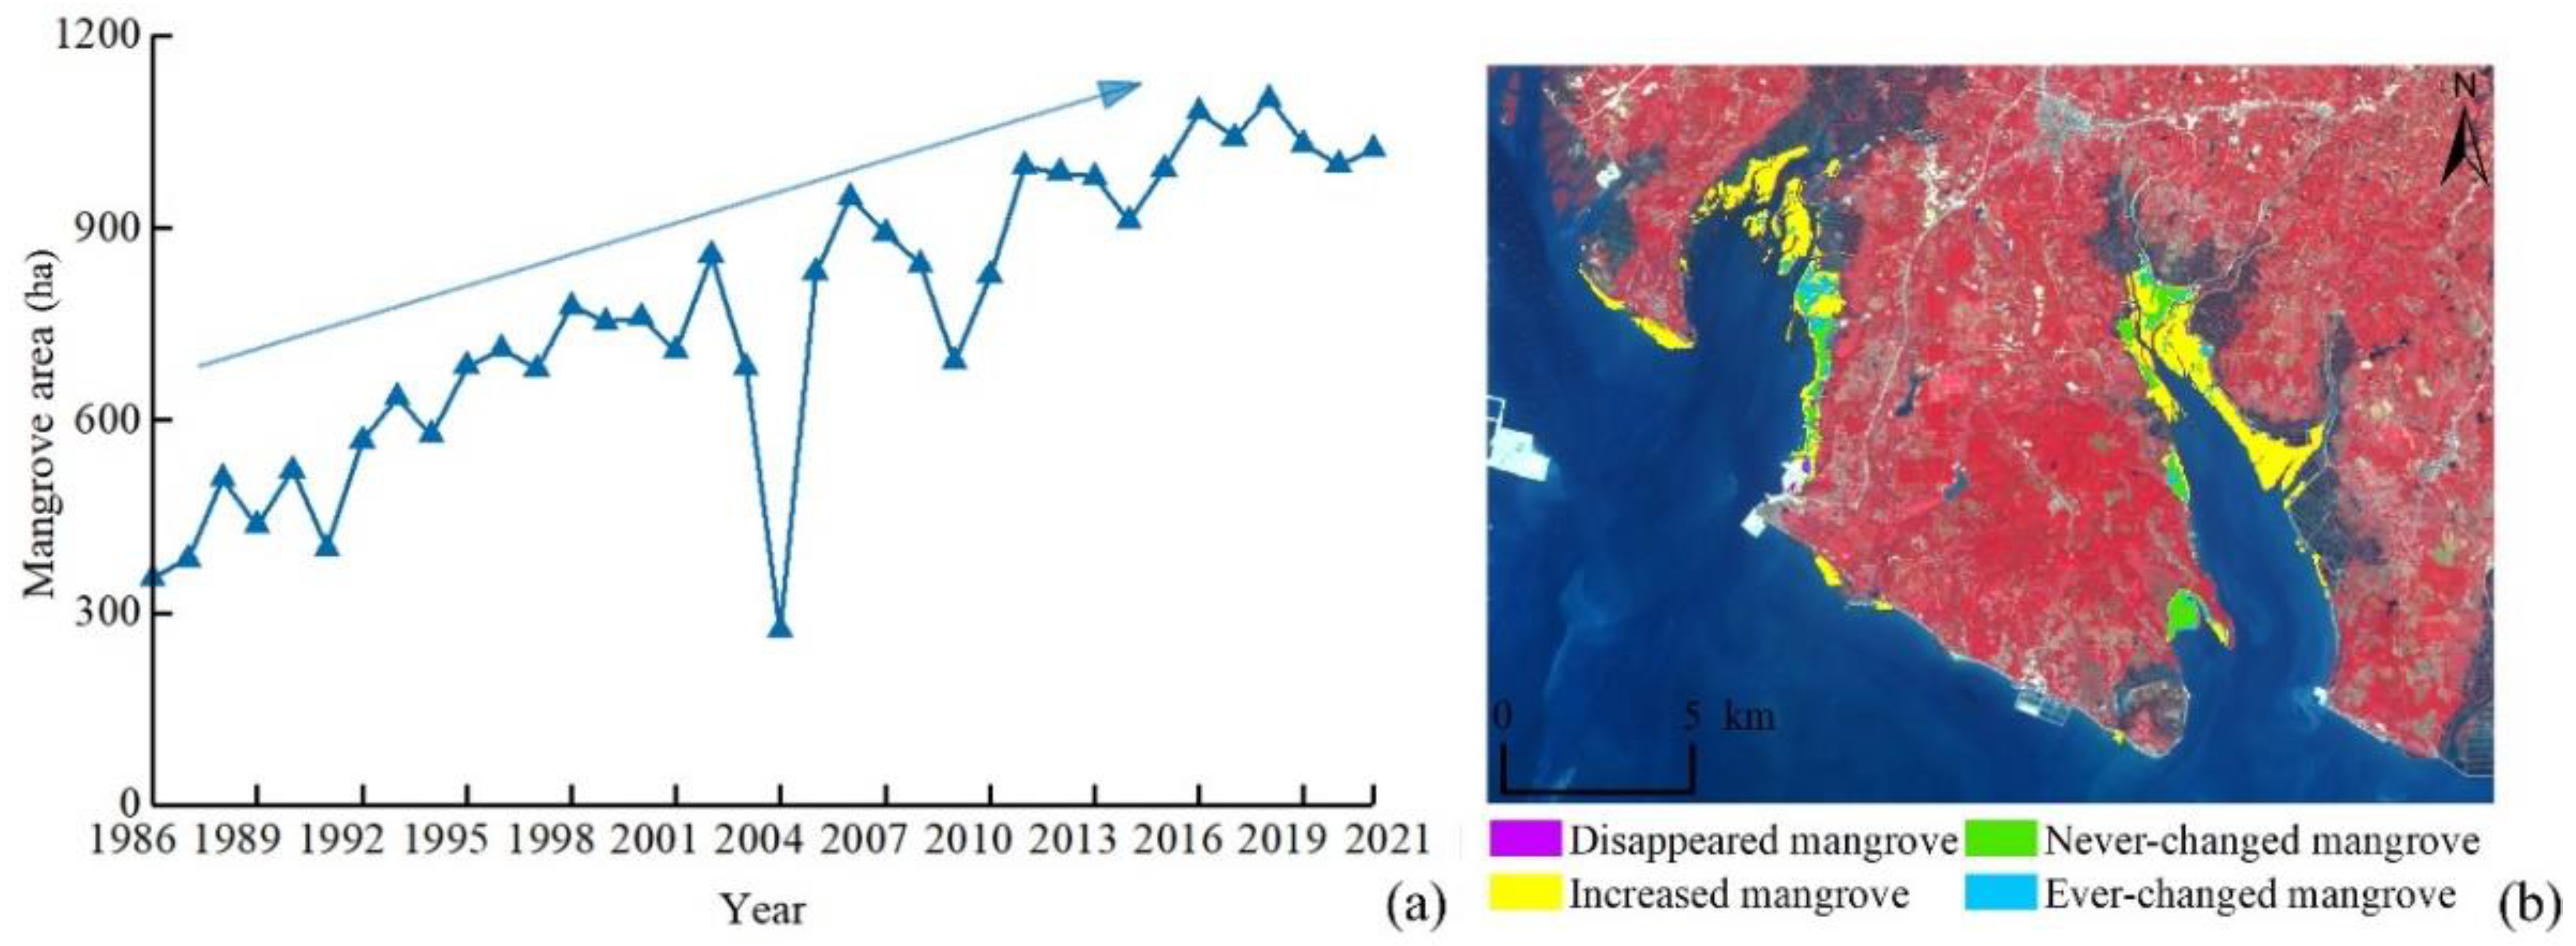
- SMNR
The SMNR, located in Hepu County, Beihai City, Guangxi, was established in 1990, and the mangrove area in the reserve mainly ranged within 350–1100 ha during 1986–2021 (Figure 11a). The mangrove area in the SMNR varied considerably, but generally showed an increasing trend. In 1994, the People’s Government of the Guangxi Zhuang Autonomous Region issued the Measures for the Management of Shankou Mangrove Ecological Nature Reserve of Guangxi Zhuang Autonomous Region, and the mangrove area in the reserve increased by 106.77 ha in the following year. In 2004, the People’s Government of the Guangxi Zhuang Autonomous Region further amended the Measures for the Management of Shankou Mangrove Ecological Nature Reserve of Guangxi Zhuang Autonomous Region (2004 amendment), and the mangrove area in the reserve increased again in 2005, reaching 830.43 ha. The area of the reserve showed a trend of decreasing and then increasing in the following 10 years and, in 2010 and 2015, the reserve was infested with Hyblaea puera Crame, but this was solved by artificially trapping and spraying these pests. The protected mangrove area in 2021 was about 2.89 times that in 1986, confirming the effectiveness of protection. During 1986–2021, the reserve was dominated by increasing mangrove areas, with these areas mainly located on the western and northern sides of the Dandou Sea and the northwestern side of Inro Harbor. The northernmost patches on the east side of the Dandou Sea changed more drastically, while the rest of the patches on the east side changed less and were mostly always mangroves; the patches on the southwest side of Yingluo Bay were also more stable and dominated by patches that were always mangroves (Figure 11b). The eastern and northern parts of Yingluo Bay were the Gaoqiao Mangrove Reserve, which belonged to Zhanjiang City and was also dominated by increasing mangrove areas. Very few mangroves disappeared during the study period, and this was mainly in the southeast side of the Dandou Sea.
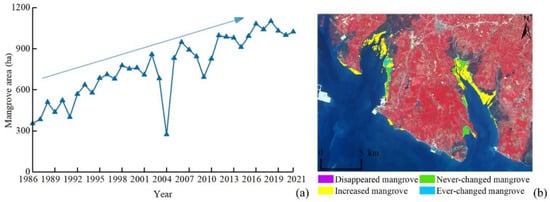
Figure 11.
(a) Mangrove area of SMNR and (b) changes to mangroves in SMNR and part of ZMNR during 1986–2021.
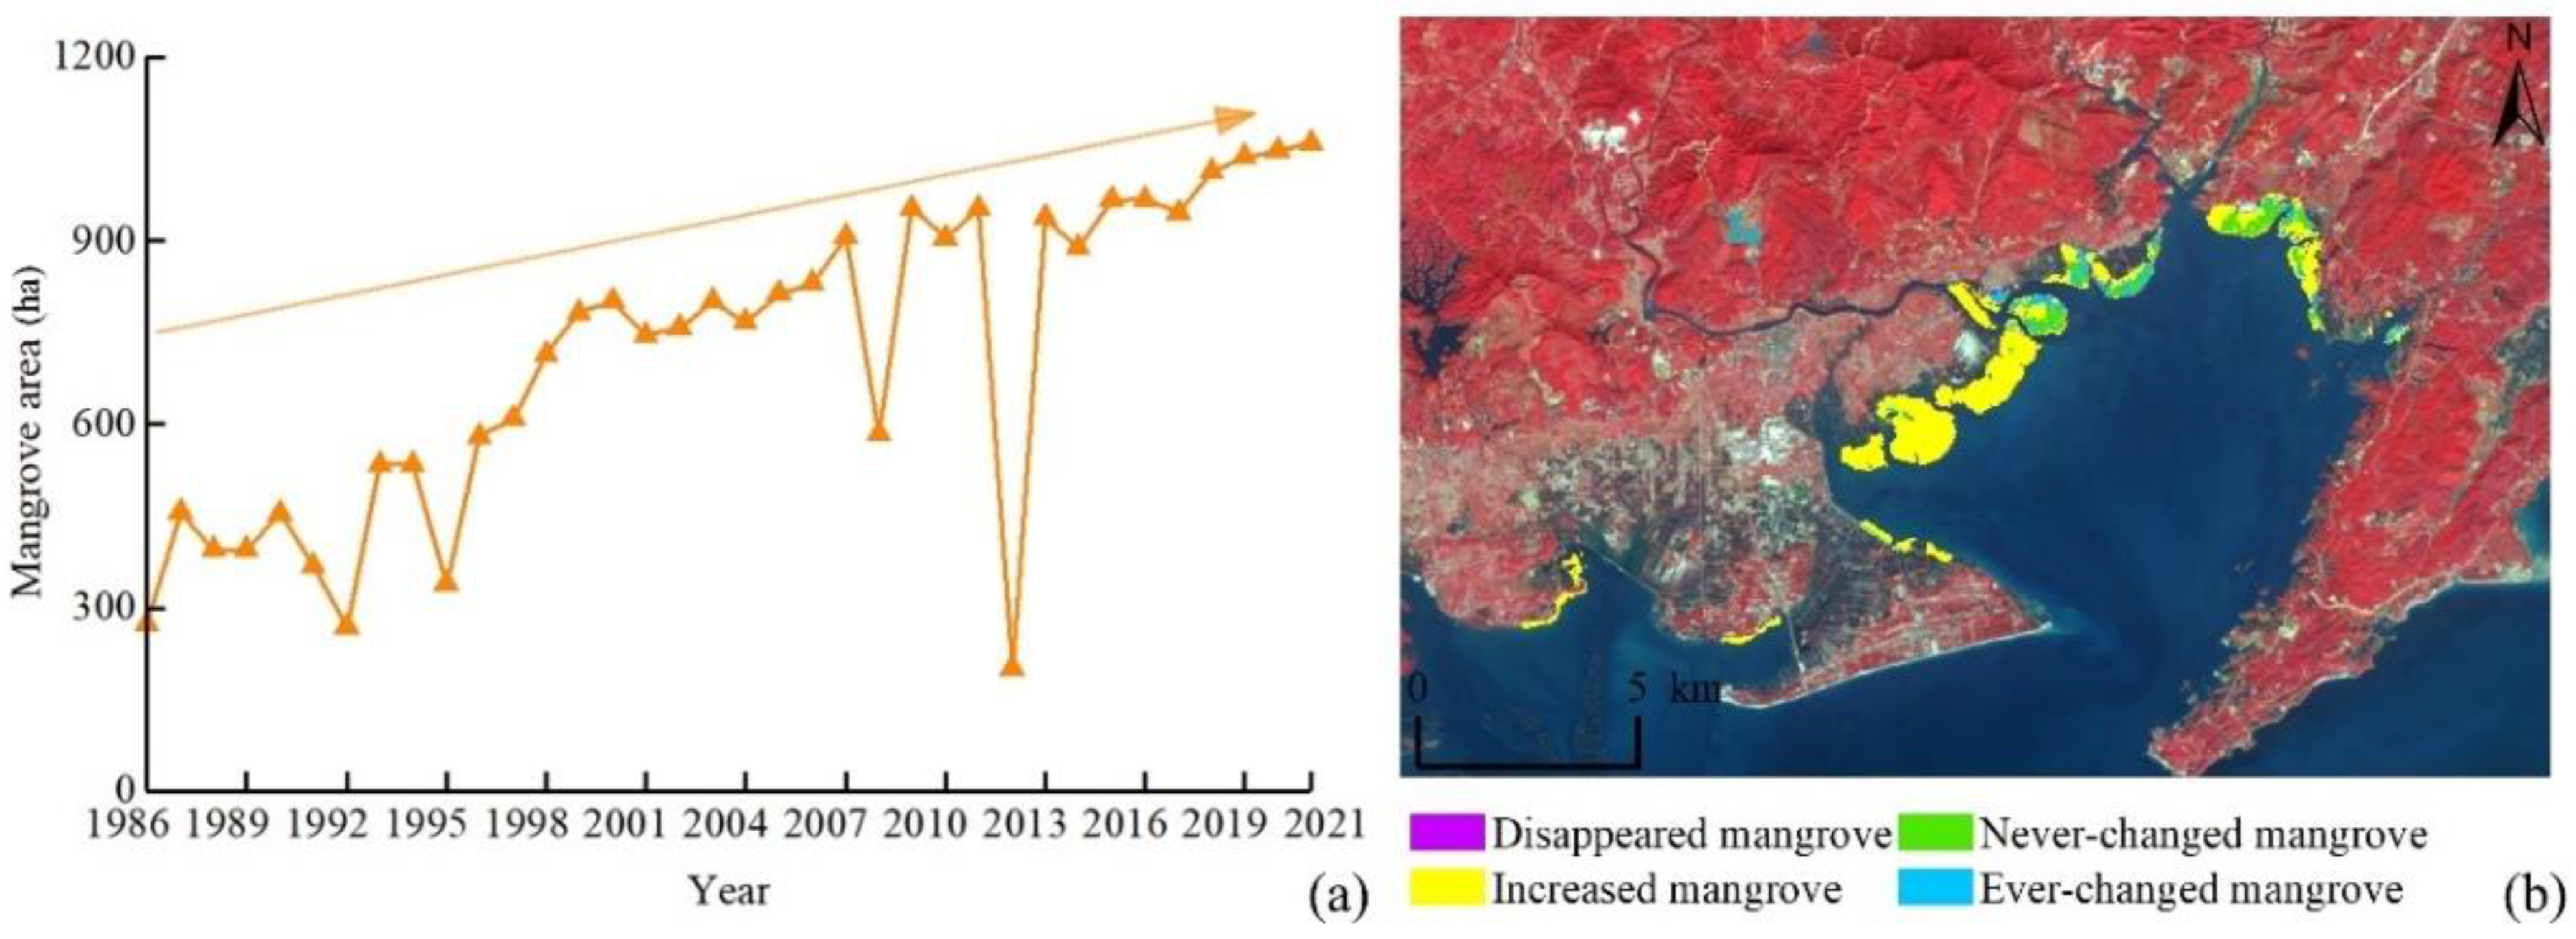
- BNNR
The BNNR, located in Fangchenggang City, Guangxi, was established in March 1990, and the mangrove area in the reserve was 200–1100 ha during 1986–2021, with an overall increasing trend. During 1986–1996, the area of mangroves in the protected areas showed a large increase, reaching 581.12 ha in 1996, which represented an increase of 307.60 ha compared with 1986 (Figure 12a). In the following 26 years, the mangroves in the protected areas showed a slow growth trend with small increases, and were attacked by O. cantonella in 2004, resulting in a slight decrease in area to 766.35 ha. Subsequently, in 2010, there was an outbreak of Sphaeroma terebrans and S. retrolaevis in Guangxi, and the mangrove area in the reserve again decreased slightly compared to the previous year, to 904.80 ha. In 2012, the area of mangroves in the reserve decreased significantly due to the loss of the strips of Landsat ETM+; in 2017, the mangroves were attacked by Sphaeroma spp., which decreased the area by 21.74 ha compared with 2016. The area of mangroves in the protected area then increased slowly, reaching 1060.50 ha in 2021, which was about 3.88 times the area in 1986. During 1986–2021, the mangroves in the protected area mainly increased, and this was generally in the west and northwest of the protected area (Figure 12b). The mangroves in the northeast side of the reserve were relatively stable, and very few mangroves disappeared during the study period.
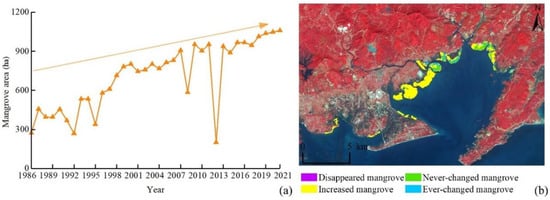
Figure 12.
(a) Mangrove area and (b) changes to mangroves in BNNR during 1986–2021.
- DNNR
The DNNR, located in Meilan District, Haikou City, Hainan, was established in January 1980, and accounted for about 50% of the total mangrove area in Hainan. During 1986–2021, the mangrove area in the reserve ranged within 1850–2250 ha, with no obvious changes in the overall trend, and was relatively stable (Figure 13a). In 2021, the mangrove area in the protected area was 2221.70 ha, compared with 1870.21 ha in 1986, which represented an increase of 351.49 ha, showing that the protected area had some protective effect. During the study period, most of the mangroves in the reserve were stable and always mangroves; the two patches in the west of the reserve near the inland changed to other features, some mangroves in the northeast patches disappeared, and the increased mangroves were mainly distributed in the southeast corner (Figure 13b).
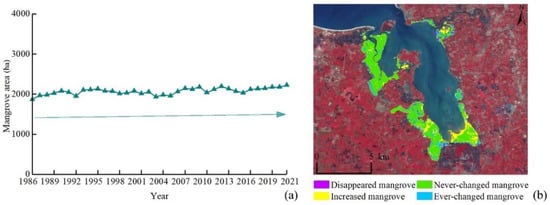
Figure 13.
(a) Mangrove area and (b) changes to mangroves in DNNR during 1986–2021.
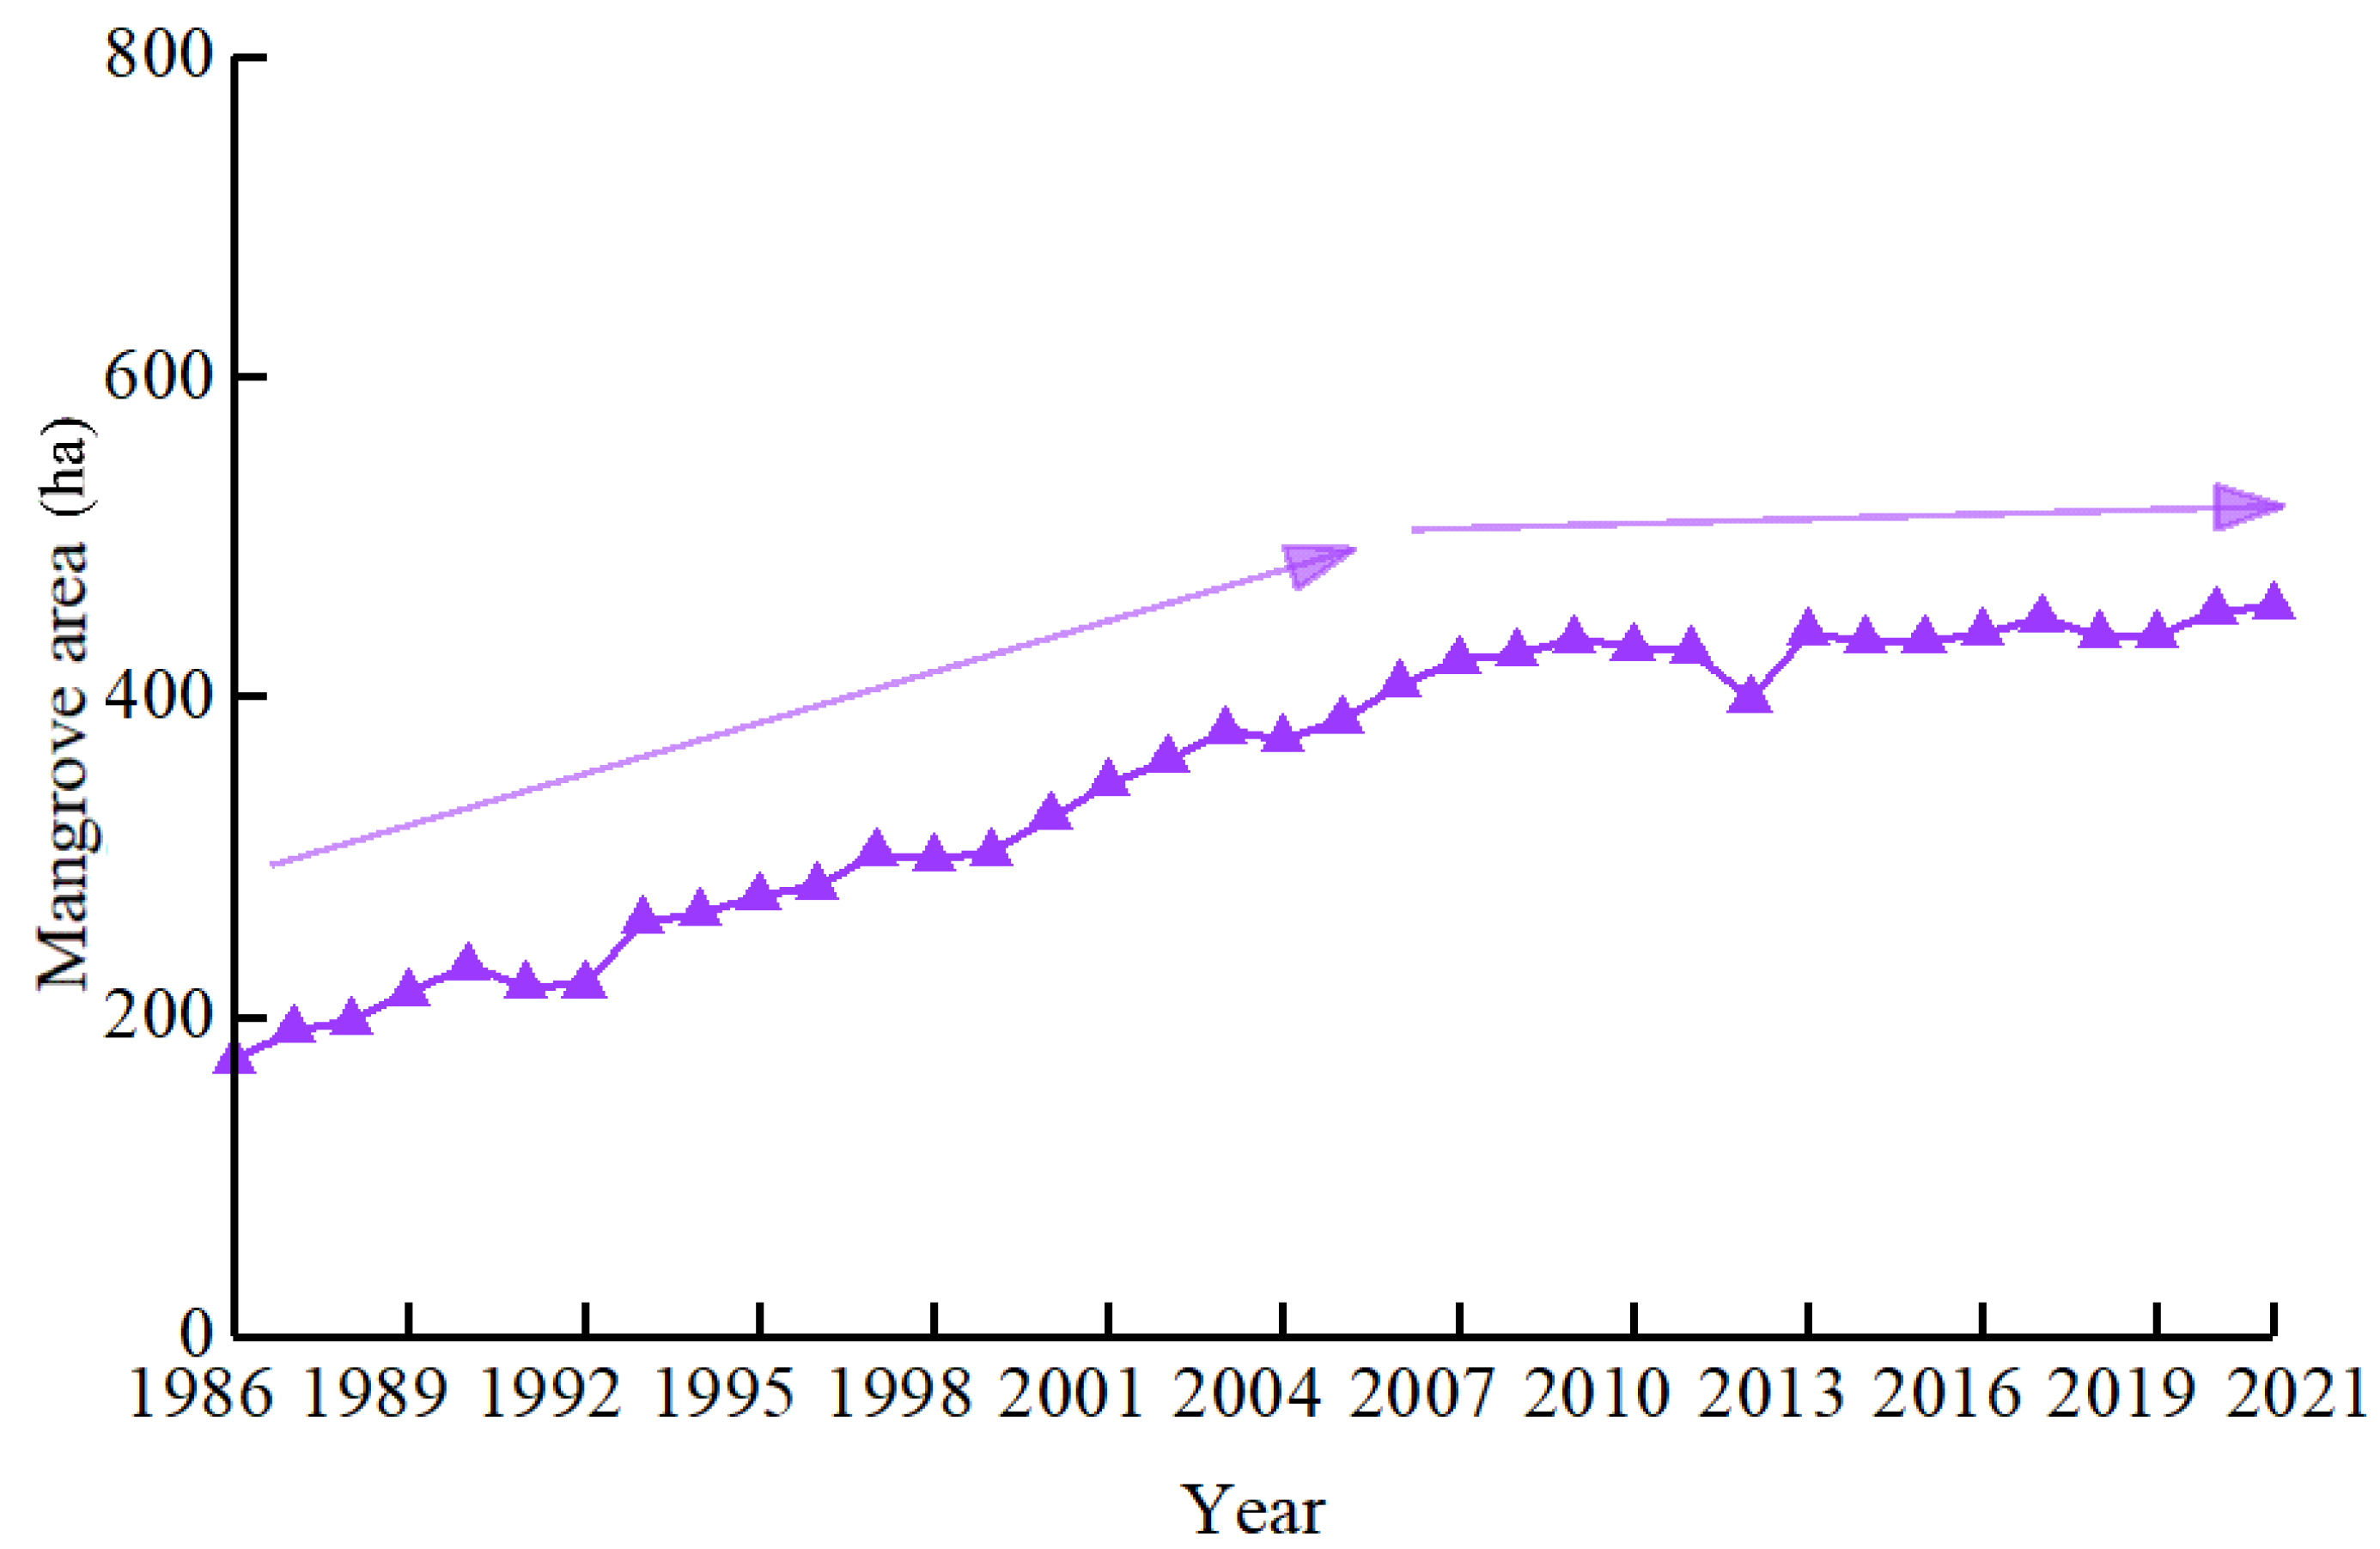
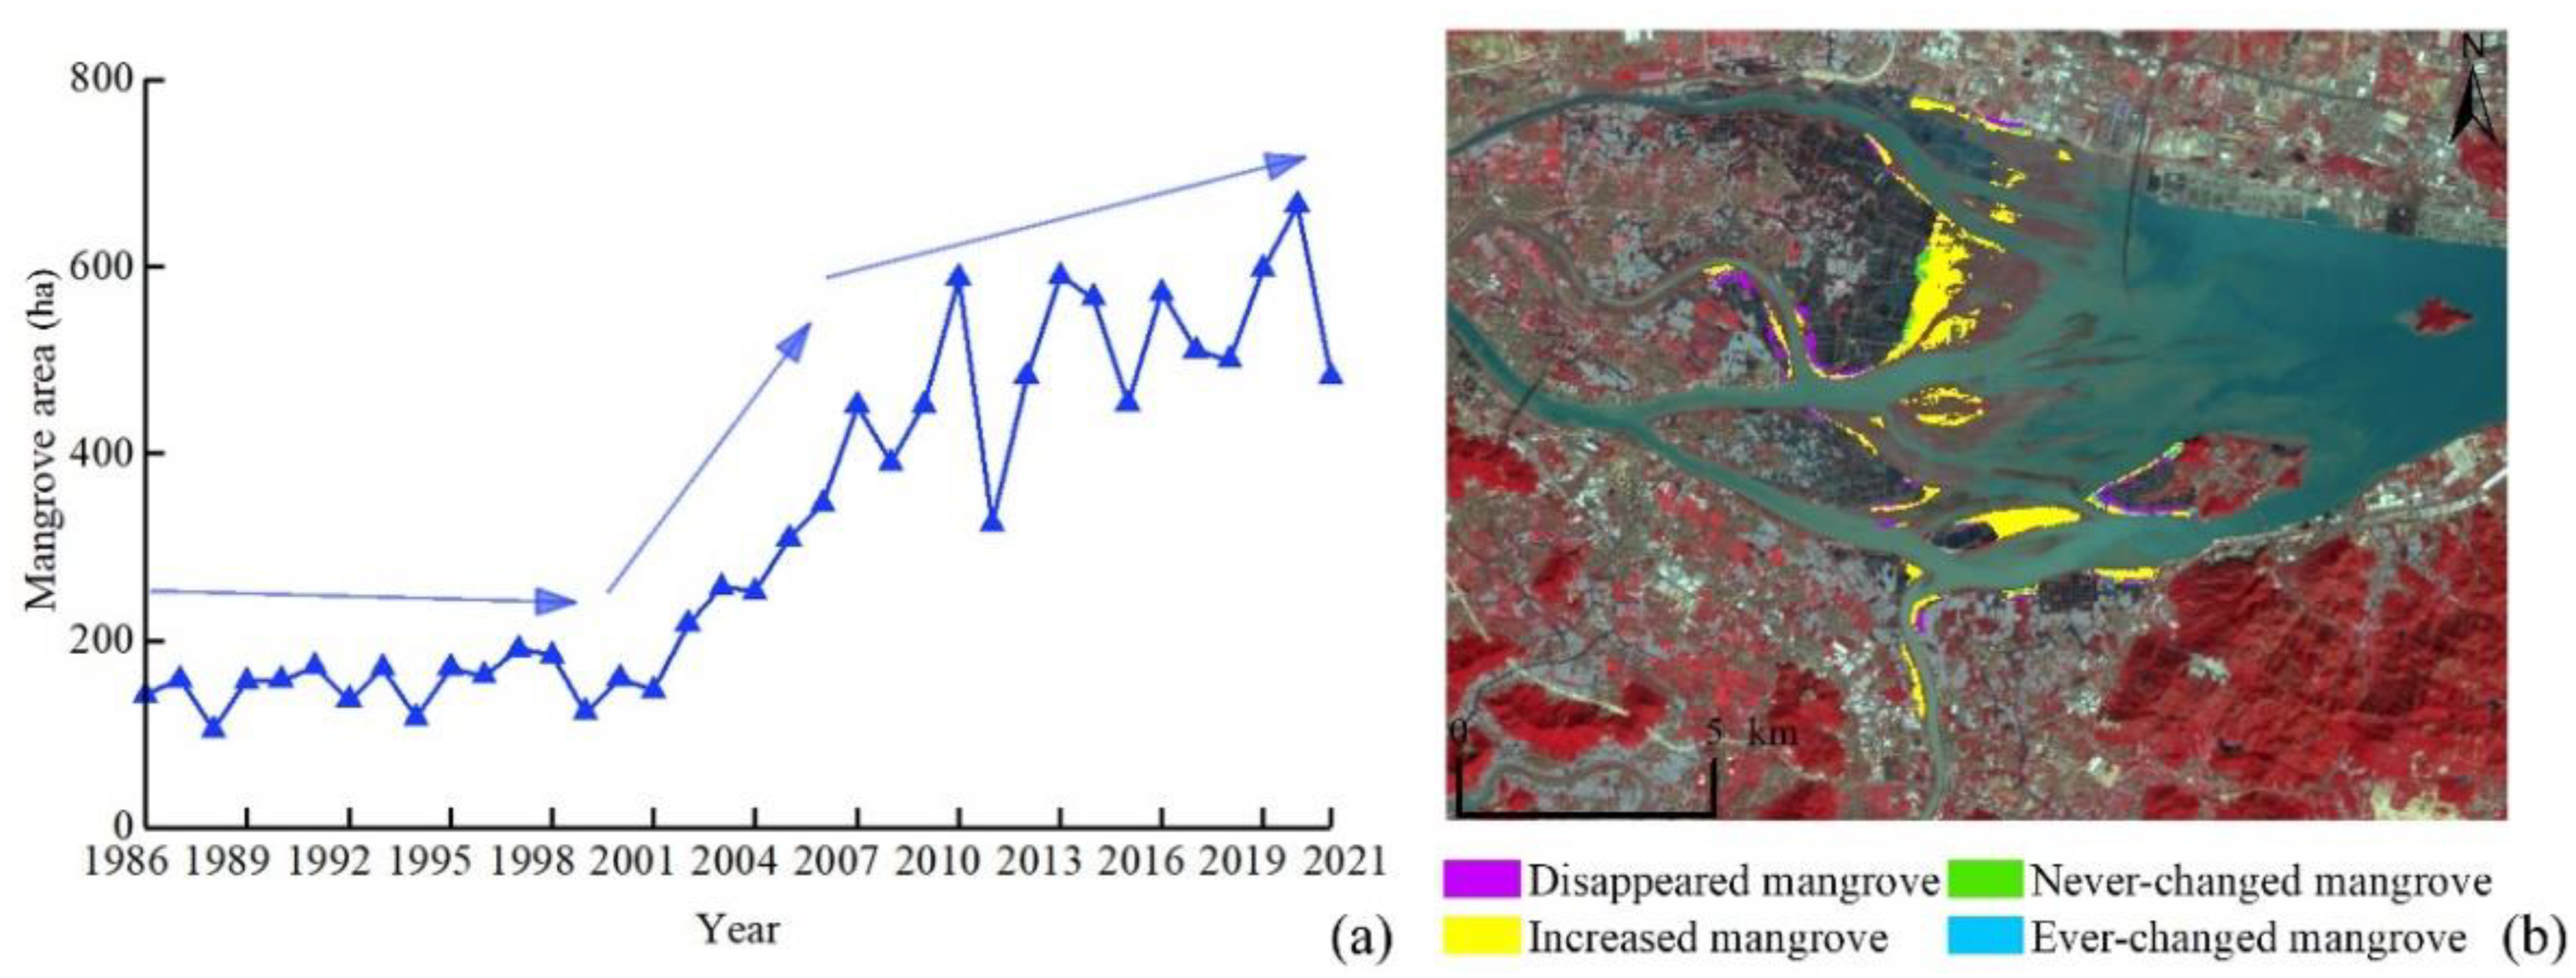
- ZNNR
The ZNNR is located in Yunxiao County, Zhangzhou City, Fujian, and was established in 1992. For 1986–2021, the mangrove area in the reserve ranged within 100–700 ha, with an overall trend of increasing mangrove area (Figure 14a). During 1986–2001, there was no obvious trends in the changes to the mangrove area in the reserve, which mainly fluctuated around 150.00 ha. During 2001–2007, the mangrove area showed a more obvious increasing trend, reaching 451.11 ha in 2007; then, until 2021, the mangrove area fluctuated more, but mainly showed an increasing trend, and reached a maximum of 665.52 ha in 2020. During 1986–2021, the mangrove area in the reserve increased by 2.4 times. During the study period, there were very few stable mangroves in the reserve, and the area mainly consisted of increasing mangroves, extending from land to sea; meanwhile, some mangroves disappeared on the west side of the reserve near the land area, and in the central part near the land area of Fugong Town (Figure 14b).

Figure 14.
(a) Mangrove area and (b) changes to mangroves in ZNNR during 1986–2021.
4. Conclusions
In this paper, we used multi-temporal Landsat TM, ETM+ and OLI images as data sources, combined NDVI data, used the Otsu threshold segmentation algorithm to determine the range of mangroves in the NDVI, referred to the effect of mangrove temporal changes in the last three years and in the next three years, and realized the interannual mangrove changes in China during 1986–2021. We monitored the dynamic changes and the spatial distribution patterns, and analyzed the dynamic trend. The main conclusions were as follows:
- (1)
- Based on the massive amount of remote-sensing image data and efficient cloud-computing processing capability of GEE, combined with Landsat image data, we achieved a large-scale inter-annual mangrove distribution area extraction, avoiding the problems of non-uniform data sources and inconsistent extraction standards. The OA in 2019 was above 0.93, and the deviations from published datasets in 2018, 2019 and 2020 were less than 1%. The mangrove distribution extraction effect was good.
- (2)
- During the study period, the total mangrove area and the mean patch size in China both showed an increasing trend, and the fragmentation of mangrove patches was reduced; Guangdong and Guangxi were the top two provinces in terms of the highest mangrove area in China; the area of mangrove patches in both provinces showed an increasing trend; the mean patch size also showed an increasing trend; and the fragmentation of patches was reduced.
- (3)
- Except for the mangrove area in DNNR, which had no obvious trends in change, the total mangrove area in each national mangrove nature reserve is on the rise, with mainly changes in expanding mangrove patches, and the decrease in mangrove area was very little, which indicates that the establishment of reserves has had a certain effect on mangrove protection.
Author Contributions
Conceptualization, Z.W. and K.L.; methodology, Z.W., K.L., J.C. and L.P.; software, Z.W. and X.W.; writing—original draft preparation, Z.W.; writing—review and editing, K.L.; project administration, K.L and J.C. All authors have read and agreed to the published version of the manuscript.
Funding
This research was funded by the Guangdong Basic and Applied Basic Research Foundation, grant numbers 2021A1515011462 and 2021A1515110157, and the Innovation Group Project of Southern Marine Science and Engineering, Guangdong Laboratory (Zhuhai) (No. 3110210014).
Data Availability Statement
Not applicable.
Conflicts of Interest
The authors declare no conflict of interest.
References
- Wang, L.; Jia, M.; Yin, D.; Tian, J. A review of remote sensing for mangrove forests: 1956–2018. Remote Sens. Environ. 2019, 231, 111–223. [Google Scholar] [CrossRef]
- Pham, T.; Yokoya, N.; Bui, D.; Yoshino, K.; Friess, D. Remote Sensing Approaches for Monitoring Mangrove Species, Structure, and Biomass: Opportunities and Challenges. Remote Sens. 2019, 11, 230. [Google Scholar] [CrossRef]
- Wang, Y.; Dong, P.; Hu, W.; Chen, G.; Zhang, D.; Chen, B.; Lei, G. Modeling the Climate Suitability of Northernmost Mangroves in China under Climate Change Scenarios. Forests 2022, 13, 64. [Google Scholar] [CrossRef]
- Hu, L.; Li, W.; Xu, B. The role of remote sensing on studying mangrove forest extent change. Int. J. Remote Sens. 2018, 39, 6440–6462. [Google Scholar] [CrossRef]
- Kuenzer, C.; Bluemel, A.; Gebhardt, S.; Quoc, T.V.; Dech, S. Remote Sensing of Mangrove Ecosystems: A Review. Remote Sens. 2011, 3, 878–928. [Google Scholar] [CrossRef]
- Polidoro, B.A.; Carpenter, K.E.; Collins, L.; Duke, N.C.; Ellison, A.M.; Ellison, J.C.; Farnsworth, E.J.; Fernando, E.S.; Kathiresan, K.; Koedam, N.E.; et al. The loss of species: Mangrove extinction risk and geographic areas of global concern. PLoS ONE 2010, 5, e10095. [Google Scholar] [CrossRef]
- You, S.; Loh, P.; Li, Z.; Qin, H.; Pradit, S.; Le, T.P.Q.; Oeurng, C.; Mohamed, C.A.R.; Lee, C.W.; Lu, X.; et al. Geochemical Behavior of Sedimentary Phosphorus Species in Northernmost Artificial Mangroves in China. Forests 2022, 13, 610. [Google Scholar] [CrossRef]
- Giri, C.; Ochieng, E.; Tieszen, L.L.; Zhu, Z.; Singh, A.; Loveland, T.; Masek, J.; Duke, N. Status and distribution of mangrove forests of the world using earth observation satellite data. Glob. Ecol. Biogeogr. 2011, 20, 154–159. [Google Scholar] [CrossRef]
- Wu, P.; Zhang, J.; Ma, Y.; Li, X. Remote Sensing Monitoring and Analysis of the Changes of Mangrove Resources in China in the Past 20 Years. Adv. Mar. Sci. 2013, 31, 401–414. [Google Scholar]
- Li, C.G.; Dai, H.B. Mechanism analysis of temporal dynamics in mangrove spatial distribution in Guangxi, China: 1960–2010. Acta Ecol. Sin. 2015, 35, 5992–6006. [Google Scholar]
- Liao, J.; Zhen, J.; Zhang, L.; Metternicht, G. Understanding Dynamics of Mangrove Forest on Protected Areas of Hainan Island, China: 30 Years of Evidence from Remote Sensing. Sustainability 2019, 11, 5356. [Google Scholar] [CrossRef]
- Jia, M.; Wang, Z.; Mao, D.; Huang, C.; Lu, C. Spatial-temporal changes of China’s mangrove forests over the past 50 years: An analysis towards the Sustainable Development Goals (SDGs). Chin. Sci. Bull. 2021, 66, 3886–3901. (In Chinese) [Google Scholar] [CrossRef]
- Wong, C.J.; James, D.; Besar, N.A.; Kamlun, K.U.; Tangah, J.; Tsuyuki, S.; Phua, M. Estimating Mangrove Above-Ground Biomass Loss Due to Deforestation in Malaysian Northern Borneo between 2000 and 2015 Using SRTM and Landsat Images. Forests 2020, 11, 1018. [Google Scholar] [CrossRef]
- Lin, T.; Chai, Q.; Sun, Z.; Yan, Z.; Sun, B. The Area Change and Governance of the Mangrove in China. Ocean. Dev. Manag. 2020, 2, 48–52. [Google Scholar]
- Yang, S.; Lu, W.; Zou, Z.; Li, S. Mangrove Wetlands: Distribution, Species Composition and Protection in China. Subtrop. Plant Sci. 2017, 46, 301–310. [Google Scholar]
- Zhao, C.; Qin, C. A Fine Resolution Mangrove Map of China for 2019 Derived from 10-m-Resolution Satellite Observations and Google Earth Images; Science Data Bank: Beijing, China, 2021. [Google Scholar] [CrossRef]
- Zhang, T.; You, S.; Yang, X.; Hu, S. Mangroves Map of China 2018 (MC2018) Derived from 2-Meter Resolution Satellite Observations and Field Data; Science Data Bank: Beijing, China, 2020. [Google Scholar]
- Baloloy, A.B.; Blanco, A.C.; Ana, R.R.C.S.; Nadaoka, K. Development and application of a new mangrove vegetation index (MVI) for rapid and accurate mangrove mapping. ISPRS J. Photogramm. Remote Sens. 2020, 166, 95–117. [Google Scholar] [CrossRef]
- Diniz, C.; Cortinhas, L.; Nerino, G.; Rodrigues, J.; Sadeck, L.; Adami, M.; Souza-Filho, P. Brazilian Mangrove Status: Three Decades of Satellite Data Analysis. Remote Sens. 2019, 11, 808. [Google Scholar] [CrossRef]
- Gorelick, N.; Hancher, M.; Dixon, M.; Ilyushchenko, S.; Thau, D.; Moore, R. Google Earth Engine: Planetary-scale geospatial analysis for everyone. Remote Sens. Environ. 2017, 202, 18–27. [Google Scholar] [CrossRef]
- Amani, M.; Ghorbanian, A.; Ahmadi, S.A.; Kakooei, M.; Moghimi, A.; Mirmazloumi, S.M.; Moghaddam, S.H.A.; Mahdavi, S.; Ghahremanloo, M.; Parsian, S.; et al. Google Earth Engine Cloud Computing Platform for Remote Sensing Big Data Applications: A Comprehensive Review. IEEE J. Sel. Top. Appl. Earth Obs. Remote Sens. 2020, 13, 5326–5350. [Google Scholar] [CrossRef]
- Xiong, J.; Thenkabail, P.S.; Tilton, J.C.; Gumma, M.K.; Teluguntla, P.; Oliphant, A.; Congalton, R.G.; Yadav, K.; Gorelick, N. Nominal 30-m Cropland Extent Map of Continental Africa by Integrating Pixel-Based and Object-Based Algorithms Using Sentinel-2 and Landsat-8 Data on Google Earth Engine. Remote Sens. 2017, 9, 1065. [Google Scholar] [CrossRef]
- Nguyen, H.T.T.; Hardy, G.E.S.; Le, T.V.; Nguyen, H.Q.; Nguyen, H.H.; Nguyen, T.V.; Dell, B. Mangrove Forest Landcover Changes in Coastal Vietnam: A Case Study from 1973 to 2020 in Thanh Hoa and Nghe An Provinces. Forests 2021, 12, 637. [Google Scholar] [CrossRef]
- Kumar, L.; Mutanga, O. Google Earth Engine Applications Since Inception: Usage, Trends, and Potential. Remote Sens. 2018, 10, 1509. [Google Scholar] [CrossRef]
- Bhargava, R.; Sarkar, D.; Friess, D.A. A cloud computing-based approach to mapping mangrove erosion and progradation: Case studies from the Sundarbans and French Guiana. Estuar. Coast. Shelf Sci. 2021, 248, 106798. [Google Scholar] [CrossRef]
- Chen, B.; Xiao, X.; Li, X.; Pan, L.; Doughty, R.; Ma, J.; Dong, J.; Qin, Y.; Zhao, B.; Wu, Z.; et al. A mangrove forest map of China in 2015: Analysis of time series Landsat 7/8 and Sentinel-1A imagery in Google Earth Engine cloud computing platform. ISPRS J. Photogramm. Remote Sens. 2017, 131, 104–120. [Google Scholar] [CrossRef]
- Wang, X.; Xiao, X.; Zou, Z.; Hou, L.; Qin, Y.; Dong, J.; Doughty, R.B.; Chen, B.; Zhang, X.; Chen, Y.; et al. Mapping coastal wetlands of China using time series Landsat images in 2018 and Google Earth Engine. ISPRS J. Photogramm. Remote Sens. 2020, 163, 312–326. [Google Scholar] [CrossRef] [PubMed]
- Zhao, C.; Qin, C. 10-m-resolution mangrove map of China for 2017 derived from multi-source and multi-temporal satellite observations. ISPRS J. Photogramm. Remote Sens. 2020, 169, 389–405. [Google Scholar] [CrossRef]
- Jia, M.; Wang, Z.; Zhang, Y.; Mao, D.; Wang, C. Monitoring loss and recovery of mangrove forests during 42 years: The achievements of mangrove conservation in China. Int. J. Appl. Earth Obs. 2018, 73, 535–545. [Google Scholar] [CrossRef]
- Wang, W.; Fu, H.; Lee, S.Y.; Fan, H.; Wang, M. Can Strict Protection Stop the Decline of Mangrove Ecosystems in China? From Rapid Destruction to Rampant Degradation. Forests 2020, 11, 55. [Google Scholar] [CrossRef]
- Huang, K.; Meng, X.Z.; Yang, G.; Sun, W.W. Spatio-temporal probability threshold method of remote sensing for mangroves mapping in China. Natl. Remote Sens. Bull. 2022. [Google Scholar] [CrossRef]
- Bunting, P.; Rosenqvist, A.; Lucas, R.; Rebelo, L.; Hilarides, L.; Thomas, N.; Hardy, A.; Itoh, T.; Shimada, M.; Finlayson, C. The Global Mangrove Watch—A New 2010 Global Baseline of Mangrove Extent. Remote Sens. 2018, 10, 1669. [Google Scholar] [CrossRef]
- Ju, J.; Roy, D.P.; Vermote, E.; Masek, J.; Kovalskyy, V. Continental-scale validation of MODIS-based and LEDAPS Landsat ETM+ atmospheric correction methods. Remote Sens. Environ. 2012, 122, 175–184. [Google Scholar] [CrossRef]
- Vermote, E.; Justice, C.; Claverie, M.; Franch, B. Preliminary analysis of the performance of the Landsat 8/OLI land surface reflectance product. Remote Sens. Environ. 2016, 185, 46–56. [Google Scholar] [CrossRef]
- Skakun, S.; Vermote, E.F.; Roger, J.; Justice, C.O.; Masek, J.G. Validation of the LaSRC Cloud Detection Algorithm for Landsat 8 Images. IEEE J. Sel. Top. Appl. Earth Obs. Remote Sens. 2019, 12, 2439–2446. [Google Scholar] [CrossRef]
- Crist, E.P. A Tm Tasseled Cap Equivalent Transformation for Reflectance Factor Data. Remote Sens. Environ. 1985, 17, 301–306. [Google Scholar] [CrossRef]
- Kattimani, J.M.; Prasad, T.J.R. Normalised Differenciative Vegetation Index (NDVI) Analysis in South-East Dry Agro-Climatic Zones of Karnataka Using RS and GIS Techniques. Int. J. Adv. Res. 2016, 4, 1952–1957. [Google Scholar] [CrossRef]
- Otsu, N. A Threshold Selection Method from Gray-Level Histograms. IEEE Trans. Syst. Man Cybern. 1979, 9, 62–66. [Google Scholar] [CrossRef]
- Donchyts, G.; Schellekens, J.; Winsemius, H.; Eisemann, E.; van de Giesen, N. A 30 m Resolution Surface Water Mask Including Estimation of Positional and Thematic Differences Using Landsat 8, SRTM and OpenStreetMap: A Case Study in the Murray-Darling Basin, Australia. Remote Sens. 2016, 8, 386. [Google Scholar] [CrossRef]
- Li, W.; Du, Z.; Ling, F.; Zhou, D.; Wang, H.; Gui, Y.; Sun, B.; Zhang, X. A Comparison of Land Surface Water Mapping Using the Normalized Difference Water Index from TM, ETM+ and ALI. Remote Sens. 2013, 5, 5530–5549. [Google Scholar] [CrossRef]
- Rad, A.M.; Kreitler, J.; Sadegh, M. Augmented Normalized Difference Water Index for improved surface water monitoring. Environ. Model. Softw. 2021, 140, 105030. [Google Scholar] [CrossRef]
- Li, B.; Xu, X.; Han, J.; Zhang, L.; Bian, C.; Jin, L.; Liu, J. The estimation of crop emergence in potatoes by UAV RGB imagery. Plant Methods 2019, 15, 15. [Google Scholar] [CrossRef]
- Meyer, G.E.; Neto, J.C. Verification of color vegetation indices for automated crop imaging applications. Comput. Electron. Agric. 2008, 63, 282–293. [Google Scholar] [CrossRef]
- Yu, Y.; Bao, Y.; Wang, J.; Chu, H.; Zhao, N.; He, Y.; Liu, Y. Crop Row Segmentation and Detection in Paddy Fields Based on Treble-Classification Otsu and Double-Dimensional Clustering Method. Remote Sens. 2021, 13, 901. [Google Scholar] [CrossRef]
- Ezimand, K.; Kakroodi, A.A.; Kiavarz, M. The development of spectral indices for detecting built-up land areas and their relationship with land-surface temperature. Int. J. Remote Sens. 2018, 39, 8428–8449. [Google Scholar] [CrossRef]
- Li, C.; Shao, Z.; Zhang, L.; Huang, X.; Zhang, M. A Comparative Analysis of Index-Based Methods for Impervious Surface Mapping Using Multiseasonal Sentinel-2 Satellite Data. IEEE J. Sel. Top. Appl. Earth Obs. Remote Sens. 2021, 14, 3682–3694. [Google Scholar] [CrossRef]
- Fujian Takes Several Measures to Strengthen the Protection of Natural Wetlands in Minjiang Estuary—Mangrove Planting 1000 in Xinhua Fujian Channel 2013–1002. Available online: http://www.fujian.gov.cn/xwdt/fjyw/201310/t20131002_1657989.htm (accessed on 1 September 2022).
- Beauty Zai! ‘Great Green Wall’ on Qianli Coast—Planting Mangrove Spartina Alterniflora—Fujian Daily. 9 August 2016. Available online: http://www.fujian.gov.cn/xwdt/fjyw/201608/t20160809_1689044.htm (accessed on 1 September 2022).
- The Ministry of Ecology and Environment Has Announced the Destruction of Mangroves in Chengmai County, Hainan Province. Available online: http://www.mee.gov.cn/xxgk2018/xxgk/xxgk15/201908/t20190809_713908.html (accessed on 1 September 2022).
- Li, L.I.; Xing, W.U.; Ya, G.U.O. Temporal and spatial variation analysis of the coastline of northwestern Hainan Island. Spat. Var. Anal. R.S. 2019, 87–93. [Google Scholar] [CrossRef]
- Lin, W.; Fu, S.; Qin, Y.; Ma, X.; He, Y. Analysis of the Characteristics of Coastline Changes in Fuzhou City Based on Landsat Images. J. Minjiang Univ. 2020, 41, 82–91. [Google Scholar] [CrossRef]
- FAO. Forest Resources Assessment 1990; Globle Synthesis; FAO: Rome, Italy, 1995. [Google Scholar]
- Saura, S. Effects of remote sensor spatial resolution and data aggregation on selected fragmentation indices. Landsc. Ecol. 2004, 19, 197–209. [Google Scholar] [CrossRef]
- FAO. The World’s Mangroves 1980–2005//FAO Forestry Paper 153; FAO: Rome, Italy, 2007. [Google Scholar]
- Richards, D.R.; Friess, D.A. Rates and drivers of mangrove deforestation in Southeast Asia, 2000–2012. Proc. Natl. Acad. Sci. USA 2016, 113, 344–349. [Google Scholar] [CrossRef] [Green Version]
- Jia, M. Remote Sensing Analysis of China’s Mangrove Forests Dynamics during 1973 to 2013. Ph.D. Thesis, Northeast Institute of Geography and Agroecology, Chinese Academy of Sciences, Changchun, China, 2014. [Google Scholar]
- Fan, H.; Wang, W. Some Thematic Issues for Mangrove Conservation in China. J. Xiamen Univ. Nat. Sci. 2017, 56, 323–330. [Google Scholar]


Publisher’s Note: MDPI stays neutral with regard to jurisdictional claims in published maps and institutional affiliations. |
© 2022 by the authors. Licensee MDPI, Basel, Switzerland. This article is an open access article distributed under the terms and conditions of the Creative Commons Attribution (CC BY) license (https://creativecommons.org/licenses/by/4.0/).