
Generation Mechanism of Supply and Demand Gap of Forestry Carbon Sequestration Based on Evolutionary Game: Findings from China


Abstract
:1. Introduction
2. Problem Description and Basic Assumptions
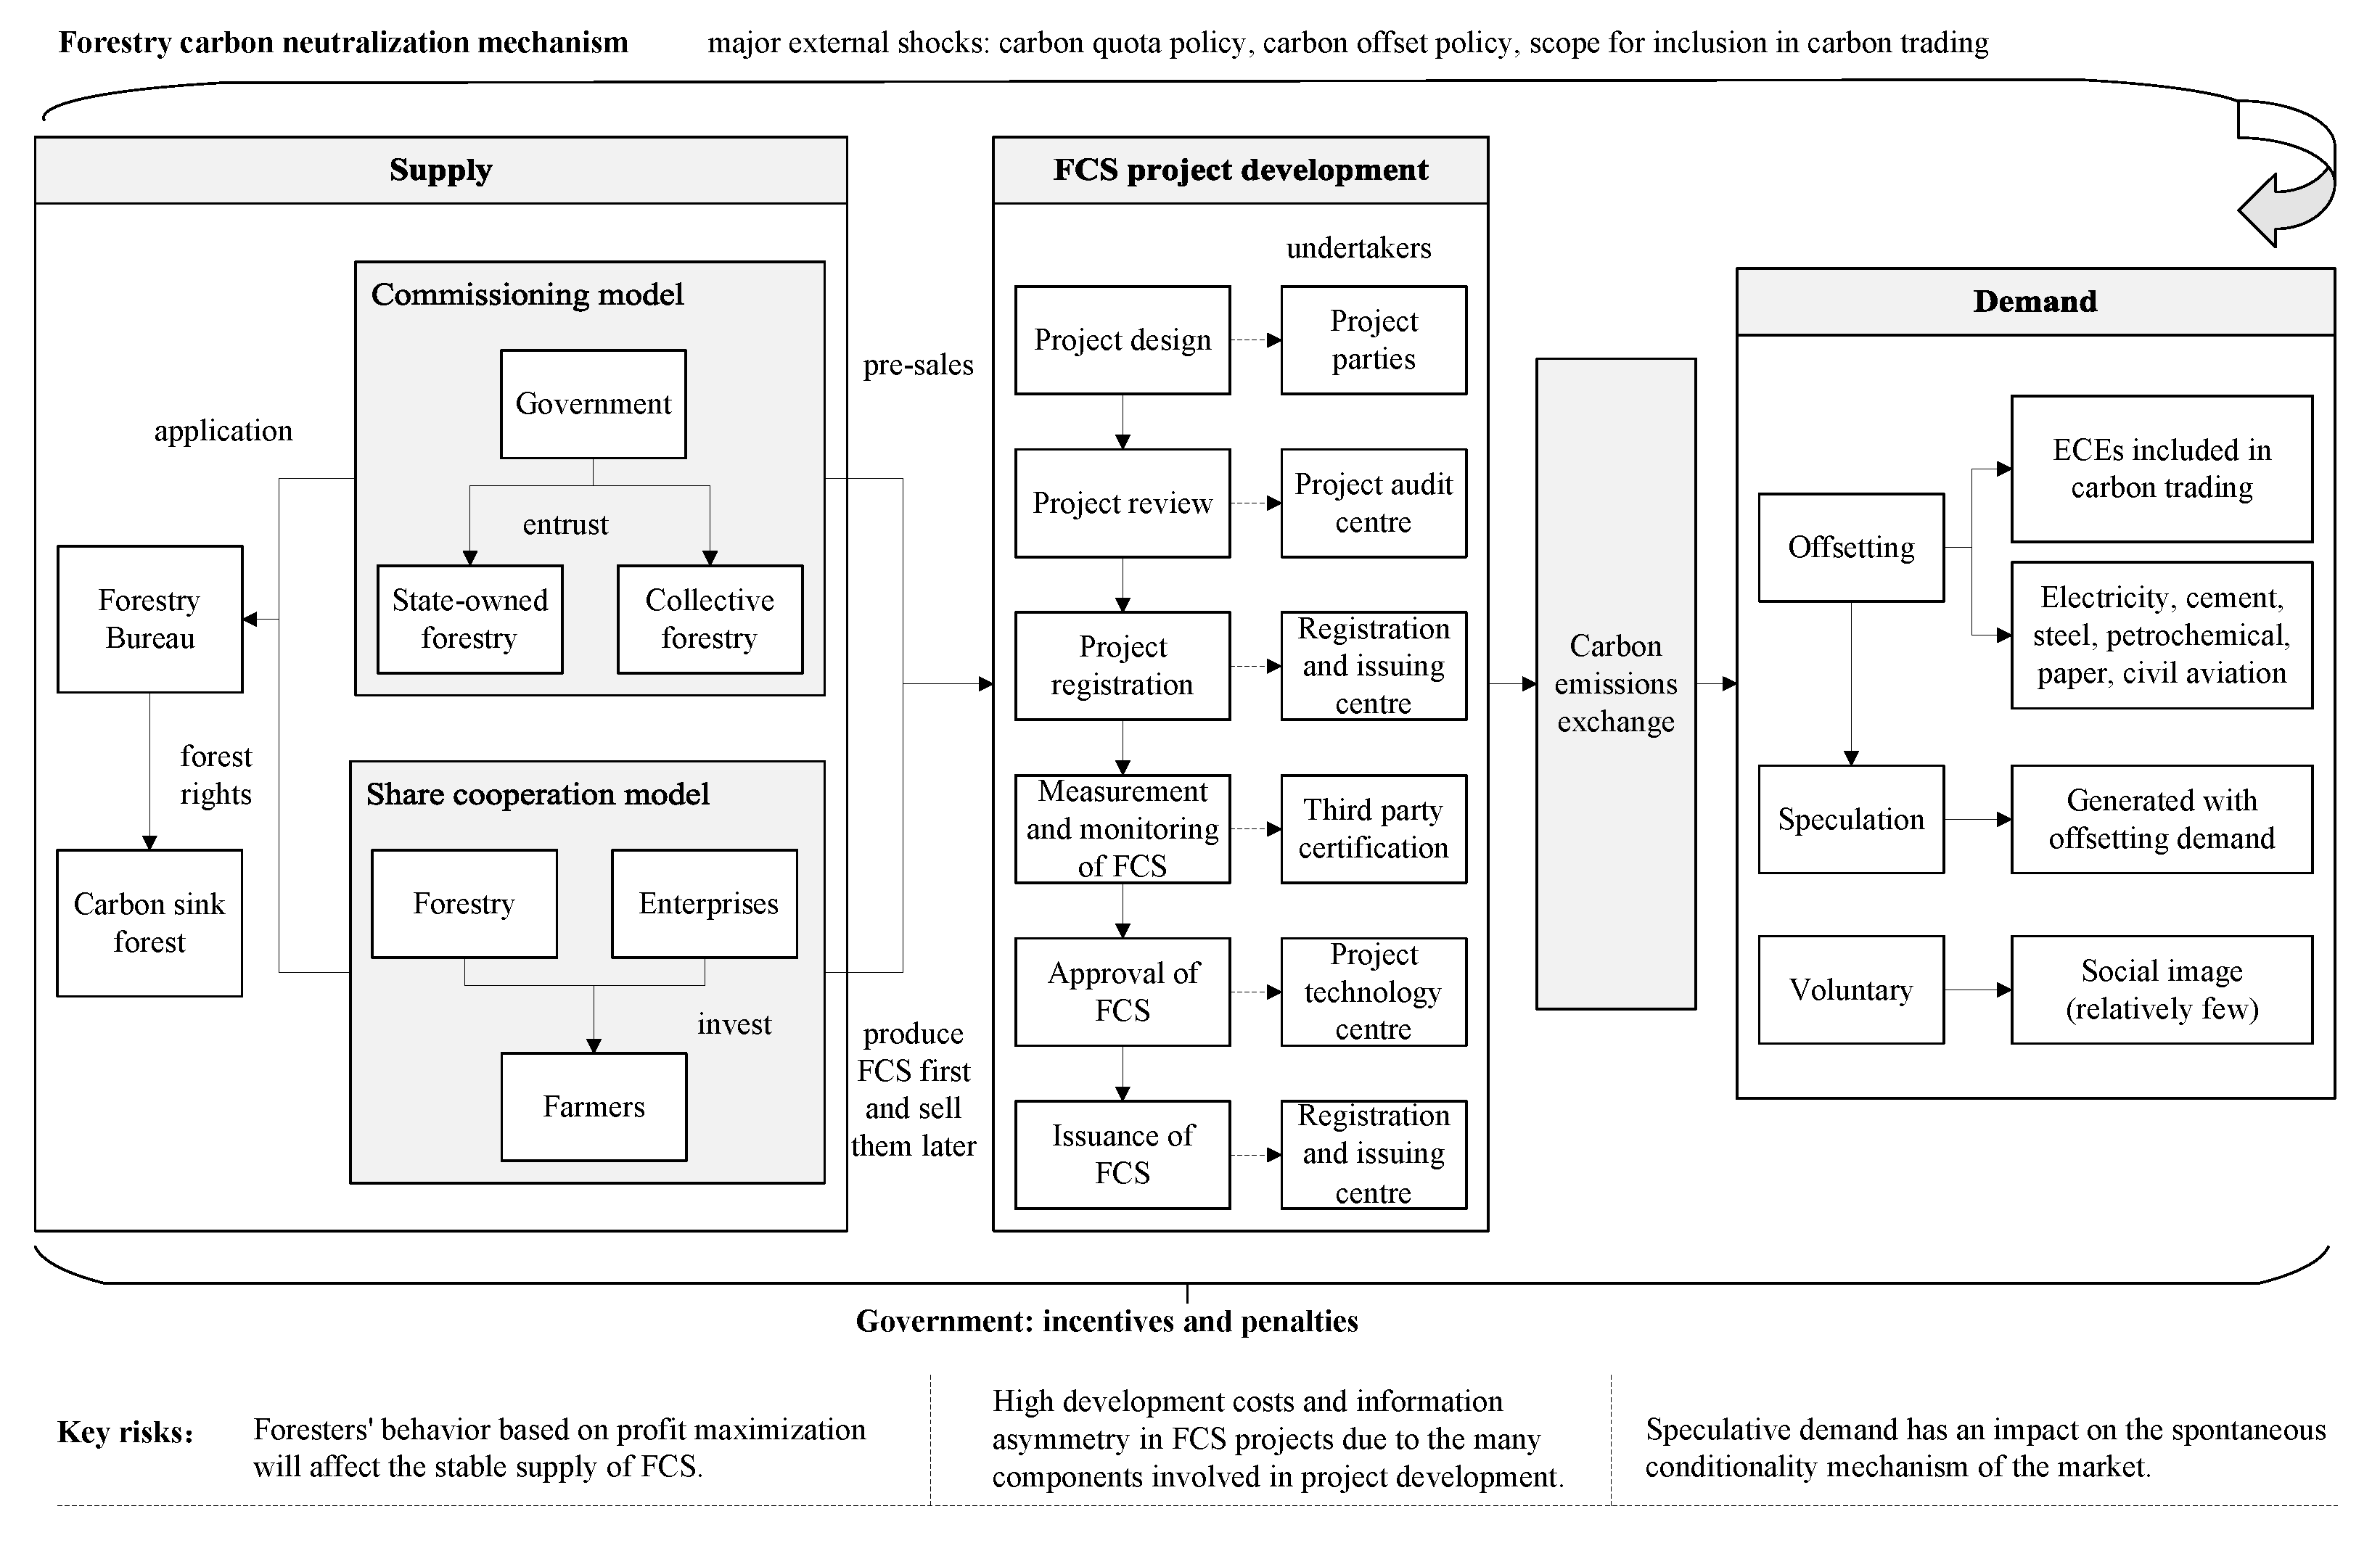
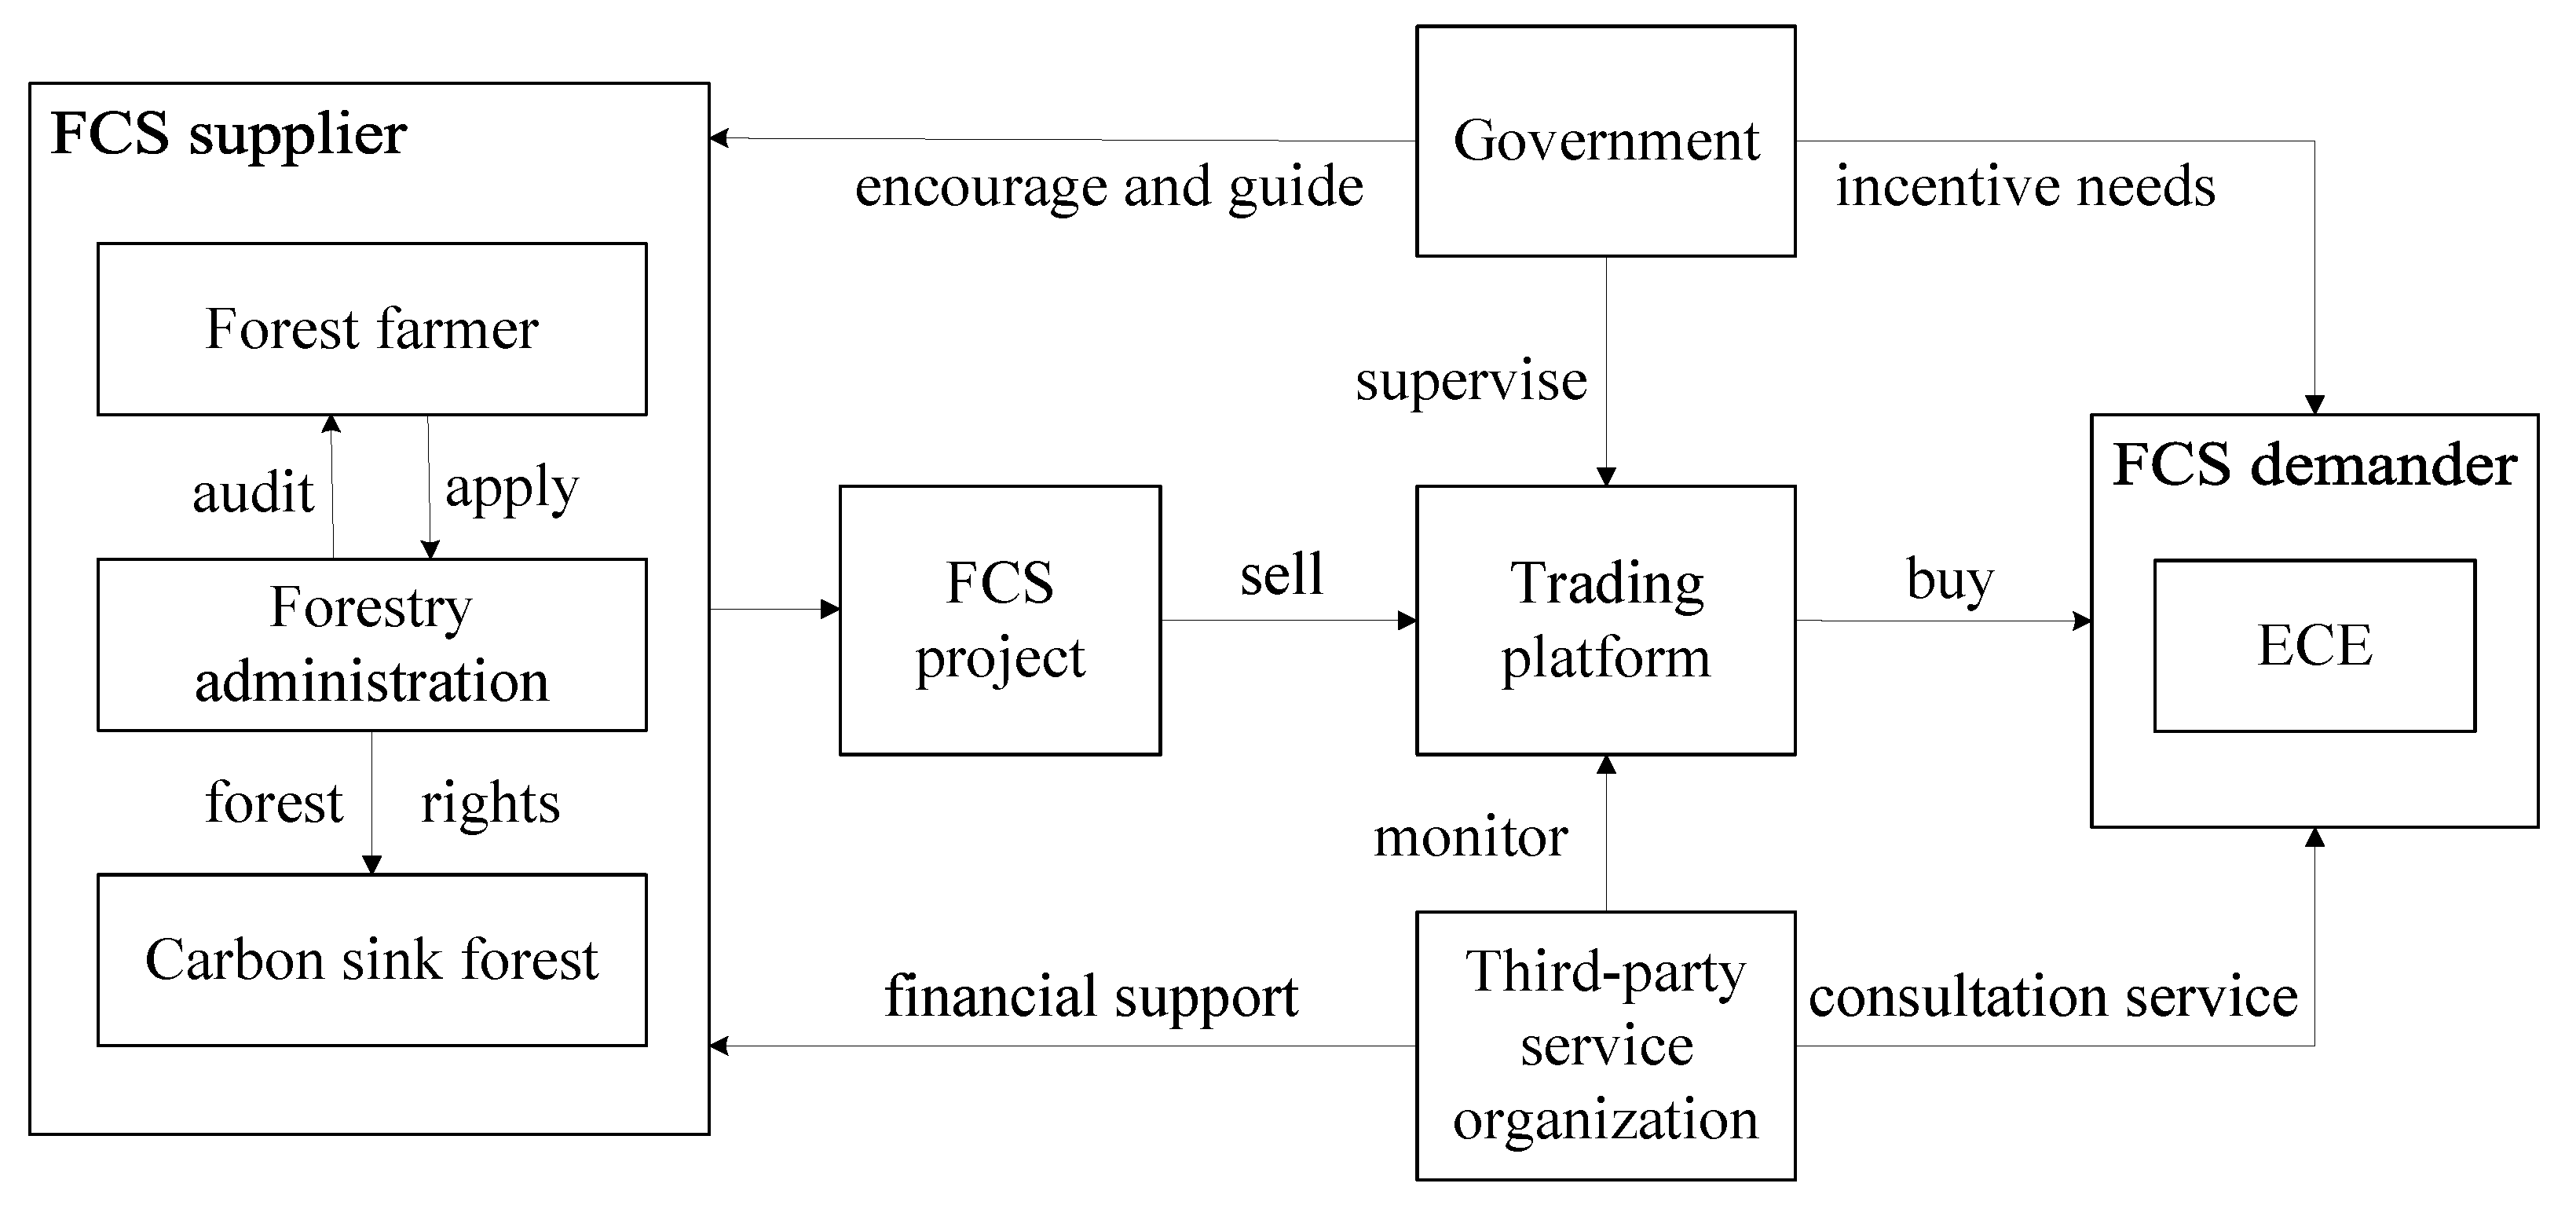
2.1. Problem Description
2.2. Assumptions and Model Parameters
- (1)
- Forest farmers will not suffer losses when they do not participate in FCS projects, i.e., , where is the timber benefits, and is the tending and harvesting costs. FCS projects have high development costs which cannot be offset by the under-forest income, and the main purpose for forest farmers to participate in FCS projects is to obtain carbon sink benefits. Therefore, , where is the forest farmers’ benefit from the under-forest economy, and is the cost for forest farmers to carry out FCS projects. Carbon sink income, timber income, development cost, and felling cost are all calculated by the area of the forest. Natural and man-made risks are not considered.
- (2)
- ECEs will not reduce emissions voluntarily besides meeting the carbon quota requirements. According to the different purposes of the ECEs, this paper considers two types of demand: forced offsetting and speculation. Since the daily operating income of ECEs does not affect the analysis of the model, the game model only includes the benefits and costs associated with the purchase of FCS by ECEs. ECEs with excessive emissions will be fined at 3–5 times the average carbon market price, and the emission reduction cost of the offset mechanism is generally lower than the transaction price of carbon allowances. Therefore, it is assumed that ECEs are rational economic persons and operate normally so that no default behaviors will occur. It is assumed that the original intention of a company willing to purchase FCS is the low-cost nature of the offset mechanism. In terms of project types and geographical restrictions, each trading pilot in China is inclined to FCS projects. Therefore, compared with other offset projects, under the premise of a stable supply of FCS, ECEs will give priority to purchasing FCS. When FCS is not supplied or the supply is unstable, ECEs will choose to purchase certified emission reductions from other offset projects.
- (3)
- The development cost of FCS projects is high, and the supporting funds are insufficient. Therefore, it is assumed that in the early development of the forestry carbon neutralization mechanism, government subsidies will be invested effectively in the construction of information technology talent teams to increase the carbon sequestration capacity of forests. In addition, the government needs to bear the resulting loss , which is high if the government does not provide sufficient support leading to forest farmers not participating in FCS projects.
- Re:
- the ecological benefits obtained by the government when the forest farmer participates in the FCS project;
- Rs:
- the social benefits obtained by the government when the forest farmer participates in the FCS project;
- Ri:
- other related benefits such as stable employment obtained by the government when forest farmers choose to carry out forestry activities such as wood products;
- Rf:
- the benefit of forest farmers from the under-forest economy;
- Rw:
- the timber benefits for forest farmers who do not participate in FCS projects;
- Rv:
- the income from ECEs purchasing FCS for speculation;
- Cw:
- the tending and harvesting costs when forest farmers do not participate in FCS projects;
- Cb:
- the cost for forest farmers to carry out FCS projects;
- Cf:
- the cost for ECEs to meet the carbon quota requirements by purchasing FCS, which is also the income of forest farmers from carbon sinks;
- Ct:
- the cost of emission reduction through technology when ECEs purchase FCS;
- C′w:
- the cost for ECEs not to purchase FCS and to rely solely on technical emission reduction to meet carbon quota requirements;
- Ce:
- the cost of other offset methods chosen by ECEs under the condition of stable supply of FCS, ;
- Cg:
- the fixed costs for the government to support FCS;
- Cs:
- related losses caused by project stagnation or regression when both the government and forest farmers do not care about the forest development and management;
- M:
- the financial subsidies that ECEs can obtain by purchasing FCS;
- Pf:
- the unit price of FCS;
- Pe:
- the unit price of other carbon sink products;
- T:
- the unit cost of technical emission reduction of ECEs;
- Ẽ:
- carbon quotas for ECEs;
- θ:
- the proportion of the offset by the ECE;
- x:
- the probability that the government chooses to support the FCS project;
- y:
- the probability that ECEs choose to purchase the FCS;
- z:
- the probability that forest farmers choose to participate in the FCS project;
- α:
- the probability that ECEs choose to offset when they purchase FCS;
- ζ:
- the influence coefficient of the speculative behavior of ECEs on the carbon trading market;
- λ:
- the influence coefficient of the government’s lack of support for forest management;
- φ:
- the proportion of government subsidies for FCS project costs.
3. The Model
3.1. Construction of the Game Matrix
3.2. Solution and Discrimination of Equilibrium Point
- (1)
- Replicator dynamics equation of the government
- (2)
- Replicator dynamics equation of the ECE
- (3)
- Replicator dynamics equation of the forest farmer
4. Analysis of Equilibrium State and Stability Strategy of Evolutionary Game
4.1. Stability Analysis in the Early Stage of Development of Forestry Carbon Neutralization Mechanism
4.1.1. The Stable State of Market Equilibrium in the Early Stage of Forestry Carbon Neutralization Mechanism Development
4.1.2. The Stable State of Market Imbalance in the Early Stage of Forestry Carbon Neutralization Mechanism Development
- (1)
- The reason for the steady state of oversupply
- 1.
- Increase M and , where , , so ;
- 2.
- Adjust subsidies appropriately for forest farmers and transfer them to subsidies for ECEs to increase the endogenous power of forest farmers and reduce the financial burden of the government.
- (2)
- The reason for the steady state of short supply
4.2. Stability Analysis in the Later Stage of Development of Forestry Carbon Neutralization Mechanism
4.2.1. The Stable State of Market Equilibrium in the Later Stage of Forestry Carbon Neutralization Mechanism Development
4.2.2. The Stable State of Market Imbalance in the Later Stage of Forestry Carbon Neutralization Mechanism Development
5. A Numerical Example
5.1. Background
5.2. Stability Analysis
5.2.1. Market Equilibrium in the Early Stage of Forestry Carbon Neutralization Mechanism Development
- (1)
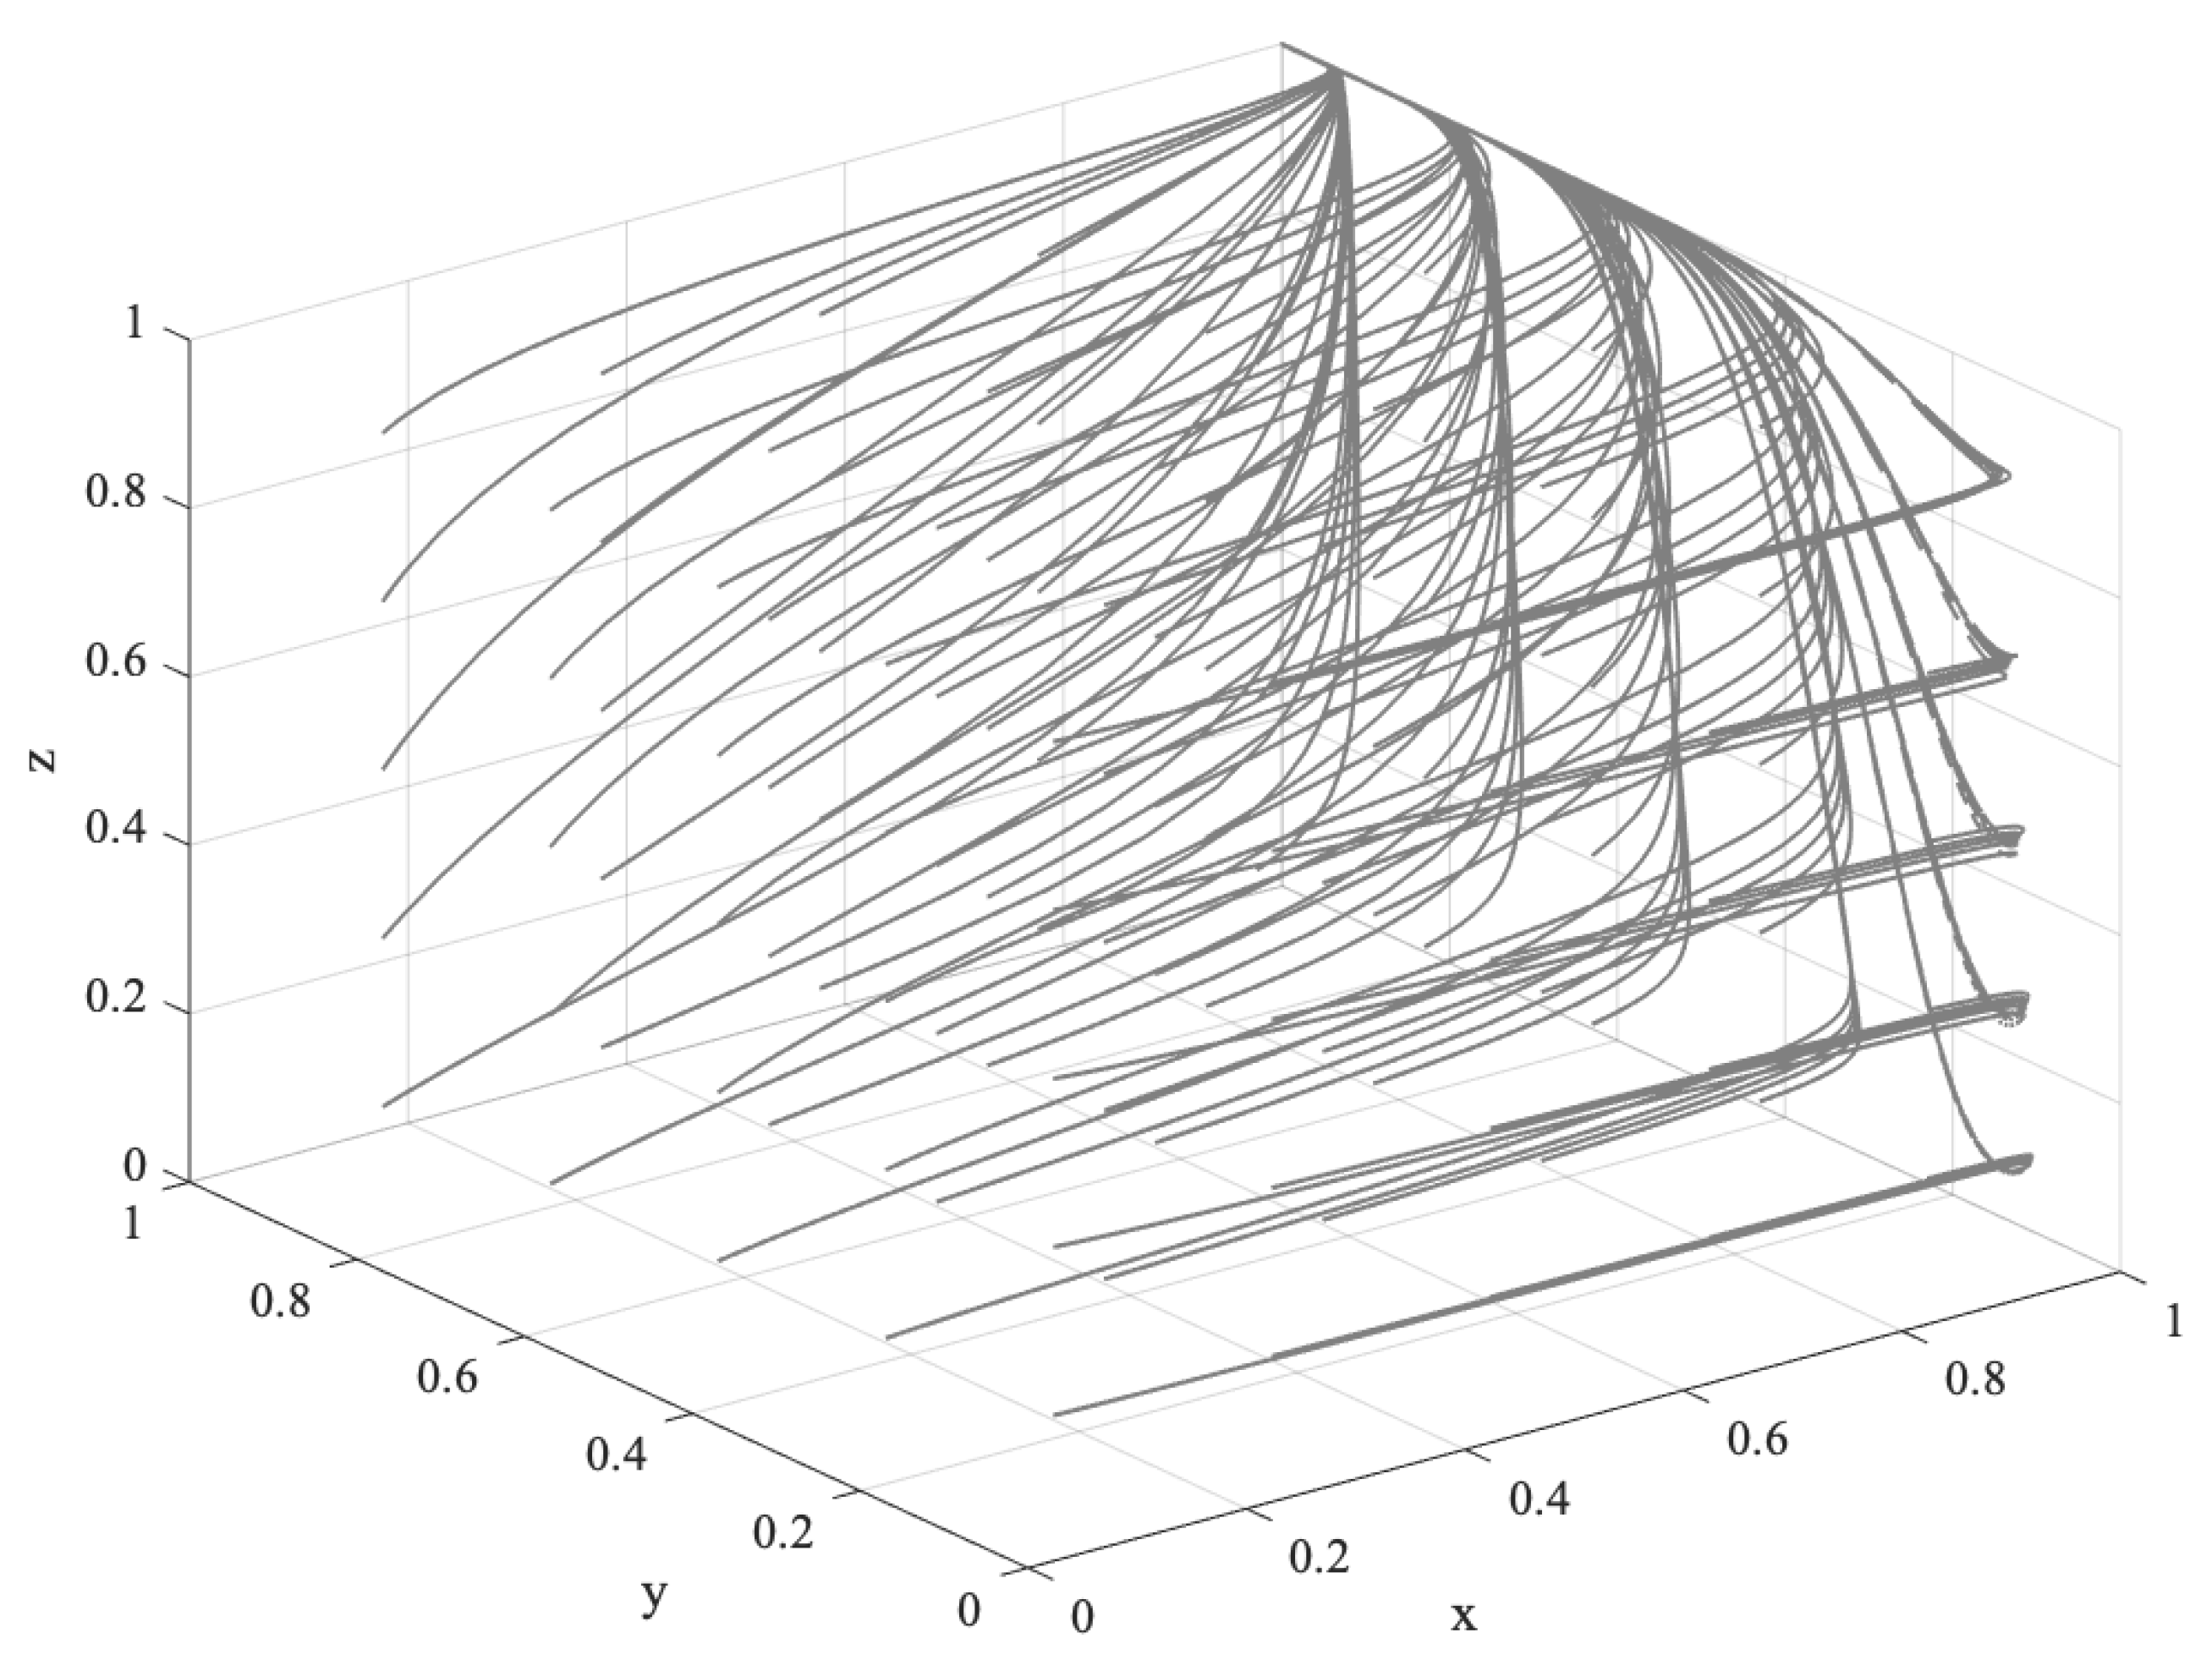
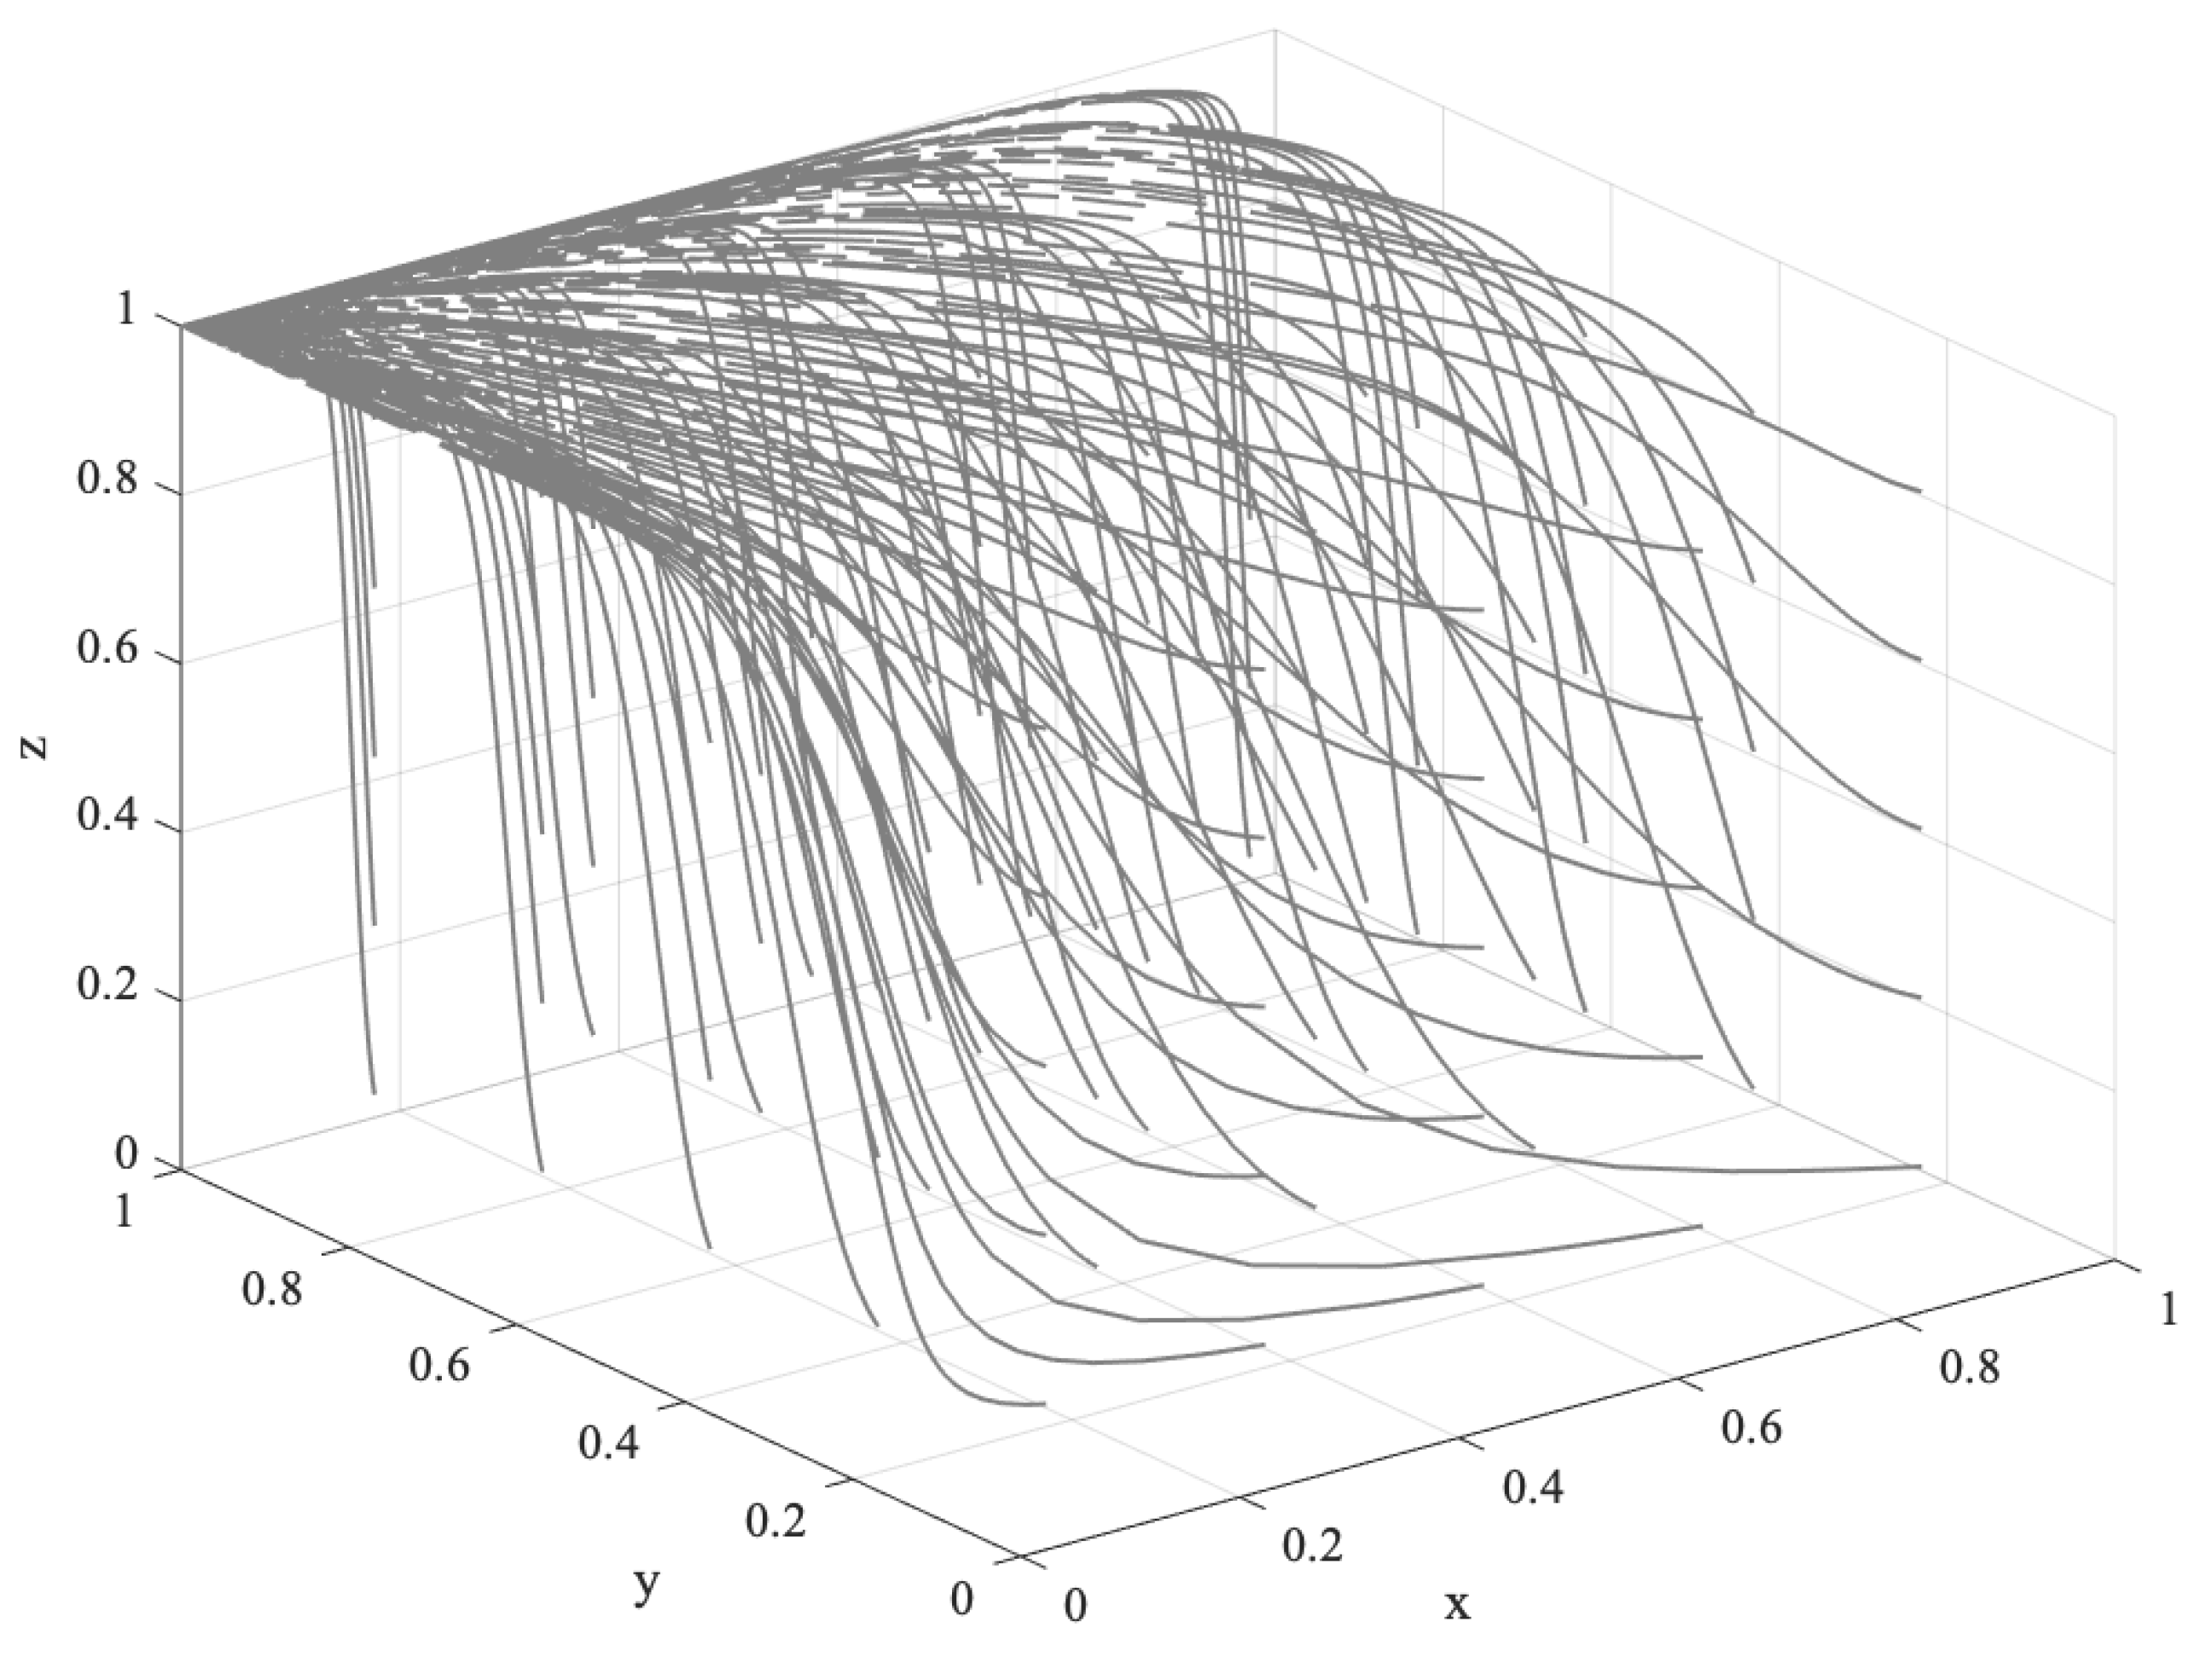
- When the income from speculation is higher than the income from offsetting, the FCS price is on the rise, and speculation will be profitable, which means and . At this time, the cost of ECEs to purchase FCS is lower than the cost of technical emission reduction, i.e., . ECEs have a high probability of purchasing FCS for speculation. The speculative behavior will stimulate market vitality, so . In the case of a stable supply of FCS, the cost of purchasing FCS is lower than the cost of purchasing other carbon sequestration products . Therefore, let billion, million, billion, , and . The evolution track of the system is shown in Figure 4. After repeated decision making and evolution, the behaviors of the government, ECEs, and forest farmers tend to “support”, “purchase”, and “participate”, respectively.
- (2)
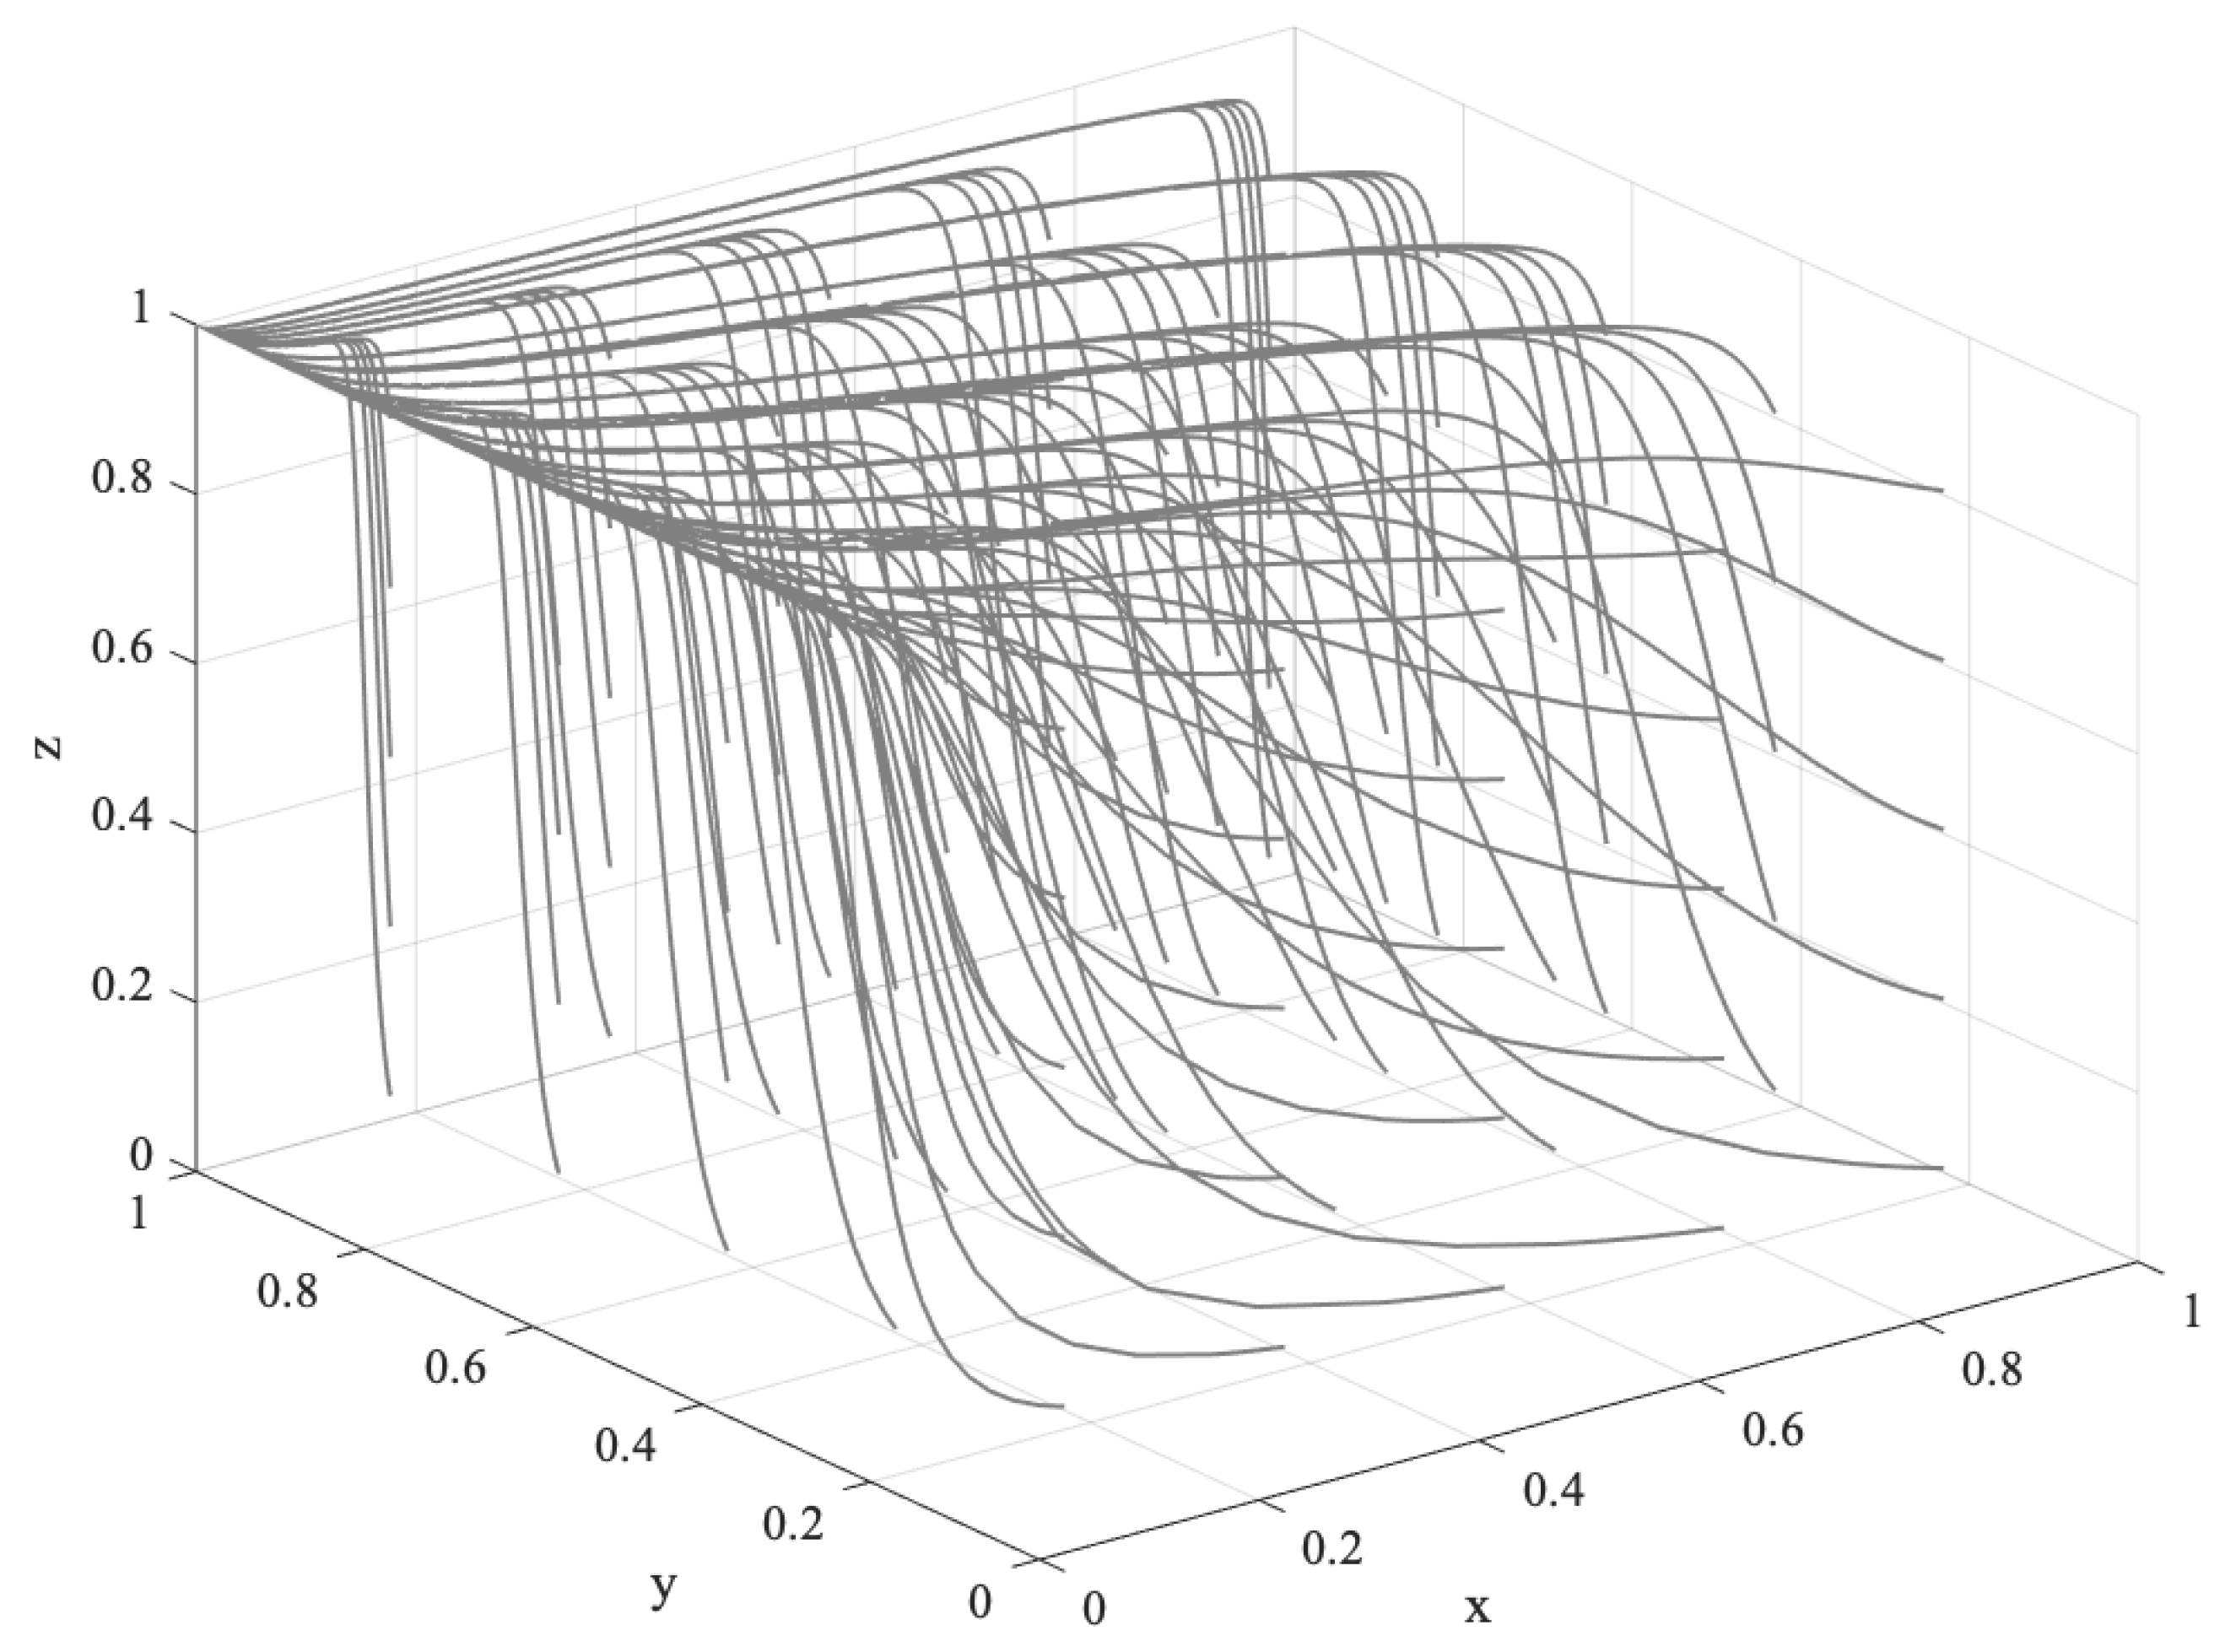
- When the offsetting income is higher than the speculative income, the FCS price is in decline, and speculation falls, which means and . At this time, the cost of ECEs to purchase FCS is lower than the cost of technical emission reduction, i.e., . ECEs have a high probability of purchasing FCS for offset, and speculation will affect the carbon trading market adversely, so . Therefore, let billion, million, billion, , and . The evolution track of the system is shown in Figure 5. After repeated decision making and long-term evolution, the behaviors of the government, ECEs, and forest farmers tend to “support”, “purchase”, and “participate”.
5.2.2. Market Equilibrium in the Later Stage of Forestry Carbon Neutralization Mechanism Development
- (1)
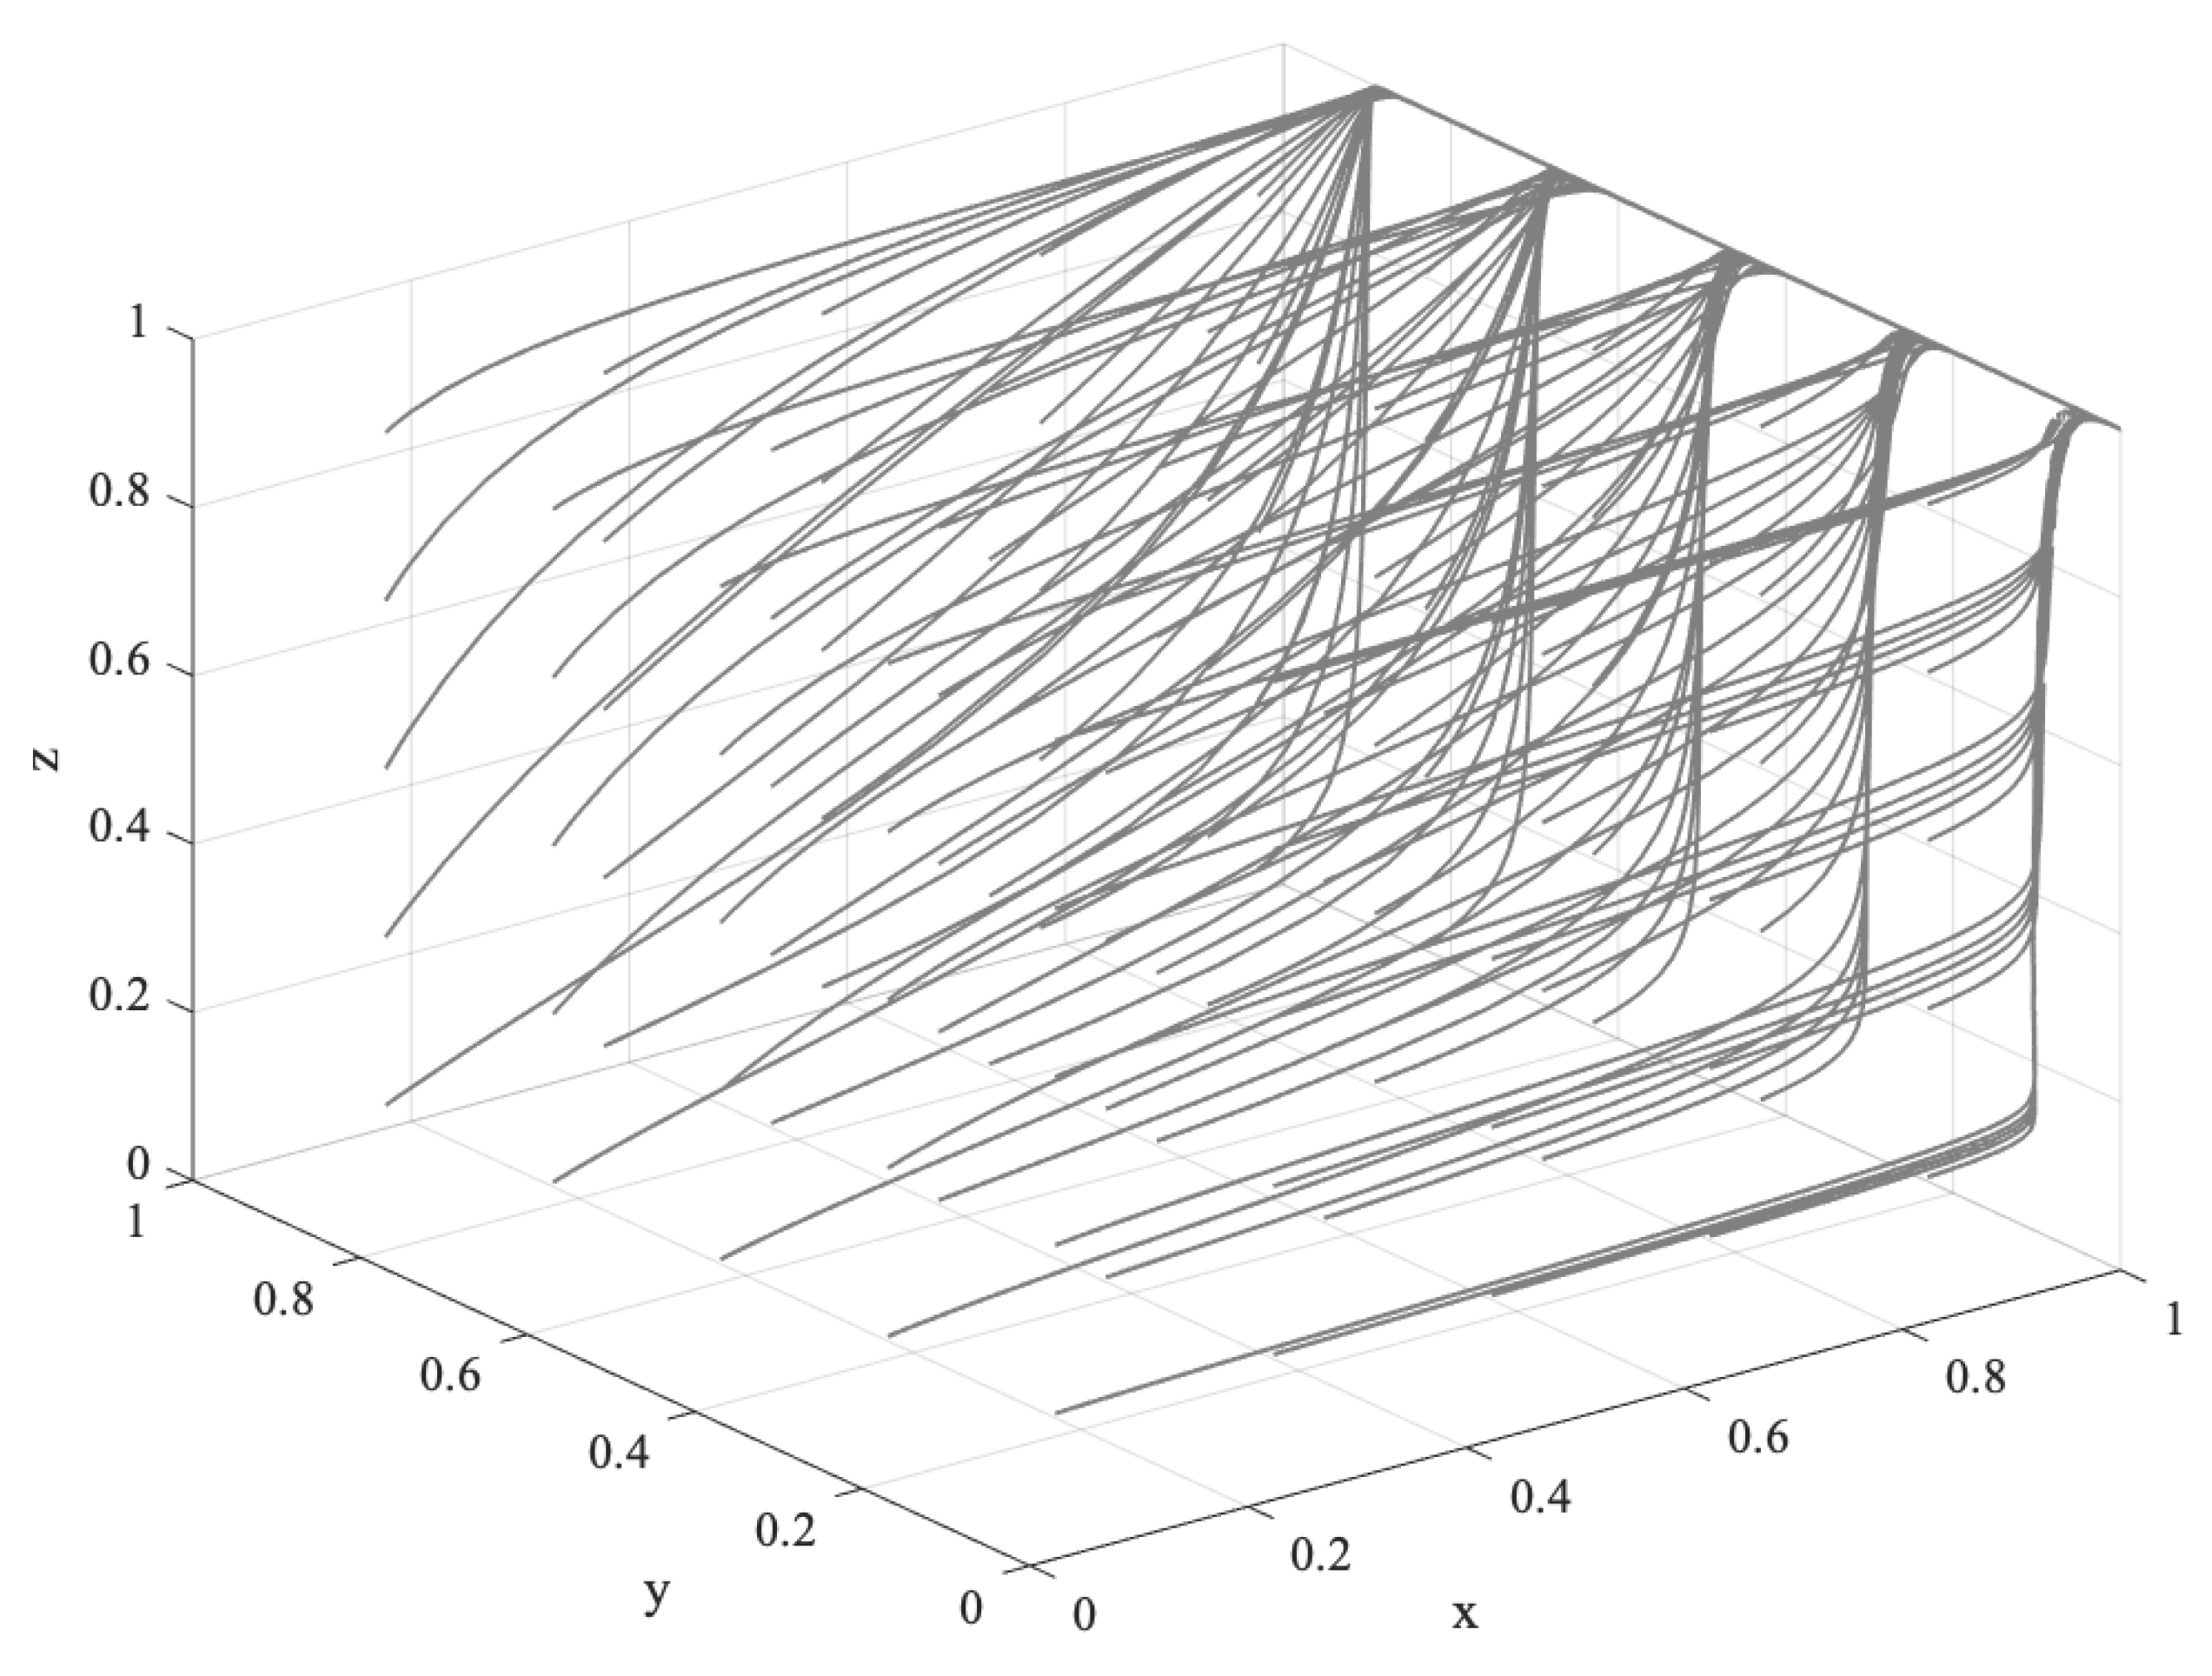
- When the speculative income is higher than the offsetting income, the FCS price is on the rise, and speculation can be profitable, which means and . At this time, the cost of ECEs to purchase FCS is lower than the cost of technical emission reduction, i.e., . ECEs have a high probability of purchasing FCS for speculation, and speculation will stimulate market vitality, so . In the case of a stable supply of FCS, the cost of purchasing FCS is lower than the cost of purchasing other carbon sequestration products . Therefore, let million, billion, , and . The evolution track of the system is shown in Figure 6. After repeated decision making and long-term evolution, the behaviors of the government, ECEs, and forest farmers tend to “not support”, “purchase”, and “participate”.
- (2)
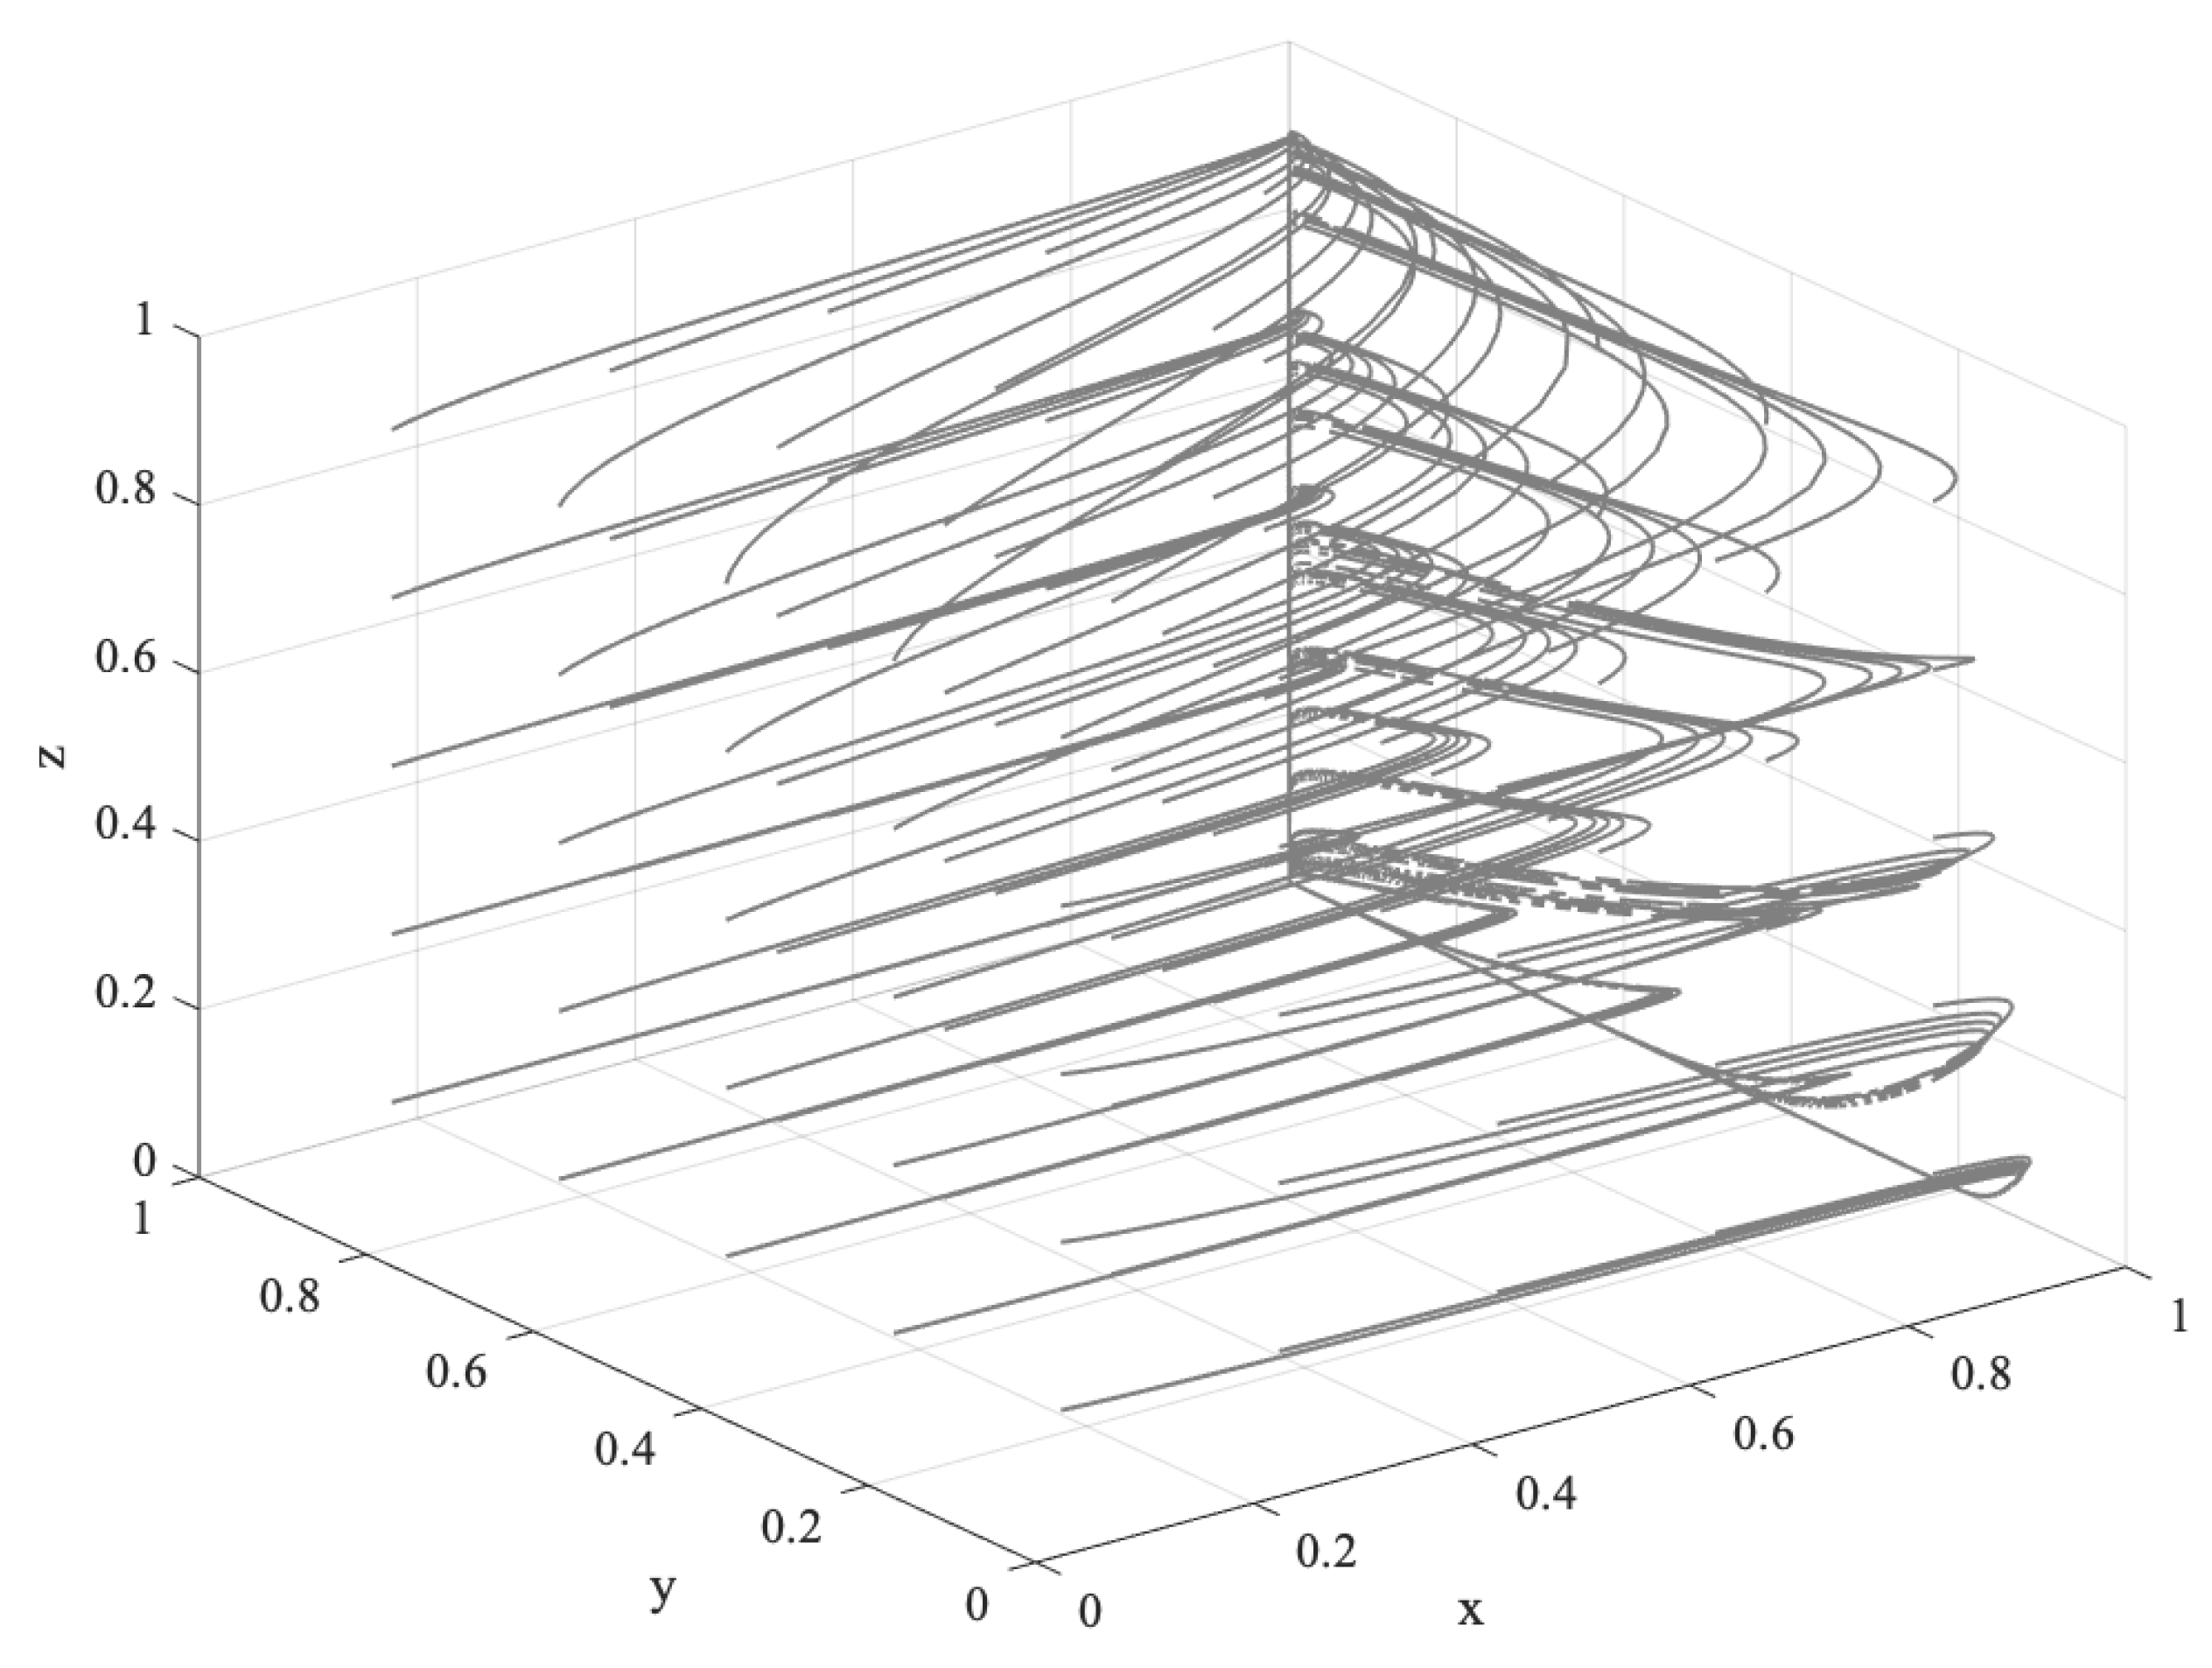
- When the offsetting income is higher than the speculative income, the FCS price is in decline, and speculation falls, which means and . At this time, the cost of ECEs to purchase FCS is lower than the cost of technical emission reduction, i.e., . ECEs have a high probability of purchasing FCS for offset, and speculation will affect the carbon trading market adversely, so . Therefore, let billion, billion, , and . The evolution track of the system is shown in Figure 7. After repeated decision making and long-term evolution, the behaviors of the government, ECEs, and forest farmers tend to “not support”, “purchase”, and “participate”.
5.2.3. Market Imbalance with Oversupply
5.2.4. Market Imbalance in Short Supply
- (1)
- In the early stage of the development of forestry carbon neutralization mechanism
- (2)
- In the later stage of the development of forestry carbon neutralization mechanism
6. Discussion
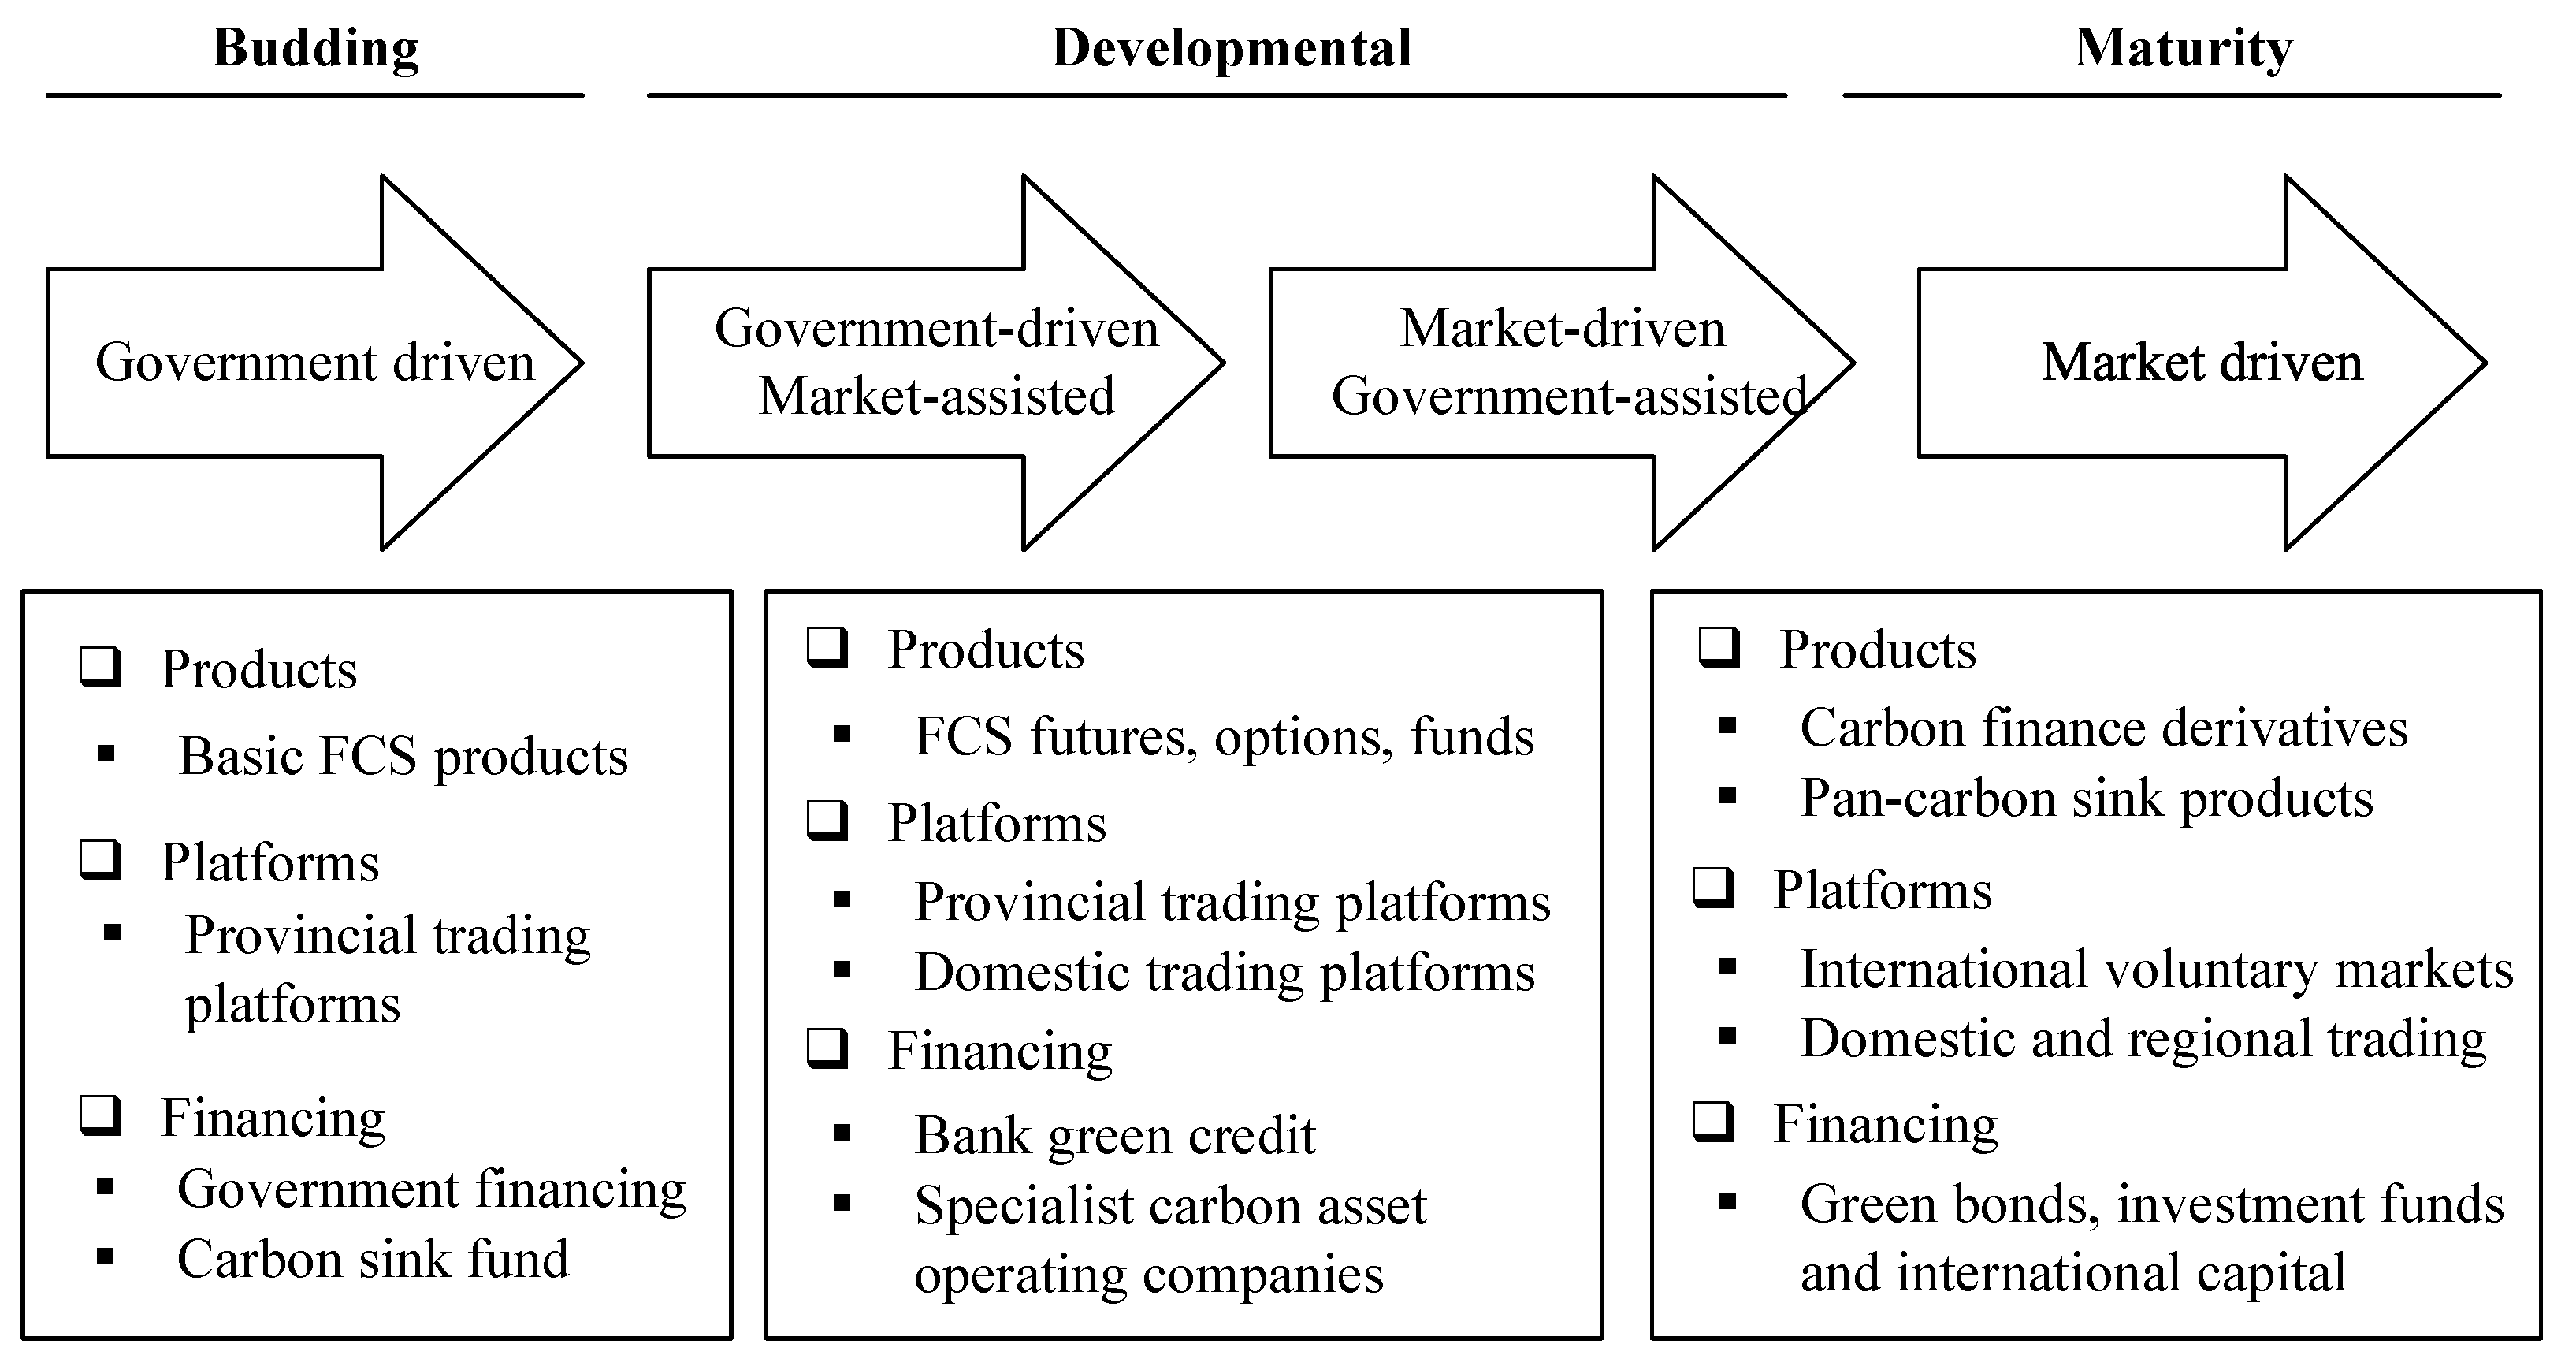
6.1. Transformation Conditions of Forestry Carbon Neutralization Mechanism from Early Stage to Later Stage
- (1)
- Supply side. With the reduction of government subsidies, the key to the transition from to is to increase FCS income , where . fluctuates with the spontaneous adjustment of the market and is jointly determined by both supply and demand. Moreover, not only affects directly but also affects indirectly through . Therefore, has the greatest impact.
- (2)
- Demand side. With the reduction of government subsidies, the key to the transition from to is to increase FCS income . , i.e., , where is the most important breakthrough, and its changes will affect T and .
6.2. Reasons for Imbalance in FCS Market
7. Conclusions and Policy Implications
- (1)
- The government plays a leading role in the early development of the forestry carbon neutralization mechanism, and market risk and project development are critical. The government’s incentive to participate plays an important role in the regulation of market behavior. Firstly, financial subsidies make up for some of the high development costs for forest farmers; purchasing FCS can obtain corresponding subsidies and positive external effects for ECEs. Secondly, the cost of purchasing FCS by ECEs is close to their technical emission reduction costs, which is a turning point in the market’s spontaneous adjustment. Therefore, at this stage, the government’s subsidies to ECEs have increased the purchase willingness of ECEs and the fluctuation range of the overall price of FCS.
- (2)
- The key to the transition of the forestry carbon neutralization mechanism from the early stage to the later stage is to increase the FCS income by adjusting the carbon quota policy. Tightening carbon quotas can increase the price of FCS indirectly; including more industries in the carbon trading system can increase the number of transactions directly. Therefore, reducing the government’s financial subsidies to forest farmers gradually is more efficient when implementing the above two carbon quota policies at the same time, and the best time to reduce financial subsidies to ECEs is when tightening the carbon allowance policy takes the lead. The market plays a leading role in the late stage of forestry carbon neutralization mechanism development, and market risk and operational risk are the keys. At this time, the price cap of FCS is only related to the emission reduction cost of ECEs.
- (3)
- The steady state of oversupply of FCS will occur only in the early stage. The essential reason for the oversupply is that the cost of ECEs purchasing FCS is higher than the cost of technical emission reduction. The reason for the shortage of supply in the early stage is the negative supply of forest farmers driven by profit. On the one hand, the financial subsidy is low; on the other hand, the demand and price are low, and participation has high transaction risks and operational risks due to the long-term cycle. In addition, it is difficult to guarantee the cost advantage of FCS compared with other carbon sink products when FCS cannot be supplied stably. The reason for the shortage of supply in the later stage is the relationship between the increase in carbon allowances and the reduction in ECEs purchase subsidies when more industries are included in carbon trading.
Author Contributions
Funding
Informed Consent Statement
Data Availability Statement
Acknowledgments
Conflicts of Interest
Appendix A. The Explanation of the Return Matrix
Appendix B. The Solutions of the Replicator Dynamics Equations
Appendix C. Proof of Propositions
Appendix C.1. Proof of Proposition 1
Appendix C.2. Proof of Proposition 2
Appendix C.3. Proof of Proposition 3
Appendix C.4. Proof of Proposition 4
Appendix C.5. Proof of Proposition 5
Appendix D. Case Background
References
- Wang, H. Research on theory and practice of forest ecological compensation. Nat. Resour. Econ. China 2019, 32, 25–33+51. [Google Scholar]
- Liu, C.M.; Sun, Z.; Zhang, J. Research on the effect of carbon emission reduction policy in China’s carbon emissions trading pilot. China Popul. Resour. Environ. 2019, 29, 49–58. [Google Scholar]
- Yu, X.Y.; Chen, H.Y.; Li, Y. Impact of carbon emission trading mechanism on carbon performance based on synthetic control method. China Popul. Resour. Environ. 2021, 31, 51–61. [Google Scholar]
- Böhringer, C.; Schneider, J.; Asane-Otoo, E. Trade in carbon and carbon tariffs. Environ. Resour. Econ. 2021, 78, 669–708. [Google Scholar] [CrossRef]
- Qi, S.Z.; Zhou, C.B.; Li, K.; Tang, S.Y. Influence of a pilot carbon trading policy on enterprises’ low-carbon innovation in China. Clim. Policy 2021, 21, 318–336. [Google Scholar] [CrossRef]
- Ding, Y.; Li, F. Examining the effects of urbanization and industrialization on carbon dioxide emission: Evidence from China’s provincial regions. Energy 2017, 125, 533–542. [Google Scholar] [CrossRef]
- Seong-Hoon, C.; Juhee, L.; Roland, R.; Edward, Y.; Paul, A. Impact of market conditions on the effectiveness of payments for forest-based carbon sequestration. For. Policy Econ. 2018, 92, 33–42. [Google Scholar]
- Brienen, R.J.W.; Caldwell, L.; Duchesne, L.; Voelker, S.; Barichivich, J.; Baliva, M.; Ceccantini, G.; Filippo, A.D.; Helama, S.; Locosselli, G.M.; et al. Forest carbon sink neutralized by pervasive growth-lifespan trade-offs. Nat. Commun. 2020, 11, 4241. [Google Scholar] [CrossRef]
- Green, J.K.; Keenan, T.F. The limits of forest carbon sequestration. Science 2022, 376, 692–693. [Google Scholar] [CrossRef]
- Yang, B.W. Research on regulatory framework of agricultural and forestry carbon sink trading for ecological poverty alleviation in China under policy guidance. Agric. Econ. Manag. 2019, 3, 51–60. [Google Scholar]
- Lin, B.Q.; Ge, G.M. Carbon sinks and output of China’s forestry sector: An ecological economic development perspective. Sci. Total. Environ. 2019, 655, 1169–1180. [Google Scholar] [CrossRef] [PubMed]
- Sun, R.; He, D.Y.; Yan, J.J.; Tao, L. Mechanism analysis of applying blockchain technology to forestry carbon sink projects based on the differential game model. Sustainability 2021, 13, 11697. [Google Scholar] [CrossRef]
- Kooten, G.; Cornelis, G.; Maria, N.; Kimpton, B. Can carbon accounting promote economic development in forest-dependent, indigenous communities? For. Policy Econ. 2019, 100, 68–74. [Google Scholar] [CrossRef]
- Ojha, H.; Maraseni, T.; Nightingale, A.; Bhattarai, B.; Khatri, D. Rescuing forests from the carbon trap. For. Policy Econ. 2019, 101, 15–18. [Google Scholar] [CrossRef]
- Craig, L. Carbon sequestration due to commercial forestry: An equilibrium analysis. For. Prod. J. 2020, 70, 60–63. [Google Scholar]
- Kooten, V.; Cornelis, G. Forest carbon offsets and carbon emissions trading: Problems of contracting. For. Policy Econ. 2017, 75, 83–88. [Google Scholar] [CrossRef]
- Cao, X.L.; Zhang, Y.; Shi, X.L.; Wang, K. Research progress on optimal management of ecological compensation of forest carbon sequestration from perspective of carbon trading. Resour. Dev. Mark. 2017, 33, 430–435. [Google Scholar]
- Chen, L.R.; Zhu, Z.F.; Sheng, C.G.; Cao, Y.K. Study on the development mode of forestry carbon sink project based on supply perspective—Take forest management forestry carbon sink project in Tangwanghe, Yichun as an example. For. Resour. Manag. 2020, 68–74. [Google Scholar] [CrossRef]
- Gao, Q.Y.; Jin, T.; Gu, G.T.; Wu, W.G. Analysis on the types of forestry carbon sequestration projects and their development strategies. World For. Res. 2019, 32, 97–102. [Google Scholar]
- Yang, B.W. “Resource curse” or “institutional failure”? An analysis based on China’s forestry carbon sequestration and trading system. China Rural Surv. 2021, 5, 51–70. [Google Scholar]
- Wu, Y.Y.; Qi, J.; Xian, Q.; Chen, J.D. The carbon emission reduction effect of China’s carbon market—From the perspective of the coordination between market mechanism and administrative intervention. China Ind. Econ. 2021, 114–132. [Google Scholar] [CrossRef]
- Gerhard, W.; Anna, L.; Teppo, H.; Gun, L.; Liviu, N.; Erlend, N.; Sonia, Q.; Zuzana, S.; Cristina, S.; Ivana, Z. Forest ownership changes in Europe: State of knowledge and conceptual foundations. For. Policy Econ. 2019, 99, 9–20. [Google Scholar]
- Zhang, Y.Y.; Qi, H.B.; Xu, X.Y.; Long, F. Research on the Policy Combination Effect of the Demand Response of the Forestry Carbon Sink Market. Issues For. Econ. 2021, 41, 311–319. [Google Scholar]
- Pukkala, T. Calculating the additional carbon sequestration of finnish forestry. J. Sustain. For. 2020, 1–18. [Google Scholar] [CrossRef]
- Yao, R.F.; Bian, W.Y.; Fan, H.L.; Guan, J. Analysis on the evolution of provincial forest carbon sequestration efficiency in China. Issues For. Econ. 2021, 41, 51–59. [Google Scholar]
- Song, Z.L.; Liu, H.Y.; Strömberg, C.A.E.; Wang, H.L.; Wang, H.L.; Strong, P.G.; Yang, X.M.; Wu, Y.T. Contribution of forests to the carbon sink via biologically-mediated silicate weathering: A case study of China. Sci. Total Environ. 2018, 615, 1–8. [Google Scholar] [CrossRef]
- Magerl, A.; Matej, S.; Kaufmann, L.; Noë, J.L.; Erb, K.; Gingrich, S. Forest carbon sink in the U.S. (1870–2012) driven by substitution of forest ecosystem service flows. Resour. Conserv. Recycl. 2022, 176, 105927. [Google Scholar] [CrossRef]
- Merry, K.; Bettinger, P.; Siry, J.; McNulty, S.; Gavazzi, M. Forester preferences on revising silvics of North America: A survey of registered foresters in Four States. J. For. 2022, 120, 1–9. [Google Scholar] [CrossRef]
- White, A.E.; Lutz, D.A.; Howarth, R.B.; Soto, J.R. Small-scale forestry and carbon offset markets: An empirical study of Vermont Current Use forest landowner willingness to accept carbon credit programs. PLoS ONE 2018, 13, e0201967. [Google Scholar] [CrossRef]
- Khanal, P.N.; Grebner, D.L.; Straka, T.J.; Adams, D.C. Obstacles to participation in carbon sequestration for nonindustrial private forest landowners in the southern United States: A diffusion of innovations perspective. For. Policy Econ. 2019, 100, 95–101. [Google Scholar] [CrossRef]
- Jin, T.; Gao, Q.Y.; Cao, X.L.; Wu, W.G. Research on risk measurement and impact of forestry carbon sink project. Issues For. Econ. 2021, 41, 304–310. [Google Scholar]
- Zou, Y.Y.; Li, J.Q.; Qi, Y.N.; Gan, J.; Tian, G.S. Demand willingness and influencing factors of emission control enterprises for forest carbon sink in the context of carbon trade: Based on the theory of planned behavior. Sci. Silvae Sin. 2020, 56, 162–172. [Google Scholar]
- Qi, H.B.; Long, F. Mechanism and simulation of carbon emission control enterprises’ forestry carbon sequestration demand based on Bayesian Network. Resour. Sci. 2018, 40, 1822–1830. [Google Scholar]
- Li, G.Z. Research progress on forest ecological compensation. For. Econ. 2019, 2019, 32–40. [Google Scholar]
- Su, L.; Yuan, C.; Guan, J. Evolutionary game analysis of the supply stability of forestry carbon sequestration. Issues For. Econ. 2020, 40, 122–128. [Google Scholar]
- Chen, W.H.; Cao, Z.J.; Wang, X.W. Game analysis of government supervision and forest farmers’ behavior in forest carbon sequestration reserve. Probl. For. Econ. 2019, 39, 77–82. [Google Scholar]
- Wang, W.J.; Yao, Y.J. Emission reduction behaviors of local government and enterprises under carbon tax regulation. Res. Financ. Econ. Issues 2019, 39–46. [Google Scholar]
- Shi, L.; Tang, Y.H.; Zhang, J. Supply-demand analysis of the forest carbon sink market in China—Illustrated by the Guangdong Chimelong carbon sink afforestation project. Chin. J. Environ. Manag. 2017, 9, 104–110. [Google Scholar]
- Bastin, J.F.; Finegold, Y.; Garcia, C.; Mollicone, D.; Rezende, M.; Routh, D.; Zohner, C.M.; Crowther, T.W. The global tree restoration potential. Science 2019, 365, 76–79. [Google Scholar] [CrossRef]
- Lin, B.Q.; Ge, J.M. To harvest or not to harvest? Forest management as a trade-off between bioenergy production and carbon sink. J. Clean. Prod. 2020, 268, 122219. [Google Scholar] [CrossRef]
- Qin, H.Y.; Dong, L.B.; Huang, Y.L. Evaluating the effects of carbon prices on trade-offs between carbon and timber management objectives in forest spatial harvest scheduling problems: A case study from Northeast China. Forests 2017, 8, 43. [Google Scholar] [CrossRef]
- Ju, F.; Zhou, J.J.; Jiang, K. Evolution of stakeholders’ behavioral strategies in the ecological compensation mechanism for poverty alleviation. Resour. Conserv. Recycl. 2022, 176, 105915. [Google Scholar] [CrossRef]
- Sun, Y.; Li, H. Data mining for evaluating the ecological compensation, static and dynamic benefits of returning farmland to forest. Environ. Res. 2021, 201, 111524. [Google Scholar] [CrossRef] [PubMed]
- Deng, C.; Zhang, S.G.; Lu, Y.C.; Li, Q.F. Determining the ecological compensation standard based on forest multifunction evaluation and financial eet present value analysis: A case study in southwestern Guangxi, China. J. Sustain. For. 2020, 39, 730–749. [Google Scholar] [CrossRef]
- Lyapunov, A.M. The general problem of the stability of motion. Int. J. Control 1992, 55, 531–534. [Google Scholar] [CrossRef]
- Wang, X.X.; Huang, J.L.; Liu, H.D. Can China’s carbon trading policy help achieve Carbon Neutrality? - A study of policy effects from the Five-sphere Integrated Plan perspective. J. Environ. Manag. 2021, 305, 114357. [Google Scholar] [CrossRef]
- Xie, H.S.; He, Y.T.; He, Y.J. Forestry Carbon Sequestration Transaction in China: Current Situation, Problems and Policy Suggestions. J. For. Grassl. Policy 2021, 1, 1–9. [Google Scholar]
- Sun, R.; He, D.Y.; Su, H.L. Evolutionary game analysis of blockchain technology preventing supply chain financial risks. J. Theor. Appl. Electron. Commer. Res. 2021, 16, 2824–2842. [Google Scholar] [CrossRef]


| ECE | ||||||
| (y) | () | |||||
| () | () | |||||
| (x) | (z) | |||||
| G | ||||||
| O | F | |||||
| V | () | O | ||||
| E | R | |||||
| R | E | |||||
| N | () | (z) | S | |||
| M | T | |||||
| E | E | |||||
| N | () | R | ||||
| T | ||||||
| Equilibrium Point | Sign of | Sign of | Sign of | Judgement |
|---|---|---|---|---|
| + | + | − | SP | |
| − | + | U | SP | |
| + | − | U | SP | |
| U | U | + | UP | |
| U | + | U | UP | |
| − | − | + | SP | |
| + | U | U | UP | |
| − | − | − | ESS |
| Equilibrium Point | Sign of | Sign of | Sign of | Judgement |
|---|---|---|---|---|
| + | U | − | SP | |
| − | U | + | SP | |
| + | U | U | UP | |
| + | − | + | SP | |
| − | − | − | ESS | |
| − | U | + | SP | |
| U | + | U | UP | |
| U | + | − | SP |
| Equilibrium Point | Sign of | Sign of | Sign of | Judgement |
|---|---|---|---|---|
| + | + | − | SP | |
| − | + | − | SP | |
| + | − | − | SP | |
| U | U | + | UP | |
| U | U | + | UP | |
| − | − | − | ESS | |
| U | U | + | UP | |
| U | U | + | UP |
| Equilibrium Point | Sign of | Sign of | Sign of | Judgement |
|---|---|---|---|---|
| − | + | − | SP | |
| + | + | U | UP | |
| − | − | + | SP | |
| U | + | + | UP | |
| U | + | U | UP | |
| − | − | + | SP | |
| − | − | − | ESS | |
| + | − | − | SP |
| Equilibrium Point | Sign of | Sign of | Sign of | Judgement |
|---|---|---|---|---|
| − | + | − | SP | |
| + | + | U | UP | |
| − | − | − | ESS | |
| U | U | + | UP | |
| U | − | + | SP | |
| + | − | U | SP | |
| U | + | + | UP | |
| U | + | U | UP |
Publisher’s Note: MDPI stays neutral with regard to jurisdictional claims in published maps and institutional affiliations. |
© 2022 by the authors. Licensee MDPI, Basel, Switzerland. This article is an open access article distributed under the terms and conditions of the Creative Commons Attribution (CC BY) license (https://creativecommons.org/licenses/by/4.0/).
Share and Cite
Sun, R.; He, D.; Yan, J. Generation Mechanism of Supply and Demand Gap of Forestry Carbon Sequestration Based on Evolutionary Game: Findings from China. Forests 2022, 13, 1488. https://doi.org/10.3390/f13091488
Sun R, He D, Yan J. Generation Mechanism of Supply and Demand Gap of Forestry Carbon Sequestration Based on Evolutionary Game: Findings from China. Forests. 2022; 13(9):1488. https://doi.org/10.3390/f13091488
Chicago/Turabian StyleSun, Rui, Dayi He, and Jingjing Yan. 2022. "Generation Mechanism of Supply and Demand Gap of Forestry Carbon Sequestration Based on Evolutionary Game: Findings from China" Forests 13, no. 9: 1488. https://doi.org/10.3390/f13091488
APA StyleSun, R., He, D., & Yan, J. (2022). Generation Mechanism of Supply and Demand Gap of Forestry Carbon Sequestration Based on Evolutionary Game: Findings from China. Forests, 13(9), 1488. https://doi.org/10.3390/f13091488