Article

Dendroclimatological Analysis of Chinese Fir Using a Long-Term Provenance Trial in Southern China

1
State Key Laboratory of Tree Genetics and Breeding & Key Laboratory of Tree Breeding and Cultivation, National Forestry and Grassland Administration, Research Institute of Forestry, Chinese Academy of Forestry, Beijing 100091, China
2
Experimental Center of Subtropical Forestry, Chinese Academy of Forestry, Beijing 100091, China
3
Collaborative Innovation Center of Sustainable Forestry in Southern China, Nanjing Forestry University, Nanjing 210037, China
*
Author to whom correspondence should be addressed.
Forests 2022, 13(9), 1348; https://doi.org/10.3390/f13091348
Submission received: 22 June 2022 / Revised: 18 August 2022 / Accepted: 22 August 2022 / Published: 24 August 2022
(This article belongs to the Special Issue Long-Term Genetic Improvement and Molecular Breeding of Chinese Fir)

Abstract

:
The Chinese fir, Cunninghamia lanceolata (Lamb.) Hook, is an essential fast-growing timber species that is widely distributed in southern China, producing timber with high economic value. Understanding the climate sensitivity of the tree species and its intra-specific variation would help us to estimate the potential climatic adaptation of the Chinese fir. Consequently, we developed radial growth (tree-ring, earlywood and latewood width) and wood density (earlywood, latewood, minimum and maximum density) chronologies for the period 1981–2013 to evaluate whether Chinese fir provenances varied in their tree-ring characteristics and the strength of their responses to seasonal and monthly climate variables. The results showed that more climatic information was obtainable from the trees’ radial growth than from their wood densities. Moreover, the wood density variables provided additional information about seasonal precipitation, which could not be found in tree-ring widths. Specifically, radial growth was highly sensitive to spring and fall temperature, whereas the wood density (particularly that of maximum density) was mainly limited by spring precipitation. Importantly, each tree-ring chronology of Chinese fir provenances varied in the intensity of its response to climate variables, reflecting population acclimation via genetic adaptation or plasticity to local conditions. By providing a theoretical basis for the climate–growth relationships of Chinese fir provenance within a subtropical climate, one can evaluate future climate change impacts on forests and the feedback of forest systems.

1. Introduction

In the past, wood quality, productivity and resistance to diseases have been the main criteria for selecting suitable forest reproductive material [1]. One of the main objectives of breeding programs widely used in forestry is to select the most adaptable tree populations as quickly as possible rather than waiting for the results of genotype evaluation at maturity [2]. Hence, selection in tree breeding programs usually takes place long before rotation age to shorten the breeding cycle and maximize genetic gain per unit time [3]. Provenance trials, also known as common garden experiments, established for assessing the performance of genotypes from diverse origins [4,5], have long been an essential tool for improving forest genetics [4,5,6]. The geographical variation of a tree species’ performance can be understood through provenance experiments, from which the adaptability and productivity of trees within a certain region can be determined [3]. Moreover, in common garden experiments, it is also possible to evaluate which provenances of a given species are adapted to expected climate conditions by planting different provenances under similar climate conditions [7].
In terms of climatic changes projected for the 21st century, the climate influence on afforested trees is gaining increasing attention [8]. Previous studies have predicted that climate change will modify tree species’ growth, distribution, and productivity [9] and demonstrated that widespread forest maladaptation might occur over the next century [10]. Notably, recent climatic changes are occurring faster than tree populations can adjust naturally [11]. Adaptation to climate change is becoming increasingly significant for species provenance selection [5], as forests need to cope with adverse climatic conditions to ensure forest stability and productivity in the future. Therefore, the application of the reproductive material from populations (provenances) better suited to future climates has been advised as a means for minimization of the negative effects of changing climate [11].
Information about the sensitivity of trees to meteorological conditions can provide better insight into potential growth, aiding application of the most suitable reproductive material, increasing the sustainability of stands [11]. Tree-ring records are a valuable source of information to infer long-term growth and physiological changes over time [12]. Tree-ring research is a fundamental approach for building knowledge of the historical climate on tree growth and interpreting climate variability [13] owing to the rings’ high resolution, precise dating, and high sensitivity to environmental conditions at many locations [12,14]. The evaluation of individual tree-ring parameters (i.e., earlywood and latewood) as well as the wood density (i.e., minimum and maximum density) provides an insight into trees’ responses to different climate variables, encoding environmental information on an interannual scale [15,16].
In recent years, provenance trials have been revisited as the source of information on the adaptability of tree populations in the longer term [17,18]. Long-term common garden experiments utilizing tree-ring research can be used to study differences in growth performance and reaction to extreme drought events [9,19]. Indeed, long-term provenance trials have been used to study the effects of tree origin on climate–growth relationships [20,21,22]. Specifically, previous tree-ring research in the context of provenance trials has been conducted on economically productive conifer species [4,23], primarily focusing on the impacts of provenance origin on tree growth performance [24]. Recent studies have also identified increases in the dendrochronological potential of several species in subtropical and tropical regions of South America [22], representing a significant frontier in our understanding of climate–growth relationships [25].
Chinese fir (Cunninghamia lanceolata) is a fast-growing conifer species within its primary distribution range across southern China [26,27]. It is highly suited to afforestation in the subtropical region of China and its timber is economically valuable [26,27]. Previous genetic improvement programs for the Chinese fir have been carried out extensively since the 1970s in southern China via nationwide selection for provenance testing [28]. These programs were established to study the Chinese fir’s stability, productivity, wood properties and resistance to cold, drought and disease. On this basis, the Chinese fir has been divided into ten provenance zones [28]. The use of early provenance tests in assessing the adaptive potential of Chinese fir to growth conditions in southern China has been the subject of several studies [28]. While differences in the responses of seedlings and saplings among provenances are of great interest during the critical establishment stage, the climate response of adult trees is of equal economic importance [4]. Tree-ring data from long-term provenance experiments enable inter-annual growth variation and its determinants to be examined [19,29]. However, compared with the responses of many species’ provenances to climate that are well understood [7,20,30], the effects of local climatic conditions on the growth of Chinese fir provenances have been much less widely researched [31]. Comparative studies on the growth–climate relationships between range-core and range-edge provenances of Chinese fir (southern and northern edge, respectively) are scarce. The influence of climate at the scale of Chinese fir provenance zones requires further investigation.
Our aims were: (1) to establish various chronologies of radial growth and wood density for Chinese fir provenances in southern China, (2) to compare their main descriptive statistical characteristics, and (3) to further evaluate the main seasonal and monthly climatic factors affecting the radial growth and wood densities of the Chinese fir under a subtropical climate. Thus, by providing a theoretical basis for climate–growth relationships of Chinese fir provenance within a subtropical climate, our study will contribute to identifying information about how climatic variables have affected the performance of the Chinese fir.

2. Material and Methods

2.1. Plant Materials

The Chinese fir provenance data used in this study were obtained from a long-term provenance trial in Wuxuan County established in 1981 with 1-year-old seedlings. The trial was conducted in the center of Guangxi (23°42′ N, 109°50′ E) and initially incorporated 207 seed sources. Ten replicate plots (2 m × 2 m) with four plants per plot were established in a randomized block design. In addition, two rows of Chinese fir isolation zones (buffered plots) were set up around the test site. During the autumn of 2013, the trees were sampled at 33 years of age. Then, stem discs were cut from the trees’ breast height (1.3 m). The sample consisted of 52 geographic provenances and 614 discs at the experimental site (Figure 1, Table 1). The data from this provenance trial have already been analyzed for the growth–climate relationship using different tree ring indexes in [31] and was re-assessed for this study. In this study, the test provenances were grouped into eight regions based on their geographic and climatic profiles, which had previously been identified as regions of provenance for Chinese fir [28]. A more detailed overview of the background information for 52 Chinese fir provenances can be found in the Supporting Information Table S1.

2.2. Tree-Ring Chronology Development and Calculation of Statistical Parameters

We processed tree-ring samples with standard dendrochronological practices [12,32]. Tree-ring measurements were taken from a subset of 10 to 15 trees per provenance, and we extracted one or two series for each disk. The location for the series selected on the disks was entirely from the north or east direction. The visual assessment was combined with an algorithm implemented in Lignostation to detect tree rings [33,34,35]. Radial growths, including tree-ring width (TRW), earlywood width (EWW), and latewood width (LWW), were measured with a resolution of 0.01 mm. In addition, the relative wood density measurements, including the earlywood density (EWD), latewood density (LWD), minimum density (MIND), and maximum density (MAXD), were carried out for each disc via Lignostation™ high-frequency densitometry [33,34]. The method is based on the propagation of continuous electromagnetic waves in a high-frequency transmitter–receiver link of an extremely small electrode system [33], which is in direct contact with the wood surface investigated and utilizes the dielectric properties of wood to measure relative density variations along wood surfaces [34]. For our experiment, Lignostation was used to determine information about relative radial density variances of dry wood samples (stem disks) using high-frequency scanning of a probe with a very thin tip [36]. The ring widths and relative wood density measurements of the disks were carried out from pith to bark [34,36]. According to the Lignostation densitometry system, the earlywood/latewood border standard was set to a 50% grayscale difference [34,36]. MIND and MAXD corresponded to the lowest and highest density values along with the density profile of a tree ring, respectively.
To further ensure the accuracy of the results, a statistical evaluation of the cross-dating and quality control procedures was conducted using COFECHA software [35]. The effects of biological age and low-frequency information on the tree rings’ growth were detrended by fitting the ModHugershoff method and ModNegExp function to each width and density series [37]. Then, an autoregressive model was applied to remove autocorrelation, resulting in white-noise indices series. The tree-ring indices were averaged on a year-by-year basis using a bi-weight robust mean, which reduces variance and bias caused by extreme values. Finally, the resulting indices were averaged arithmetically into tree-ring chronologies, that is, time-series with annually dated tree-ring information. In this study, standard chronologies (detrended) and residual chronologies (detrended without autocorrelation) were obtained using the dplR package in R software [38].
Chronology descriptive statistics, including the Gini coefficient (gini.coef), mean interseries correlation (Rbar), the expressed population signal (EPS), the signal-to-noise ratio (SNR), and the first-order autocorrelation coefficient (AC1), were used to analyze the differences in climate-related growth responses and assess the chronologies’ reliability and quality [39]. Mean interseries correlation (Rbar) was the average correlation coefficient among all tree-ring series from different trees. The expressed population signal (EPS) measured the statistical quality of the mean site chronology compared with a perfect, infinitely replicated chronology [40]. The signal-to-noise ratio (SNR) measured the strength of the common high-frequency signal in a given variable of trees from the same site. The Gini coefficient (gini.coef) was a measure to demonstrate how data diversity can be summarized in a variable (width or density) of consecutive tree rings [41]. Finally, the first-order autocorrelation (AC1) measured the year-to-year growth or density correlation [12].

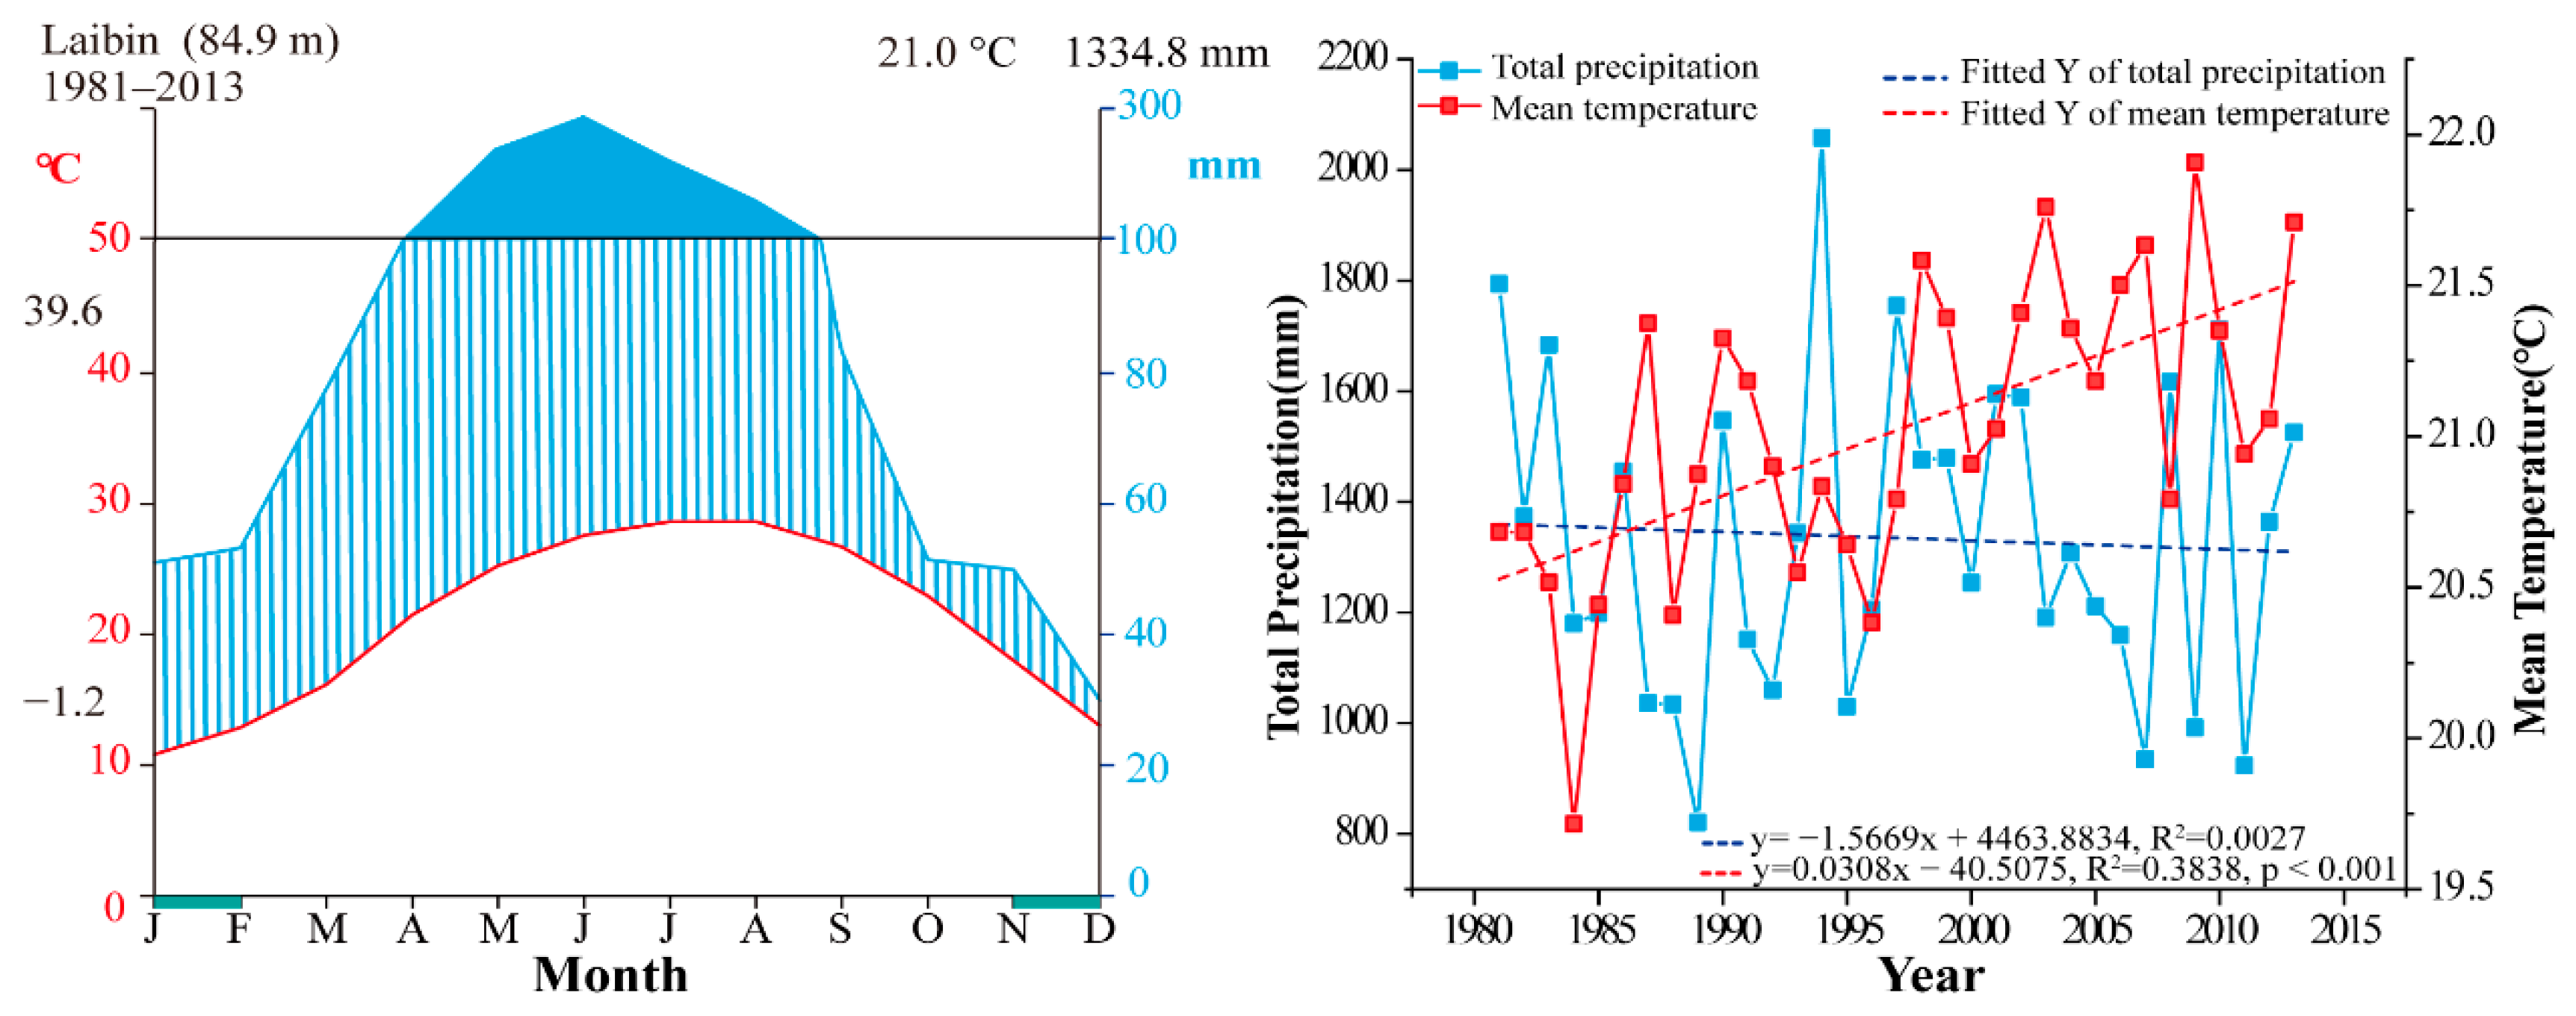
2.3. Meteorological Data

The climate variables were downloaded from the China National Meteorological Information Centre (http://www.cma.gov.cn/, accessed on 4 August 2015). The mean monthly temperature and monthly precipitation from 1981 to 2013 were acquired from the Laibin station in Guangxi, nearest the experimental site (Figure 2). According to this data, the average annual precipitation was 1334.8 mm, and the annual total precipitation ranged from 820.3 to 2057.3 mm. The mean annual temperature was 21.1 °C, the hottest month being August (33.6 °C) and the coldest, January (8.1 °C). Moreover, tree growth is affected by the surrounding environment, including soil properties, precipitation, temperature, solar radiation, and sunlight hours, among which temperature and precipitation are essential climate factors affecting tree growth and generally have a greater impact than the other factors. Since xylem formation at the beginning of the growing season in coniferous tree species depends on the carbohydrate reserves accumulated at the end of the previous year [12,42], we chose monthly temperature and precipitation data from the previous June to the current September in our analysis of the growth–climate relationship.

2.4. Statistical Analysis

All subsequent analyses were performed using R software, version 4.0.3 [43]. The growth–climate relationship was tested using the corr.test function of the psych package [44] to assess the Pearson correlation coefficients between the tree-ring chronologies (radial growth and wood density) and the seasonal (winter: previous December to current February grouping; spring: March to May; summer: June to August; and autumn: September to November) and monthly climate factors. Corrplot package (Version 0.84) [45] was used to make correlation graphs.

3. Results

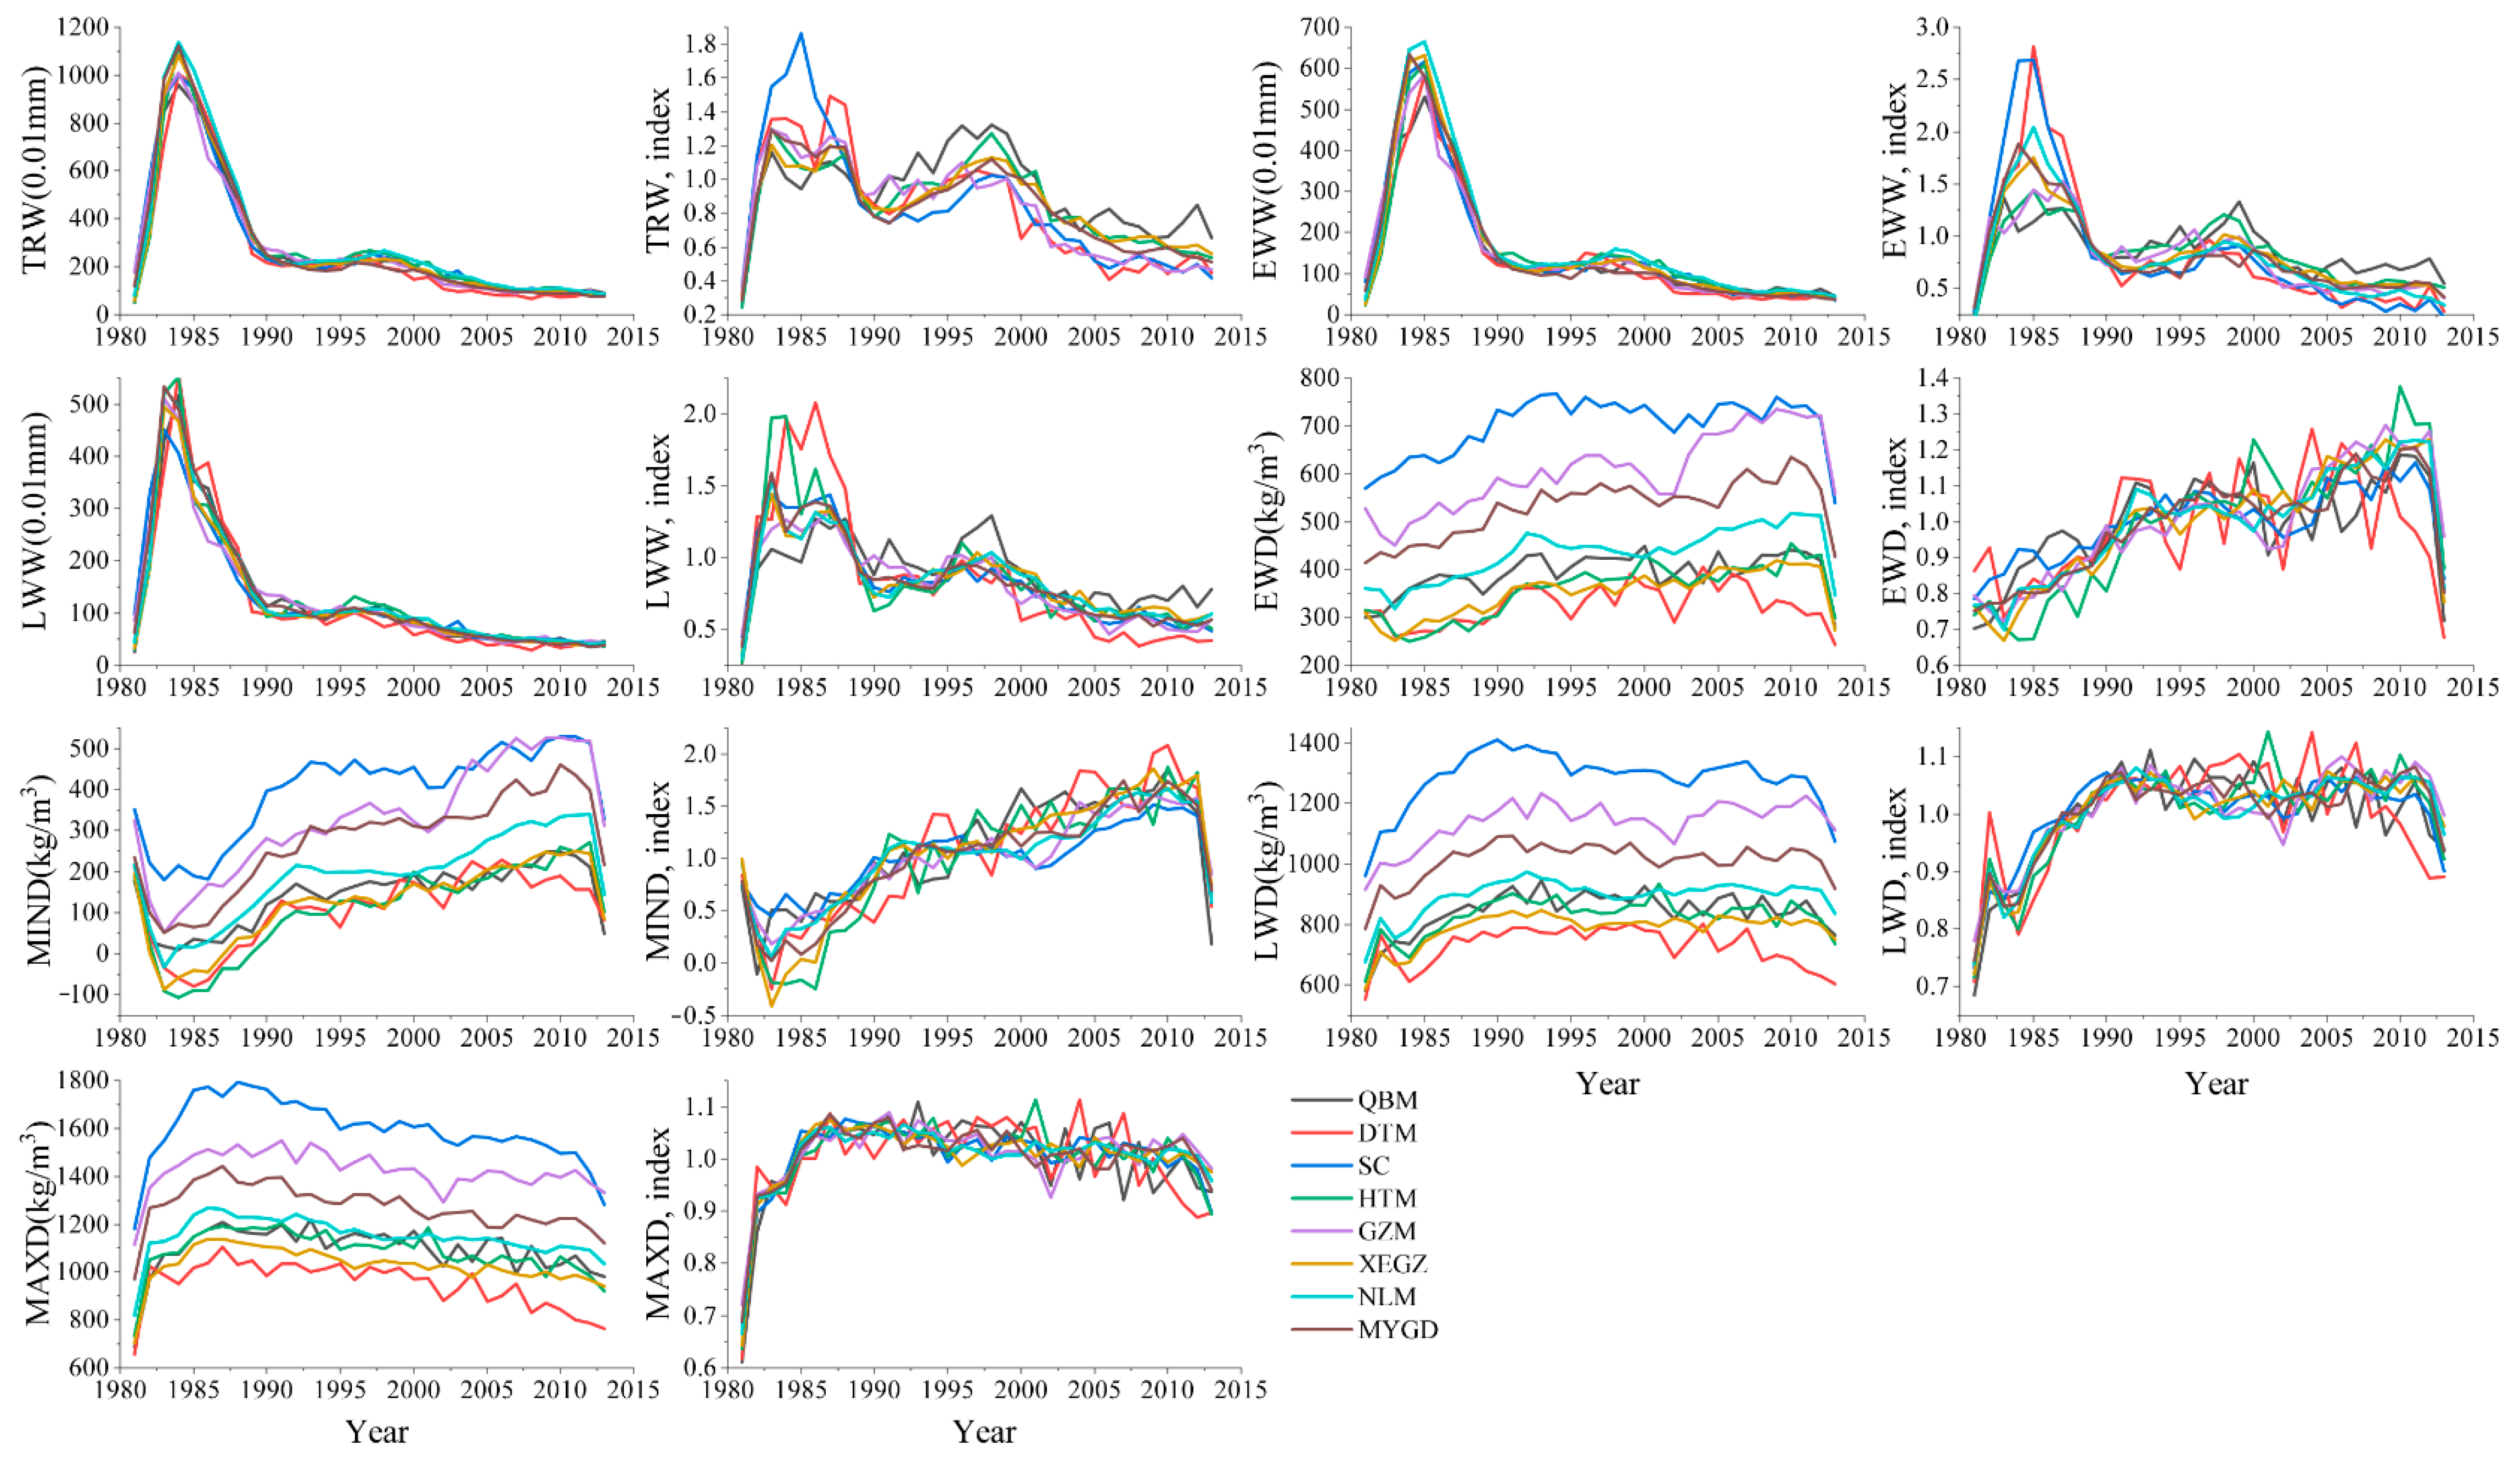
3.1. Width and Density Chronologies and General Features of Chronologies

The time-series of raw mean series measurements and indexed curves of tree-ring width and density chronologies performed on Chinese fir provenance disks are presented in Figure 3. Overall, NLM showed higher EWW and LWW, followed by XEGZ. Conversely, HTM presented the highest density values, whereas DTM showed the lowest width and density values.
On average, EWD showed the lowest expressed population signal (0.646–0.970), while TRW showed the highest one (0.861–0.988) (Table 2 and Table 3). Note that the highest EPS values for wood densities were observed for the NLM, while the lowest EPS values were observed for the HTM. The highest Gini coefficient was that of MIND, and MAXD recorded the lowest Gini coefficient value. The first-order autocorrelation coefficient was significantly higher in the case of seasonal width variables (TRW: 0.417–0.515; EWW: 0.308–0.473; LWW: 0.295–0.397) than in the case of density variables (EWD: 0.228–0.365; MIND: 0.381–0.512; LWD: 0.127–0.254; MAXD: 0.109–0.186).

3.2. Growth–Climate Relationships

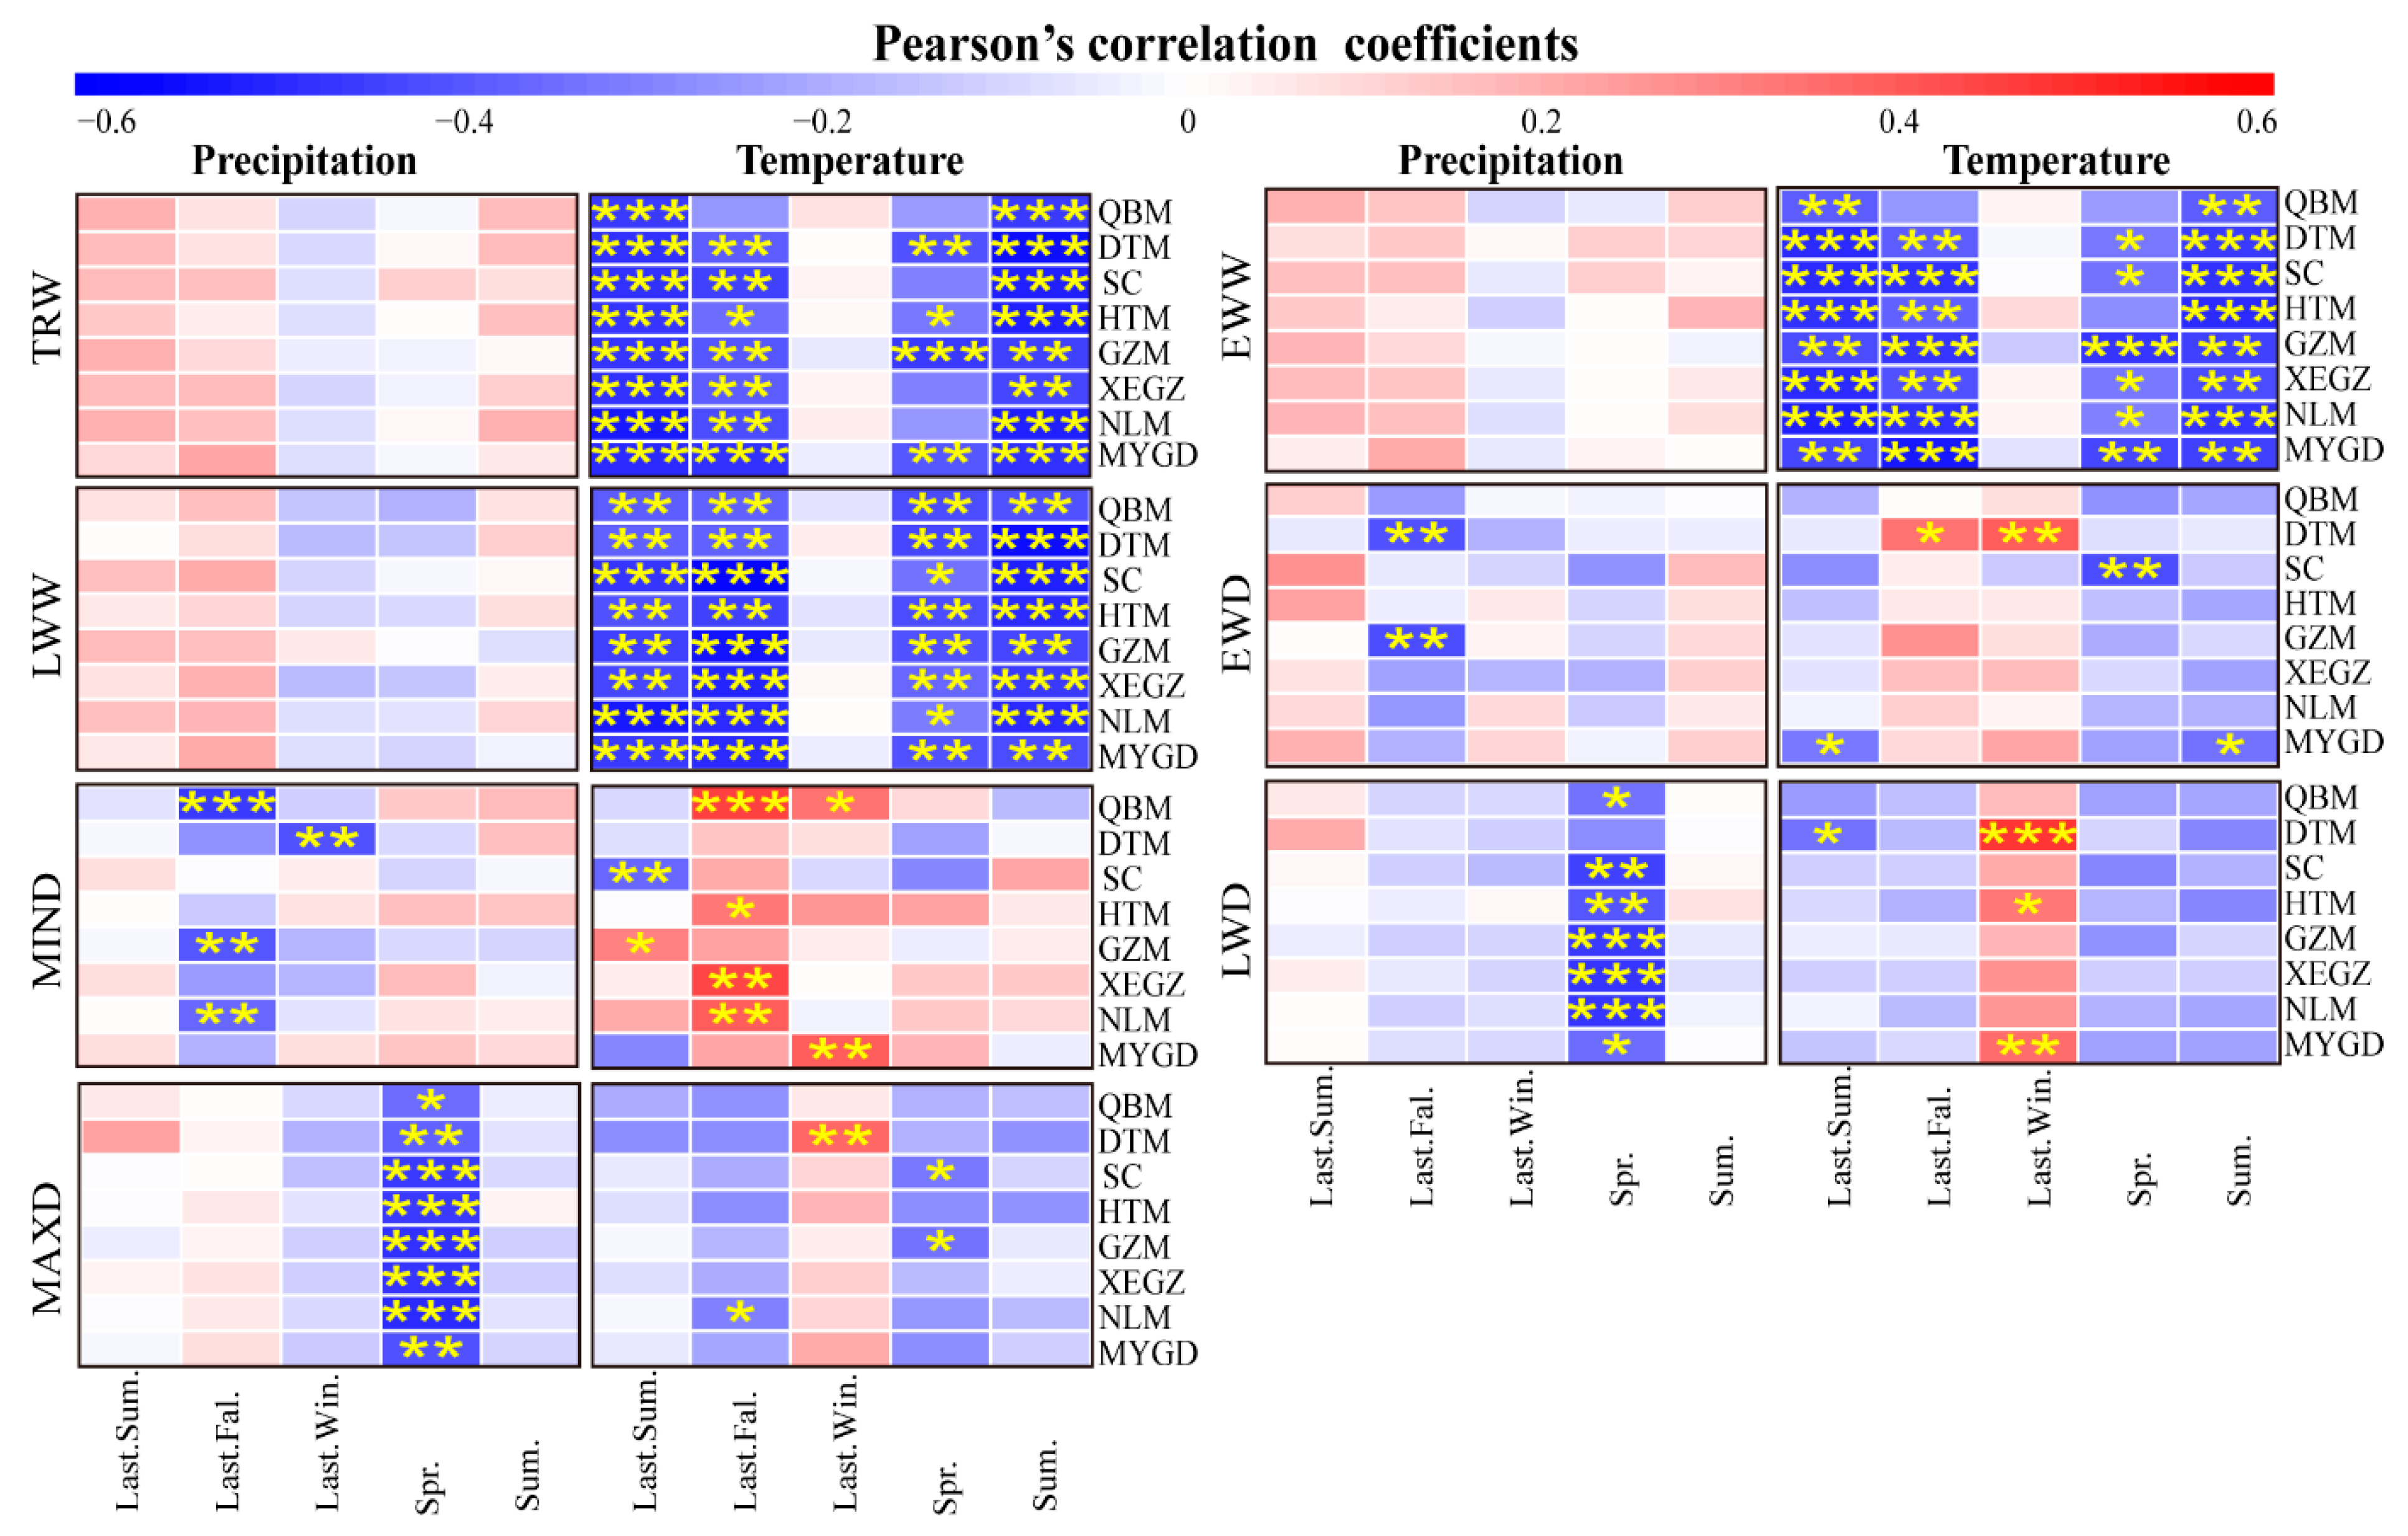
3.2.1. Relationships between Tree-Ring Chronologies and Seasonal Climate Factors

The response of Chinese fir radial growth and wood density to seasonal climate factors varied considerably (Figure 4). Radial growth was positively correlated with precipitation in summer and autumn for all regions, but the correlations were insignificant. There was also an insignificant negative correlation between radial growth and winter precipitation. On the contrary, the radial growth was highly negatively correlated with seasonal temperatures in summer, spring and fall for each width chronology; the winter temperature had a less negative or positive but non-significant association with the tree rings’ radial growth. Regarding responsiveness to EWD and MIND, autumn and winter temperatures promoted tree growth. For LWD and MAXD, the most significant inverse correlations with precipitation were those of the current spring for regional chronologies. The correlations with climatic factors for the areas of QBM and HTM were weaker than other provenance regions.

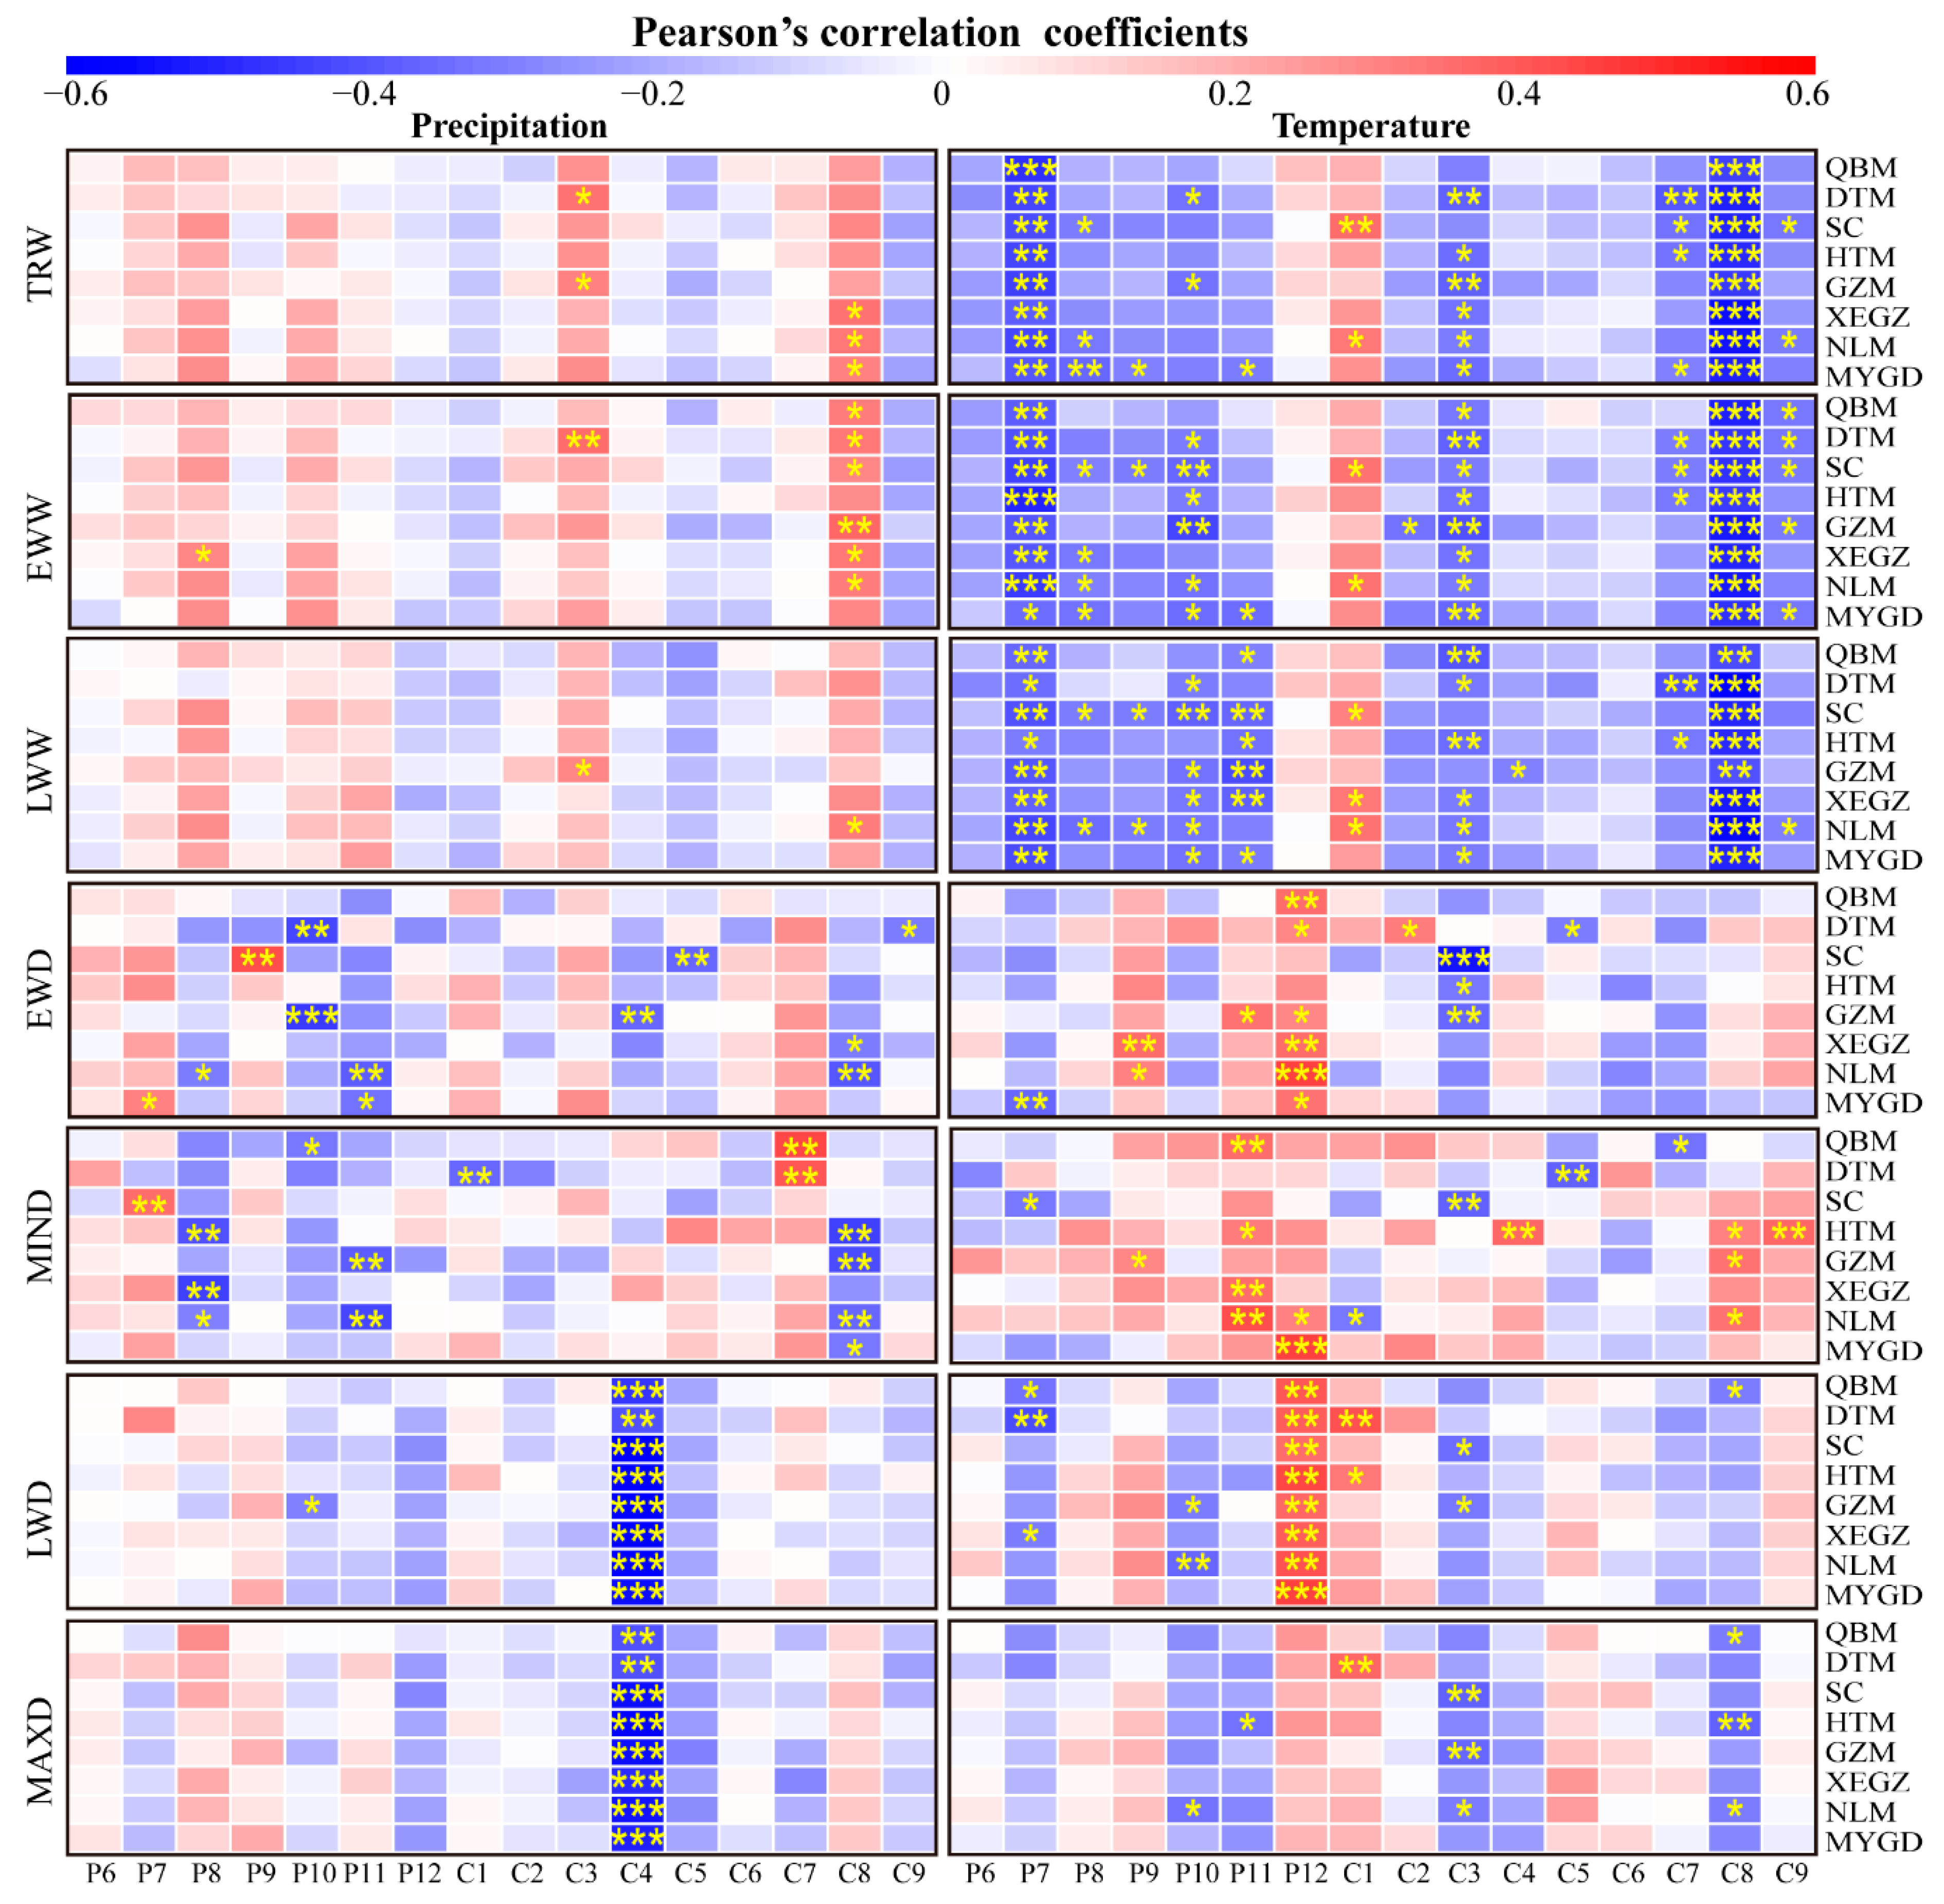
3.2.2. Relationships between Tree-Ring Chronologies and Monthly Climate Factors

Our study indicated that the Chinese fir’s radial growth was positively affected by precipitation and negatively correlated with temperature from the previous June to the previous November (Figure 5). Moreover, radial growth was positively correlated with precipitation in February-March and July-August of the growth year but negatively correlated with temperature in these months. In contrast, radial growth was negatively correlated with December–January precipitation and positively correlated with temperature. Radial growth showed significant correlations with temperature in most months and particularly with those of the previous July and current August. For these latter months, TRW was more responsive to temperature than either EWW or LWW. The temperature substantially limited the radial growth of the SC and GZM provenances but less influenced it for QBM.
Similar correlations between wood density and precipitation applied to the provenance areas (Figure 5): for EWD and MIND, negative correlations were complicated, whereas, for LWD and MAXD, the correlations with precipitation were significantly negative in the current April. All sites’ correlation coefficients for the observed LWD and MAXD values were highly significant (−0.440–0.642, p < 0.01). Moreover, similar and significant correlations were found between the previous December temperatures and EWD and LWD, with values of 0.363–0.441 and 0.357–0.440, respectively. The EWD and MIND for DTM, HTM and SC were significantly correlated with precipitation and temperature. Comparatively speaking, QBM was less constrained by the climate conditions of the experimental site.

4. Discussion

4.1. Tree-Ring Chronology Characteristics

Significant differences in tree-ring descriptive statistical characteristics were detected among tree-ring variables and provenances. These variations prove the effects of climate conditions on wood formation [12,46]. The first-order autocorrelation coefficients for the chronologies of Chinese fir provenance with different indexes varied from 0.109 to 0.515, showing that the growth of Chinese fir’s provenance was in accordance with the climate conditions during the previous year [12]. The larger the AC1, the greater influence of last year’s climate on tree growth [12]. Moreover, the first-order autocorrelation coefficient of chronology was higher than that constructed in the Dagangshan Region of Chinese fir [47] and higher than that usually reported for tree-ring variables in Spain [48]. This may have occurred because warm late summers can prolong the growing season, limiting the formation of metabolic reserves and consequently affecting tree-ring growth during the following year [12,49].
In our study, the chronologies of QBM were less affected by the climate conditions during the previous year than others. It may be that more favorable climate conditions promote the reduction of climate sensitivity of provenances in the middle [50]. However, contrary to our results, other authors have found that the first-order autocorrelation coefficient is often higher in northern latitudes [51]. This may be attributed to a longer needle lifespan in northern areas [51], which reduces the variation in the photosynthetic needle area and reduces growth differences between years [12,52].

4.2. Response of Chinese Fir Growth to Climate Variables

We found that high temperatures in summer (especially for the previous July and current August) primarily limited radial growth. On the one hand, June is the beginning of the peak tree growth season, and thermal conditions become essential for tree radial growth [16]. High August temperatures induce water loss from the soil by increasing land evaporation and plant transpiration [50]. On the other hand, higher temperatures could intensify physiological water loss [53], influence the rates of physiological processes, and control the beginning and the end of the growing season [12,14], leading to a narrow ring formation. However, contrary to our results, the temperature in August showed a significant positive correlation with Chinese white pine in central China [54].
Furthermore, we found that the previous December’s temperature played a critical and positive role in the development of Chinese fir earlywood and latewood density. This may be due to thermal variations as a critical determinant of the cambium activity of subtropical trees [55] and the cambial activity starting when the temperature exceeds a critical value [56]. Accordingly, warm winter in our study area could activate cambium and limit the risk of xylem embolism occurring, promoting tree growth [57,58]. This supported previous studies that found that a mild winter/early spring favored tree growth [56].
The previous year’s climatic conditions also had a significant adverse impact on Chinese fir growth in our study. The growth of a conifer tree is closely linked to the accumulation of energy from photosynthesis [59]; trees can harbor resources from the previous growing season by allocating them to grow in the following growing season. Higher temperatures in the previous autumn would decrease photosynthetic rates and carbohydrate storage, reducing the potential for further growth in the following year [60]. Our findings corresponded well with previous studies demonstrating climate’s “lag effect” on tree-ring growth [61]. For instance, Matskovsky (2016) found that most European spruce chronologies responded negatively to the previous summer’s temperatures.
Seasonal components of radial growth and wood density responded to different climate variables. This was unsurprising since each stage of xylem differentiation is affected by different environmental constraints [62]. Trees’ adjustment to the annual variation of climatic conditions is expressed by the width of annual increments, earlywood and latewood width, wood density and at the cellular level of the xylem [63]. Therefore, the analysis of ring widths and wood density provides valuable information about tree growth and wood properties, respectively [64], and assessments of their collective responses to climate can better characterize climate–growth–wood density associations [15]. In this study, the associations between maximum wood density and seasonal precipitation were stronger than those observed with width variables. Our results confirmed the previous studies showing that density variables better reflect the moisture status of conifer species during the growing season than width variables [15] because they capture changes in wood anatomy [65]. Future drier conditions during the growing season may increase minimum wood density and reduce the radial growth of Chinese fir in our study area, negatively affecting their potential to fix and store carbon pools as stem wood [15].

4.3. Variation in Tree-Ring Growth Responses to Climate Change for Different Provenance Regions

Our results indicated that significant differences in climate–growth relationships were detected among different provenances. The rhythm of cambial activity and dynamics of xylogenesis are genetically determined, thus provenance-specific: in trees growing in favorable environmental conditions, such genetic factors can be considered the main trigger for wood formation [66]. Moreover, the differentiation among provenances is formed through long-term evolution under their respective ecological conditions, and the growth characteristics of a particular provenance are related to the local climate [28]. Hence, a major factor in the performance of a seed source in a particular location is the difference in climate between the location of the planting site and the seed source [6]. The growth responses to temperature and precipitation varied among provenance zones, reflecting population acclimation via genetic adaptation or plasticity to local conditions [67]. The southern provenances from NLM and MYGD showed much stronger correlations with climatic factors, which might occur because they had already adapted to the warm environment of the seed source [68].
Systematic provenance trials comparing different Chinese fir seed sources began across southern China as early as the 1970s [28]. It has been reported that Chinese fir provenances with superior growth rates originated from the NLM, SC, XEGZ and MYGD regions of China, with NLM the most productive area of all [28]. Our findings indicated that the original fine provenance area is still valid. The climate and ecology best suited to the growth of Chinese fir is the basis of its best-performing provenance [28]. However, there is unambiguous evidence that long-lived perennials have been compelled to adapt or migrate because of recent climate change [69]. Moreover, climate change has resulted in both positive and negative trends in tree growth, and climatic influences on tree growth are unstable, species-specific and site-dependent [70]. Consequently, the studied Chinese fir provenances will respond differently to forecasted global warming in southern China. This individual variability should be considered in addition to the provenance-specific responsiveness of tree growth to climate change.
Our study focused on comparisons between the provenances planted in a common garden, limiting extrapolation to regional and large scales. However, the present results showed different responses to climate, indicating adaptation of the Chinese fir provenances to prevalent local climatic conditions. This was evidenced by the correlations between density and climate for individual provenances, which showed high intraspecific variability. This difference will be meaningful when evaluating future climate change impacts on forests. Nevertheless, we have to admit that our inferences are very limited owing to unbalanced sampling of provenances and trees per provenance among the provenance zones, which was inevitable since the number of samples initially collected for the provenance trial in our study area was different. Therefore, conducting a more extensive study on the Chinese fir provenance is necessary.

5. Conclusions

We studied the relationships between climate and the growth of the Chinese fir using data from a long-term provenance experiment, finding that both precipitation and temperature significantly affected tree-ring growth. High temperatures in the previous July and current August hindered the radial growth, while the previous December’s temperature facilitated the wood density. At the same time, precipitation in April impeded latewood growth and maximum densities, while August precipitation promoted radial growth. Maximum wood density presented the strongest response to April precipitation of all the seven tree-ring variables analyzed. Significant differences in tree-ring descriptive statistical characteristics and growth–climate relationships were detected among tree-ring variables and provenances. This work improves our understanding of the intra-specific variation in the responses of Chinese fir to climate change from a tree-ring perspective. Future studies are needed to integrate tree-ring-based studies of numerous areas and multiple provenances and other physiological (e.g., stable carbon isotope analysis) and ecological studies (e.g., impacts of extreme events) on Chinese fir to provide a comprehensive picture.

Supplementary Materials

The following supporting information can be downloaded at: https://www.mdpi.com/article/10.3390/f13091348/s1, Table S1: The information of 52 provenances of Chinese fir in this study.

Author Contributions

Conceptualization, H.W. (Hong Wang) and A.D.; Formal analysis, H.W. (Hong Wang); Funding acquisition, A.D.; Investigation, J.S., A.Z. and J.Z.; Methodology, J.S. and A.Z.; Resources, J.Z.; Software, J.S. and H.W. (Hanbin Wu); Supervision, A.D. and J.Z.; Validation, H.W. (Hanbin Wu); Visualization, H.W. (Hanbin Wu); Writing—original draft, H.W. (Hong Wang); Writing—review and editing, A.D. All authors contributed to the study conception and design. All authors have read and agreed to the published version of the manuscript.

Funding

This research was supported by the National Natural Science Foundation of China (Project 31370629).

Data Availability Statement

Data sharing is not applicable.

Acknowledgments

The authors are grateful to the anonymous reviewers and Academic Editor for their valuable comments on the revision of this article.

Conflicts of Interest

The authors declare that they have no known competing financial interests or personal relationships that could have appeared to influence the work reported in this paper.

References

  1. Buras, A.; Sass-Klaassen, U.; Verbeek, I.; Copini, P. Provenance selection and site conditions determine growth performance of pedunculate oak. Dendrochronologia 2020, 61, 125705. [Google Scholar] [CrossRef]
  2. Klisz, M.; Ukalski, K.; Ukalska, J.; Jastrzębowski, S.; Puchałka, R.; Przybylski, P.; Mionskowski, M.; Matras, J. What can we learn from an early test on the adaptation of silver fir populations to marginal environments? Forests 2018, 9, 441. [Google Scholar] [CrossRef]
  3. Wu, H.; Lei, J.; Li, X.; Wang, H.; Duan, A.; Zhang, J. Aggregation distributions across stand age in provenances of Cunninghamia lanceolata (lamb.) hook. For. Ecol. Manag. 2021, 494, 119317. [Google Scholar] [CrossRef]
  4. Taeger, S.; Zang, C.; Liesebach, M.; Schneck, V.; Menzel, A. Impact of climate and drought events on the growth of Scots pine (Pinus sylvestris L.) provenances. For. Ecol. Manag. 2013, 307, 30–42. [Google Scholar] [CrossRef]
  5. Klisz, M.; Buras, A.; Sass-Klaassen, U.; Puchałka, R.; Koprowski, M.; Ukalska, J. Limitations at the limit? Diminishing of genetic effects in Norway spruce provenance trials. Front. Plant Sci. 2019, 10, 306. [Google Scholar] [CrossRef] [PubMed]
  6. Schmidtling, R. Use of provenance tests to predict response to climate change: Loblolly pine and Norway spruce. Tree Physiol. 1994, 14, 805–817. [Google Scholar] [CrossRef] [PubMed]
  7. Burley, J.; Wood, J.; Adlard, P.; Andrew, I.; Greaves, A.; Hughes, J.; Kemp, R.; Lines, R.; Plumptre, R.; Styles, B. A Manual on Species and Provenance Research with Particular Reference to the Tropics; University of Oxford: Oxford, UK, 1976. [Google Scholar]
  8. Walentowski, H.; Falk, W.; Mette, T.; Kunz, J.; Bräuning, A.; Meinardus, C.; Zang, C.; Sutcliffe, L.M.; Leuschner, C. Assessing future suitability of tree species under climate change by multiple methods: A case study in Southern Germany. Ann. For. Res. 2017, 60, 101–126. [Google Scholar] [CrossRef]
  9. Martín-Benito, D.; Cherubini, P.; Del Río, M.; Cañellas, I. Growth response to climate and drought in Pinus nigra Arn. trees of different crown classes. Trees 2008, 22, 363–373. [Google Scholar] [CrossRef]
  10. Griesbauer, H.P.; Klassen, H.; Saunders, S.C.; Spittlehouse, D.L. Variation in climate-growth relationships for Douglas-fir growth across spatial and temporal scales on Southern Vancouver Island, British Columbia. For. Ecol. Manag. 2019, 444, 30–41. [Google Scholar] [CrossRef]
  11. Matisons, R.; Adamovičs, A.; Jansone, D.; Bigača, Z.; Jansons, Ā. Climatic sensitivity of the top-performing provenances of Scots pine in Latvia. Balt. For. 2018, 24, 228–233. [Google Scholar]
  12. Fritts, H. Tree Rings and Climate; Elsevier: Amsterdam, The Netherlands, 1976. [Google Scholar]
  13. Zuidema, P.A.; Baker, P.J.; Groenendijk, P.; Schippers, P.; van der Sleen, P.; Vlam, M.; Sterck, F. Tropical forests and global change: Filling knowledge gaps. Trends Plant Sci. 2013, 18, 413–419. [Google Scholar] [CrossRef] [PubMed]
  14. Vaganov, E.A.; Hughes, M.K.; Shashkin, A.V. Growth Dynamics of Conifer Tree Rings: Images of Past and Future Environments; Springer Science & Business Media: Berlin/Heidelberg, Germany, 2006; Volume 183. [Google Scholar]
  15. Camarero, J.J.; Fernández-Pérez, L.; Kirdyanov, A.V.; Shestakova, T.A.; Knorre, A.A.; Kukarskih, V.V.; Voltas, J. Minimum wood density of conifers portrays changes in early season precipitation at dry and cold Eurasian regions. Trees 2017, 31, 1423–1437. [Google Scholar] [CrossRef]
  16. Zhang, Y.; Cao, R.; Yin, J.; Tian, K.; Xiao, D.; Zhang, W.; Yin, D. Radial growth response of major conifers to climate change on Haba Snow Mountain, Southwestern China. Dendrochronologia 2020, 60, 125682. [Google Scholar] [CrossRef]
  17. Montwe, D.; Isaac-Renton, M.; Hamann, A.; Spiecker, H. Cold adaptation recorded in tree rings highlights risks associated with climate change and assisted migration. Nat. Commun. 2018, 9, 1574. [Google Scholar] [CrossRef] [PubMed]
  18. Eilmann, B.; Sterck, F.; Wegner, L.; de Vries, S.M.; von Arx, G.; Mohren, G.M.; den Ouden, J.; Sass-Klaassen, U. Wood structural differences between northern and southern beech provenances growing at a moderate site. Tree Physiol. 2014, 34, 882–893. [Google Scholar] [CrossRef]
  19. Evans, M.E.; Gugger, P.F.; Lynch, A.M.; Guiterman, C.H.; Fowler, J.C.; Klesse, S.; Riordan, E.C. Dendroecology meets genomics in the common garden: New insights into climate adaptation. New Phytol. 2018, 218, 401–403. [Google Scholar] [CrossRef]
  20. Fkiri, S.; Guibal, F.; Fady, B.; El Khorchani, A.; Khaldi, A.; Khouja, M.L.; Nasr, Z. Tree-rings to climate relationships in nineteen provenances of four black pines sub-species (Pinus nigra Arn.) growing in a common garden from Northwest Tunisia. Dendrochronologia 2018, 50, 44–51. [Google Scholar] [CrossRef]
  21. Isaac-Renton, M.G.; Roberts, D.R.; Hamann, A.; Spiecker, H. Douglas-fir plantations in Europe: A retrospective test of assisted migration to address climate change. Glob. Chang. Biol. 2014, 20, 2607–2617. [Google Scholar] [CrossRef]
  22. López, L.; Villalba, R. Climate influences on the radial growth of Centrolobium microchaete, a valuable timber species from the tropical dry forests in Bolivia. Biotropica 2011, 43, 41–49. [Google Scholar] [CrossRef]
  23. Arend, M.; Kuster, T.; Günthardt-Goerg, M.S.; Dobbertin, M. Provenance-specific growth responses to drought and air warming in three European oak species (Quercus robur, Q. petraea and Q. pubescens). Tree Physiol. 2011, 31, 287–297. [Google Scholar] [CrossRef]
  24. Sáenz-Romero, C.; Lamy, J.B.; Ducousso, A.; Musch, B.; Ehrenmann, F.; Delzon, S.; Cavers, S.; Chałupka, W.; Dağdaş, S.; Hansen, J.K. Adaptive and plastic responses of Quercus petraea populations to climate across Europe. Glob. Chang. Biol. 2017, 23, 2831–2847. [Google Scholar] [CrossRef] [PubMed] [Green Version]
  25. Lucas, C.; Puchi, P.; Profumo, L.; Ferreira, A.; Muñoz, A. Effect of climate on tree growth in the Pampa biome of Southeastern South America: First tree-ring chronologies from Uruguay. Dendrochronologia 2018, 52, 113–122. [Google Scholar] [CrossRef]
  26. Sheng, W. Chinese Plantation and Its Forest Cultivation System; Forestry Publishing House: Beijing, China, 2014. (In Chinese) [Google Scholar]
  27. Yu, X. Study on Chinese fir in China. J. Fujian Coll. For. 1988, 8, 203–220. [Google Scholar]
  28. Hong, J.; Li, X.; Chen, Y. Memoir of Chinese fir provenance test. For. Rec. 1994, 7. (In Chinese) [Google Scholar]
  29. Chen, P.; Welsh, C.; Hamann, A. Geographic variation in growth response of Douglas-fir to interannual climate variability and projected climate change. Glob. Chang. Biol. 2010, 16, 3374–3385. [Google Scholar] [CrossRef]
  30. Jensen, J.S. Provenance variation in phenotypic traits in Quercus robur and Quercus petraea in Danish provenance trials. Scand. J. For. Res. 2000, 15, 297–308. [Google Scholar] [CrossRef]
  31. Wang, H.; Zhu, A.; Duan, A.; Wu, H.; Zhang, J. Responses to subtropical climate in radial growth and wood density of Chinese fir provenances, Southern China. For. Ecol. Manag. 2022, 521, 120428. [Google Scholar] [CrossRef]
  32. Stokes, M.A. An Introduction to Tree-Ring Dating; University of Arizona Press: Tucson, AZ, USA, 1996. [Google Scholar]
  33. Schinker, M.G.; Hansen, N.; Spiecker, H. High-frequency densitometry—A new method for the rapid evaluation of wood density variations. IAWA J. 2003, 24, 231–239. [Google Scholar] [CrossRef]
  34. Koutsianitis, D.; Barboutis, I. Application of high frequency densitometry to determine wood density and ring width of beech trees. Pro Ligno 2017, 13, 78–83. [Google Scholar]
  35. Holmes, R.L. Computer assisted quality contro. Tree-Ring Bull 1983, 43, 69–78. [Google Scholar]
  36. Rinn, F. Lignovision™—Scanning of Wood and Tree-Ring Recognition; User Reference: Heidelberg, Germany, 2006. [Google Scholar]
  37. Fang, K.; Gou, X.; Peters, K.; Li, J.; Zhang, F. Removing Biological Trends from Tree-Ring Series: Testing Modified Hugershoff Curves. Tree-Ring Res. 2010, 66, 51–59. [Google Scholar] [CrossRef]
  38. Bunn, A.G. A dendrochronology program library in R (dplR). Dendrochronologia 2008, 26, 115–124. [Google Scholar] [CrossRef]
  39. Thurm, E.A.; Uhl, E.; Pretzsch, H. Mixture reduces climate sensitivity of Douglas-fir stem growth. For. Ecol. Manag. 2016, 376, 205–220. [Google Scholar] [CrossRef]
  40. Wigley, T.M.; Briffa, K.R.; Jones, P.D. On the average value of correlated time series, with applications in dendroclimatology and hydrometeorology. J. Appl. Meteorol. Climatol. 1984, 23, 201–213. [Google Scholar] [CrossRef]
  41. Biondi, F.; Qeadan, F. Inequality in paleorecords. Ecology 2008, 89, 1056–1067. [Google Scholar] [CrossRef] [Green Version]
  42. Klisz, M.; Puchałka, R.; Netsvetov, M.; Prokopuk, Y.; Vítková, M.; Sádlo, J.; Matisons, R.; Mionskowski, M.; Chakraborty, D.; Olszewski, P. Variability in climate-growth reaction of Robinia pseudoacacia in Eastern Europe indicates potential for acclimatisation to future climate. For. Ecol. Manag. 2021, 492, 119194. [Google Scholar] [CrossRef]
  43. Team, R.C. The R Foundation for Statistical Computing Platform. R Version 2020, 3. [Google Scholar]
  44. Revelle, W.R. psych: Procedures for Personality and Psychological Research; Northwestern University: Evanston, IL, USA, 2017. [Google Scholar]
  45. Wei, T.; Simko, V. R Package “Corrplot”: Visualization of a Correlation Matrix (Version 0.84). 2017. Available online: https://github.com/taiyun/corrplot (accessed on 21 June 2022).
  46. Matyas, C. Climatic adaptation of trees: Rediscovering provenance tests. Euphytica 1996, 92, 45–54. [Google Scholar] [CrossRef]
  47. Liu, S.; Gao, P.; Liu, P.; Niu, X.; Wang, B. The Response of Chinese Fir Forest Tree Ring Growth to Climate Change in China’s Dagangshan Region. Pol. J. Environ. Stud. 2019, 28, 2371–2379. [Google Scholar]
  48. Hevia, A.; Campelo, F.; Chambel, R.; Vieira, J.; Alía, R.; Majada, J.; Sánchez-Salguero, R. Which matters more for wood traits in Pinus halepensis Mill., provenance or climate? Ann. For. Sci. 2020, 77, 55. [Google Scholar] [CrossRef]
  49. Andreu, L.; Planells, O.; Gutiérrez, E.; Helle, G.; Schleser, G.H. Climatic significance of tree-ring width and δ13C in a Spanish pine forest network. Tellus B Chem. Phys. Meteorol. 2008, 60, 771–781. [Google Scholar] [CrossRef]
  50. Savva, Y.V.; Schweingruber, F.; Vaganov, E.; Milyutin, L. Influence of climate changes on tree-ring characteristics of Scots pine provenances in Southern Siberia (forest-steppe). IAWA J. 2003, 24, 371–383. [Google Scholar] [CrossRef]
  51. Suvanto, S.; Nöjd, P.; Henttonen, H.M.; Beuker, E.; Mäkinen, H. Geographical patterns in the radial growth response of Norway spruce provenances to climatic variation. Agric. For. Meteorol. 2016, 222, 10–20. [Google Scholar] [CrossRef]
  52. Speer, J.H. Fundamentals of Tree-Ring Research; University of Arizona Press: Tucson, AZ, USA, 2010. [Google Scholar]
  53. Shi, J.; Li, J.; Cook, E.R.; Zhang, X.; Lu, H. Growth response of Pinus tabulaeformis to climate along an elevation gradient in the eastern Qinling Mountains, central China. Clim. Res. 2012, 53, 157–167. [Google Scholar] [CrossRef]
  54. Peng, J.; Li, J.; Wang, T.; Huo, J.; Yang, L. Effect of altitude on climate–growth relationships of Chinese white pine (Pinus armandii) in the northern Funiu Mountain, central China. Clim. Chang. 2019, 154, 273–288. [Google Scholar] [CrossRef]
  55. Shimamoto, C.Y.; Botosso, P.C.; Amano, E.; Marques, M.C. Stem growth rhythms in trees of a tropical rainforest in Southern Brazil. Trees 2016, 30, 99–111. [Google Scholar] [CrossRef]
  56. Rossi, S.; Deslauriers, A.; Griçar, J.; Seo, J.W.; Rathgeber, C.B.; Anfodillo, T.; Morin, H.; Levanic, T.; Oven, P.; Jalkanen, R. Critical temperatures for xylogenesis in conifers of cold climates. Glob. Ecol. Biogeogr. 2008, 17, 696–707. [Google Scholar] [CrossRef]
  57. Maherali, H.; Pockman, W.T.; Jackson, R.B. Adaptive variation in the vulnerability of woody plants to xylem cavitation. Ecology 2004, 85, 2184–2199. [Google Scholar] [CrossRef]
  58. Pederson, N.; Cook, E.R.; Jacoby, G.C.; Peteet, D.M.; Griffin, K.L. The influence of winter temperatures on the annual radial growth of six northern range margin tree species. Dendrochronologia 2004, 22, 7–29. [Google Scholar] [CrossRef]
  59. King, G.M.; Gugerli, F.; Fonti, P.; Frank, D.C. Tree growth response along an elevational gradient: Climate or genetics? Oecologia 2013, 173, 1587–1600. [Google Scholar] [CrossRef]
  60. McDowell, N.; Pockman, W.T.; Allen, C.D.; Breshears, D.D.; Cobb, N.; Kolb, T.; Plaut, J.; Sperry, J.; West, A.; Williams, D.G. Mechanisms of plant survival and mortality during drought: Why do some plants survive while others succumb to drought? New Phytol. 2008, 178, 719–739. [Google Scholar] [CrossRef] [PubMed]
  61. Desplanque, C.; Rolland, C.; Michalet, R. Dendroécologie comparée du sapin blanc (Abies alba) et de l’épicéa commun (Picea abies) dans une vallée alpine de France. Can. J. For. Res. 1998, 28, 737–748. [Google Scholar] [CrossRef]
  62. Camarero, J.J.; Rozas, V.; Olano, J.M.; Fernández-Palacios, J.M. Minimum wood density of Juniperus thurifera is a robust proxy of spring water availability in a continental Mediterranean climate. J. Biogeogr. 2014, 41, 1105–1114. [Google Scholar] [CrossRef]
  63. Klisz, M.; Ukalska, J.; Koprowski, M.; Tereba, A.; Puchałka, R.; Przybylski, P.; Jastrzębowski, S.; Nabais, C. Effect of provenance and climate on intra-annual density fluctuations of Norway spruce Picea abies (L.) Karst. in Poland. Agric. For. Meteorol. 2019, 269, 145–156. [Google Scholar] [CrossRef]
  64. Lebourgeois, F.; Rathgeber, C.B.; Ulrich, E. Sensitivity of French temperate coniferous forests to climate variability and extreme events (Abies alba, Picea abies and Pinus sylvestris). J. Veg. Sci. 2010, 21, 364–376. [Google Scholar] [CrossRef]
  65. Camarero, J.J.; Hevia, A. Links between climate, drought and minimum wood density in conifers. IAWA J. 2020, 41, 236–255. [Google Scholar] [CrossRef]
  66. Balzano, A.; Battipaglia, G.; De Micco, V. Wood-trait analysis to understand climatic factors triggering intra-annual density-fluctuations in co-occurring Mediterranean trees. IAWA J. 2019, 40, 241–258. [Google Scholar] [CrossRef] [Green Version]
  67. Latreille, A.; Davi, H.; Huard, F.; Pichot, C. Variability of the climate-radial growth relationship among Abies alba trees and populations along altitudinal gradients. For. Ecol. Manag. 2017, 396, 150–159. [Google Scholar] [CrossRef]
  68. Wang, T.; Hamann, A.; Yanchuk, A.; O’neill, G.; Aitken, S. Use of response functions in selecting lodgepole pine populations for future climates. Glob. Chang. Biol. 2006, 12, 2404–2416. [Google Scholar] [CrossRef]
  69. Parmesan, C. Ecological and evolutionary responses to recent climate change. Annu. Rev. Ecol. Evol. Syst. 2006, 37, 637–669. [Google Scholar] [CrossRef]
  70. Camarero, J.J.; Olano, J.M.; Parras, A. Plastic bimodal xylogenesis in conifers from continental Mediterranean climates. New Phytol. 2010, 185, 471–480. [Google Scholar] [CrossRef] [PubMed]
Figure 1. Geographical locations of Chinese fir seed sources from the experimental trial site. The selected climate graphs indicate the regional averages for monthly precipitation (mm) and temperature (°C) at the provenance locations. Abbreviations: QBM = Qinba Mountain provenance area; DTM = Dabieshan Tongbaishan provenance area; SC = Mountains around Sichuan Basin provenance area; HTM = Huangshan Tianmushan provenance area; YAM = Yalongjiang Anninghe mountain plain provenance area; GZM = Guizhou mountain provenance area; XEGZ = Xiang E Gan Zhe mountain and hilly provenance area; NLM = Nanling Mountain provenance area; MYGD = Mountains and hills in Southern Min Yue Gui Dian provenance area; TWM = Taiwan Mountains provenance area.
Forests 13 01348 g001
Figure 2. Walter–Lieth monthly climate diagram and variation trends for the study area. Data derived from Laibin meteorological station, 1981–2013.
Forests 13 01348 g002
Figure 3. Raw mean series and indexed curves of tree-ring width (TRW), earlywood width (EWW), latewood width (LWW), earlywood density (EWD), minimum density (MIND), latewood density (LWD), and maximum density (MAXD) for eight provenance regions of Chinese fir.
Forests 13 01348 g003
Figure 4. Heat map of Pearson’s correlation coefficients for the relationship between radial growth (TRW, EWW, LWW), wood densities (EWD, LWD, MIND, MAXD) and seasonal climate variables, 1981–2013. (Note: The color code refers to Pearson’s correlation coefficients. The strength of the correlations varies from positive (red) to negative (blue) values and from high (dark) to low (light) values. * Significance at p < 0.05; ** Significance at p < 0.01; *** Significance at p < 0.001).
Forests 13 01348 g004
Figure 5. Heat map of Pearson’s correlation coefficients for the relationship between radial growth (TRW, EWW, LWW), wood densities (EWD, LWD, MIND, MAXD) and monthly climate factors, 1981–2013 (P = previous year, C = current year). (Note: The color code refers to Pearson’s correlation coefficients. The strength of the correlations varies from positive (red) to negative (blue) values and from high (dark) to low (light) values. * Significance at p < 0.05; ** Significance at p < 0.01; *** Significance at p < 0.001.).
Forests 13 01348 g005
Table 1. Core numbers and regions of provenance for the period 1981–2013.
Provenance ZoneNumber of ProvenancesNumber of DiscsDBH (cm)MAP (mm)MAT (°C)MINT (°C)MAXT (°C)RH (%)
QBM22218.551067.016.3−2.737.278.8
DTM22217.251123.616.3−6.137.874.6
SC55719.301078.615.2−3.034.378.6
HTM44520.281336.816.6−6.237.974.9
GZM33821.101096.716.8−1.337.276.7
XEGZ1113319.651530.817.7−3.438.577.7
NLM1619122.971771.419.9−0.837.377.0
MYGD910619.621090.716.8−1.733.776.9
Abbreviations: DBH = diameter at breast height, MAP = mean annual precipitation, MAT = mean annual temperature, MINT = mean minimum daily temperature, MAXT = mean maximum daily temperature, RH = mean annual relative humidity.
Table 2. Comparison of the dendrochronological statistics of Chinese fir provenances considering three width variables (TRW, tree-ring width; EWW, earlywood width; LWW, latewood width) for the period 1981–2013.
Provenance ZoneTRWEWWLWW
RbarEPSSNRGinicoefAC1RbarEPSSNRGinicoefAC1RbarEPSSNRGinicoefAC1Sampdepth
QBM0.1670.8616.2150.3200.4170.1410.8365.0820.3990.3080.1470.8435.3540.3660.29531
DTM0.2950.93614.6440.4450.5150.2550.92311.9770.5250.4730.2890.93414.2310.4800.39735
SC0.2380.97032.1600.4620.5060.2350.96931.2850.5460.4580.1610.95119.5660.4540.334103
HTM0.2150.94015.6060.3850.4510.2140.93915.4790.4380.3630.2090.93815.0690.4430.34157
GZM0.2480.94216.1540.4370.4480.1660.9079.7870.4830.3490.1890.91911.4090.4380.30749
XEGZ0.2020.98047.9990.3930.4360.2000.97947.3750.4850.3850.1660.97437.6900.4470.301190
NLM0.2160.98882.2850.4300.4740.2360.98991.8960.5080.4410.1680.98459.9680.4390.331298
MYGD0.1800.97234.9010.4320.4700.1660.96931.5480.5050.4190.1670.97133.0880.4550.332159
Table 3. Comparison of the dendrochronological statistics of Chinese fir provenances considering four density variables (EWD, earlywood density; MIND, minimum density; LWD, latewood density; MAXD, maximum density) for the period 1981–2013.
Provenance ZoneEWDMINDLWDMAXD
RbarEPSSNRGinicoefAC1RbarEPSSNRGinicoefAC1RbarEPSSNRGinicoefAC1RbarEPSSNRGinicoefAC1Sampdepth
QBM0.0600.6661.9940.2500.2280.1000.7763.4611.0450.3820.1070.7883.7110.1260.1270.1120.7963.9070.1140.10931
DTM0.0500.6461.8230.3520.3380.0760.7412.8642.1950.4820.0880.7723.3880.1600.1790.0640.7062.3990.1460.13735
SC0.0590.8656.3890.3030.2620.1140.92913.1784.7160.4360.0910.91110.2430.1190.1840.0820.9019.1000.1110.156103
HTM0.1190.8857.7200.3910.3650.1140.8807.3373.7320.5120.1090.8756.9700.1290.2540.0880.8465.5100.1140.18657
GZM0.1170.8666.4780.2540.3160.1860.91811.1931.1800.4900.1000.8445.4230.1180.2260.0670.7783.5020.1090.14849
XEGZ0.0920.95119.2330.4080.3200.1030.95621.7402.1350.3810.0960.95320.2240.1350.1810.0740.93815.1720.1210.119190
NLM0.0970.97032.1771.9710.3360.1060.97235.3365.1200.4780.1020.97133.8540.1310.2350.0730.95923.2960.1190.170298
MYGD0.0930.94216.3880.2770.3100.1650.96931.4463.9000.4740.1010.94717.9420.1360.2190.0700.92312.0580.1230.142159
Abbreviations: Rbar: mean interseries correlation, EPS: the expressed population signal, SNR: the signal-to-noise ratio, Ginicoef: the Gini coefficient, AC1: first-order autocorrelation coefficient.
Publisher’s Note: MDPI stays neutral with regard to jurisdictional claims in published maps and institutional affiliations.

