Abstract
Triadica sebifera (Linnaeus) Small is a tree species native to China. The seeds of T. sebifera are rich in oil and are widely used in industrial fields. To explore the genetic diversity and genetic differentiation of T. sebifera germplasm resources, 10 pairs of microsatellite markers were applied to 203 samples collected from eight populations. Forty-three alleles were detected. The average expected heterozygosity (He = 0.491) revealed a low level of genetic diversity. The genetic differentiation among T. sebifera populations was low (Fst = 0.026), which might be related to high gene flow (average Nm = 11.151). Genetic distance and structure results further confirmed that the genetic compositions of the eight populations were quite similar. One of the possible reasons for this phenomenon is that the early introduction and cultivation of T. sebifera were common, so gene exchange was frequent among populations. However, UPGMA clustering results indicated that the eight T. sebifera populations could still be divided into three categories. The classification was related to their geographical location: the southwestern group (ZY), central group (HG and XY) and eastern group (LS, HS, LX, XZ and LY). The reason for this differentiation might be severe deforestation following the decline in T. sebifera economic status. In addition, the central XY population had the largest number of rare alleles (4). In conclusion, although T. sebifera germplasm resources had a low level of genetic diversity, several rare alleles were detected in the central populations, which are valuable for breeding. These resources should be conserved to maintain genetic diversity in the T. sebifera populations. Moreover, geographical distances were important reasons for the limited genetic variations among the populations.
1. Introduction
Triadica sebifera (Linnaeus) Small is a tree species native to China that belongs to the genus Sapium (Triadica) in the family Euphorbiaceae. It is mainly distributed in Jiangsu, Zhejiang, Fujian, Henan and other provinces (regions) [1]. The seeds of T. sebifera are rich in oil and have been widely used in soap, paint and other industrial products, making it an ideal tree species for oil production [2]. However, the demand for T. sebifera gradually decreased due to the impact of imported oil. Therefore, many T. sebifera trees have been cut down, which has resulted in a sharp decrease in the germplasm resources of this species [3]. Recently, T. sebifera has been planted widely in gardens because of its high ornamental value. The success of T. sebifera breeding depends on the available germplasm resources. It is necessary to extensively collect T. sebifera germplasm resources and analyse their distribution patterns and genetic differentiation levels to protect and utilize them more scientifically and rationally.
At present, research on T. sebifera is mainly focused on phylogenetic analysis, chemical composition, biological activity and other economic traits [4,5,6,7]. However, there have been few studies on its germplasm resources and genetic diversity, with the exception of studies on the screening of elite clones, introduction tests, etc. [8,9,10]. Although there have been studies on the genetic diversity of T. sebifera, most of them used intersimple sequence repeat (ISSR) markers [11,12], which are dominant markers and cannot distinguish heterozygotes. This approach is not conducive to the genetic evaluation of T. sebifera germplasm resources because of the limited information provided. In contrast, simple sequence repeat (SSR) markers have the advantages of large numbers, a wide distribution, and codominance. They have been widely used to study the genetic aspects of many woody plants, such as poplar, bamboo, and Eucalyptus robusta Smith [13,14,15]. When molecular markers are used for genetic analysis, more widely collected samples can reveal genetic differentiation and genetic diversity more comprehensively and accurately. Dewalt et al. [16] performed research on T. sebifera populations using SSR markers, but the number of samples was small, making it difficult to obtain comprehensive genetic characteristics of the T. sebifera populations.
Because of these research limitations, many questions remain, such as the following: What are the levels of genetic diversity and genetic structure in existing T. sebifera forests? How can the existing T. sebifera forest resources be protected? With these perspectives in mind, 10 pairs of SSR markers were used to explore the genetic variation of eight T. sebifera populations in the distribution area. The aim was not only to comprehensively explore the existing genetic resources of T. sebifera populations from a population genetics perspective, including aspects of genetic diversity and genetic structure, but also to explore the characteristics and origin of the differentiation of T. sebifera populations. This study is expected to provide a more reliable basis for formulating protection and utilization measures for T. sebifera.
2. Materials and Methods
2.1. Sample Information
Germplasm resources were collected in the main distribution areas of T. sebifera, covering seven provinces, namely, Guizhou, Zhejiang, Anhui, Hubei, Henan, Jiangsu and Shandong (Figure 1). Two-year-old branches were collected from different geographical regions, and the sample information for each population was recorded. A total of 203 samples from eight populations were ultimately collected, with 19 to 34 samples from each population. The samples were preserved by grafting in the T. sebifera Germplasm Resource Garden, which is located at the Zhejiang Academy of Forestry Sciences (30°13′09″ N, 120°01′44″ E). The information for each population is provided in Figure 1 and Table 1. Young leaves were collected and stored at −80 °C for later use.
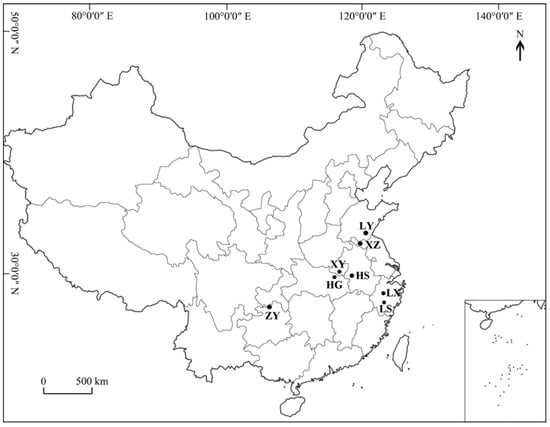
Figure 1.
Geographical distribution map of the eight T. sebifera (Linnaeus) populations.

Table 1.
The origins of the eight T. sebifera (Linnaeus) populations.
2.2. Experimental Method
The cetyl trimethyl ammonium bromide (CTAB) method was used to extract total genomic DNA [17]. A total of 120 pairs of SSR primers were designed by our team based on transcriptome sequences, and 10 of them were selected for this study. The primer information is shown in Table 2.
Table 2.
Information on the 10 SSR loci.
Polymerase chain reactions (PCRs) were performed using the GeneAmp PCR System 9700 (Applied Biosystems Inc., Carlsbad, CA, USA) after the upstream sequence of the SSR primer was fluorescently labelled with FAM. The total PCR volume was 20 μL, which included 60 ng of genomic DNA, 10 μL of 2× TSINGKE Master Mix, and 1.5 μL (10 μmol/L) of EST-SSR forward primer and reverse primer. Finally, ddH2O was added to reach a total volume of 20 µL. PCR products were separated on an ABI 3730xl instrument for short tandem repeat (STR) typing. The typing results were read by Peak Scanner version 1.0 software (Applied Biosystems, Foster City, CA, USA) [18].
2.3. Data Analysis
POPGENE version 1.32 software (University of Alberta, Edmonton, Canada) was used to calculate population genetic parameters, such as Shanno’s information index (I), the average number of observed alleles (Na), the effective number of alleles (Ne), expected heterozygosity (He), and the genetic differentiation coefficient (Fst) [19].
PowerMarker version 3.25 software (North Carolina State University, Raleigh, NC, USA) [20] was used to calculate the polymorphism information content (PIC) and linkage disequilibrium. Allelic richness (AR) was analysed by FSTAT version 2.9.3 software (University of Lausanne, Lausanne, Switzerland) [21]. GenAlEx version 6 software (Rutgers University, New Brunswick, NJ, USA) was used for analysis of molecular variance (AMOVA) and principal coordinate analysis (PCoA) [22].
Population genetic structure was analysed by Structure version 2.3.4 software (Stanford University, San Francisco, USA) [23]. For clustering from K = 1 to K = 9 (number of populations + 1), the Markov chain Monte Carlo simulation (MCMC) algorithm [24] was applied under admixed ancestry and an allele frequency model. The Evanno method was used to determine the optimal K value as implemented in STRUCTURE HARVESTER [25]. CLUMPP version 1.1.2 (Stanford University, Stanford, CA, USA) and DISTRUCT version 1.1 (Stanford University, San Francisco, USA) [26,27] were used to plot the results. The unweighted pair group method with arithmetic mean (UPGMA) cluster diagram and Mantel test were completed using NTSYS version 2.10 software (State University of New York, NY, USA) [28].
3. Results
3.1. Genetic Diversity
Ten pairs of SSR primers were applied to PCR amplification of 203 samples from eight populations. The STR typing results are shown in Figure 2. A total of 43 alleles were detected, with an average of 4.3 alleles (and range of 3 to 5) per SSR locus (Table 3). Overall, the 203 T. sebifera samples showed a moderate level of genetic diversity. The average Ne, He and I of each locus were 2.034, 0.491, and 0.854, respectively. Among the 10 SSR loci, E-SSR58 had the lowest polymorphism level. Its Ne, He, I and PIC were the smallest, at 1.410, 0.292, 0.598, and 0.269, respectively. In contrast, E-SSR85 had the highest polymorphism level. Its Ne, He, I and PIC were the highest, at 2.899, 0.657, 1.214, and 0.614, respectively. The level of polymorphism shown by E-SSR85 was the highest, followed by that of E-SSR25. In addition, except for the E-SSR58 locus, all the loci significantly deviated from Hardy–Weinberg equilibrium (p < 0.05).
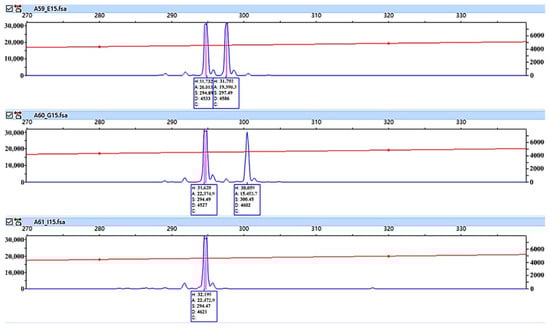
Figure 2.
Amplification map of the SSR marker E-SSR58.
Table 3.
Polymorphism information of the 10 SSR loci.
The genetic diversity levels of the eight T. sebifera populations were not significantly different (average He = 0.486) (Table 4). The XZ population had the most genetic diversity, with the largest effective allele number (Ne = 2.079) and the highest degree of genetic diversity (AR = 3.185) and expected heterozygosity (He = 0.503), followed by the XY population. In contrast, the LS population had the lowest level of genetic diversity, with the lowest Na (1.908) and He (0.466). The average inbreeding coefficient (F) was −0.203 among the eight T. sebifera populations. All populations showed F < 0, indicating excess heterozygotes and insufficient homozygotes.
Table 4.
Information on genetic diversity in the eight populations based on 10 SSR loci.
3.2. Genetic Differentiation and Genetic Structure
The genetic differentiation coefficient (Fst) of the eight T. sebifera populations was 0.026, indicating low genetic differentiation among them (Table 3). The results of AMOVA further revealed different levels of genetic variation between regions and populations. However, the variation was mainly concentrated within the populations, reaching an extremely significant level (p < 0.01, Table 5). Four percent of the genetic variation occurred among regions (southwest and mideast, p = 0.001). One percent of the total variation occurred among populations within regions, and 95% of the genetic variation occurred within populations (p = 0.001).
Table 5.
AMOVA of 203 samples from eight T. sebifera populations.
The common ancestor relationship of T. sebifera populations was analysed for further research on population genetic structure. According to the maximum ΔK value, the optimal K was 3 (Figure 3A). When K = 3, the genetic information divided the T. sebifera populations into three different ancestral populations (Figure 3B). However, the genetic information sources of the eight populations were quite similar when K = 2, 3 or 8. In addition, a cluster diagram (Figure 3C) was constructed based on the genetic distances between the populations (Table 6). There was a certain degree of genetic differentiation among the eight populations. They could be roughly divided into three categories: the ZY population in the southwest was divided into a separate class, the HG and XY populations in the central region were divided into one class, and the LS, HS, LX, XZ and LY populations were grouped into one category. The classification results of the eight populations and their distribution positions were associated. The results of the Mantel test performed on the eight T. sebifera populations further proved this result, implying a significant association between the genetic and geographical distances between populations (r = 0.6697, p = 0.9860, Figure 4).
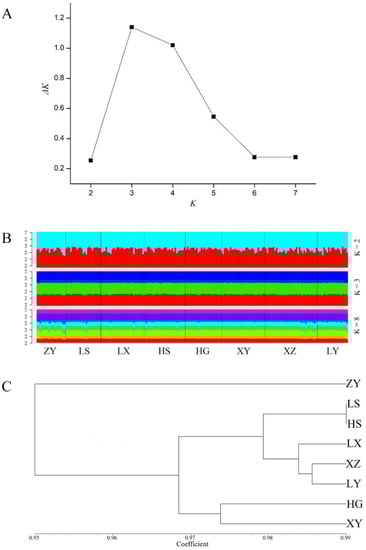
Figure 3.
Genetic structure of eight T. sebifera populations. (A) Relationship between the number of clusters (K) and the corresponding ΔK statistic; (B) Results of the structure analysis of T. sebifera populations when K = 2, 3, and 8. Different colors (light-blue, red, blue, green, dark purple, purple, light-green, and orange) represent different genetic compositions; (C) Cluster diagram of the eight populations.
Table 6.
Pairwise genetic distances between T. sebifera populations.
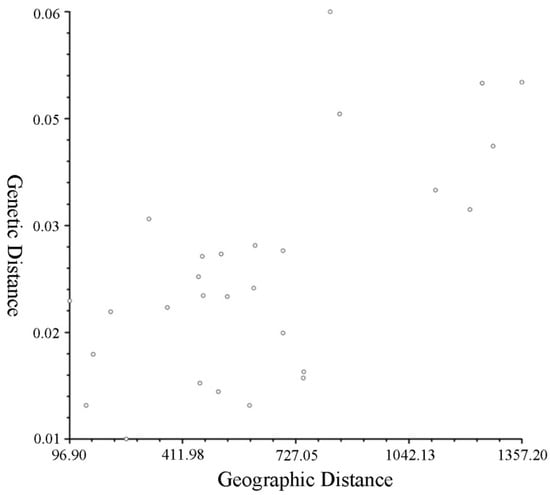
Figure 4.
The result of the Mantel test.
3.3. Rare Alleles
The frequencies of the 43 alleles ranged from 0.0049 to 0.8350, with an average of 0.2326. The minimum allele frequencies (MAFs) of the 10 SSR loci were 0.0049 to 0.0591, and the average was 0.0195. Rare alleles with a frequency less than 0.1 were selected, and the frequency of each rare allele in the populations was calculated (Table 7). Six rare alleles were found among the 10 SSR loci, which were distributed at 5 SSR loci. Two rare alleles were detected at the G-SSR106 locus, and one rare allele each was detected at the other four loci. The central XY population and HG population had the largest numbers of rare alleles, with four and three, respectively. In contrast, the western and eastern populations had 0~2 rare alleles.
Table 7.
Rare allele frequencies within the T. sebifera populations.
4. Discussion
4.1. Genetic Diversity
Genetic diversity is an important indicator used to measure the ability of a species to resist changes in the external environment. It is affected by selection, genetic drift, and breeding system. Research on the genetic diversity of T. sebifera populations could provide a theoretical reference for the protection and utilization of T. sebifera. Li [11] used ISSR markers to study 32 T. sebifera leaf samples from six populations, and the H and I values were 0.2822 and 0.4321, respectively. Zhang [12] also used ISSR markers to analyse 72 samples in four main production areas and obtained similar results (He = 0.281). In this study, the average He of 203 T. sebifera samples from eight populations based on SSR markers was 0.486, which was higher than that in previous studies. There are two possible explanations for this discrepancy. First, the marker types used were different. Compared with ISSR markers, SSR markers can reveal more genetic variation. Second, there were differences in the number of samples. The number of samples selected in this study was relatively large. In addition, the distribution range covered the main distribution areas of T. sebifera. DeWalt et al. [16] used six pairs of SSR markers to analyse 129 samples from 12 T. sebifera populations in China, and the values were higher than those of this study (average He = 0.70). The reason was inferred to be sample differences. In recent years, many older trees might have been transplanted or traded with the gradual popularization of T. sebifera application. This contributed to the loss of T. sebifera resources and a decrease in the genetic diversity of the T. sebifera populations.
Compared with the results from SSR markers in other angiosperms, the genetic diversity of T. sebifera (He = 0.491) was significantly lower than that of Ginkgo biloba Linn (He = 0.808) [29], Quercus variabilis BI. (He = 0.707) [30], Cunninghamia lanceolata (Lamb.) Hook (He = 0.557) [31] and other species. T. sebifera has been widely promoted and planted as an important oil tree species. However, with industrial development and changes in the national industrial structure, the economic status of T. sebifera has declined, and the natural populations have been reduced excessively. Therefore, its genetic resources are difficult to preserve, resulting in a significant reduction in genetic diversity. Therefore, protecting the genetic diversity of T. sebifera is an important goal for preserving its natural resources.
4.2. Genetic Differentiation and Genetic Structure
Natural selection contributes to population differentiation and is the most important evolutionary force. Gene flow plays an important role in selection. For perennial outcrossing woody plants, genetic differentiation among populations is generally low. When Fst is between 0 and 0.05, there is basically no differentiation among populations. There is a moderate degree of differentiation when Fst is 0.05~0.15. When Fst is 0.15~0.25, the degree of differentiation is relatively high. There is strong differentiation when Fst is greater than 0.25 [32]. The differentiation of T. sebifera populations detected in this study (Fst = 0.026) was much weaker than that of Liriodendron chinense (Hemsl.) Sarg. (Fst = 0.302) [33], Q. variabilis (Fst = 0.067) [30], Pinus massoniana Lamb (Fst = 0.072) [34], etc. Our results were quite different from those of Li [11] (Gst = 0.439), which might be due to the use of different markers and numbers of samples.
The results of the AMOVA further indicated that the variation among T. sebifera populations was quite low, and most of the genetic variation existed within the populations. Cluster analysis also showed that the eight T. sebifera populations had similar ancestral origins. The small genetic distances (the highest was only 0.051) also indicated close kinship among the populations. T. sebifera was widely distributed in the early stage because of its high economic value. The mutual introduction and cultivation in different regions led to frequent genetic exchange among geographic groups. This also resulted in similar origins among different geographic populations.
However, there was still a certain degree of genetic differentiation among the eight T. sebifera populations. The UPGMA clustering results showed that the eight populations could be divided into three categories, which were related to their geographical location, namely, the southwestern group (ZY), the central group (HG and XY) and the eastern group (LS, HS, LX, XZ and LY). The results of the Mantel test further indicated that there was a significant positive correlation between genetic distance and geographic distance. Many T. sebifera resources have been removed, contributing to the differentiation among geographical populations, while introduction and cultivation have been greatly reduced due to the decline of the T. sebifera industry.
4.3. Genetic Resource Conservation Strategy of T. sebifera
Abundant germplasm resources are the key to successful forest tree breeding, and they guarantee the continuation of tree species [35]. The overall genetic diversity of T. sebifera was low, and there has been a downward trend in recent years. Even though quite similar amounts of genetic information were observed between populations, six rare alleles were detected in this study. The populations in the central regions had more rare alleles. These resources with rare alleles are not only important for maintaining species diversity but also valuable breeding materials. Therefore, the protection and utilization of various T. sebifera populations should be strengthened in the future, especially for the central populations with more rare alleles.
5. Conclusions
In general, our study included a genetic evaluation of eight populations of T. sebifera. The genetic compositions of the eight populations were similar, and the genetic diversity was low. One possible reason was that introduction was common a long time ago, so gene exchange was frequent among populations. However, the UPGMA results still classified these populations into three categories, indicating that they began to diverge geographically. Finally, rare alleles were detected in some populations, which will be of great help in maintaining the level of genetic diversity in T. sebifera populations.
Author Contributions
Conceptualization, Y.L. and Q.Z.; methodology, F.D.; software, X.S.; validation, F.D., X.S. and P.Z.; investigation, F.D.; data curation, Q.Z.; writing—original draft preparation, P.Z.; writing—review and editing, P.Z.; supervision, Q.Z.; project administration, Y.L. and Q.Z.; funding acquisition, Y.L. and Q.Z. All authors have read and agreed to the published version of the manuscript.
Funding
This research was funded by Special Support Funds of Zhejiang for Scientific Research Institutes (2021F1065-12) and a Key Scientific and Technological Grant of Zhejiang for Breeding New Agricultural Varieties (2021C02070-7).
Institutional Review Board Statement
Not applicable.
Informed Consent Statement
Not applicable.
Data Availability Statement
Not applicable.
Acknowledgments
We are grateful to Li-an Xu and Ming Qi for their help in the sampling involved in the field and the laboratory work.
Conflicts of Interest
The authors declare no conflict of interest.
References
- Jin, D.J.; Huang, H.K.; Tang, R.Q.; Tong, Q.Y.; Shi, D.Y.; Hou, Z.S. Investigation and research on the resources of Triadica sebifera varieties in China. Guangxi Plants 1997, 4, 345–362. [Google Scholar]
- Li, D.L.; Huang, D.; Wang, J.; Jin, Y.Q. A review of research on Triadica sebifera. Jiangsu For. Technol. 2009, 36, 43–47. [Google Scholar]
- Zheng, K.; Zhao, L.; Lang, N.J.; Peng, M.J. Research progress on germplasm resources and cultivation of Triadica sebifera, a woody biomass energy tree. Biomass Chem. Eng. 2006, S1, 360–366. [Google Scholar]
- Wang, S.; Chen, Y.; Yang, Y.; Wu, W.; Liu, Y.; Fan, Q.; Zhou, R. Phylogenetic relationships and natural hybridization in Triadica inferred from nuclear and chloroplast DNA analyses. Biochem. Syst. Ecol. 2016, 64, 142–148. [Google Scholar] [CrossRef]
- DeWalt, S.J.; Siemann, E.; Rogers, W.E. Microsatellite markers for an invasive tetraploid tree, Chinese tallow (Triadica sebifera). Mol. Ecol. Notes 2006, 6, 505–507. [Google Scholar] [CrossRef]
- Gao, R.; Su, Z.; Yin, Y.; Sun, L.; Li, S. Germplasm, chemical constituents, biological activities, utilization, and control of Chinese tallow (Triadica sebifera (L.) Small). Biol. Invasions 2016, 18, 809–829. [Google Scholar] [CrossRef]
- Zhi, Y.; Taylor, M.C.; Campbell, P.M.; Warden, A.C.; Shrestha, P.; El Tahchy, A.; Rolland, V.; Vanhercke, T.; Petrie, J.R.; White, R.G.; et al. Comparative lipidomics and proteomics of lipid droplets in the mesocarp and seed tissues of Chinese tallow (Triadica sebifera). Front. Plant Sci. 2017, 8, 1339. [Google Scholar] [CrossRef]
- Feng, Y.; Luo, J.X.; Du, B.; Gu, Y.J.; Wang, H.L.; Xiang, Q. Study on the phenotypic diversity of seed traits in natural populations of Triadica sebifera in Sichuan-Chongqing area. Sichuan For. Technol. 2011, 32, 19–27. [Google Scholar] [CrossRef]
- Yang, J. Investigation on the Growth of Introduced Triadica sebifera in Rizhao City. Shandong For. Technol. 1996, 2, 17–18. [Google Scholar]
- Wang, H.; Yang, J. Analysis of Ecological Adaptation of Sapium sabiferum Introduced to Shandong Province. Chin. J. Ecol. 1997, 16, 17–19+27. [Google Scholar]
- Li, M.; Li, C.Z.; Wang, L.Y.; Jiang, L.J. Growth characteristics of Triadica sebifera from different provenances at seedling stage. Econ. For. Res. 2012, 30, 75–79. [Google Scholar] [CrossRef]
- Zhang, S.; Wang, X.G.; Du, K.B.; Zhang, Y.Q.; Luo, Z.J.; Tu, B.K. Correlation analysis among several quantitative characters of Triadica sebifera. Econ. For. Res. 2010, 28, 61–66. [Google Scholar] [CrossRef]
- He, X.D.; Zheng, J.W.; Sun, C.; He, K.Y.; Wang, B.S. Construction of fingerprints for 33 varieties in Salicaceae. J. Nanjing For. Univ. (Nat. Sci. Ed.) 2021, 45, 35–42. [Google Scholar] [CrossRef]
- Yuan, J.L.; Ma, J.X.; Zhong, Y.B.; Yue, J.J. SSR-based hybrid identification, genetic analyses and fingerprint development of hybridization progenies from sympodial bamboo (Bambusoideae, Poaceae). J. Nanjing For. Univ. (Nat. Sci. Ed.) 2021, 45, 10–18. [Google Scholar] [CrossRef]
- Li, F.; Gan, S.; Zhang, Z.; Weng, Q.; Xiang, D.; Li, M. Microsatellite-based Genotyping of the Commercial Eucalyptus Clones Cultivated in China. Silvae Genet. 2011, 60, 216. [Google Scholar] [CrossRef][Green Version]
- DeWalt, S.J.; Siemann, E.; Rogers, W.E. Geographic distribution of genetic variation among native and introduced populations of Chinese tallow tree, Triadica sebifera (Euphorbiaceae). Am. J. Bot. 2011, 98, 1128–1138. [Google Scholar] [CrossRef]
- Cota-Sánchez, J.H.; Remarchuk, K.; Ubayasena, K. Ready-to-use DNA extracted with a CTAB method adapted for herbarium specimens and mucilaginous plant tissue. Plant Mol. Biol. Rep. 2006, 24, 161–167. [Google Scholar] [CrossRef]
- Palero, F.; González-Candelas, F.; Pascual, M. MICROSATELIGHT--pipeline to expedite microsatellite analysis. J. Hered. 2011, 102, 247–249. [Google Scholar] [CrossRef]
- Nei, M. Definition and Estimation of Fixation Indices. Evolution 1986, 40, 643–645. [Google Scholar] [CrossRef]
- Liu, K.J.; Muse, S.V. PowerMarker: An integrated analysis environment for genetic marker analysis. Bioinformatics 2005, 21, 2128–2129. [Google Scholar] [CrossRef]
- Goudet, J. FSTAT, A Program to Estimate and Test Gene Diversities and Fixation Indices, version 2.9.3. 2001. Available online: https://www.unil.ch/popgen/softwares/fstat.Htm (accessed on 18 October 2021).
- Peakall, R.; Smouse, P.E. GENALEX 6: Genetic analysis in Excel. Population genetic software for teaching and research. Mol. Ecol. Notes 2006, 6, 288–295. [Google Scholar] [CrossRef]
- Evanno, G.; Regnaut, S.; Goudet, J. Detecting the number of clusters of individuals using the software STRUCTURE: A simulation study. Mol. Ecol. 2005, 14, 2611–2620. [Google Scholar] [CrossRef] [PubMed]
- Falush, D.; Stephens, M.; Pritchard, J.K. Inference of population structure using multilocus genotype data: Linked loci and correlated allele frequencies. Genetics 2003, 64, 1567–1587. [Google Scholar] [CrossRef]
- Earl, D.A.; vonHoldt, B.M. STRUCTURE HARVESTER: A website and program for visualizing STRUCTURE output and implementing the Evanno method. Conserv. Genet. Resour. 2012, 4, 359–361. [Google Scholar] [CrossRef]
- Jakobsson, M.; Rosenberg, N.A. CLUMPP: A cluster matching and permutation program for dealing with label switching and multimodality in analysis of population structure. Bioinformatics 2007, 23, 1801–1806. [Google Scholar] [CrossRef] [PubMed]
- Rosenberg, N.A. Distruct: A program for the graphical display of population structure. Mol. Ecol Notes 2004, 4, 137–138. [Google Scholar] [CrossRef]
- Rohlf, F.J. NTSYS-pc: Numerical Taxonomy and Multivariate Analysis System, version 2.2, 2.1; Department of Ecoloy and Evolution, State University of New York: New York, NY, USA, 2005. [Google Scholar]
- Zhou, Q.; Mu, K.; Ni, Z.; Liu, X.; Li, Y.; Xu, L.-A. Analysis of genetic diversity of ancient Ginkgo populations using SSR markers. Ind. Crops Prod. 2020, 145, 111942. [Google Scholar] [CrossRef]
- Shi, X.; Wen, Q.; Cao, M.; Guo, X.; Xu, L.A. Genetic diversity and structure of natural Quercus variabilis population in China as revealed by microsatellites markers. Forests 2017, 8, 495. [Google Scholar] [CrossRef]
- Chen, X.; Xu, H.; Xiao, F.; Sun, S.; Lou, Y.; Zou, Y.; Xu, X. Genetic diversity and paternity analyses in a 1.5th generation seed orchard of Chenshan red-heart Chinese fir. J. Nanjing For. Univ. (Nat. Sci. Ed.) 2021, 45, 87–92. [Google Scholar] [CrossRef]
- Li, H.; Chen, L.; Liang, C.; Huang, M. Experimental study on provenance of Liriodendron species. For. Sci. Technol. Dev. 2005, 05, 13–16. [Google Scholar]
- Zhou, P.-Y.; Hui, L.-X.; Huang, S.-J.; Ni, Z.-X.; Yu, F.-X.; Xu, L.-A. Study on the Genetic Structure Based on Geographic Populations of the Endangered Tree Species: Liriodendron chinense. Forests 2021, 12, 917. [Google Scholar] [CrossRef]
- Feng, Y.H.; Li, H.G.; Yang, Z.Q.; Wu, D.S. Study on the genetic structure of natural populations of Pinus massoniana provenance. Guangxi Plant 2016, 36, 1275–1281, 1395. [Google Scholar]
- Qi, M.; Zhou, Q.; Ni, Z.; Wu, Y.; Han, X.; Xu, L. Genetic structure analysis of ancient Ginkgo biloba L. populations based on SSR markers. Chin. J. Ecol. 2019, 38, 2902–2910. [Google Scholar] [CrossRef]
Publisher’s Note: MDPI stays neutral with regard to jurisdictional claims in published maps and institutional affiliations. |
© 2022 by the authors. Licensee MDPI, Basel, Switzerland. This article is an open access article distributed under the terms and conditions of the Creative Commons Attribution (CC BY) license (https://creativecommons.org/licenses/by/4.0/).