Article

Machine Learning: Crown Diameter Predictive Modeling for Open-Grown Trees in the Cerrado Biome, Brazil

by
Gabriel Fernandes Bueno
1,
Emanuel Arnoni Costa
1,2,3,
César Augusto Guimarães Finger
2,
Veraldo Liesenberg
3 and
Polyanna da Conceição Bispo
4,*
1
Department of Forest Engineering, Federal University of Uberlandia (UFU), Monte Carmelo 38500-000, Brazil
2
Graduate Program in Forest Engineering, Federal University of Santa Maria (UFSM), Santa Maria 97105-900, Brazil
3
Department of Forest Engineering, Santa Catarina State University (UDESC), Lages 88520-000, Brazil
4
Department of Geography, School of Environment, Education and Development, University of Manchester, Oxford Road, Manchester M13 9PL, UK
*
Author to whom correspondence should be addressed.
Forests 2022, 13(8), 1295; https://doi.org/10.3390/f13081295
Submission received: 1 July 2022 / Revised: 30 July 2022 / Accepted: 4 August 2022 / Published: 15 August 2022
(This article belongs to the Special Issue Modeling of Forest Tree and Stand Parameters)

Abstract

:
The Brazilian Cerrado biome is a hotspot due to its ecological importance and high diversity of fauna and flora. We aimed to develop statistical models to predict the crown diameter of open-growing trees using several forest attributes. Potential crown diameter trends in the measured trees were determined by quantile regression. Crown diameter models were developed by regression analyses, artificial neural networks, support vector machine, and random forest techniques. We evaluated 200 trees characterized into 60 species belonging to 30 botanical families. Our equation for potential crown diameter predicts the derived basal area, number of trees, and the necessary growth space of crown diameter at breast height. Artificial neural networks (with the following validation statistics: R2 = 0.90, RMSE = 1.21, MAE = 0.93, and MAPE = 16.25) predicted crown diameter more accurately than the other evaluated techniques. Modeling crown diameter via machine learning represents an important step toward the assessment of crown dynamics by species and can support the decision making of silvicultural practices and other related activities in several rural properties within the Cerrado biome.

1. Introduction

The Cerrado, also known as the Brazilian savanna, is a biome spanning about two million km2 and is home to a vast biodiversity [1]. Its species richness relates to the heterogeneity of its environment, whose physiognomies range from grasslands, shrublands, and forestlands to wetlands featuring swamp palms such as Mauritia flexuosa Lf (“buriti”), also known as “veredas” [2,3].
It contains up to 12 thousand highly endemic plant species [4]. In contrast, its trees have particular characteristics, such as tortuous trunks with a thick bark, promoting some protection against natural fire events, and a well-developed root system to withstand water deficit periods [5]. This biome is mainly threatened by agricultural expansion and cattle production, although studies show its great potential for sustainable use [6]. Furthermore, several open-grown tree (OGT) species contribute to local inhabitants’ economic and social development, who use them as food, medicine, oils, and essences, among many other uses [7]. OGT are usually found in open settings and develop full crowns (due to less competition), a wide and open branch structure, and large limbs which grow from the lower main trunk [8]. Such conditions enable the identification of some of the morphometric characteristics of OGT that may assist the management and practice of silviculture [9,10,11].
A proper morphometric characterization of OGT assists silvicultural interventions to maintain the optimal density of sites for optimal yield [12]. Additionally, we can assess the potential dimensions of trees to estimate the necessary growth space for the species in a given site [10]. Likewise, we can develop many competition indices to better quantify the local environment and OGT growth space [13]. Such information is essential for sustainable management since competition can reduce growth and increase mortality risk in forest stands [14].
The crown diameter (CD) is commonly used to study morphometric characteristics. This variable indicates the species’ growth stage, vigor, stand density, and production efficiency [15]. It is also used in growth modeling [16], besides being used to predict biomass [17,18] and volume [19].
The literature commonly uses crown diameter (CD) to study the morphometric characteristics of trees. This variable indicates the growth stage, vigor, stand density, and production efficiency of species [20]. Alternatively, it can also evaluate four or even eight radii, depending on their cardinal positions, from a central point in the tree to the limit of its branches [21]. Asymmetry in a particular crown determines the number of measurements [22].
The literature has recently improved the analysis, monitoring, and modeling of ecosystems with more precise, sophisticated, and detailed techniques demanding less work to directly measure CD [23], such as high-density point clouds generated by light detection and ranging (LIDAR) data [24,25] or high-resolution spatial images acquired by satellites, airplanes, helicopters, or even unmanned aerial vehicles (UAV) [24,26].
CD estimates usually employ regression models that use diameter at breast height (DBH) as their primary explanatory variable due to its high correlation with CD and easier collection than other variables, such as height and crown length, among others [27,28].
More recently, the literature has used machine learning (ML) methods to recognize data patterns, structure, and characteristics and make future decisions and predictions [29]. In the particular case of forests, models commonly employ qualitative and quantitative variables with different variability and complexity levels [30]. Interestingly, using different algorithms promises the improvement of the assessment of a given phenomenon and provides accurate predictions. Therefore, research still needs experiments to model the factors that may influence OGT biometric relations.
ML uses input data to predict or make decisions without programming [31]. Since ML algorithms can configure themselves via repetition, a process called learning enables algorithms to make predictions/decisions regarding both input and brand-new data [32]. Among them, we highlight artificial neural networks (ANN), support vector machines (SVM), and random forests (RF), among other techniques. Studies have used these techniques to predict the breast and total height of Eucalyptus trees [33]; the basal area and volume of Eucalyptus individuals [34]; tree height in uneven-aged, mixed forest growth [35]; and diameter increment in Atlantic Forest fragments [36].
ANN aim to simulate the human nervous system. Their interconnected structure of artificial neurons can receive signals from input data, process them, and send an output signal [37]. Research has used ANN to model the growth of Eucalyptus individuals [38], the diameter and height of a Eucalyptus sample [39], tree survival and mortality in the Atlantic Forest [40], the volume of Cryptomeria japonica (Thunb. ex L.f.) D. Don individuals [41], and stem taper [42], among other applications.
SVM creates a hyperplane to separate data in a high-dimensional space according to a kernel function to solve classification and regression problems [43]. For example, studies have used this technique to estimate Eucalyptus crown morphometric indices [44], Acacia mangium Willd [45] and Eucalyptus volume estimation [46], and tropical forest tree biomass [47].
RF combines decision trees (a method called bagging) into a structure resembling an ordinary tree, with nodes representing a particular characteristic of the data and branches referring to their range of values. Research has employed this algorithm to solve regression and classification problems [48], estimate canopy height via LIDAR measurements [49], predict leaf area indices and light extinction coefficients in tropical moist deciduous forests [50], and estimate total stem and assortment volumes in industrial Pinus taeda L. forest stands [51]. Similarly, studies use CD with OGT biophysical attributes since they support forest inventory and silvicultural activities.
In this way, since there are many ML techniques, it is still necessary to evaluate and test different techniques to discuss its particularity, advantages, and disadvantages to work with forest inventory datasets. Jahani et al. [52] proposed the comparative use of ML, ANN, radial basis function neural network (RBFNN), and SVM techniques in a tree failure prediction model. The same approaches mentioned earlier were also used to model tree failure under windstorm in harvested Hyrcanian forests [53], showing large usability of the methods in forestry.
We developed this study with the following hypotheses: H1—OGT crown diameter must consider quantitative size, tree crown form, and site variables, and, H2—machine learning techniques can accurately estimate CD. Given this context, this research aimed to develop statistical models to predict OGT CD in the Cerrado, Brazil. We specifically aimed to (i) identify and characterize measured trees; (ii) evaluate variations in crown radius length according to cardinal positions; (iii) select the most correlated and important variables to model crown diameter; (iv) determine the trend of the potential tree CD; and (v) develop models to predict CD by traditional regression analyses and ML techniques.
To fulfill this research’s aims and specific goals, the manuscript is organized as follows. As already shown, Section 1 introduces the problem, goals, and hypothesis. Then, Section 2 presents the study area description, fieldwork procedures during data collection, description of the crown radius and other related biophysical parameters, selection of the most important predictor variables, modeling of the crown diameter, and selection of the best models. After this, the results are presented in Section 3, in which the characteristics of the measured trees, the crown radius variations between cardinal directions, the selection of important variables, the crown diameter potential, and the evaluation of regression analysis and machine learning techniques for crown diameter prediction are shown. Finally, Section 4 presents the discussion of the topics mentioned above, and Section 5 concludes by presenting all minor findings and adding them into a broader context in terms of applications within the Cerrado biome.

2. Materials and Methods

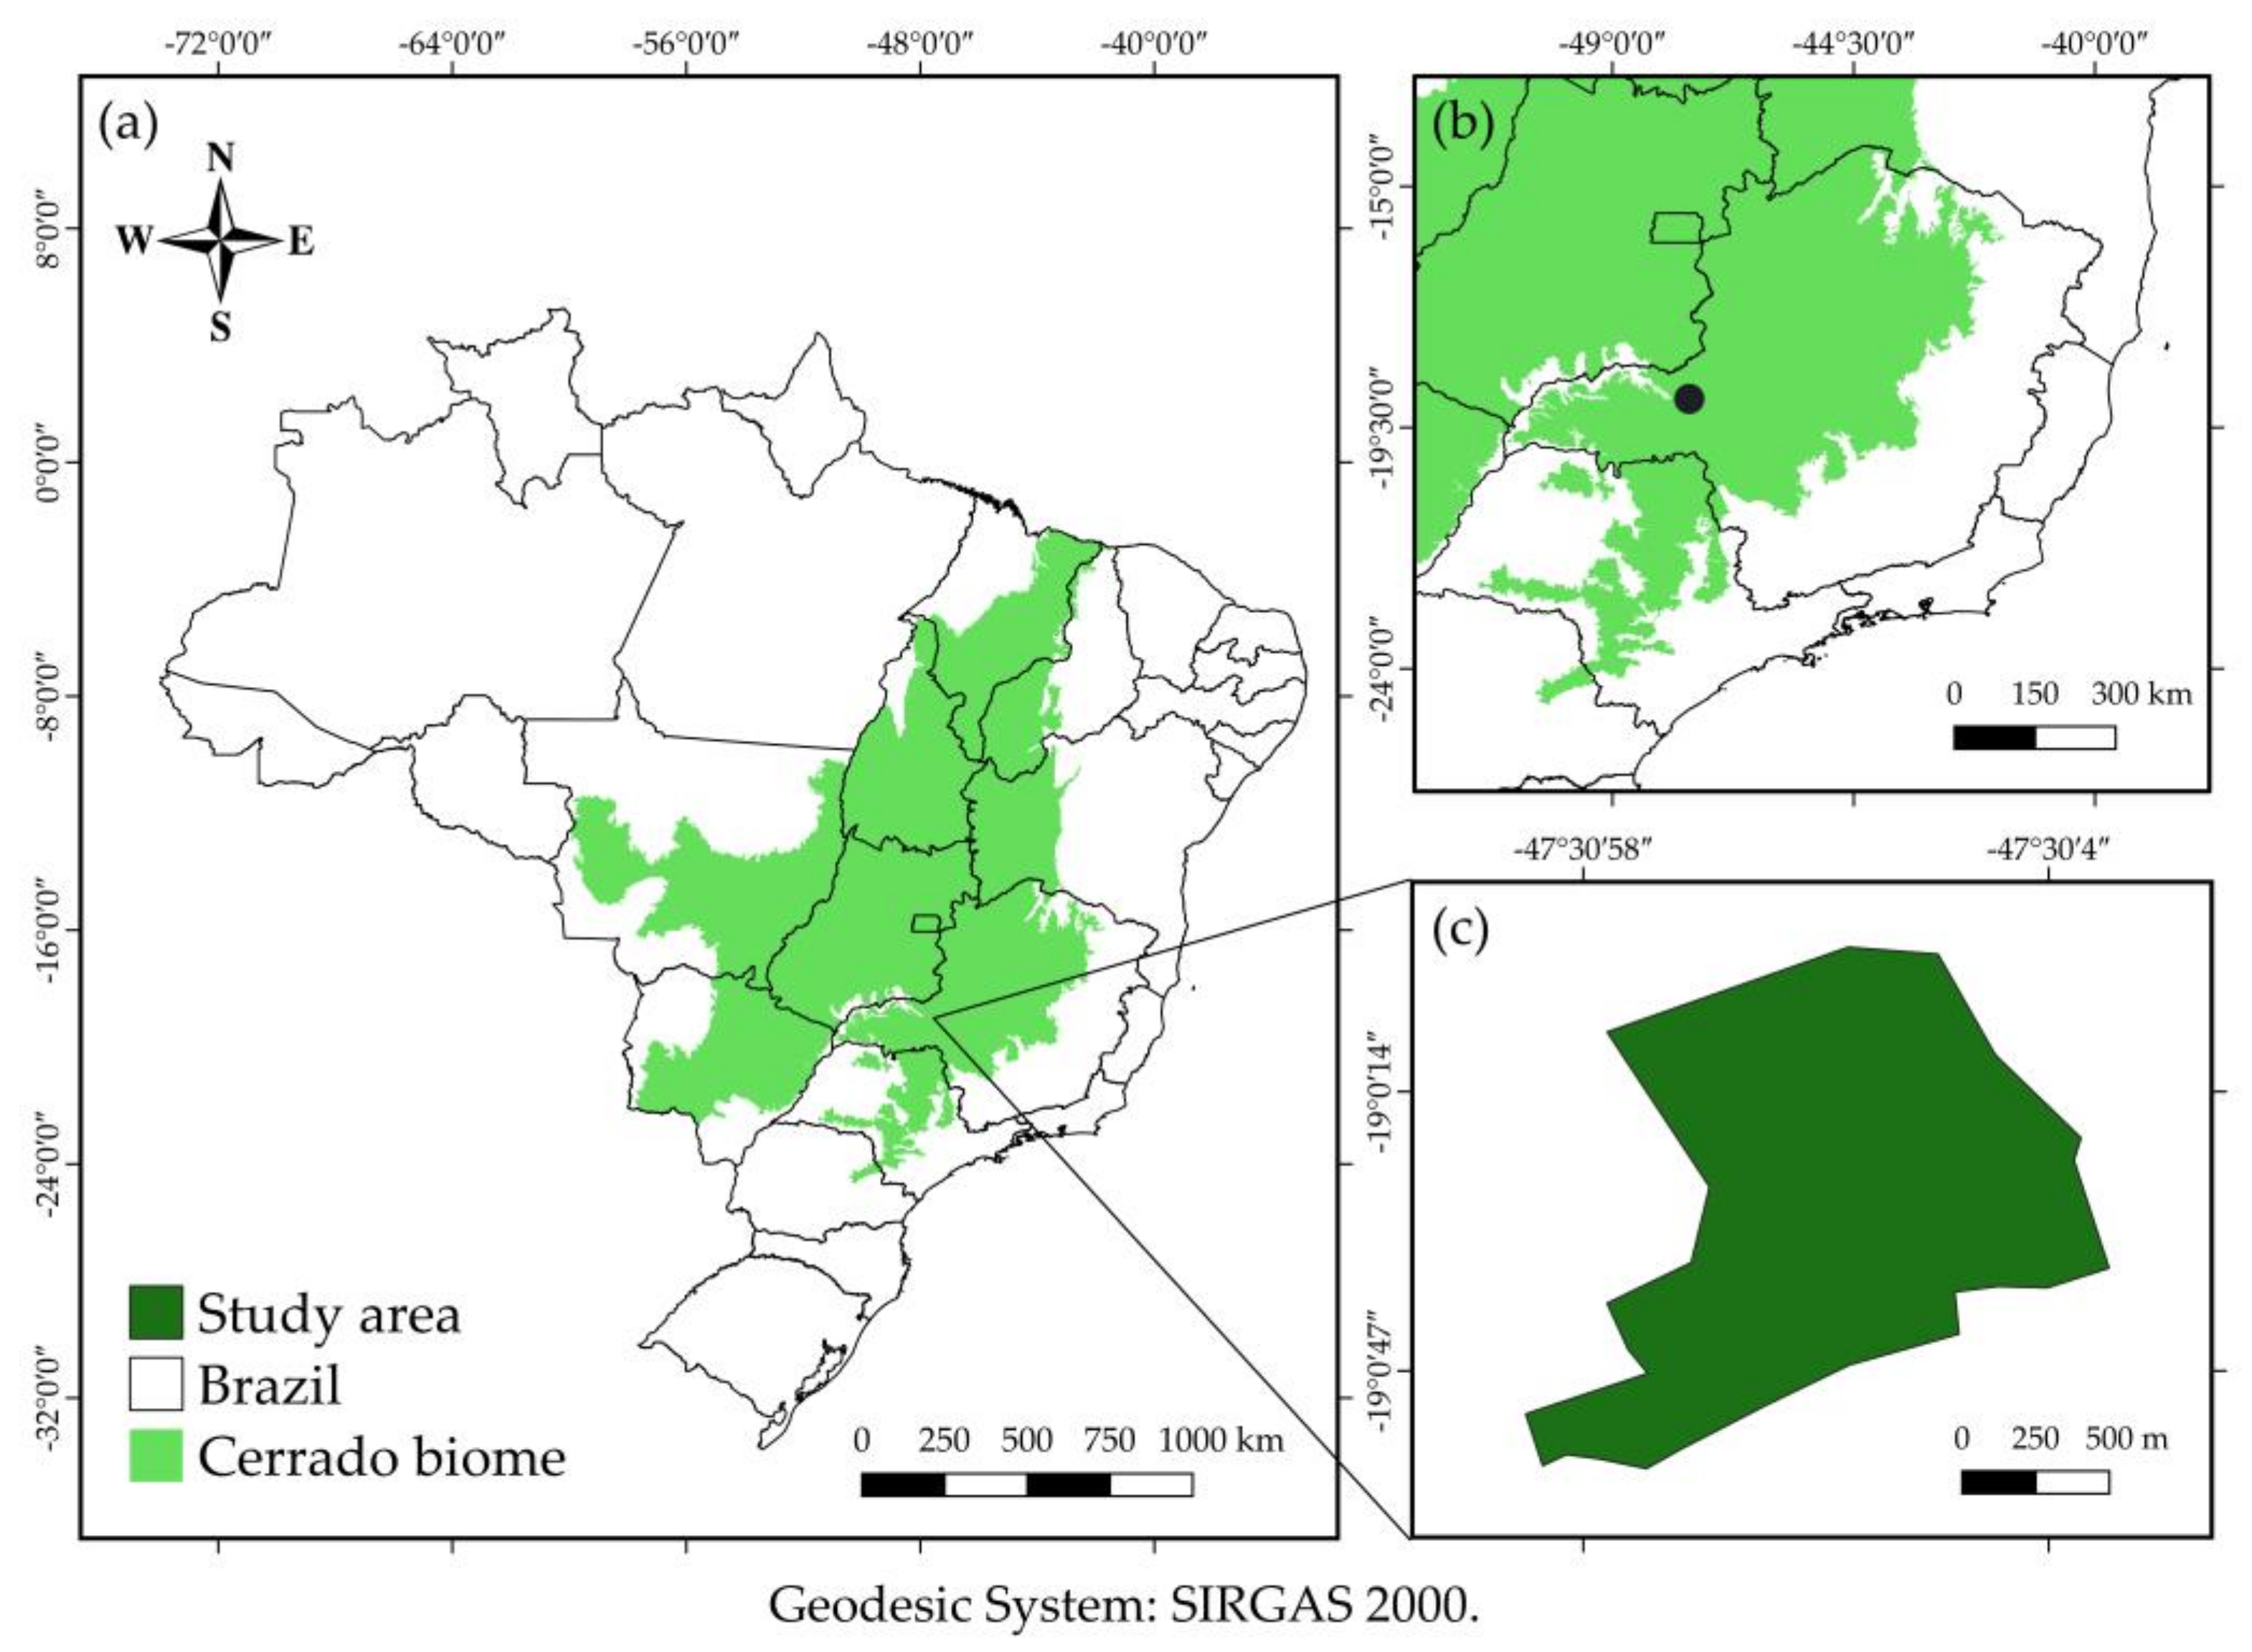
2.1. Study Area Description

This study was conducted in seven rural properties in the municipality of Iraí de Minas, Minas Gerais State, in the Cerrado biome (Figure 1). It is classified as Cwa—humid subtropical climate—according to the Köppen classification; the municipality is 900 m above sea level and has a 20.3 °C average annual temperature and a 1.581 mm average annual accumulated precipitation [54].

2.2. Data Collection

OGT in the seven rural properties were measured and chosen due to the representative and technical cooperation of the university. The specific dendrometric attributes, crown characteristics, and site of 200 OGT species (Table S1) were evaluated (Table 1).
Table 1. Description of the attributes measured for each tree.
VariablesDescription
Diameter measured 0.3 m (D03)D03 was measured with a diameter tape (cm), 0.30 m above the soil.
Diameter measured 0.7 m (D07)D07 was measured with a diameter tape (cm), 0.70 m above the soil.
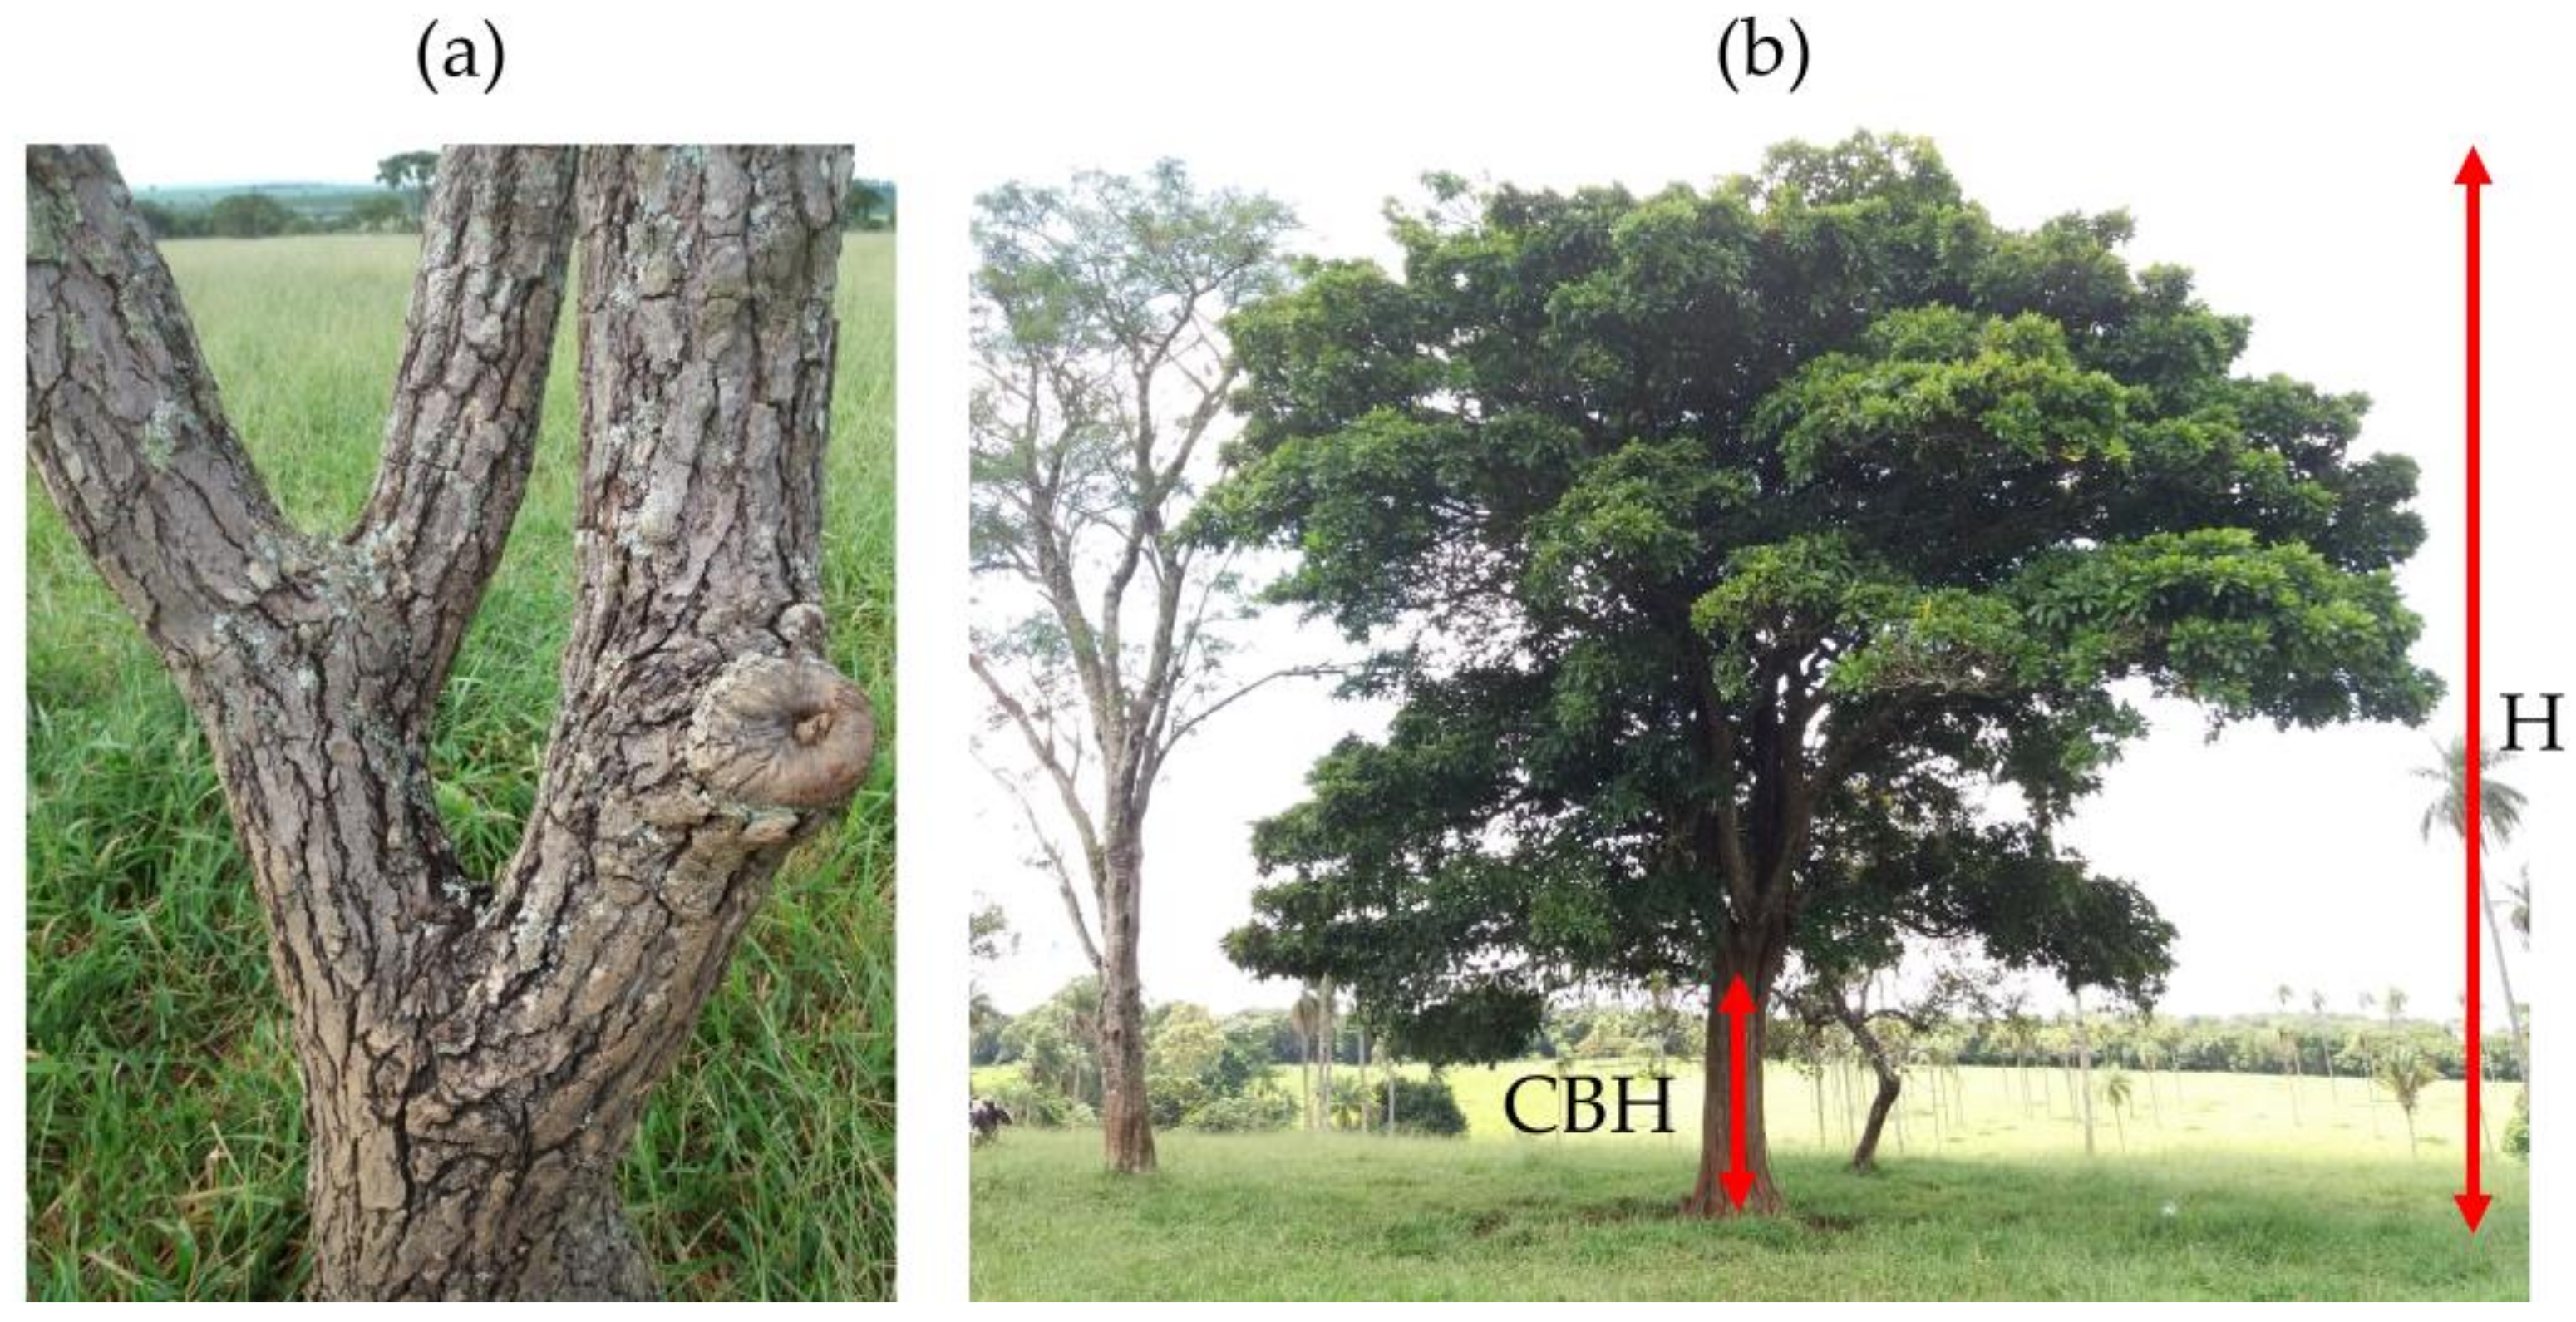
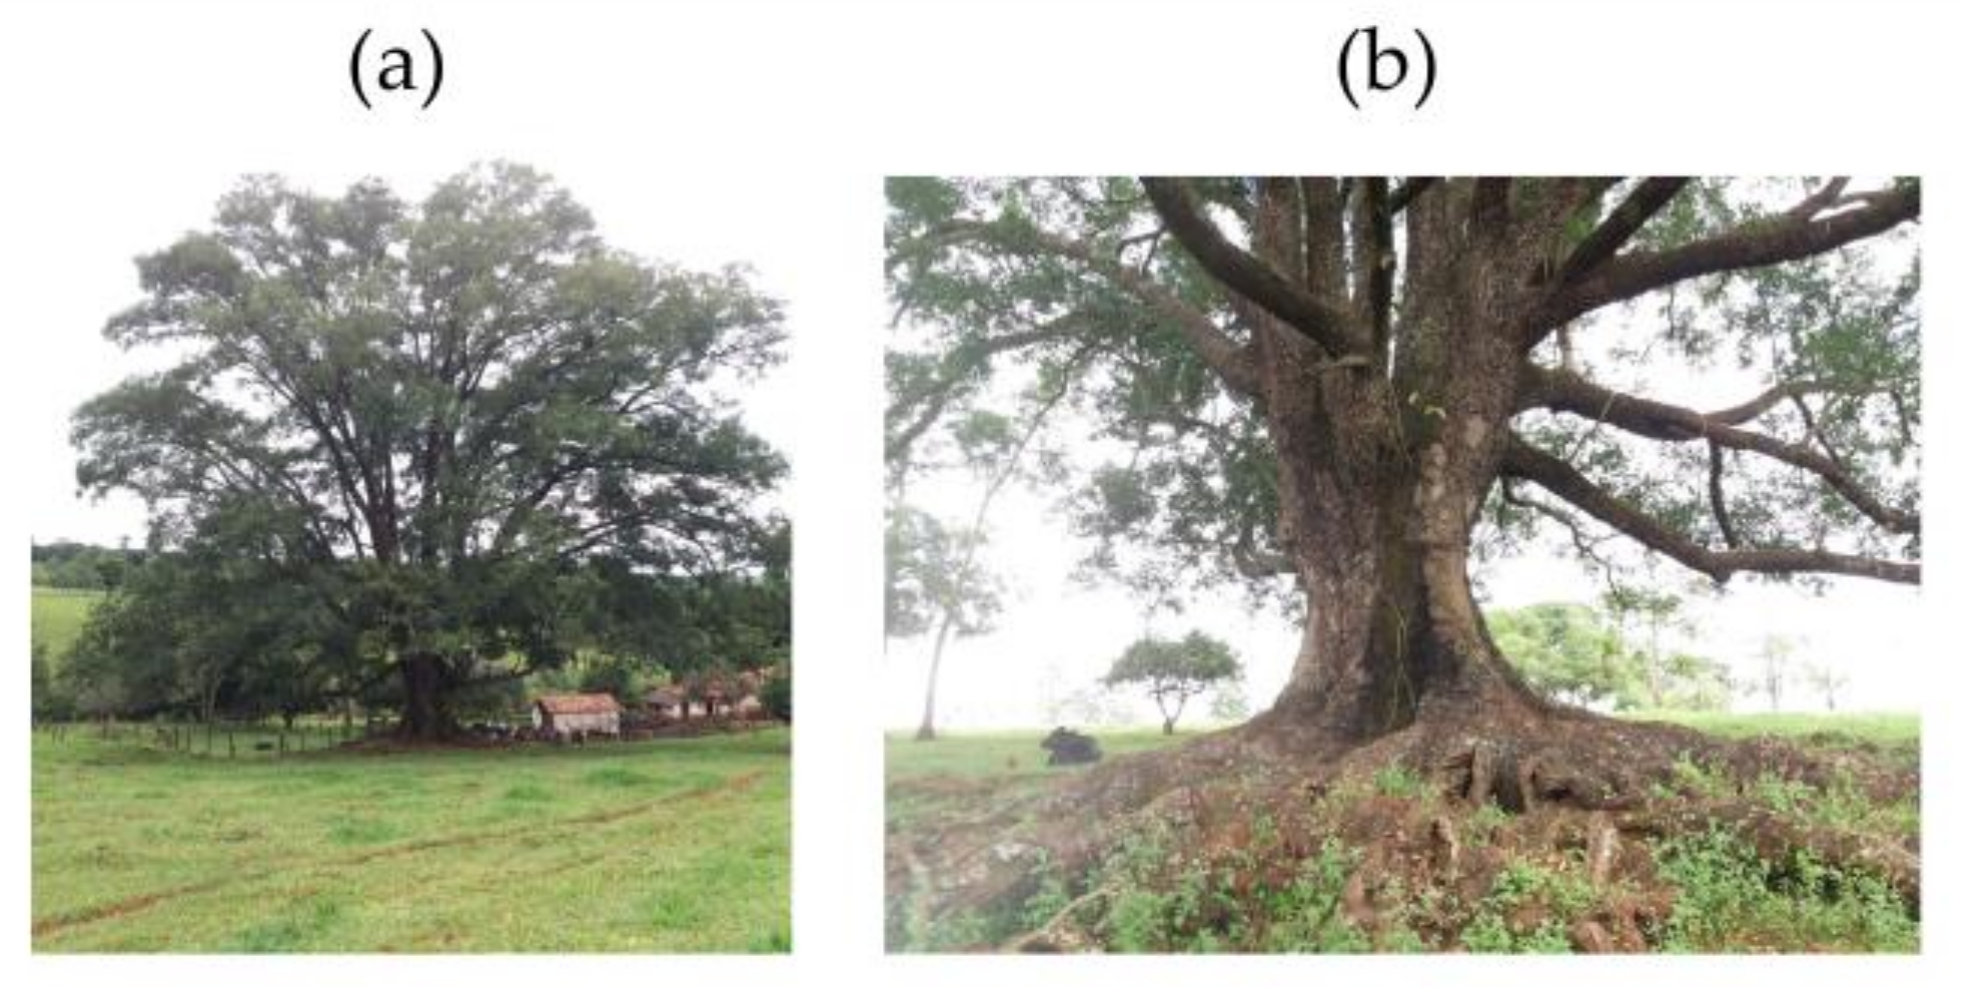
Equivalent diameter (Deq)Deq was measured with a diameter tape (cm) 1.30 m above the soil. In case of forked stems, their equivalent diameter (Deq) was estimated by
Equation (1): Deq = i = 1 n D i 2 (1), see, e.g., Figure 2a, in which Deq is their equivalent diameter in cm and Di, their diameter measured 1.3 m above the soil in cm.
Crown base height (CBH)Measured by a Vertex hypsometer, accurate to tenths of meters, from the soil up to the insertion point of the crown (Figure 2b).
Height (H)Measured by a Vertex hypsometer, accurate to tenths of meters (see, e.g., Figure 2b).
Crown length (CL)Calculated by the difference between total and crown base height.
Crown diameter (CD) Crown radii were measured according to their cardinal positions. Crown diameter was estimated by Equation (2):
CD = 2 × cr N 2 + cr NO 2 + cr E 2 + cr SO 2 + cr S 2 + cr SW 2 + cr W 2 + cr NW 2 / 8
in which CD refers to crown diameter in m; cr, to crown radii (in which N stands for north; NO, to northeast; E, to east; SO, to southeast; S, to south; SW, to southwest; W, to west; and NO, to northeast) in m.
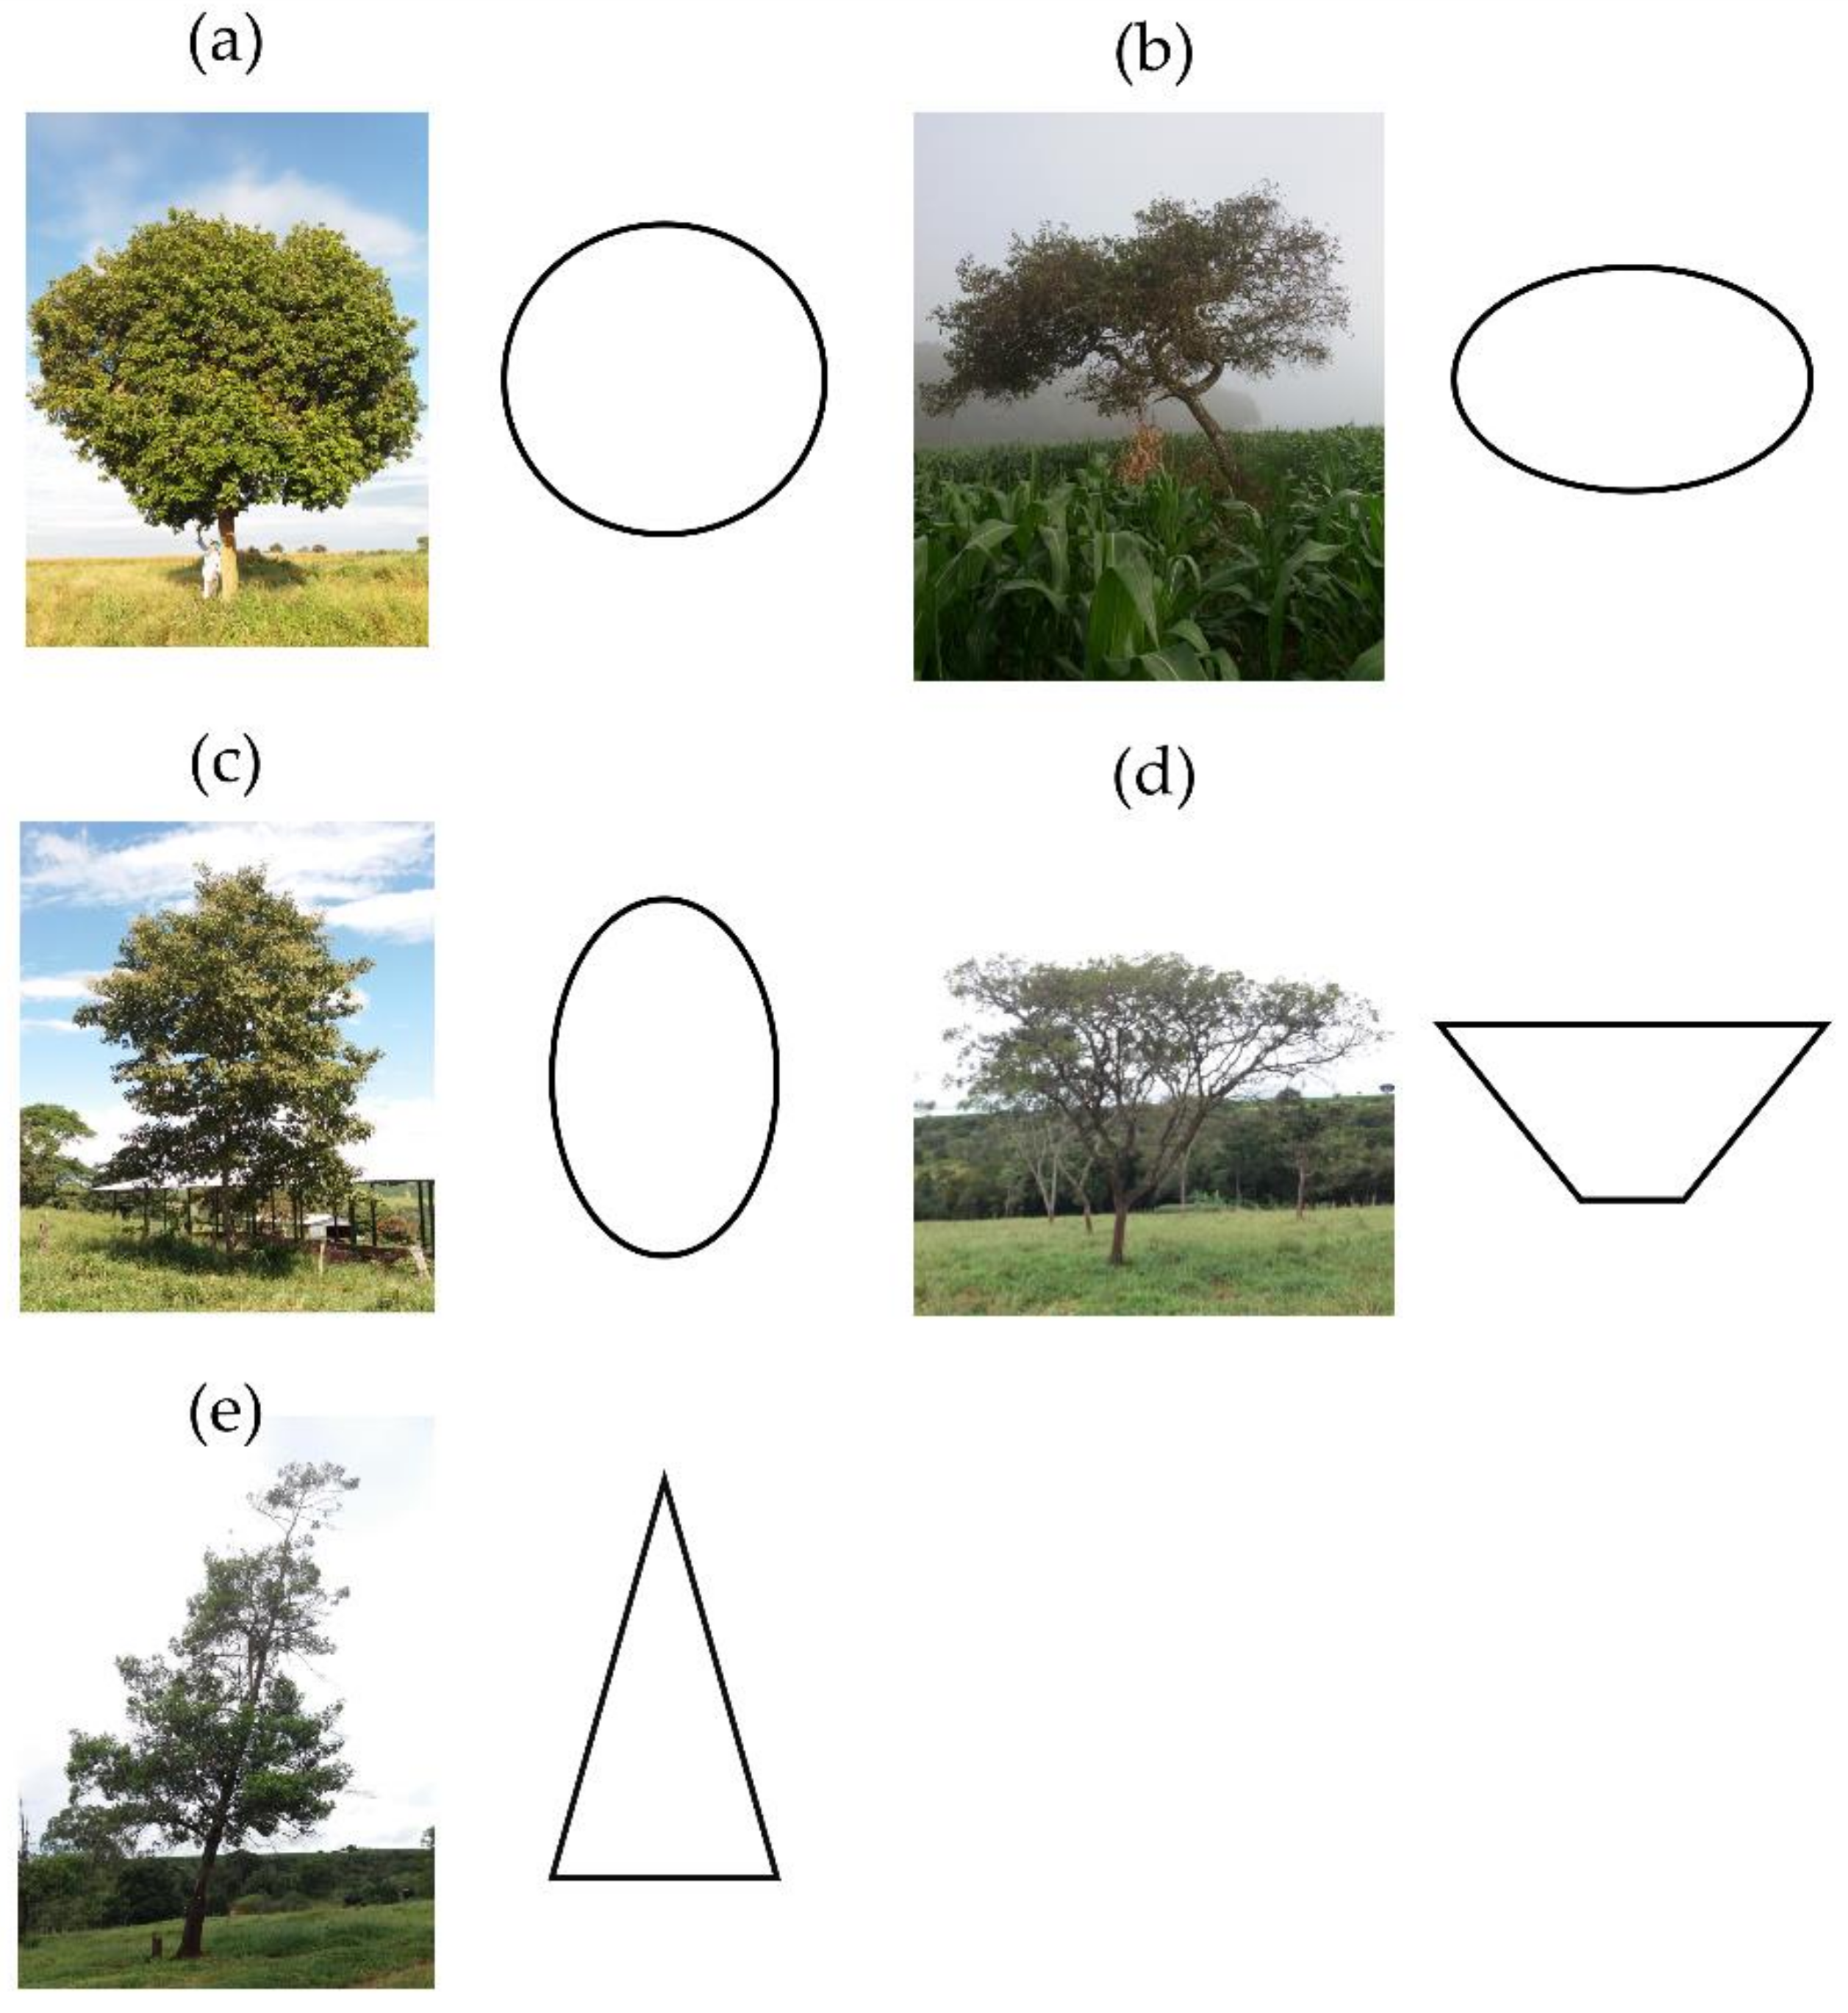
Crown geometric shapes (CGS)Tree crown geometric shapes (CGS) were classified into circular (a), elliptic (b), columnar (c), umbelliform (d), and pyramidal I (Figure 3).
Stoniness (ST)The presence of rocky outcrops on the site was classified as (0) no visual outcrop; (1) outcrop lower than 33.3%; (2) outcrop from 33.3% to 66.6%; and (3) outcrop higher than 66.6%.
Tree position on the relief (PR)Classified into (1) lower hillside, (2) average hillside, (3) upper hillside, and (4) plateau.
Vitality (VT)The number of leaves alive and their distribution in the crown were determined visually and via health classes as (1) high vitality, (2) average vitality, and (3) low vitality.
Branch arrangement (BA)Assessed as (1) homogeneously well-spread branches over all four quadrants, (2) distributed into three quadrants, and (3) branches distributed into one or two quadrants.

2.3. Crown Radius

For each tree, eight crown radii were measured according to their cardinal positions. Thus, the crown diameter can be obtained more accurately in trees with asymmetrical crowns (see Table 2). Furthermore, the measured trees belong to several species and show varied geometric crown shapes (see Table S1 and Figure 3).
Therefore, we needed to evaluate the existence of differences between the means of crown radii according to their cardinal positions. Box plots were used to analyze central trend and crown radius variability. As a result, a variance analysis was performed, and the Tukey’s range test was used to compare crown radii, considering a 5% significance level.

2.4. Selection of the Most Important Predictor Variables

The degree of association between CD, dendrometric variables, and crown and site characteristics were quantified by the following analyses: (i) Spearman’s correlation for regression modeling and (ii) random forest importance value, which corresponds to the influence of the variable individually and combined with the other predictive variables in our model [55].
In order to obtain the trend of potential OGT crown diameter, a quadratic model (Equation (3)) was used with quantile regression techniques. To assess goodness of fit, a 0.99 quantile was considered [56].
CD QR   0.99 =   β 0 +   β 1 Deq +   β 2 Deq 2
in which CDQR 0.99 refers to crown diameter, determined by quantile regression, in m; Deq, to the diameter measured 1.3 m above the soil in cm; and β 0 , β 1 , and β 2 , to estimated regression coefficients.
Then, the growth space of the sampled trees was estimated in hectares (Equation (4)):
GS = CD   QR   0.99   2   .   π 40000
in which GS refers to growth space in hectares, and CDQR 0.99, to crown diameter, determined by quantile regression, in m. Additionally, π was considered as 3.1416.
Moreover, the number of trees represented per hectare was also calculated (Equation (5)):
N / ha = 1 GS . Co
in which N/ha refers to the number of trees in hectares; GS, to growth space in hectares; and Co, to crown overlap, considering the correction for regular hexagonal spacing as 0.8660.
Finally, the basal area per hectare was estimated (Equation (6)):
G = (Deq2 π/40000). N/ha
in which G refers to the basal area in m2/ha; Deq, to the diameter measured 1.3 m above the soil in cm; and N/ha, to the number of trees per hectare.

2.5. Modeling of the Crown Diameter

CD was modeled using regression analysis (REG) as a function of size, crown shape, and site, considered independent variables via stepwise selection. Independent variables were used in their natural form (x) and subjected to quadratic (x2), inverse (1/x), and logarithmic [log(x)] transformations. Variables that were maintained in the model are significant at a 0.15 level in the F-test. Regression assumptions were also investigated [57].
CD was modeled via artificial neural networks (ANN) with a multilayer perceptron architecture (MLP). In setting the networks, a logistic activation function was used in the hidden layer and a linear function in the output layer and the resilient propagation learning algorithm (rprop+). In total, three neurons were added in the hidden layer for each variable inserted in the input layer. The neuralnet library was used to train the ANN [58]. The Supplementary Materials detail the ANN and R language algorithms used to predict OGT CD via our trained ANNs.
Support vector machine (SVM) is an algorithm that finds an appropriate line in a high dimension (called a hyperplane) to fit the data. The hyperplane is defined by a kernel function [59]. To model the CD with SVM support, an EPS-type regression and a linear kernel function were used. SVM models were trained via the e1071 library [60].
Random forest (RF) is an algorithm formed by a group of decision trees via bagging [61]. Bagging randomly creates a chosen number of training data subsets, in which decision trees are trained. RF output consists of the average of decision tree predictions [62].
CD was RF-modeled with the randomForest library [63]. Number of trees was defined when an error stabilization trend occurred and included a minimum of three and a maximum of eight terminal nodes. The number of input variables matched the number of variables randomly sampled in the division of nodes.

2.6. Selecting the Best Models

The following equations were used to assess the performance of the adjusted/trained models, in which the most appropriate is the one that showed the highest coefficient of determination (R2) (Equation (7)), the lowest root-mean-square (RMSE) (Equation (8), the mean absolute errors (MAE) (Equation (9) and the mean percentage absolute error (MAPE) (Equation (10)). Finally, a regular and good waste distribution graphic was also adopted.
R 2 = 1 i = 1 n y i y ^ i 2 i = 1 n y i y ¯ 2
RMSE = i = 1 n y i y ^ i 2 n
MAE = i = 1 n y i y ^ i n
MAPE   = 1 n   i = 1 n y i y ^ i y i × 100
in which R2 refers to the coefficient of determination; RMSE, to the root-mean-square error; MAE, to the mean absolute error; MAPE, to the mean absolute percentage error; y i   , to the observed values; y ^ i , to estimated values; y   ¯ , to the average of observed values; and n, to the number of observations.
Figure 4 shows a flowchart of the adopted methodology. The statistical program R, version 4.0.3 (http://cran.r-project.org, accessed on 1 October 2021), was used in all statistical analyses.

3. Results

3.1. Characteristics of Measured Trees

We identified a total of 60 species belonging to 30 botanical families (Table S1). The most common species were Qualea grandiflora Mart., Bowdichia virgilioides Kunth, Caryocar brasiliense Cambess., Plathymenia reticulata Benth., and Myrsine gardneriana A.DC., with 25, 17, 13, and—for the last two species—11 individuals, respectively. Interestingly, we only failed to identify five trees (IN).
The measured trees showed heterogenous dendrometric dimensions, crowns, and sites (Table 2). The diameters at the D03 (±29.7 cm) and D07 (±26.8 cm) positions showed the highest standard deviation in relation to the Deq (±25.3 cm) measured at 1.3 m above the soil.
Our sample showed an average 3.3 m CBH; a 25.2 m H amplitude (with a 9.5 m mean and a ± 5.0 m standard deviation); a 6.2 m CL (6.2 m); and a 7.1 m CD. The other qualitative crown and site variables differed reasonably.
Open growth, with a greater incidence of light and no competition for resource availability, explains the variations in the dendro-morphometric relations in our sample (Figure 3).

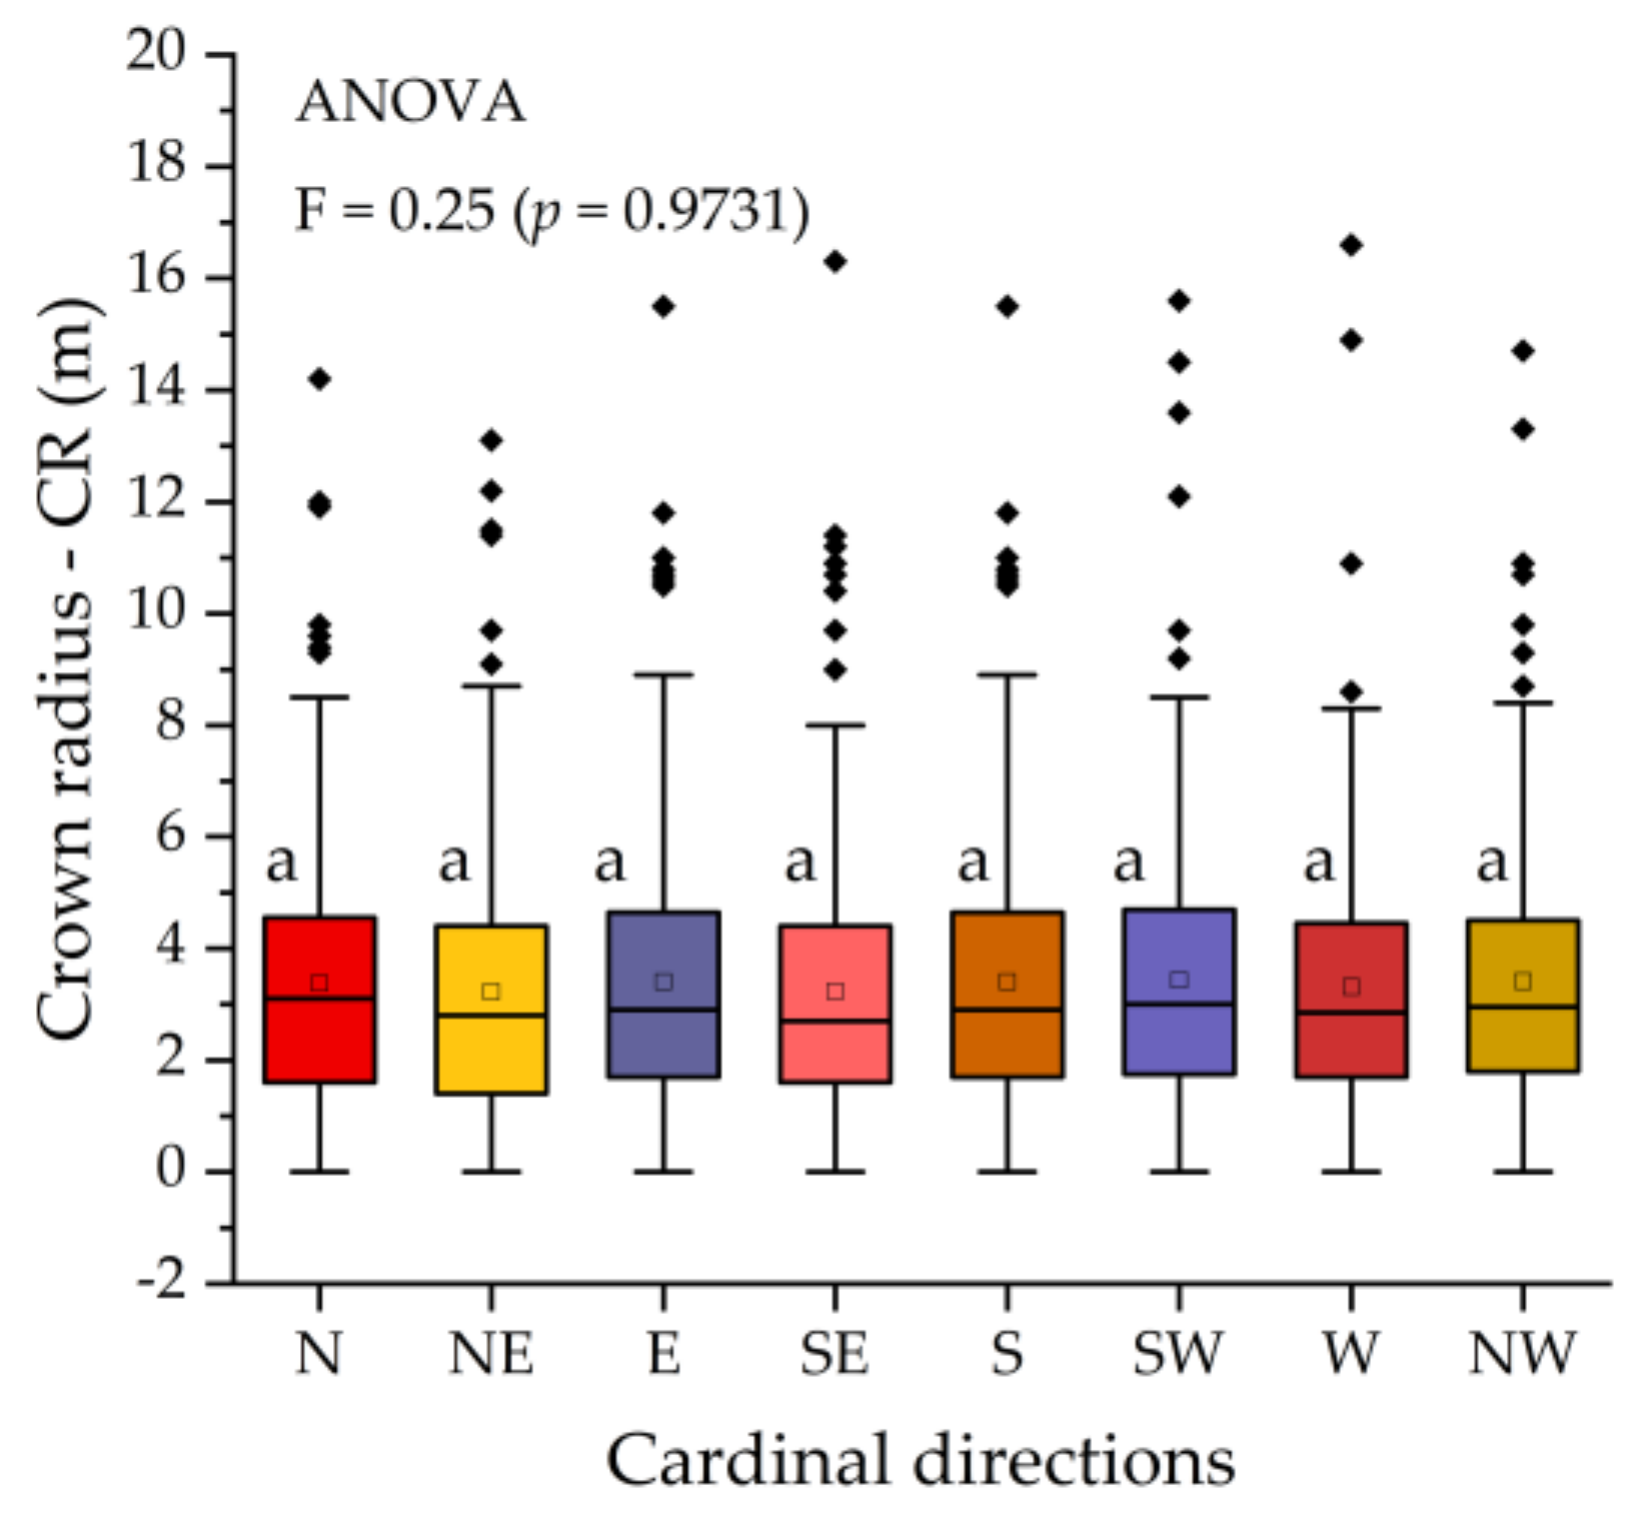
3.2. Crown Radius Variations between Cardinal Directions

Variance analysis showed no statistically significant differences between groups (F = 0.25; p = 0.9731) and average crown radii (values with the letter “a”—according to the Tukey test) according to their cardinal positions (Figure 5).
Therefore, we found no evidence of the systematic alteration of crown radii in any cardinal position (i.e., the effect of luminosity). We should emphasize that we ignored the assessment of the influence of crown radii according to species due to the low frequency and representativeness of the evaluated trees following their diametric distribution—an evaluation beyond the scope of this study.

3.3. Selection of Important Variables

The Spearman correlation between CD and variables such as size, crown shape, and site were [Deq (ρ = 0.867; p < 0.0001); D03 (ρ = 0.860; p <0.0001); D07 (ρ = 0.854; p < 0.0001); CL (ρ = 0.792; p < 0.0001); H (ρ = 0.787; p < 0.0001)—high]; [CBH (ρ = 0.477; p < 0.0001) e CGS (ρ = −0.344; p < 0.0001)—moderate]; [VT (ρ = −0.179; p = 0.0379); BA (ρ = −0.153; p = 0.0760); ST (ρ = −0.017; p = 0.8482); and PR (ρ = 0.002; p = 0.9835)—low] (Table 3).
RF showed the following sequence of variable importance with a value > 0.2: Deq (1.000); D03 (0.860); CL (0.768); D07 (0.707); CBH (0.415); H (0.407); and CGS (0.219). BA (0.123); VT (0.095); PR (0.056); and ST (0.038) were the variables which showed a value r < 0.2 (Table 3).
Thus, we can confirm that the quantitative size (D03; D07; Deq; H; CBH; and CL) and qualitative crown shape variables are the most important for modelling CD, whereas qualitative variables reflecting current crown (BA and VT) and site (PR and ST) conditions in which the trees were sampled showed only slightly influence from our model.

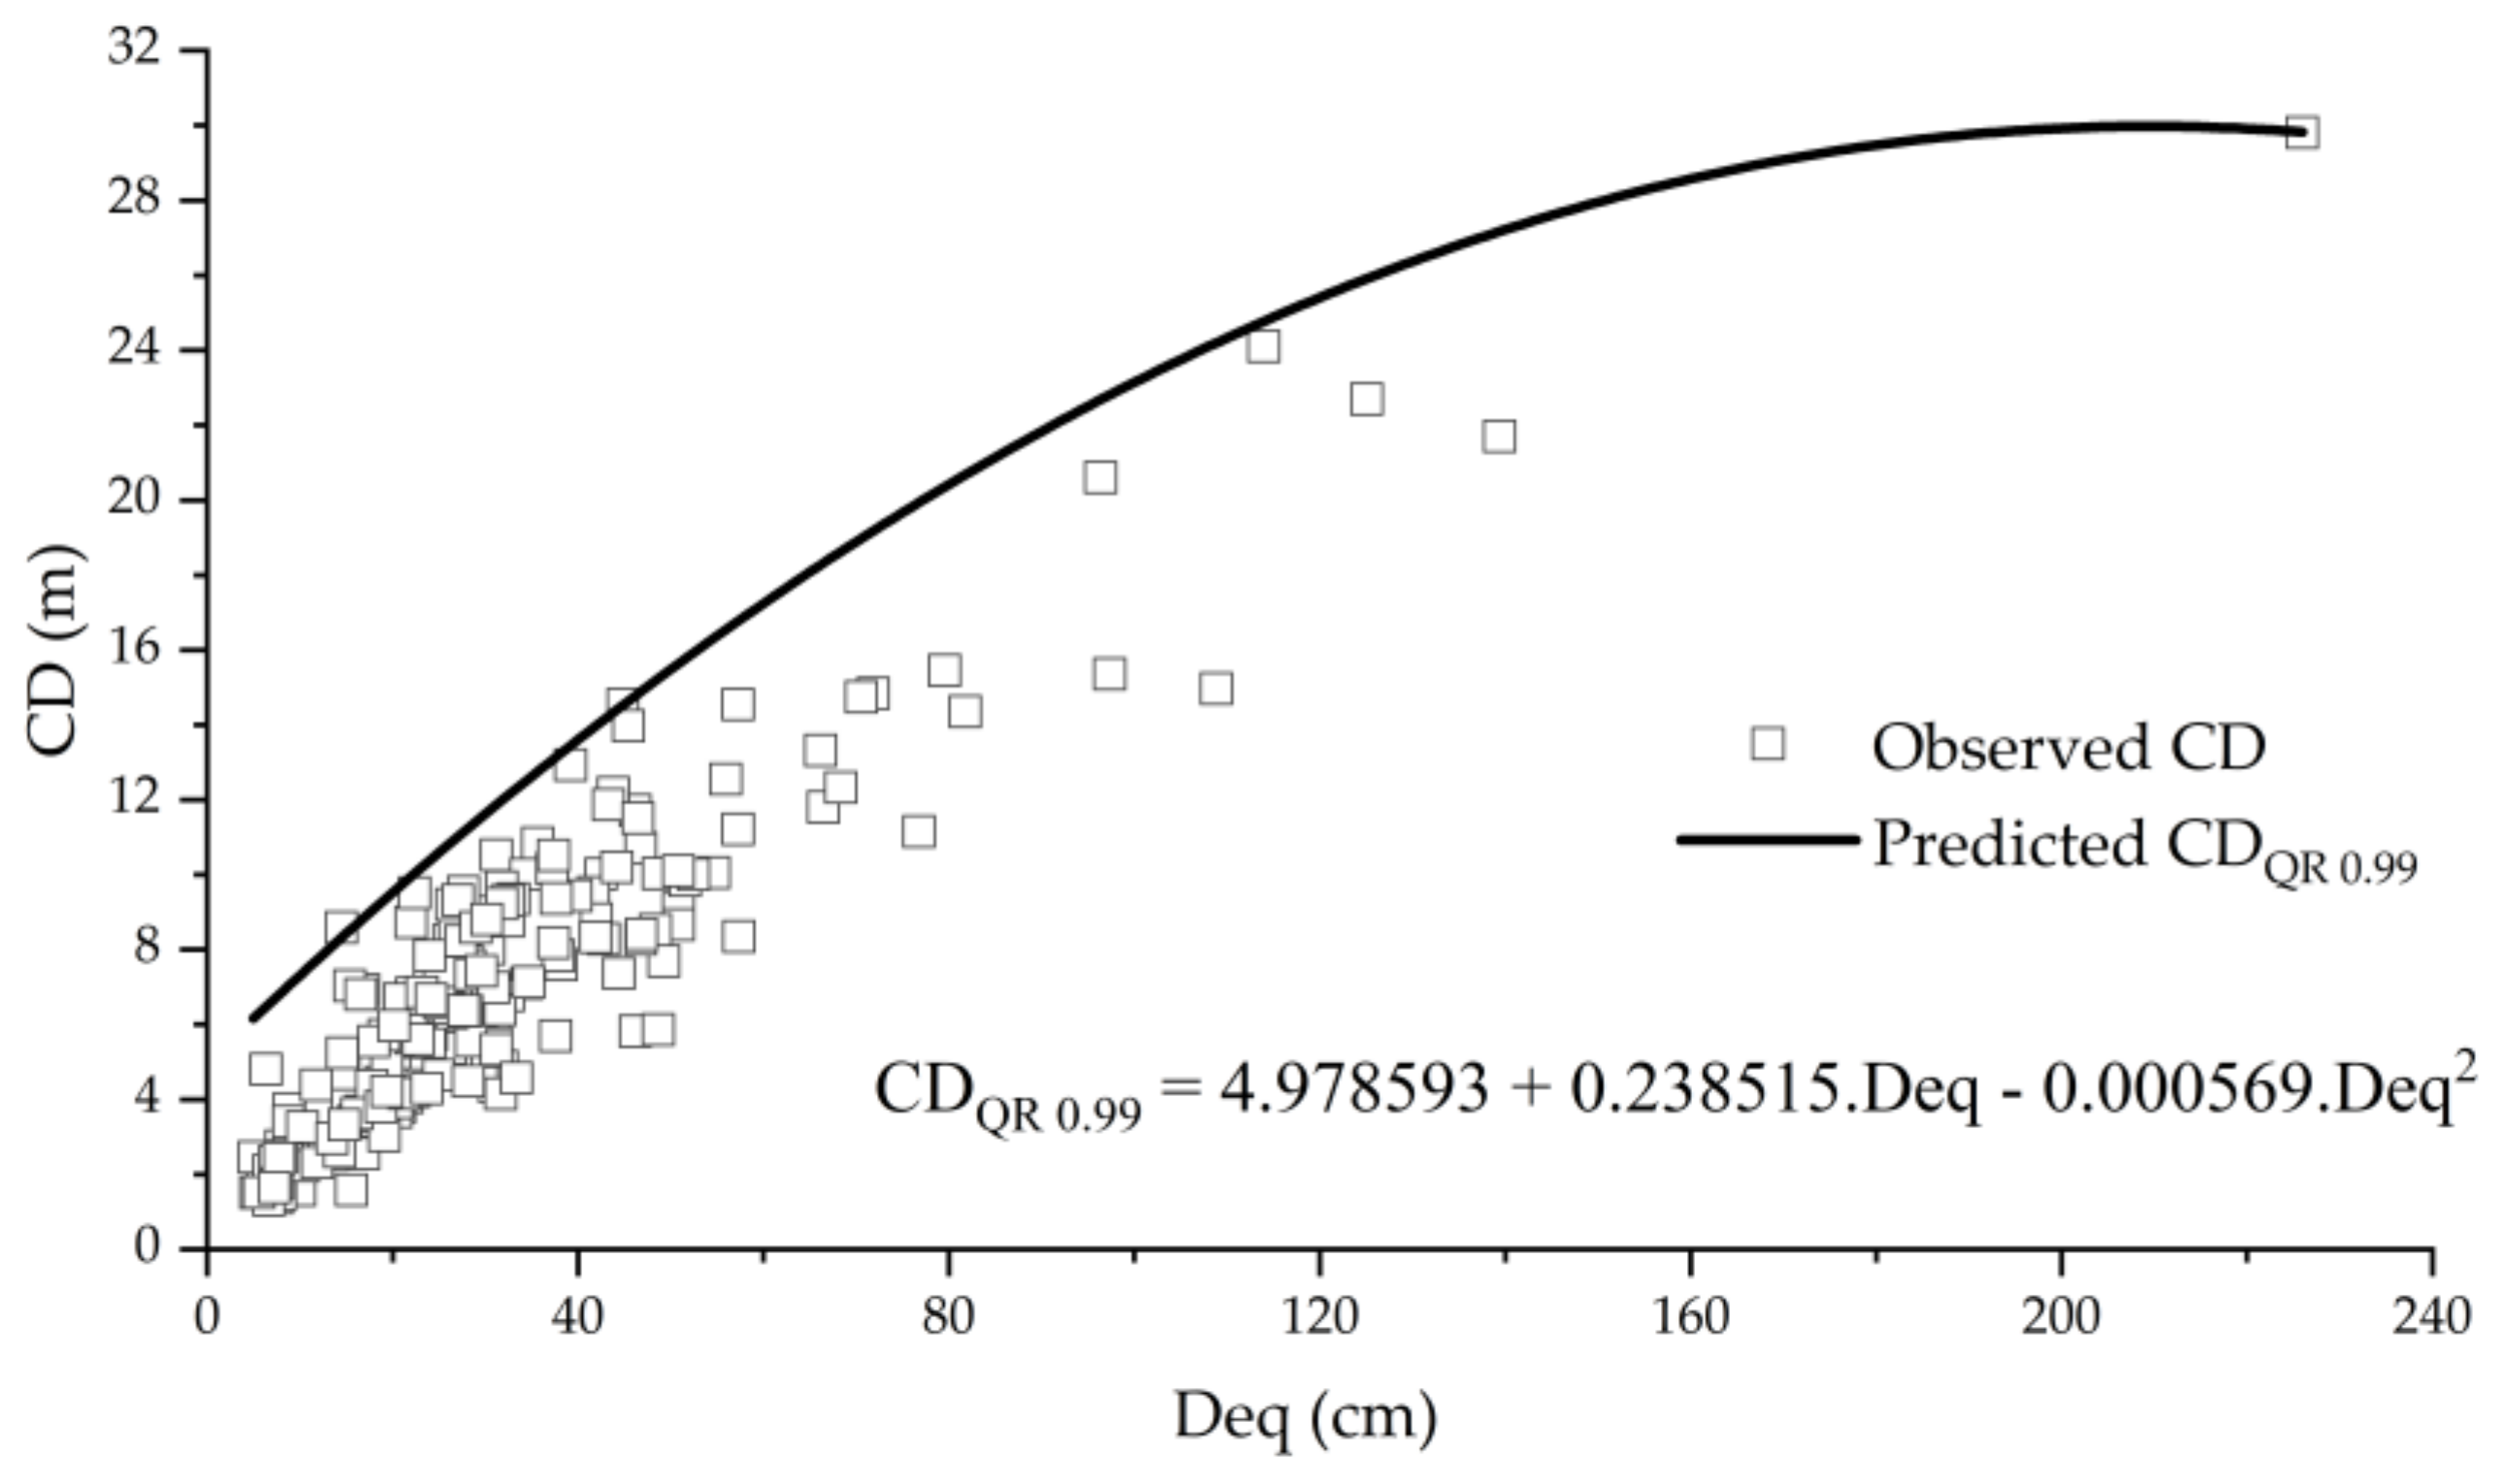
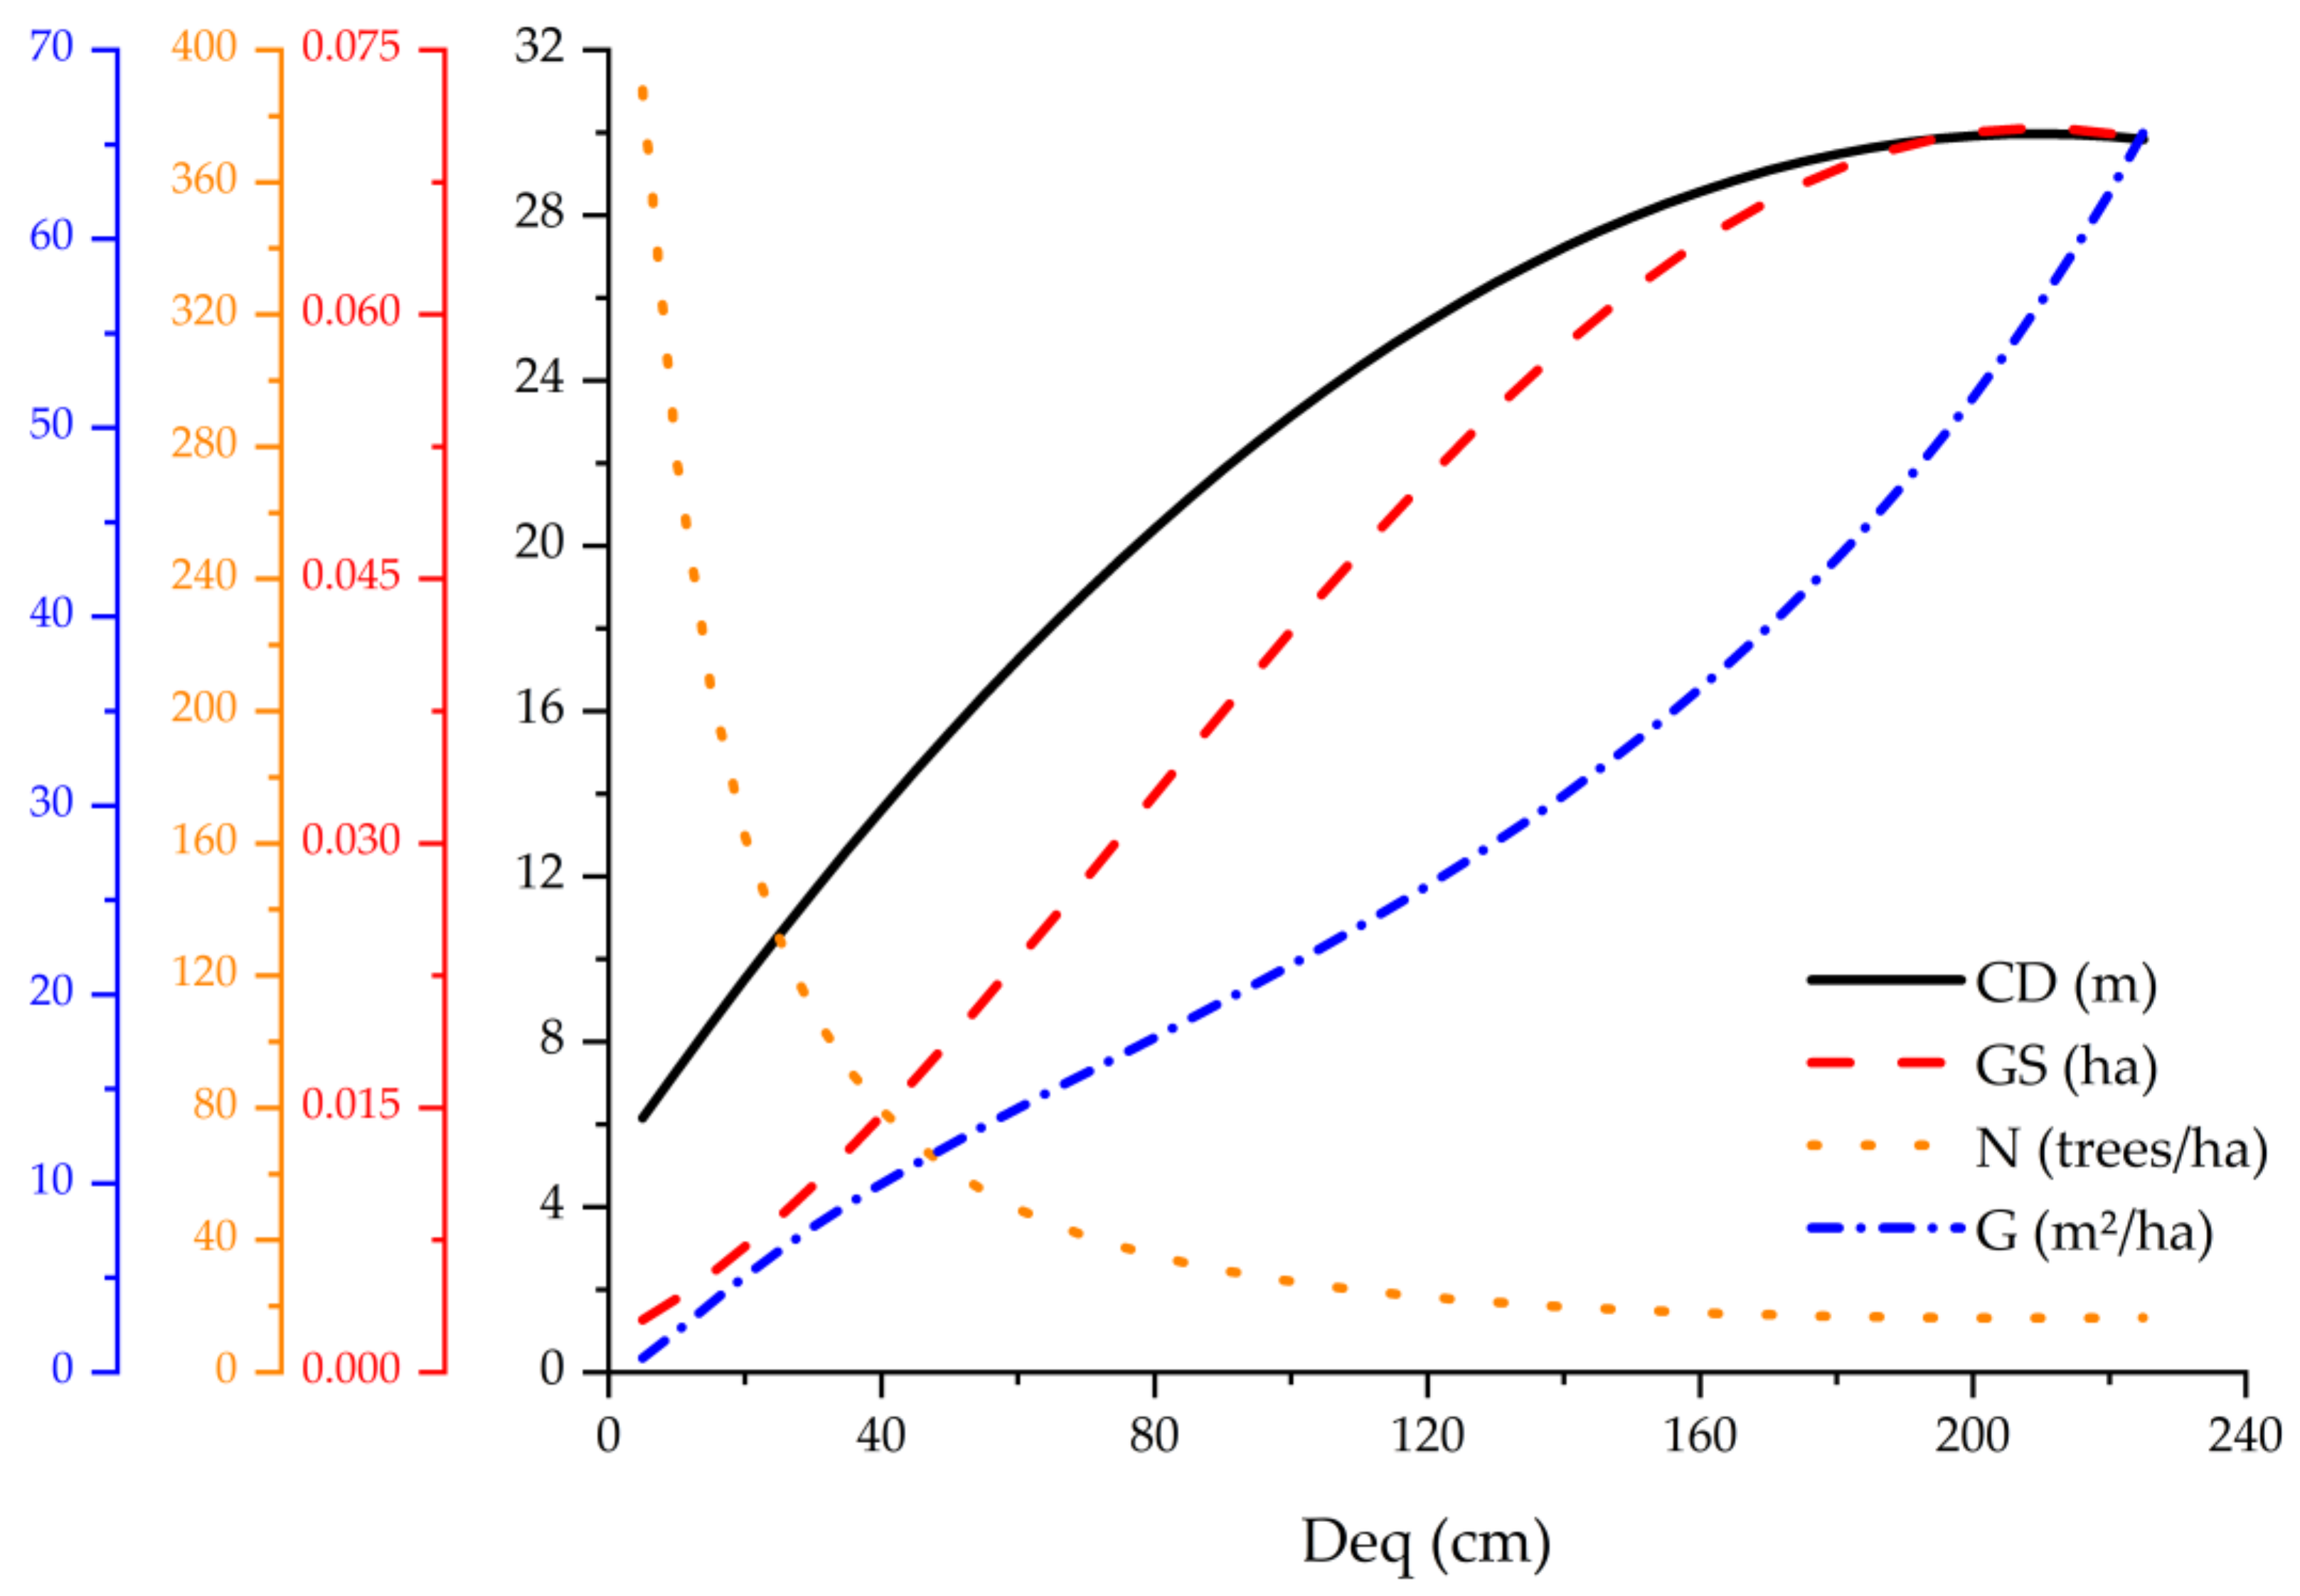
3.4. Crown Diameter Potential

By adjusting our model via regression quantification, we can determine the quadratic trend of potential crown diameter, considering a 0.99 quantile (Figure 6). This equation enables adequate silvicultural strategies for OGT in the Cerrado under environmental conditions resembling the ones in this study.
The maximum extreme point of the equation was CD–QR 0.99 [Deq = 209.6 cm; CD = 29.97 m]. From this diameter equivalent, potential crown diameters tend to slightly decrease.
The largest tree sampled belongs to the botanical family Lecythidaceae and the species Cariniana estrellensis (Raddi) Kuntze, with a 29.80 m CD (Figure 7a) and a 226.0 cm Deq (Figure 7b).
Figure 8 shows the individual trees with potential CD dimensions—CDQR 0.99 (m) we used to determine necessary grown space—GS (ha), number of trees—N (trees/ha), and basal area (m2/ha). For instance, these trends are extremely important for foresters seeking the ideal CD to maximize the productivity of individual OGT in proper stands.

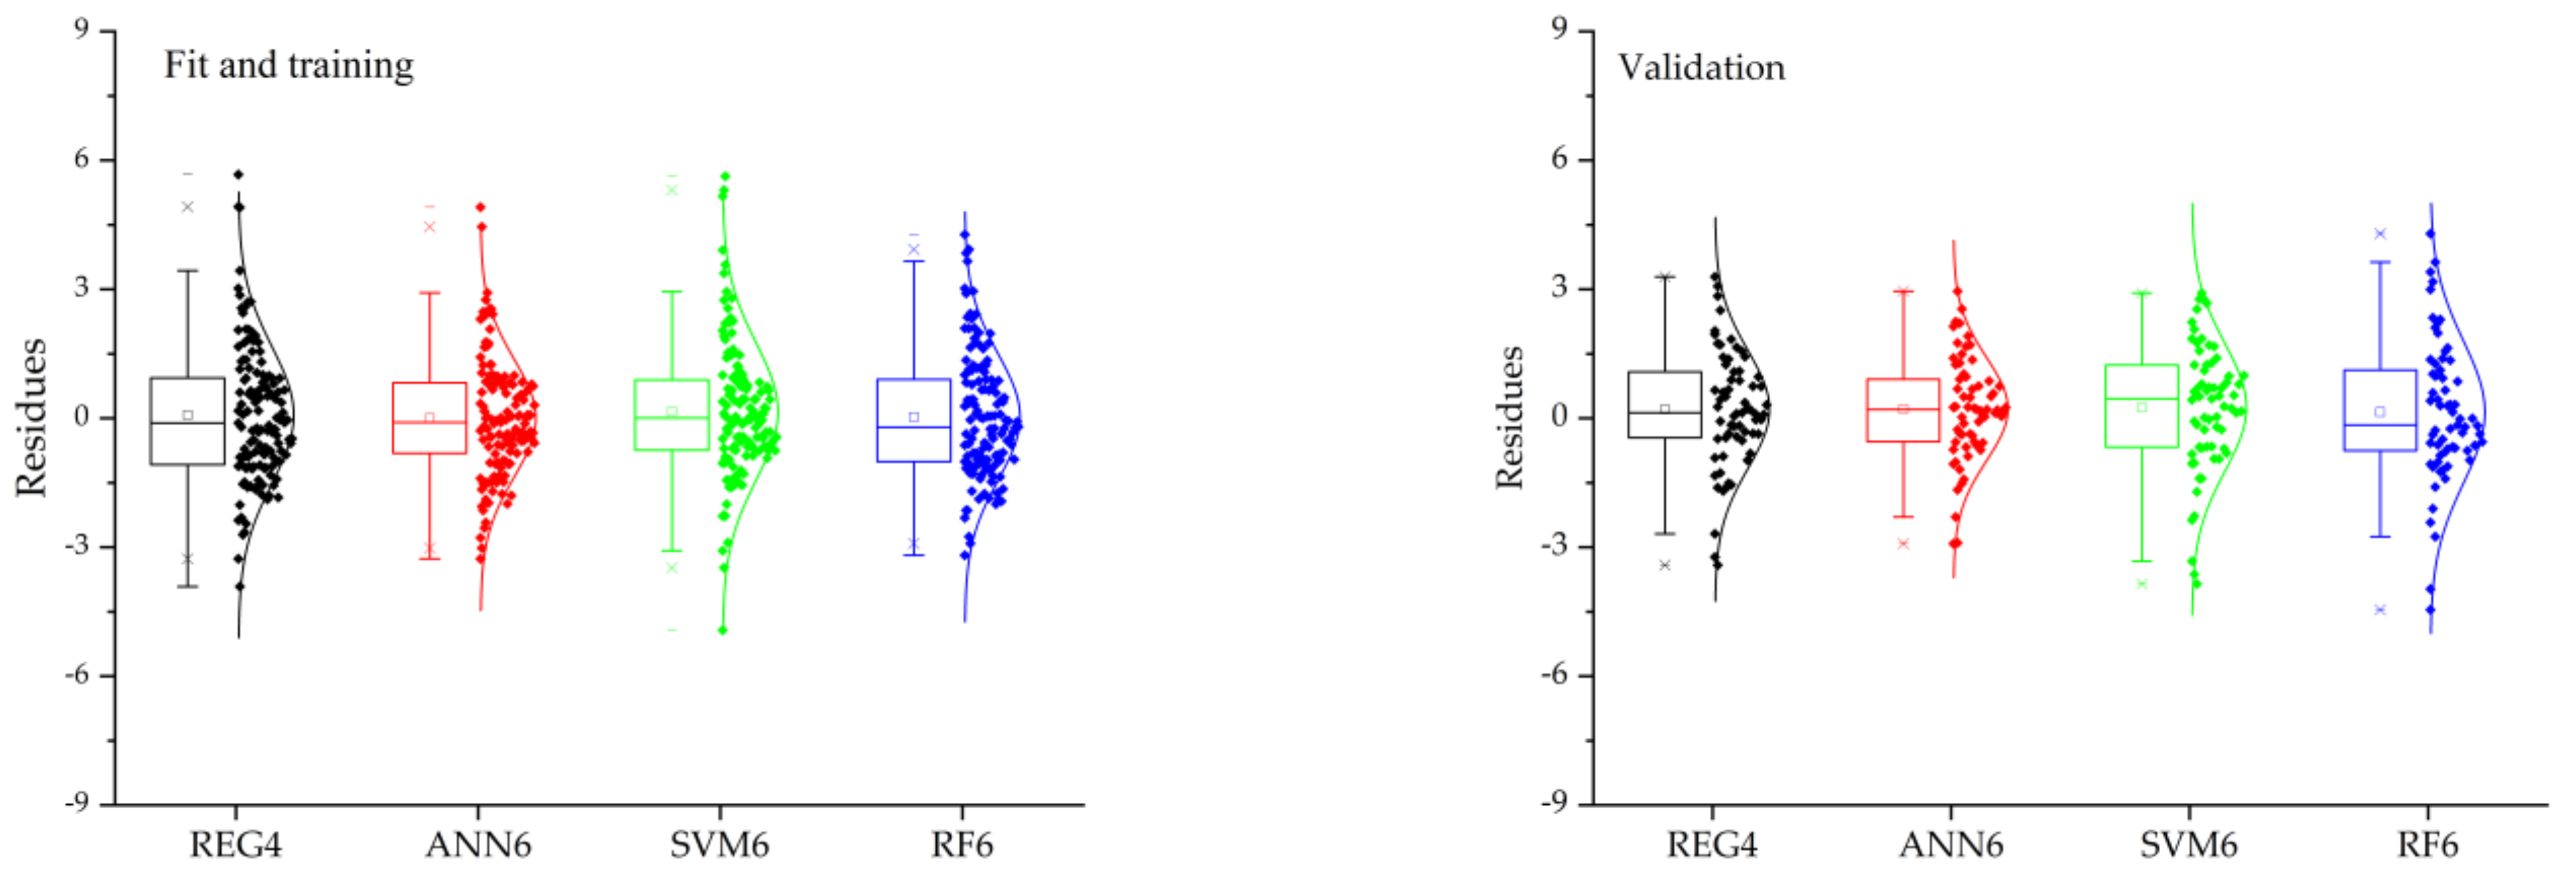
3.5. Evaluation of the Regression Analysis and Machine Learning Techniques to Predict Crown Diameter

All adjusted regression equations showed significant coefficients (p < 0.05) (Table 4). Adding the Deq, CL, and CGS variables and the quadratic term—Deq2 (REG4) increased adjustment (↑ ≈ 6%—R2) and precision (↓ ≈ 0.30 m—RMSE; ↓ ≈ 0.24—MAE), when compared to the model with only the Deq variable (REG1). The performance evaluation of these equations with validation data showed increased adjustment (↑ ≈ 7%—R2) and precision (↓ ≈ 0.33 m—RMSE; ↓ ≈ 0.31—MAE).
Table 5 shows the values we obtained by training and validating the models developed via machine learning techniques. Among the six employed models, we found that RF1-5 was superior to SVM1-5 and ANN1-5. However, comparing its estimates with validation data, we found that RF1-5 performed more poorly than ANN1-5. The ANN6 model showed greater precision and accuracy in both training and validation sets.
Adding the Deq, D03, CL, D07, CBH, and CGS variables to the training of the neural networks (ANN6) increased their adjustment (↑ ≈ 5%—R2) and precision (↓ ≈ 0.36 m—RMSE; ↓ ≈ 0.30—MAE), compared with the model with only the Deq variable (ANN1) (Table 5). The performance of these models with validation data also showed increased adjustment (↑ ≈ 6%—R2) and precision (↓ ≈ 0.35 m—RMSE; ↓ ≈ 0.28—MAE).
The analysis of residuals using regression (REG) and machine learning (ANNs; SVM and RF) techniques, as the box plots show (Figure 9), enabled us to select and compare with greater confidence the estimates of the developed crown diameter models (Table 4 and Table 5).
In most developed models, RF showed better statistical criteria during training than other techniques (ANN and SVM) (Table 5). However, analyzing their residuals with validation data showed that its estimates were inferior to ANN6 ones (Figure 9).
When we evaluated REG4 residuals with SVM6 and RF6 ones, we found the superiority of the former in estimates with validation data (Figure 9). Thus, we can claim that ANN models showed better generalization than the other techniques, more accurately estimating CD in Cerrado OGT.

4. Discussion

The OGT species we sampled have characteristics that make them important for different purposes. Qualea grandiflora was the most representative species in this study. Folk medicine uses its bark to fight inflammatory diseases and gastrointestinal problems and even to prevent ulcers [64]. Interestingly, the second most frequent species was Caryocar brasiliense, whose fleshy fruit is widely consumed and sold in the region. It is rich in carotenoids and antioxidants, which are important to prevent degenerative diseases [65]. Despite the importance of its seed for the pharmaceutical industry, the literature knows little about its sustainable management [66].
Some of the fruit species we found have important nutritional values, such as vitamin C in Eugenia dysenterica (Mart.) DC., Hancornia speciosa, and Solanum grandiflorum Ruiz & Pav., as well as flavonoid-rich Annona crassiflora Mart. and Hymenaea stigonocarpa Mart. ex Hayne [67]. The bark of Lafoensia pacari subsp. cuneifolia (Klotzch ex Koehne) and Bowdichia virgilioides Kunth show antimicrobial properties with potential medical use [68]. Moreover, local populations widely use and greatly value other species.
Despite such importance, the biodiversity of the Cerrado is still poorly studied, preventing us from knowing how the advance of human activity into the biome over the past decades threaten these species [69]. Moreover, detailing plant populations enables mathematical models that can help recover and manage such species, considering possible future environmental changes [70].
Studies have used RF to show variable importance. By selecting its variables, the method shows an advantage over correlation ones by individually and concurrently evaluating variable influence [55]. Forest science has also employed the technique in prognoses of forest production via machine learning [71] and via a comparative method approach to estimate machine productivity in wood cutting [72].
Quantitative variables are important since some not only benefit models but can also more easily and quickly collect information than quantitative variables. As for CGS, it can be visually defined easily in the field during data collection and was the most important categorical variable in this study.
The method we used to measure crown radii proved to be efficient since the sampled trees showed regular crown distribution in all cardinal positions. Research has used this method, which measures eight crown radii in reference to their cardinal positions, to measure crown size and the growing space requirements of common tree species in urban centers, parks, and forests [21], to study the relation between crown radius and diameter at breast height [27], and to contribute structural indices to model Sitka spruce (Picea sitchensis) and birch (Betula spp.) crowns [73].
Previous research has shown that a greater number of radii (entailing higher cost and time resources) can better detailed asymmetric crowns [22]. To obtain better estimates, high-resolution images acquired by UAV or LIDAR have enabled research to describe all crown shape variations [74].
Quantile regressions enable us to estimate potential CD, i.e., this technique, which uses maximum trends, can produce projections of the area tree crowns occupy in the Cerrado (Figure 7). Crown estimates can develop growth, increment, tree vigor, and population density models [75]. Moreover, studies may draw management diagrams, providing valuable information to aid silvicultural practices, as they enable agents to know the maximum density sites can support [12]. Such initiatives are strongly encouraged in rural properties in the Cerrado, enabling the connectivity of forest fragments by using the legal reservoirs proposed in the current Brazilian Forest Act. Furthermore, such initiatives could be promoted by targeting rural properties with conservation-based agroecosystems [76] and in watersheds as research units [77].
Our regression techniques showed satisfactory performances, albeit inferior to machine learning ones, which conferred greater accuracy to models (Table 4 and Table 5). REG4 is a simple and robust model that met our assumptions of regression, normality, homoscedasticity, and independence of residuals. These assumptions are important for a valid regression coefficient inference [78].
Despite having more straightforward applications than more sophisticated techniques, regression models show some limitations in their use, especially in cases in which data lack a normal distribution. Another limiting factor is its use of qualitative variables since inserting many variables can generate collinearity, influencing its prediction capacity and biasing the model [79].
Previous research has used linear and quadratic regressions to predict tree crown diameter in urban areas. Silver birch obtained a higher adjusted R2 (≈0.85) via quadratic regression [80]. Another study employed linear regressions to determine crown diameter, measured via high-resolution images obtained by UAVs, in which the estimates obtained 0.63 and 0.85 R2, respectively [81].
Machine learning techniques generally show superior performance since native species have greater data variability due to their characteristics. Machine learning modeling, especially with the insertion of qualitative variables, enables a deeper exploration of this variability than regression techniques, resulting in more accurate estimates [30].
Machine learning techniques, such as ANN, enable forest modeling using biotic and abiotic characteristics that influence its response variable, such as inserting environmental variables that can improve the generalizability of the model [82]. Furthermore, qualitative variables are generally faster to measure than quantitative variables.
ANN showed high performance during training and validation in this study (Table 5). The technique enables us to recognize patterns and extract information using a large number of predictive quantitative and qualitative variables, an advantage of its use, which provides accurate estimates [83]. In this study, ANN6, with the insertion of qualitative variables, showed the best performance in this study (Table 5).
An important parameter to set ANN is applying the sigmoid activation function (widely used in shallow networks) to its hidden layers. Its advantages include its easy understanding and good ability to solve binary problems and model logistic regressions [84]. Moreover, the function is continuously differentiable and confers non-linearity and greater complexity to the network, improving the capacity of ANN to map complex problems [85]. However, other activation functions have their own characteristics and advantages that could be tested, such as rectified linear units, leaky rectified linear units, exponential linear units, and Softmax [86].
Another important parameter in ANN is the number of neurons in the hidden layer. A higher number of neurons can improve the accuracy of training data but could overfit test data. Some methods define the adequate number of neurons in the hidden layer, such as Fletcher–Gloss [87] and Sheela and Deepa [88], among many others.
Other studies showed similar results, training ANN to estimate the height of Eucalyptus trees. To reduce sampling intensity, ANN trained with quantitative and qualitative variables and a clone in their input layers showed the best performance, meeting the objective of the study [89]. Furthermore, research has used ANN to predict the commercial volume of Eucalyptus clones by assessing region, farm (for each region) and clone group, increasing the accuracy of the predictions in the study [90].
SVM performed well in this study, albeit less than the other techniques. It is a robust technique with a good generalization capability, especially with nonlinear data, due to the kernel trick. It can be used for classifications and regressions and is widely used to work with remote sensing for hyperspectral image processing [91].
To achieve accurate estimates using SVMs, it is important to correctly define the used kernel function [92], which aims to transform the input data into a new space in a higher dimension for better interpretation [93]. Although kernel functions have their particulars and a hyperplane for data separation, each is better adapted to certain tasks. Thus, this study used the linear kernel function as it showed a greater data modeling capacity (Table 5). Other widely used kernels functions are polynomial, radial basis, and sigmoid ones [94].
Research has used SVMs with a radial basis function kernel to predict the volume of Eucalyptus spp. trees. The technique showed a satisfactory performance, obtaining a ≈0.98 correlation between estimated and observed values [95]. Studies have used SVM to predict the stand volume of a Eucalyptus plantation via satellite images, finding that the techniques employing a radial basis function kernel show accurate estimates [96].
We can use RF to solve classification and regression problems. The algorithm dispenses with meeting assumptions between explanatory variables and responses and can analyze non-linear and hierarchical data using a large volume of data [97].
In this study, RF performed well in training but poorly during validation (Table 5). Thus, the algorithm may fail to provide predictions as accurate as other studied algorithms if studies use new datasets. Since validation data aim to assess the generalizability of the model given external data [98], the method may perform poorly. Graphic analyses of residuals attest to its inferior performance during validation, showing the importance of observing metrics and residuals to select the best algorithm (Figure 9).
An important parameter for RF is its number of trees. In some cases, a high number of trees can cause noise in the model, resulting in overfit and decreasing its accuracy [99]. After a specific number of trained trees, error rates converge to a certain value. Moreover, a small number of trees may make the RF more efficient but increasing the number of trees will fail to improve its accuracy and will demand more training time [100].
Studies have used RF to estimate forest structural attributes, aboveground biomass, basal area, stem density, and volume via UAV-LiDAR data [101], as well as to predict canopy nitrogen content in citrus trees via spectral vegetation indices from UAV imagery, proving it is a potential tool to perform the task [102].
Other authors have compared machine learning techniques in their forest science studies. Research has used SVM, modified regression trees, and RF to estimate the height of a forest stand via data obtained by LiDAR, failing to find any statistical difference in technique performance [103]. Other research has also employed SVM, RF, K-nearest neighbor, and stochastic gradient boosting to estimate aboveground biomass on the basis of Landsat images. RF performed better, according to RMSE and R2 [104]. Finally, authors have used ANN, RF, and SVM to model the increment in diameter of individual trees on Atlantic Forest fragments [36].
Some authors used models to perform crown modeling: diameter at the breast height was used to predict the crown width in a Natural Even-Aged Black Pine Forest, where the power regression model was the best model showing an RMSE of 1.12 in the fit [11]. Regressions were used to model crown area using diameter at breast height at a mixed-araucaria natural forest in the mid-southern, and the best regression presented an R2 of 0.68 in the fit [105].
Thus, we need more studies on Cerrado OGT species to better evaluate their growth characteristics. The accuracy inserting categorical variables can provide, associated with the use of sophisticated machine learning techniques, such as ANN, is valuable and can significantly reduce field measurement costs. Moreover, forthcoming research can also explore a wider range of qualitative variables related to tree characteristics, site, and climate. Such initiatives are needed since savanna environments are currently suffering from the expansion of agriculture, and the resulting loss and fragmentation of original habitats require sustainability initiatives [76,106].
Although ANN, SVM, and RF were used in the present study, several other ML techniques are suggested in future studies. Furthermore, the performance difference between the ML models in this study underscores the importance of testing and exploring new techniques. However, since the performance may vary, it is extremely important to study and compare different techniques, including other datasets and environments.
Only 200 trees were sampled due to a lack of financial resources and availability of properties with sample areas that have OGTs. In this way, a larger sample universe is recommended since, in this way, it is possible to have a greater representation of the characteristics of the species, and the trained models may have a more remarkable ability to generalize.

5. Conclusions

Our study encompasses 60 species native to the Cerrado, many of which are recognized as substantially valuable to local peoples due to their diverse usability. However, we found no variation in crown radius length according to their cardinal positions.
The quantitative size and qualitative crown geometric shape variables are the most important in modeling crown diameter. Moreover, potential CD trends via quantile regression can assess the growth and competition of Cerrado species.
OGT CD modeling via ANN produced the most accurate results (with the following validation statistics: R2 = 0.90, RMSE = 1.21, MAE = 0.93, and MAPE = 16.25), showing efficiency and generalizability for highly variable and complex environments, such as the Cerrado biome.
The models we developed are sources for parameters that can model growth and competition and monitor trees. Such information may subside forest management practices for native species in the Cerrado biome in agreement with the current Brazilian Forest Act, supporting rural properties as they are established as legal reservoirs.
Furthermore, the results of the present study demonstrate the importance of future studies in the Cerrado exploring different ML techniques and different tree variables, mainly the categorical ones.

Supplementary Materials

The following supporting information can be downloaded at https://www.mdpi.com/article/10.3390/f13081295/s1, Table S1. Botanical identification of open-grown-trees in the Cerrado Biome. Table S2. Growth space considering the size of the potential crown diameter in open-growing trees. Table S3. Parameters (synaptics weights and biases) of the ANNs selected to describe the crown diameter of open-grown-trees in the Cerrado Biome. A brief description of the adopted procedures for the artificial neural networks (ANNs) and a copy of the main script using R is also provided. References [107,108] are cited in the supplementary materials.

Author Contributions

Conceptualization, G.F.B. and E.A.C.; methodology, G.F.B. and E.A.C.; software, G.F.B. and E.A.C.; validation, G.F.B. and E.A.C.; formal analysis, G.F.B. and E.A.C.; investigation, G.F.B. and E.A.C.; resources, G.F.B., E.A.C., C.A.G.F., V.L. and P.d.C.B.; data curation, G.F.B. and E.A.C.; writing—original draft preparation, G.F.B. and E.A.C.; writing—review and editing, G.F.B., E.A.C., C.A.G.F., V.L. and P.d.C.B.; visualization, G.F.B., E.A.C., C.A.G.F., V.L. and P.d.C.B.; supervision, E.A.C.; project administration, G.F.B. and E.A.C.; funding acquisition, C.A.G.F., V.L. and P.d.C.B. All authors have read and agreed to the published version of the manuscript.

Funding

CNPq (Conselho Nacional de Desenvolvimento Científico e Tecnológico; 317538/2021-7, 436863/2018-9), CAPES (Coordenação de Aperfeiçoamento de Pessoal de Nível Superior; Finance Code 001), FAPESC (Fundação de Amparo à Pesquisa e Inovação do Estado de Santa Catarina; 2017TR1762, 2019TR816), and FAPEMIG (Fundação de Amparo à Pesquisa do Estado de Minas Gerais).

Institutional Review Board Statement

Not applicable.

Informed Consent Statement

Not applicable.

Data Availability Statement

Data may be available under request.

Acknowledgments

We thank the owners of the rural properties for the access to the study areas.

Conflicts of Interest

The authors declare no conflict of interest.

References

  1. De Oliveira, V.A.; de Mello, C.R.; Beskow, S.; Viola, M.R.; Srinivasan, R. Modeling the effects of climate change on hydrology and sediment load in a headwater basin in the Brazilian Cerrado biome. Ecol. Eng. 2019, 133, 20–31. [Google Scholar] [CrossRef]
  2. Barbieri, A.R.; Szabó, M.P.J.; Costa, F.B.; Martins, T.F.; Soares, H.S.; Pascoli, G.; Torga, K.; Saraiva, D.G.; Ramos, V.N.; Osava, C.; et al. Species richness and seasonal dynamics of ticks with notes on rickettsial infection in a Natural Park of the Cerrado biome in Brazil. Ticks Tick-Borne Dis. 2019, 10, 442–453. [Google Scholar] [CrossRef] [PubMed]
  3. De Miranda, S.D.C.; Bustamante, M.; Palace, M.; Hagen, S.; Keller, M.; Ferreira, L.G. Regional Variations in Biomass Distribution in Brazilian Savanna Woodland. Biotropica 2014, 46, 125–138. [Google Scholar] [CrossRef]
  4. Morandi, P.S.; Marimon, B.S.; Marimon-Junior, B.H.; Ratter, J.A.; Feldpausch, T.R.; Colli, G.R.; Munhoz, C.B.R.; Júnior, M.C.D.S.; Lima, E.D.S.; Haidar, R.F.; et al. Tree diversity and above-ground biomass in the South America Cerrado biome and their conservation implications. Biodivers. Conserv. 2018, 29, 1519–1536. [Google Scholar] [CrossRef]
  5. Loram-Lourenço, L.; Farnese, F.D.S.; de Sousa, L.F.; Alves, R.D.F.B.; De Andrade, M.C.P.; Almeida, S.E.D.S.; Moura, L.M.D.F.; Costa, A.C.; Silva, F.G.; Galmés, J.; et al. A Structure Shaped by Fire, but Also Water: Ecological Consequences of the Variability in Bark Properties Across 31 Species from the Brazilian Cerrado. Front. Plant Sci. 2020, 10, 1718. [Google Scholar] [CrossRef]
  6. Roque, M.P.B.; Neto, J.A.F.; de Faria, A.L.L.; Ferreira, F.M.; Teixeira, T.H.; Coelho, L.L. Effectiveness of Arguments Used in the Creation of Protected Areas of Sustainable Use in Brazil: A Case Study from the Atlantic Forest and Cerrado. Sustainability 2019, 11, 1700. [Google Scholar] [CrossRef]
  7. Nunes, A.R.; Rodrigues, A.L.M.; de Queiróz, D.B.; Vieira, I.G.P.; Neto, J.F.C.; Junior, J.T.C.; Tintino, S.R.; de Morais, S.M.; Coutinho, H.D.M. Photoprotective potential of medicinal plants from Cerrado biome (Brazil) in relation to phenolic content and antioxidant activity. J. Photochem. Photobiol. B Biol. 2018, 189, 119–123. [Google Scholar] [CrossRef]
  8. Bechtold, W.A. Crown-Diameter Prediction Models for 87 Species of Stand-Grown Trees in the Eastern United States. South. J. Appl. For. 2003, 27, 269–278. [Google Scholar] [CrossRef]
  9. Hasenauer, H. Dimensional relationships of open-grown trees in Austria. For. Ecol. Manag. 1997, 96, 197–206. [Google Scholar] [CrossRef]
  10. Foli, E.; Alder, D.; Miller, H.; Swaine, M. Modelling growing space requirements for some tropical forest tree species. For. Ecol. Manag. 2003, 173, 79–88. [Google Scholar] [CrossRef]
  11. Raptis, D.; Kazana, V.; Kazaklis, A.; Stamatiou, C. A Crown Width-Diameter Model for Natural Even-Aged Black Pine Forest Management. Forests 2018, 9, 610. [Google Scholar] [CrossRef]
  12. Márquez-Linares, M.A.; Alvarez-Zagoya, R. Construcción de una guía de densidad para Pinus cooperi var. ornelasi con base en la clase de copa en Durango, México. Madera Y Bosques 1995, 1, 23–36. [Google Scholar] [CrossRef]
  13. Pretzsch, H. Trees grow modulated by the ecological memory of their past growth. Consequences for monitoring, modelling, and silvicultural treatment. For. Ecol. Manag. 2021, 487, 118982. [Google Scholar] [CrossRef]
  14. Getzin, S.; Wiegand, K.; Schumacher, J.; Gougeon, F.A. Scale-dependent competition at the stand level assessed from crown areas. For. Ecol. Manag. 2008, 255, 2478–2485. [Google Scholar] [CrossRef]
  15. Sharma, R.P.; Bílek, L.; Vacek, Z.; Vacek, S. Modelling crown width–diameter relationship for Scots pine in the central Europe. Trees 2017, 31, 1875–1889. [Google Scholar] [CrossRef]
  16. Fu, L.; Sharma, R.P.; Hao, K.; Tang, S. A generalized interregional nonlinear mixed-effects crown width model for Prince Rupprecht larch in northern China. For. Ecol. Manag. 2017, 389, 364–373. [Google Scholar] [CrossRef]
  17. Goodman, R.C.; Phillips, O.; Baker, T.R. The importance of crown dimensions to improve tropical tree biomass estimates. Ecol. Appl. 2014, 24, 680–698. [Google Scholar] [CrossRef]
  18. Lau, A.; Calders, K.; Bartholomeus, H.; Martius, C.; Raumonen, P.; Herold, M.; Vicari, M.; Sukhdeo, H.; Singh, J.; Goodman, R.C. Tree Biomass Equations from Terrestrial LiDAR: A Case Study in Guyana. Forests 2019, 10, 527. [Google Scholar] [CrossRef]
  19. Özçelik, R.; Diamantopoulou, M.; Brooks, J. The use of tree crown variables in over-bark diameter and volume prediction models. Iforest Biogeosciences For. 2014, 7, 132–139. [Google Scholar] [CrossRef]
  20. Gill, S.J.; Biging, G.S.; Murphy, E.C. Modeling conifer tree crown radius and estimating canopy cover. For. Ecol. Manag. 2000, 126, 405–416. [Google Scholar] [CrossRef]
  21. Pretzsch, H.; Biber, P.; Uhl, E.; Dahlhausen, J.; Rötzer, T.; Caldentey, J.; Koike, T.; van Con, T.; Chavanne, A.; Seifert, T.; et al. Crown size and growing space requirement of common tree species in urban centres, parks, and forests. Urban For. Urban Green. 2015, 14, 466–479. [Google Scholar] [CrossRef]
  22. Costa, E.A.; Finger, C.A.G.; Fleig, F.D. Modelagem do espaço de crescimento para araucária. Ciência Florest. 2018, 28, 725–734. [Google Scholar] [CrossRef]
  23. Pretzsch, H.; Ahmed, S.; Jacobs, M.; Schmied, G.; Hilmers, T. Linking crown structure with tree ring pattern: Methodological considerations and proof of concept. Trees 2022, 36, 1349–1367. [Google Scholar] [CrossRef]
  24. Srinivasan, S.; Popescu, S.; Eriksson, M.; Sheridan, R.; Ku, N.-W.J.R.S. Terrestrial Laser Scanning as an Effective Tool to Retrieve Tree Level Height, Crown Width, and Stem Diameter. Remote Sens. 2015, 7, 1877–1896. [Google Scholar] [CrossRef]
  25. Zhen, Z.; Quackenbush, L.J.; Zhang, L. Impact of Tree-Oriented Growth Order in Marker-Controlled Region Growing for Individual Tree Crown Delineation Using Airborne Laser Scanner (ALS) Data. Remote Sens. 2013, 6, 555–579. [Google Scholar] [CrossRef]
  26. Lim, Y.S.; La, P.H.; Park, J.S.; Lee, M.H.; Pyeon, M.W.; Kim, J.-I. Calculation of Tree Height and Canopy Crown from Drone Images Using Segmentation. Korean J. Geomat. 2015, 33, 605–614. [Google Scholar] [CrossRef]
  27. Lockhart, B.R.; Weih, R.C., Jr.; Smith, K. Crown Radius and Diameter at Breast Height Relationships for Six Bottomland Hardwood Species. J. Ark. Acad. Sci. 2005, 59, 110–115. [Google Scholar]
  28. Quadri, A. Development and Evaluation of Linear and Non-Linear Models for Diameter at Breast Height and Crown Diameter of Triplochiton scleroxylon (K. Schum) Plantations in Oyo State, Nigeria. J. Agric. Vet. Sci. 2019, 12, 47–52. [Google Scholar] [CrossRef]
  29. Goodfellow, I.; Bengio, Y.; Courville, A. Deep Learning; MIT Press: Cambridge, MA, USA, 2016; Volume 1, pp. 1–800. ISBN 978-0-262-03561-3. [Google Scholar]
  30. Costa, E.A.; Liesenberg, V.; Finger, C.A.G.; Hess, A.F.; Schons, C.T. Understanding bark thickness variations for Araucaria angustifolia in southern Brazil. J. For. Res. 2020, 32, 1077–1087. [Google Scholar] [CrossRef]
  31. Zhang, X.-D. Machine Learning. In A Matrix Algebra Approach to Artificial Intelligence; Springer: Singapore, 2020; pp. 223–440. ISBN 02-62-01243-X. [Google Scholar]
  32. El Naqa, I.; Murphy, M.J. What is machine learning? In Machine Learning in Radiation Oncology; Springer: Berlin/Heidelberg, Germany, 2015. [Google Scholar]
  33. Silva, A.K.V.; Vinicius, M.; Borges, V.; Batista, T.S.; Antonio, C.; Elis, D.; Furuya, G.; Osco, L.P.; Pereira, L.; Teodoro, R.; et al. Predicting Eucalyptus Diameter at Breast Height and Total Height with UAV-Based Spectral Indices and Machine Learning. Forests 2021, 12, 582. [Google Scholar] [CrossRef]
  34. Dos Reis, A.A.; Carvalho, M.C.; de Mello, J.M.; Gomide, L.R.; Filho, A.C.F.; Junior, F.W.A. Spatial prediction of basal area and volume in Eucalyptus stands using Landsat TM data: An assessment of prediction methods. N. Z. J. For. Sci. 2018, 48, 1. [Google Scholar] [CrossRef]
  35. Bayat, M.; Bettinger, P.; Heidari, S.; Khalyani, A.H.; Jourgholami, M.; Hamidi, S.K. Estimation of Tree Heights in an Uneven-Aged, Mixed Forest in Northern Iran Using Artificial Intelligence and Empirical Models. Forests 2020, 11, 324. [Google Scholar] [CrossRef]
  36. Júnior, I.D.S.T.; Torres, C.M.M.E.; Leite, H.G.; de Castro, N.L.M.; Soares, C.P.B.; Castro, R.V.O.; Farias, A.A. Machine learning: Modeling increment in diameter of individual trees on Atlantic Forest fragments. Ecol. Indic. 2020, 117, 106685. [Google Scholar] [CrossRef]
  37. Zhang, Z. Artificial Neural Network. In Multivariate Time Series Analysis in Climate and Environmental Research; Springer International Publishing: Berlin/Heidelberg, Germany, 2018; pp. 1–35. ISBN 9783319673400. [Google Scholar]
  38. Castro, R.V.O.; Soares, C.P.B.; Leite, H.G.; De Souza, A.L.; Nogueira, G.S.; Martins, F.B. Individual Growth Model for Eucalyptus Stands in Brazil Using Artificial Neural Network. ISRN For. 2013, 2013, 196832. [Google Scholar] [CrossRef]
  39. Vieira, G.C.; de Mendonça, A.R.; da Silva, G.F.; Zanetti, S.S.; da Silva, M.M.; dos Santos, A.R. Prognoses of diameter and height of trees of eucalyptus using artificial intelligence. Sci. Total Environ. 2018, 619–620, 1473–1481. [Google Scholar] [CrossRef] [PubMed]
  40. Da Rocha, S.J.S.S.; Torres, C.M.M.E.; Jacovine, L.A.G.; Leite, H.G.; Gelcer, E.M.; Neves, K.M.; Schettini, B.L.S.; Villanova, P.H.; da Silva, L.F.; Reis, L.P.; et al. Artificial neural networks: Modeling tree survival and mortality in the Atlantic Forest biome in Brazil. Sci. Total Environ. 2018, 645, 655–661. [Google Scholar] [CrossRef] [PubMed]
  41. Sanquetta, C.R.; Piva, L.R.; Wojciechowski, J.; Corte, A.P.; Schikowski, A.B. Volume estimation of Cryptomeria japonica logs in southern Brazil using artificial intelligence models. South. For. A J. For. Sci. 2017, 80, 29–36. [Google Scholar] [CrossRef]
  42. Sakici, O.E.; Ozdemir, G. Stem taper estimations with artificial neural networks for mixed oriental beech and kazdaği fir stands in Karabük Region, Turkey. Cerne 2018, 24, 439–451. [Google Scholar] [CrossRef]
  43. Karatzoglou, A.; Meyer, D.; Hornik, K. Support Vector Machines in R. J. Stat. Softw. 2006, 15, 1–28. [Google Scholar] [CrossRef]
  44. Lafetá, B.O.; Trindade, R.N.R.; Aguiar, V.F.; Penido, T.M.A.; Vieira, D.D.S. Crown morphometric indexes of eucalypt estimated by logistic regression and support vector machines. Floresta 2020, 50, 1633–1642. [Google Scholar] [CrossRef]
  45. Cordeiro, M.A.; Pereira, N.N.D.J.; Binoti, D.H.B.; Binoti, M.L.M.D.S.; Leite, H.G. Estimativa do volume de Acacia mangium utilizando técnicas de redes neurais artificiais e máquinas vetor de suporte. Pesqui. Florest. Bras. 2015, 35, 255–261. [Google Scholar] [CrossRef]
  46. Binoti, D.H.B.; Binoti, M.L.M.D.S.; Leite, H.G.; Andrade, A.V.; Nogueira, G.S.; Romarco, M.L.; Pitangui, C.G. Support vector machine to estimate volume of eucalypt trees. Rev. Árvore 2016, 40, 689–693. [Google Scholar] [CrossRef]
  47. Montano, R.A.N.R.; Sanquetta, C.R.; Wojciechowski, J.; Mattar, E.; Corte, A.P.D.; Todt, E. Artificial Intelligence Models to Estimate Biomass of Tropical Forest Trees. Polibits 2017, 56, 29–37. [Google Scholar]
  48. Ali, J.; Khan, R.; Ahmad, N.; Maqsood, I. Random Forests and Decision Trees. Int. J. Comput. Sci. Issues 2012, 9, 272–278. [Google Scholar]
  49. Fayad, I.; Baghdadi, N.; Bailly, J.-S.; Barbier, N.; Gond, V.; El Hajj, M.; Fabre, F.; Bourgine, B. Canopy Height Estimation in French Guiana with LiDAR ICESat/GLAS Data Using Principal Component Analysis and Random Forest Regressions. Remote Sens. 2014, 6, 11883–11914. [Google Scholar] [CrossRef]
  50. Srinet, R.; Nandy, S.; Patel, N. Estimating leaf area index and light extinction coefficient using Random Forest regression algorithm in a tropical moist deciduous forest, India. Ecol. Inform. 2019, 52, 94–102. [Google Scholar] [CrossRef]
  51. Silva, C.A.; Klauberg, C.; Hudak, A.T.; Vierling, L.A.; Jaafar, W.S.W.M.; Mohan, M.; Garcia, M.; Ferraz, A.; Cardil, A.; Saatchi, S. Predicting Stem Total and Assortment Volumes in an Industrial Pinus taeda L. Forest Plantation Using Airborne Laser Scanning Data and Random Forest. Forests 2017, 8, 254. [Google Scholar] [CrossRef]
  52. Jahani, A.; Saffariha, M. Tree failure prediction model (TFPM): Machine learning techniques comparison in failure hazard assessment of Platanus orientalis in urban forestry. Nat. Hazards 2021, 110, 881–898. [Google Scholar] [CrossRef]
  53. Jahani, A.; Saffariha, M. Modeling of trees failure under windstorm in harvested Hyrcanian forests using machine learning techniques. Sci. Rep. 2021, 11, 1–13. [Google Scholar] [CrossRef] [PubMed]
  54. Alvares, C.A.; Stape, J.L.; Sentelhas, P.C.; Moraes, G.J.L.; Sparovek, G. Köppen’s climate classification map for Brazil. Meteorol. Z. 2013, 22, 711–728. [Google Scholar] [CrossRef]
  55. Strobl, C.; Boulesteix, A.-L.; Kneib, T.; Augustin, T.; Zeileis, A. Conditional variable importance for random forests. BMC Bioinform. 2008, 9, 307. [Google Scholar] [CrossRef] [PubMed]
  56. Koenker, R.; Chernozhukov, V.; He, X.; Peng, L. Handbook of Quantile Regression; Koenker, R., Chernozhukov, V., He, X., Peng, L., Eds.; Chapman and Hall/CRC: Boca Raton, FL, USA, 2017; ISBN 9781315120256. [Google Scholar]
  57. Draper, N.R.; Smith, H. Applied Regression Analysis, 3rd ed.; Wiley Series in Probability and Statistics; Wiley: New York, NY, USA, 1998; ISBN 978-0-471-17082-2. [Google Scholar]
  58. Fritsch, S.; Guenther, F.; Wright, M.N. R Package ‘Neuralnet’. Available online: https://cran.r-project.org/web/packages/neuralnet/neuralnet.pdf (accessed on 1 October 2021).
  59. Awad, M.; Khanna, R. Efficient Learning Machines: Theories, Concepts, and Applications for Engineers and System Designers; Springer: Berlin/Heidelberg, Germany, 2015. [Google Scholar]
  60. Meyer, D.; Dimitriadou, E.H.K.; Weingessel, A.; Leisch, F.; Chang, C.-C.; Lin, C.-C. R Package ‘E1071’. Available online: https://cran.r-project.org/web/packages/e1071/index.html (accessed on 1 October 2021).
  61. Cutler, A.; Cutler, D.R.; Stevens, J.R. Ensemble Machine Learning. Ensemble Machine Learning; Springer: Berlin/Heidelberg, Germany, 2012. [Google Scholar] [CrossRef]
  62. Breiman, L. Random forests. Mach. Learn. 2001, 45, 5–32. [Google Scholar] [CrossRef]
  63. Liaw, A.; Wiener, M. R Package “RandomForest”. Available online: https://cran.r-project.org/web/packages/randomForest/index.html (accessed on 1 October 2021).
  64. Hiruma-Lima, C.; Santos, L.; Kushima, H.; Pellizzon, C.; Silveira, G.; Vasconcelos, P.; Vilegas, W.; Brito, A.S. Qualea grandiflora, a Brazilian “Cerrado” medicinal plant presents an important antiulcer activity. J. Ethnopharmacol. 2006, 104, 207–214. [Google Scholar] [CrossRef] [PubMed]
  65. Traesel, G.K.; de Araújo, F.H.S.; Castro, L.H.A.; de Lima, F.F.; Menegati, S.E.L.T.; Justi, P.N.; Kassuya, C.A.L.; Cardoso, C.A.L.; Argandoña, E.J.S.; Oesterreich, S.A. Safety Assessment of Oil from Pequi (Caryocar Brasiliense Camb.): Evaluation of the Potential Genotoxic and Clastogenic Effects. J. Med. Food 2017, 20, 804–811. [Google Scholar] [CrossRef] [PubMed]
  66. Zardo, R.N.; Henriques, R.P.B. Growth and fruit production of the tree Caryocar brasiliense in the Cerrado of central Brazil. Agrofor. Syst. 2011, 82, 15–23. [Google Scholar] [CrossRef]
  67. Siqueira, E.M.D.A.; Rosa, F.R.; Fustinoni, A.M.; De Sant’Ana, L.P.; Arruda, S.F. Brazilian Savanna Fruits Contain Higher Bioactive Compounds Content and Higher Antioxidant Activity Relative to the Conventional Red Delicious Apple. PLoS ONE 2013, 8, e72826. [Google Scholar] [CrossRef] [PubMed]
  68. Junior, I.E.S.; Filho, V.C.; Zacchino, S.A.; Lima, J.C.D.S.; Martins, D.T.D.O. Antimicrobial screening of some medicinal plants from Mato Grosso Cerrado. Rev. Bras. Farm. 2009, 19, 242–248. [Google Scholar] [CrossRef]
  69. Colli, G.R.; Vieira, C.R.; Dianese, J.C. Biodiversity and conservation of the Cerrado: Recent advances and old challenges. Biodivers. Conserv. 2020, 29, 1465–1475. [Google Scholar] [CrossRef]
  70. Dos Santos, G.L.; Pereira, M.G.; Delgado, R.C.; Magistrali, I.C.; da Silva, C.G.; de Oliveira, C.M.M.; Larangeira, J.P.B.; da Silva, T.P. Degradation of the Brazilian Cerrado: Interactions with human disturbance and environmental variables. For. Ecol. Manag. 2020, 482, 118875. [Google Scholar] [CrossRef]
  71. Silva, J.P.M.; da Silva, M.L.M.; de Mendonça, A.R.; da Silva, G.F.; Junior, A.A.d.B.; da Silva, E.F.; Aguiar, M.O.; Santos, J.S.; Rodrigues, N.M.M. Prognosis of forest production using machine learning techniques. Inf. Process. Agric. 2021. [Google Scholar] [CrossRef]
  72. Lopes, I.L.; Araújo, L.A.; Miranda, E.N.; Bastos, T.A.; Gomide, L.R.; Castro, G.P. A comparative approach of methods to estimate machine productivity in wood cutting. Int. J. For. Eng. 2021, 33, 43–55. [Google Scholar] [CrossRef]
  73. Davies, O.; Pommerening, A. The contribution of structural indices to the modelling of Sitka spruce (Picea sitchensis) and birch (Betula spp.) crowns. For. Ecol. Manag. 2008, 256, 68–77. [Google Scholar] [CrossRef]
  74. Korpela, I.; Dahlin, B.; Schäfer, H.; Bruun, E.; Haapaniemi, F.; Honkasalo, J.; Ilvesniemi, S.; Kuutti, V.; Linkosalmi, M.; Mustonen, J.; et al. Single-Tree Forest Inventory Using Lidar and Aerial Images for 3D Treetop Positioning, Species Recognition, Height and Crown Width Estimation. Int. Arch. Photogramm. Remote Sens. Spat. Inf. Sci. 2007, 36, 227–233. [Google Scholar]
  75. Gspaltl, M.; Sterba, H.; O’Hara, K.L. The relationship between available area efficiency and area exploitation index in an even-aged coast redwood (Sequoia sempervirens) stand. For. Int. J. For. Res. 2012, 85, 567–577. [Google Scholar] [CrossRef]
  76. Ramírez-Iglesias, E.; Hernández-Hernandez, R.M.; Iglesias, J.R. Nutrient dynamics of corn fed to livestock in conservation-based agroecosystems in neotropical savannas. Rev. De Cienc. Agrovet. 2021, 20, 086–092. [Google Scholar] [CrossRef]
  77. Ansolin, R.D.; Santos, K.S.M.; Fernandes, A.P.D.; Schinato, F. Environmental Valuation of Permanent Preservation Areas of the Passaúna River Watershed, Paraná State. Rev. De Cienc. Agrovet. 2018, 17, 118–127. [Google Scholar] [CrossRef]
  78. Yang, K.; Tu, J.; Chen, T. Homoscedasticity: An overlooked critical assumption for linear regression. Gen. Psychiatry 2019, 32, e100148. [Google Scholar] [CrossRef] [PubMed]
  79. Graham, M.H. Confronting multicollinearity in ecological multiple regression. Ecology 2003, 84, 2809–2815. [Google Scholar] [CrossRef]
  80. Coombes, A.; Martin, J.; Slater, D. Defining the allometry of stem and crown diameter of urban trees. Urban For. Urban Green. 2019, 44, 126421. [Google Scholar] [CrossRef]
  81. Panagiotidis, D.; Abdollahnejad, A.; Surový, P.; Chiteculo, V. Determining tree height and crown diameter from high-resolution UAV imagery. Int. J. Remote Sens. 2017, 38, 2392–2410. [Google Scholar] [CrossRef]
  82. De Freitas, E.C.S.; de Paiva, H.N.; Neves, J.C.L.; Marcatti, G.E.; Leite, H.G. Modeling of eucalyptus productivity with artificial neural networks. Ind. Crop. Prod. 2020, 146, 112149. [Google Scholar] [CrossRef]
  83. Cosenza, D.N.; Soares, A.; De Alcântara, A.E.M.; Da Silva, A.A.L.; Rode, R.; Soares, V.P.; Leite, H.G. Site classification for eucalypt stands using artificial neural network based on environmental and management features. Cerne 2017, 23, 310–320. [Google Scholar] [CrossRef]
  84. Nwankpa, C.; Ijomah, W.; Gachagan, A.; Marshall, S. Activation Functions: Comparison of Trends in Practice and Research for Deep Learning. arXiv 2018, arXiv:1811.03378. [Google Scholar]
  85. Sharma, S.; Sharma, S.; Anidhya, A. Activation Function in Neural Networks. Int. J. Eng. Appl. Sci. Technol. 2020, 4, 310–316. [Google Scholar] [CrossRef]
  86. Mercioni, M.A.; Holban, S. The most used activation functions: Classic versus current. In Proceedings of the 15th International Conference on Development and Application Systems, DAS, Suceava, Romania, 21–21 May 2020; pp. 141–145. [Google Scholar] [CrossRef]
  87. Reis, P.C.M.; de Souza, A.L.; Reis, L.P.; Carvalho, A.M.M.L.; Mazzei, L.; Rêgo, L.J.S.; Leite, H.G. Artificial Neural Networks to Estimate the Physical-Mechanical Properties of Amazon Second Cutting Cycle Wood. Maderas Cienc. Y Tecnol. 2018, 20, 343–352. [Google Scholar] [CrossRef]
  88. Sheela, K.G.; Deepa, S.N. Selection of Number of Hidden Neurons in Neural Networks in Renewable Energy Systems. J. Sci. Ind. Res. 2013, 73, 686–688. [Google Scholar]
  89. Dantas, D.; Pinto, L.O.R.; Terra, M.D.C.N.S.; Calegario, N.; De Oliveira, M.L.R. Reduction of sampling intensity in forest inventories to estimate the total height of eucalyptus trees. Bosque 2020, 41, 353–364. [Google Scholar] [CrossRef]
  90. Júnior, I.D.S.T.; da Rocha, J.E.C.; Ebling, A.A.; Chaves, A.D.S.; Zanuncio, J.C.; Farias, A.A.; Leite, H.G. Artificial Neural Networks and Linear Regression Reduce Sample Intensity to Predict the Commercial Volume of Eucalyptus Clones. Forests 2019, 10, 268. [Google Scholar] [CrossRef]
  91. Monnet, J.-M.; Chanussot, J.; Berger, F. Support Vector Regression for the Estimation of Forest Stand Parameters Using Airborne Laser Scanning. IEEE Geosci. Remote Sens. Lett. 2011, 8, 580–584. [Google Scholar] [CrossRef]
  92. Feizizadeh, B.; Roodposhti, M.S.; Blaschke, T.; Aryal, J. Comparing GIS-based support vector machine kernel functions for landslide susceptibility mapping. Arab. J. Geosci. 2017, 10, 122. [Google Scholar] [CrossRef]
  93. Nanda, M.A.; Seminar, K.B.; Nandika, D.; Maddu, A. A Comparison Study of Kernel Functions in the Support Vector Machine and Its Application for Termite Detection. Information 2018, 9, 5. [Google Scholar] [CrossRef]
  94. Hong, H.; Pradhan, B.; Bui, D.T.; Xu, C.; Youssef, A.M.; Chen, W. Comparison of four kernel functions used in support vector machines for landslide susceptibility mapping: A case study at Suichuan area (China). Geomat. Nat. Hazards Risk 2017, 8, 544–569. [Google Scholar] [CrossRef]
  95. Dantas, D.; Calegario, N.; Acerbi, F.W.; Carvalho, S.D.P.C.; Júnior, F.W.A.; Melo, E.D.A. Multilevel nonlinear mixed-effects model and machine learning for predicting the volume of Eucalyptus spp. trees. CERNE 2020, 26, 48–57. [Google Scholar] [CrossRef]
  96. De Souza, G.S.A.; Soares, V.P.; Leite, H.G.; Gleriani, J.M.; Amaral, C.H.D.; Ferraz, A.S.; Silveira, M.V.D.F.; dos Santos, J.F.C.; Velloso, S.G.S.; Domingues, G.F.; et al. Multi-sensor prediction of Eucalyptus stand volume: A support vector approach. ISPRS J. Photogramm. Remote Sens. 2019, 156, 135–146. [Google Scholar] [CrossRef]
  97. Ahmed, O.S.; Franklin, S.E.; Wulder, M.A.; White, J.C. Characterizing stand-level forest canopy cover and height using Landsat time series, samples of airborne LiDAR, and the Random Forest algorithm. ISPRS J. Photogramm. Remote Sens. 2015, 101, 89–101. [Google Scholar] [CrossRef]
  98. Muhairwe, C.K. Taper equations for Eucalyptus pilularis and Eucalyptus grandis for the north coast in New South Wales, Australia. For. Ecol. Manag. 1999, 113, 251–269. [Google Scholar] [CrossRef]
  99. Oshiro, T.M.; Perez, P.S.; Baranauskas, J.A. How many trees in a random forest? In Lecture Notes in Computer Science; Including Subseries Lecture Notes in Artificial Intelligence and Lecture Notes in Bioinformatics; Springer: Berlin/Heidelberg, Germany, 2012; pp. 154–168. [Google Scholar] [CrossRef]
  100. Probst, P.; Boulesteix, A.L. To Tune or Not to Tune the Number of Trees in Random Forest. J. Mach. Learn. Res. 2018, 18, 1–8. [Google Scholar]
  101. Liu, K.; Shen, X.; Cao, L.; Wang, G.; Cao, F. Estimating forest structural attributes using UAV-LiDAR data in Ginkgo plantations. ISPRS J. Photogramm. Remote Sens. 2018, 146, 465–482. [Google Scholar] [CrossRef]
  102. Osco, L.P.; Ramos, A.P.M.; Pereira, D.R.; Moriya, A.S.; Imai, N.N.; Matsubara, E.T.; Estrabis, N.; de Souza, M.; Junior, J.M.; Gonçalves, W.N.; et al. Predicting Canopy Nitrogen Content in Citrus-Trees Using Random Forest Algorithm Associated to Spectral Vegetation Indices from UAV-Imagery. Remote Sens. 2019, 11, 2925. [Google Scholar] [CrossRef]
  103. Lee, J.; Im, J.; Kim, K.-M.; Quackenbush, L.J. Machine Learning Approaches for Estimating Forest Stand Height Using Plot-Based Observations and Airborne LiDAR Data. Forests 2018, 9, 268. [Google Scholar] [CrossRef]
  104. Wu, C.; Shen, H.; Shen, A.; Deng, J.; Gan, M.; Zhu, J.; Xu, H.; Wang, K. Comparison of machine-learning methods for above-ground biomass estimation based on Landsat imagery. J. Appl. Remote Sens. 2016, 10, 35010. [Google Scholar] [CrossRef]
  105. Sanquetta, C.R.; Corte, A.P.D.; Jacon, A.D. Crown Area and Trunk Diameter Relationship for Tree Species at a Mixed-Araucaria Natural Forest in the Mid-Southern Parana State, Brazil. Floresta 2011, 41, 63–72. [Google Scholar] [CrossRef]
  106. Pereira, P.R.M.; Bolfe, E.L.; Rodrigues, T.C.S.; Sano, E.E. Dynamics of agricultural expansion in areas of the Brazilian Savanna between 2000 and 2019. Int. Arch. Photogramm. Remote Sens. Spatial Inf. Sci. 2020, XLIII-B3, 1607–1614. [Google Scholar] [CrossRef]
  107. Haykin, S. Redes Neurais–Princípios e Prática, 2nd ed.; Engel, P.M., Ed.; Bookman Editora: Porto Alegre, Brazil, 2001; Volume 7659, ISBN 85-7307-718-2. [Google Scholar]
  108. Heaton, J. Introduction to the Math of Neural Networks, 1st ed.; WordsRU.com, Ed.; Heaton Research, Inc.: Chesterfield, MO, USA, 2012; ISBN 978-1475190878. [Google Scholar]
Figure 1. Location of the study area in the Brazilian Cerrado biome (a), its southern region (b), and the context of the municipality (c).
Forests 13 01295 g001
Figure 2. Dendrometric measurements obtained for the trees: equivalent diameter—Deq (Caryocar Brasiliense Cambess.) (a), crown base height—CBH, and height—H (Pouteria ramiflora (Mart.) Radlk.) (b), in which CBH refers to crown base height and H to total height.
Forests 13 01295 g002
Figure 3. Classification of tree crown geometric shapes (CGS): circular—Eriotheca gracilipes (K. Schum.) A. Robyns (a), elliptic—Hancornia speciosa Gomes (b), columnar—Zeyheria tuberculosa (Vell.) Bureau ex Verl. (c), umbelliform—Leptolobium elegans Vogel (d), and pyramidal—Myrsine gardneriana A. DC. (e).
Forests 13 01295 g003
Figure 4. Methodological flowchart.
Forests 13 01295 g004
Figure 5. Box plot of crown radii according to their cardinal positions, in which N refers to north; NO, to northeast; E, to east; SO, to southeast; S, to south; SW, to southwest; W, to west; NO, to northeast. Letter “a” on the left side of the boxes is due to the Tukey test.
Forests 13 01295 g005
Figure 6. Determination of the trend of potential crown diameter via quantile regression techniques in open-growing trees, in which Deq refers to the diameter measured 1.3 m above the soil, and CD, to crown diameter.
Forests 13 01295 g006
Figure 7. Characterization of the dimensions of the largest open-grown tree sampled—a Cariniana estrellensis (Raddi) Kuntze individual from the Lecythidaceae botanic family. Perspectives of the tree crown dimensions is shown in (a), and a tree diameter characteristic is shown in (b).
Forests 13 01295 g007
Figure 8. Evaluation of the necessary growth space, considering the size of the potential crown diameter in open-grown trees, in which CD (black line) refers to crown diameter; GS (red line), to grown space; N (yellow line), to the number of trees; and G (blue line), to their basal area.
Forests 13 01295 g008
Figure 9. Residual analysis of crown diameter models according to the techniques analyzed in fit-training and validation data in which REG4 refers to the regression model 4; ANN6, to artificial neural network 6; SVM6, to support vector machine 6; and RF6, to random forest 6.
Forests 13 01295 g009
Table 2. Descriptive statistic of the variables measured in our sample.
VariablesUnitsMinimumMeanMaximumStandard Deviation
D03cm5.937.4226.029.7
D07cm5.633.8226.026.8
Deqcm5.132.1226.025.3
CBHm1.03.310.41.5
Hm2.39.527.55.0
CLm0.86.223.84.0
CDm1.37.129.84.2
CGS-1.02.65.00.9
ST-2.02.93.00.3
PR-1.01.23.00.4
VT-1.01.33.00.5
BA-1.01.55.00.6
In which D03 refers to the diameter measured 0.3 m above the soil; D07, to the diameter measured 0.7 m above the soil; Deq, to the diameter measured 1.3 m above the soil; CBH, to crown base height; H, to height; CL, to crown length; CD, to crown diameter; CGS, to crown geometric shapes; ST, to stoniness; PR, to the tree position on the relief; VT, to vitality; and BA, to branch arrangement.
Table 3. Spearman’s correlation values and variable importance used to model crown diameter.
Spearman’s CorrelationRandom Forest
CDUnitsρp-ValueRankImportanceRank
D03cm0.860<0.000120.8602
D07cm0.854<0.000130.7074
Deqcm0.867<0.000111.0001
CBHm0.477<0.000160.4155
Hm0.787<0.000150.4076
CLm0.792<0.000140.7683
CGS-−0.344<0.000170.2197
ST-−0.0170.8482100.03811
PR-0.0020.9835110.05610
VT-−0.1790.037980.0959
BA-−0.1530.076090.1238
In which D03 refers to the diameter measured 0.3 m above the soil; D07, to the diameter measured 0.7 m above the soil; Deq, to the diameter measured 1.3 m above the soil; CBH, to crown base height; H, to height; CL, to crown length; CD, to crown diameter; CGS, to crown geometric shapes; ST, to stoniness; PR, to the position of the tree on the relief; VT, to vitality; and BA, to branch arrangement.
Table 4. Regression coefficients and model performance criteria used to predict crown diameter.
Id.Inputβ0β1β2β3β4FitValidation
R2RMSEMAEMAPER2RMSEMAEMAPE
1Deq 2.31510.1463 0.811.891.4828.220.811.711.3626.07
2Deq; CL1.64760.10530.3254 0.841.741.4025.600.831.591.2323.30
3Deq; CL; CGS3.69300.09230.3816−0.7655 0.871.601.2622.260.871.401.0919.54
4Deq; Deq2; CL; CGS3.04370.1271−0.00020.3174−0.68950.871.591.2420.980.881.381.0518.09
REG4: (i) normality of residuals [Kolmogorov–Smirnov test (D = 0.0596; p > 0.150)]; (ii) homoscedasticity of residuals [test of first- and second-moment specifications (χ2 = 15.91; p > 0.2538)]; (iii) independence of residuals [Durbin–Watson test (DW = 2.183; p < DW = 0.8554; p > DW = 0.1446)], in which Deq refers to the diameter measured 1.3 m above the soil; CL, to crown length; CGS, to crown geometric shapes, R2, to the coefficient of determination; RMSE, to root-mean-square error; MAE, to mean absolute error; and MAPE, to mean absolute percentage error.
Table 5. Configurations of the machine learning techniques analyzed and model performance criteria used to predict crown diameter.
TechniqueId.InputMLPActivation FunctionTreesTraining Validation
HiddenOutputR2RMSEMAEMAPER2RMSEMAEMAPE
ANN1Deq 1-3-1LogisticLinear 0.851.731.3423.180.841.561.2120.27
SVM1 0.801.951.4523.760.811.721.3322.11
RF1 900.861.621.2621.590.841.561.2120.17
ANN2Deq; D032-6-1LogisticLinear 0.851.701.3423.420.831.581.2521.24
SVM2 0.811.891.4524.150.781.821.4424.37
RF2 750.881.541.2320.960.821.641.3022.14
ANN3Deq; D03; CL3-9-1LogisticLinear 0.871.571.2220.940.851.491.0917.67
SVM3 0.841.761.3322.130.821.631.2321.15
RF3 1050.881.501.1820.180.821.651.2721.58
ANN4Deq; D03; CL; D074-12-1LogisticLinear 0.871.591.2120.320.861.481.0717.58
SVM4 0.841.761.3321.980.821.641.2321.07
RF4 300.891.471.1620.230.811.691.3222.07
ANN5Deq; D03; CL; D07; CBH5-15-1LogisticLinear 0.881.511.1919.970.871.410.9616.57
SVM5 0.841.761.3121.740.811.681.2521.10
RF5 1050.891.451.1519.630.821.671.2621.25
ANN6Deq; D03; CL; D07; CBH; CGS6-18-1LogisticLinear 0.901.371.0418.780.901.210.9316.25
SVM6 0.871.601.1519.240.851.501.1819.84
RF6 4650.891.461.1620.020.821.651.2521.27
In which ANN refers to artificial neural networks; SVM, to support vector machines; RF, to random forests; Deq, to the diameter measured 1.3 m above the soil; D03, to the diameter measured 0.3 m above the soil; D07, to the diameter measured 0.7 m above the soil; CL, to crown length; CBH, to crown base height; CGS, to crown geometric shapes; R2, to the coefficient of determination; RMSE, to root-mean-square error; MAE, to mean absolute error; and MAPE, to mean absolute percentage error.
Publisher’s Note: MDPI stays neutral with regard to jurisdictional claims in published maps and institutional affiliations.

