Article

Soil Moisture Control of NO Turnover and N2O Release in Nitrogen-Saturated Subtropical Forest Soils

1
CAS Key Laboratory of Forest Ecology and Management, Institute of Applied Ecology, Chinese Academy of Sciences, Shenyang 110016, China
2
Faculty of Environmental Sciences and Natural Resource Management, Norwegian University of Life Sciences, 1433 As, Norway
3
Department of Biogeochemical Processes, Max Planck Institute for Biogeochemistry, 07745 Jena, Germany
*
Authors to whom correspondence should be addressed.
Forests 2022, 13(8), 1291; https://doi.org/10.3390/f13081291
Submission received: 5 July 2022 / Revised: 3 August 2022 / Accepted: 9 August 2022 / Published: 14 August 2022
(This article belongs to the Special Issue Nitrogen Biogeochemical Cycling in Forest Ecosystems)

Abstract

:
Acid forest soils in South China experience a chronically elevated input of atmospheric nitrogen (N), turning them into hot spots for gaseous N emissions. Soil moisture is known to be a major controller for the partitioning of gaseous N loss to nitric (NO) and nitrous oxide (N2O), which may be of particular relevance in the monsoonal climate of South China. To study this partitioning in more detail, we determined gas phase kinetics of NO and N2O release during laboratory dry-out of acidic surface soils from the headwater catchment TieShanPing (TSP), situated close to Chongqing, SW China. Soils were sampled from two hydrologically distinct environments, a well-drained hill slope (HS), and a periodically flooded groundwater discharge zone (GDZ). Production and consumption of NO were studied in an automated flow-through system purged with NO-free or NO-spiked air. Production rates peaked at 21% and 18% water filled pore space (WFPS) in HS and GDZ soils, respectively, suggesting nitrification as the dominant process of NO formation in both landscape units. In HS soils, maximum production and consumption occurred at the same WFPS, whereas GDZ soils displayed maximum NO consumption at higher WFPS than maximum production, suggesting that denitrification is an important NO sink in GDZ soils. Net N2O release was largest at 100% WFPS and declined steadily during drying. Integrated over the entire range of soil moisture, potential NO-N loss outweighed potential N2O-N loss, suggesting that N-saturated, acid forest soil is an important NO source.

Graphical Abstract

1. Introduction

Nitric oxides (NOx = NO and NO2) and nitrous oxide (N2O) are important air pollutants associated with the N cycle. NO is a short-lived atmospheric trace gas involved in the production of photochemical oxidants in the troposphere and a precursor of acid rain [1,2]. N2O is a major greenhouse gas, with a 120-year atmospheric lifetime [3] and a warming potential 300 times that of carbon dioxide (CO2). N2O is also involved in stratospheric ozone destruction [4]. Globally, fossil fuel combustion is the largest source of NOx [5], followed by biogenic NO emissions from soils and NO produced from biomass burning and lightning [6]. Large NO emissions have been reported from temperate and boreal forests with high N deposition [7,8], but knowledge about NO emissions in N-saturated subtropical forests is limited [9,10,11].
Previously, surface soils of N-saturated subtropical forests have been shown to be “hot spots” for accelerated N-turnover and gaseous N-losses. For instance, Zhu et al. (2013) [12] reported large N2O emissions for the TieShanPing (TSP) headwater catchment in Southwest China, accounting for up to 10% of the atmospheric N deposition (60 kg N ha−1 a−1). Incomplete denitrification in acidic surface soils on well-drained hill-slopes was identified as the main source of N2O, both in the laboratory [13] and in situ [14]. Yu et al. (2016) [15] presented isotopic evidence for efficient nitrification along hillslopes and strong N-retention by denitrification in the groundwater discharge zone of the valley bottom in the same headwater catchment and confirmed this phenomenon for several near-stream environments in subtropical forests of China [16]. Together, this suggests that forest soils in South China receiving elevated N deposition support large rates of N-turnover despite the prevalence of strongly acidic soils.
It is well known that microbial N transformations mediating N-gas production and consumption depend on soil moisture [17]. Soil moisture controls the diffusion of oxygen and other substrates and the residence time of gaseous products in the soil [18]. Wet soils, in which anoxic zones develop, support NO reduction to N2O by denitrification, whereas in dry, well-aerated soils, NO production by nitrification prevails [17,19]. In acidic soils, chemo-denitrification, i.e., the reduction of biogenic NO2 to NO and N2O may be an important additional source [20,21]. Given the strong fluctuations in soil moisture brought about by the hilly topography and the monsoonal climate in South China, subtropical forest soils can be expected to be a major source of reactive N gases, such as NO and N2O. Indeed, in situ measurements of NO exchange at the TieShanPing catchment showed that both the hillslope and the periodically flooded groundwater discharge zone are strong sources for NO in summer, sometimes exceeding the N2O-N flux, particularly under dry conditions [22]. However, little is known about the response of the NO and N2O emissions to drying in N-saturated monsoonal subtropical forest soils.
We conducted laboratory dry-out experiments, monitoring NO and N2O release over a range of soil moistures spanning from flooding to <1% soil moisture (w/w). Our objectives were to evaluate the potential NO release rate following soil drying and to better understand the partitioning of reactive N gas emissions (NO + N2O) by soil moisture in well-drained hill slope soils and in wet soils of the groundwater discharge zone. It was hypothesized that there was an optima for NO production rate over the whole soil moisture in two experimental soils.

2. Material and Methods

2.1. Site Characteristics

The TieShanPing (TSP) catchment is located on a forested ridge, about 25 km Northeast of Chongqing City, SW China (29°38′ N 104°41′ E, Figure 1). A detailed description of the climate, vegetation and soil characteristics can be found in Chen and Mulder (2007) [23]. The climate is subtropical-monsoonal with a mean annual temperature of 18.2 °C and a mean annual precipitation of 1028 mm. The average annual inorganic N deposition is dominated by ammonium (NH4+) and has increased from 40 kg to 60 kg N ha−1 y−1 in recent years [24]. The vegetation is a coniferous-broadleaf mixed forest dominated by Masson pine (Pinus massoniana Lamb) with an understory of grasses and shrubs.
The soils were collected in a 4.6 ha headwater sub-catchment that has been used previously for hydrological and biogeochemical studies [12,15,22,25,26] focusing on N transformations, runoff and NO and N2O emissions. The sub-catchment consists of two hydrologically connected landscape elements, a forested well-drained hillslope (HS) and a terraced groundwater discharge zone (GDZ) (Figure 1). The HS has loamy yellow mountain soils (Haplic Acrisols; WRB, 2014) with very low pHH2O (3.7–4.1) and a thin O horizon (2 cm depth). The GDZ is dominated by colluvial soils and lacks a distinct O horizon (Table 1). The A horizon of the GDZ soils have larger bulk density, smaller hydraulic conductivity and higher soil pHH2O (4.3–4.8) than the F and H layers (O horizon) of the HS soils [26].

2.2. Soil Sampling, Pre-Treatment and Experimental Dry-Out

Soil samples were collected in July 2014 from four plots on the HS (HS-T0, HS-T1, HS-T3 and HS-T5) along a transect spanning from the top to the foot of the hillslope and from three terraces situated along the hydrological flow path in the GDZ (Figure 1; GDZ-B2, GDZ-B5 and GDZ-B6). At each plot, surface soil from the O horizon (F and H layers) at HS and the A horizon in GDZ was collected from five 0.2 × 0.2 m2 areas spaced app. 1 m from each other and mixed to one composite sample. Because of heavy rainfall prior to sampling, soils on HS were wet, and soils in GDZ waterlogged. HS soils were sieved (16 mm mesh) [27] and green leaves and roots were removed. Here we used a 16 mm mesh for HS soils, because Bargsten et al. (2010) [27] found that for soils sampled from O horizon, sieving through a 2 mm mesh destroyed the structure of soil organic matter causing higher NO release rates than observed when sieving through 4, 8, 16 mm meshes. GDZ soils were drained on a 2 mm mesh for 24 h in the field before transporting them to the laboratory and removing visible stones without sieving the soil. All soils were stored at 4 °C prior to incubation. The NO measurements were performed within one week after collecting the soils at the Max Plank Institute for Chemistry in Mainz, Germany, whereas N2O release was studied in a flow-through system one month later at the Norwegian University of Life Sciences. The soils were stored at 4 °C in plastic bags in between the experiments.
The dry-out response of NO release was studied in an automated flow-through system described in detail by Behrendt et al. (2014) [28]. Briefly, fresh soil samples of ~30 g (11 g d.w.) from HS and 80 g (40 g d.w.) from GDZ sites were placed loosely in 9.2 cm diameter Plexiglas cuvettes. To avoid diffusion limitation during the gas measurements, the height of the soil in the cuvettes was limited to 0.5 cm. The larger sample size for GDZ soils was necessary to reach approximately equal soil volumes in the cuvettes, owing to the higher bulk density of GDZ than HS soils (Table 1). Before starting the measurements, HS soils were saturated and GDZ soils flooded with distilled water to mimic typical post-rainfall conditions in HS and GDZ, respectively. Five soils were incubated simultaneously in a thermostatic cabinet together with an empty cuvette serving as a reference. A constant stream of synthetic air was flushed through the headspace, alternating between NO-free and NO-spiked air. This allowed us to study the response of gross NO production and consumption simultaneously to soil drying in a sole experiment. With the air flushing, the soil became dry from saturated gradually. Different NO concentrations were used for HS (130 ppbv) and GDZ (300 ppbv) soils, as we expected a higher compensation mixing ratio for the more active HS soils [29] (Equation (2)). The complete dry-out took 40 h for HS soils and 60 h for GDZ soils (Figure S1). We deliberately accepted the rapid drying as it allowed us to study reactive N gas response profiles over a wide range of soil moistures without depleting available C and N pools. To determine the temperature dependency of NO release, separate experiments were conducted at 20 and 30 °C, which cover the range of summer soil temperatures at TSP [12].
The net NO release rates were calculated from the difference in NO concentration between outlet and inlet of the chambers as:
J NO = Q × C o u t C i n M s o i l
where Q is the flow rate through the soil chamber in m3 s−1, Cout and Cin are the concentrations of NO of the soil chamber and soil-free chamber (ng m−3), respectively, and Msoil is the dry mass of soil in kg.
At any given NO concentration, measured net NO release rates (JNO) can be written as the difference between NO gross production (P) and consumption (U):
J NO = P U = P k NO amb
where k is the first-order rate constant of NO consumption. U is assumed to be first-order with respect to the NO mixing ratio [NO]amb [29]. In contrast, P is assumed to be independent of the NO mixing ratio and in a system without diffusion limitation, NO production equals net NO release under zero-NO flushing. When P equals U, the net NO release is zero. The NO mixing ratio at which NO release is zero is defined as the “NO compensation mixing ratio” [29]. The rate constant k was estimated from the difference in net release under zero and elevated NO mixing ratios and used to calculate P and U, as well as NO compensation mixing ratios over the measured range of soil moistures.
Water loss during incubation was measured analogously to NO net release as the difference in water vapor between inlet and outlet air [28]. To derive a gravimetric drying curve for each soil, measured water loss was cumulated and subtracted from initial soil moisture, before converting gravimetric soil moisture (θ) to water filled pore space (WFPS):
WFPS % = B D × θ 1 B D P D × 100
where θ is the gravimetric soil moisture (kg kg−1), BD is the bulk density of the soil in the chamber (kg m−3), PD the particle density of the soil (kg m−3) as specified in Table 1.
A second dry-out experiment was performed, mimicking the conditions of the automated flow-through system used for NO measurements. The purpose of this experiment was to characterize the dry-out response of microbial activity in terms of soil respiration (CO2) and N2O release. Each 10 g of HS soil and 15 g of GDZ soil (dry weight: 3.5 g for HS soil, 8.0 g for GDZ soil) were loosely placed to the same density as in the NO experiment in crimp-sealed 120 mL serum bottles, forming a 0.5 cm thick soil layer with a cross-sectional area of 18 cm2. A 5 cm long hypodermic needle was inserted through the butyl septum serving as an inlet and a shorter needle as an outlet through which air could be flushed by means of a membrane pump (ME 1C Chemistry Diaphragm Pump, Vacuubrand, Germany). The bottles were placed in a water bath adjusted to 30 °C and ambient air was pumped continuously at 0.4 L min−1 through the bottle headspaces using a manifold. The flushing rate was found to give similar dry-out curves as in the experiment with automated NO measurements (Figure S1). The release of N2O and CO2 was measured periodically by detaching the bottles from the flushing line, weighing them to monitor moisture loss and analyzing N2O and CO2 accumulation over 3 h in the headspace by means of a robotized GC system [30]. Release rates were calculated from concentration change over time, taking account of gaseous dissolution as described in Molstad et al. (2007) [30].
Production/consumption of NO and release of N2O was expressed as a function of relative soil moisture (water filled pore-space; WFPS) and used to calculate NO/(NO + N2O) partitioning curves over soil moisture for HS and GDZ soils.

2.3. Soil Chemical and Physical Characteristics

Soil pH was measured in a soil-to-water suspension (1:2.5) using an ORION SA720 electrode pH meter connected to an Orion ROSS Ultra pH Electrode. Total nitrogen (TN) and carbon (TOC) were determined by a CHN analyzer (CHN-1000, LECO USA). The bulk density was calculated from dry weight and the height and surface area of the soil in the cuvettes. Initial soil moisture was determined by drying HS soils at 60 °C (to avoid loss of organic carbon) and GDZ soils at 105 °C until weight constancy. The particle density of the soils was measured by a pycnometer as described by Bargsten et al. (2010) [27], after sieving soil through a 2 mm mesh.
For measurement of dynamics of extractable NH4+ (NH4+ex) and NO3 (NO3ex) during the NO experiment, replicate cuvettes with soils from HS-T3 and GDZ-B5 were sacrificed at different time points during the dry-out. Three 5 g samples (technical replicates) were respectively extracted with 40 mL 2 M KCl (1:8 ratio) by shaking them horizontally for 1 h. The suspensions were filtered through Whatman 42 filter paper, and NH4+ (NH4+ex) and NO3 (NO3ex) concentrations in filtrate were determined using spectrometry (FIA-lab, MLE, Sweden).

3. Results

3.1. Soil Physical and Chemical Characteristics

Bulk and particle densities of HS top soils were significantly smaller (p < 0.05) than those of GDZ soils (Table 1). Concentrations of NH4+ex and NO3ex at the start of the experiment, TOC and TN contents, as well as the C/N ratios depended on location but were significantly greater in HS than in GDZ surface soils (p < 0.01). Concentrations of NH4+ex and NO3ex, TOC and TN contents, as well as the C/N ratios in four soils from HS had no significant difference, while the concentrations of NH4+ex and C/N ratios in B2, B5 and B6 soils from GDZ gradually decreased. HS soils had lower pHH2O than GDZ soils, except for HS-T1, which had a higher pHH2O (5.14).

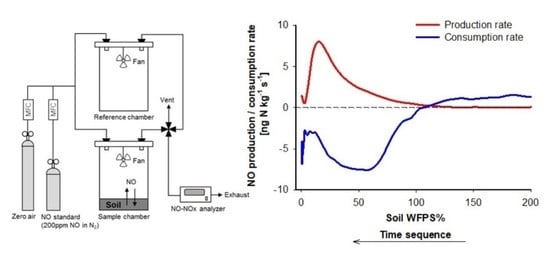
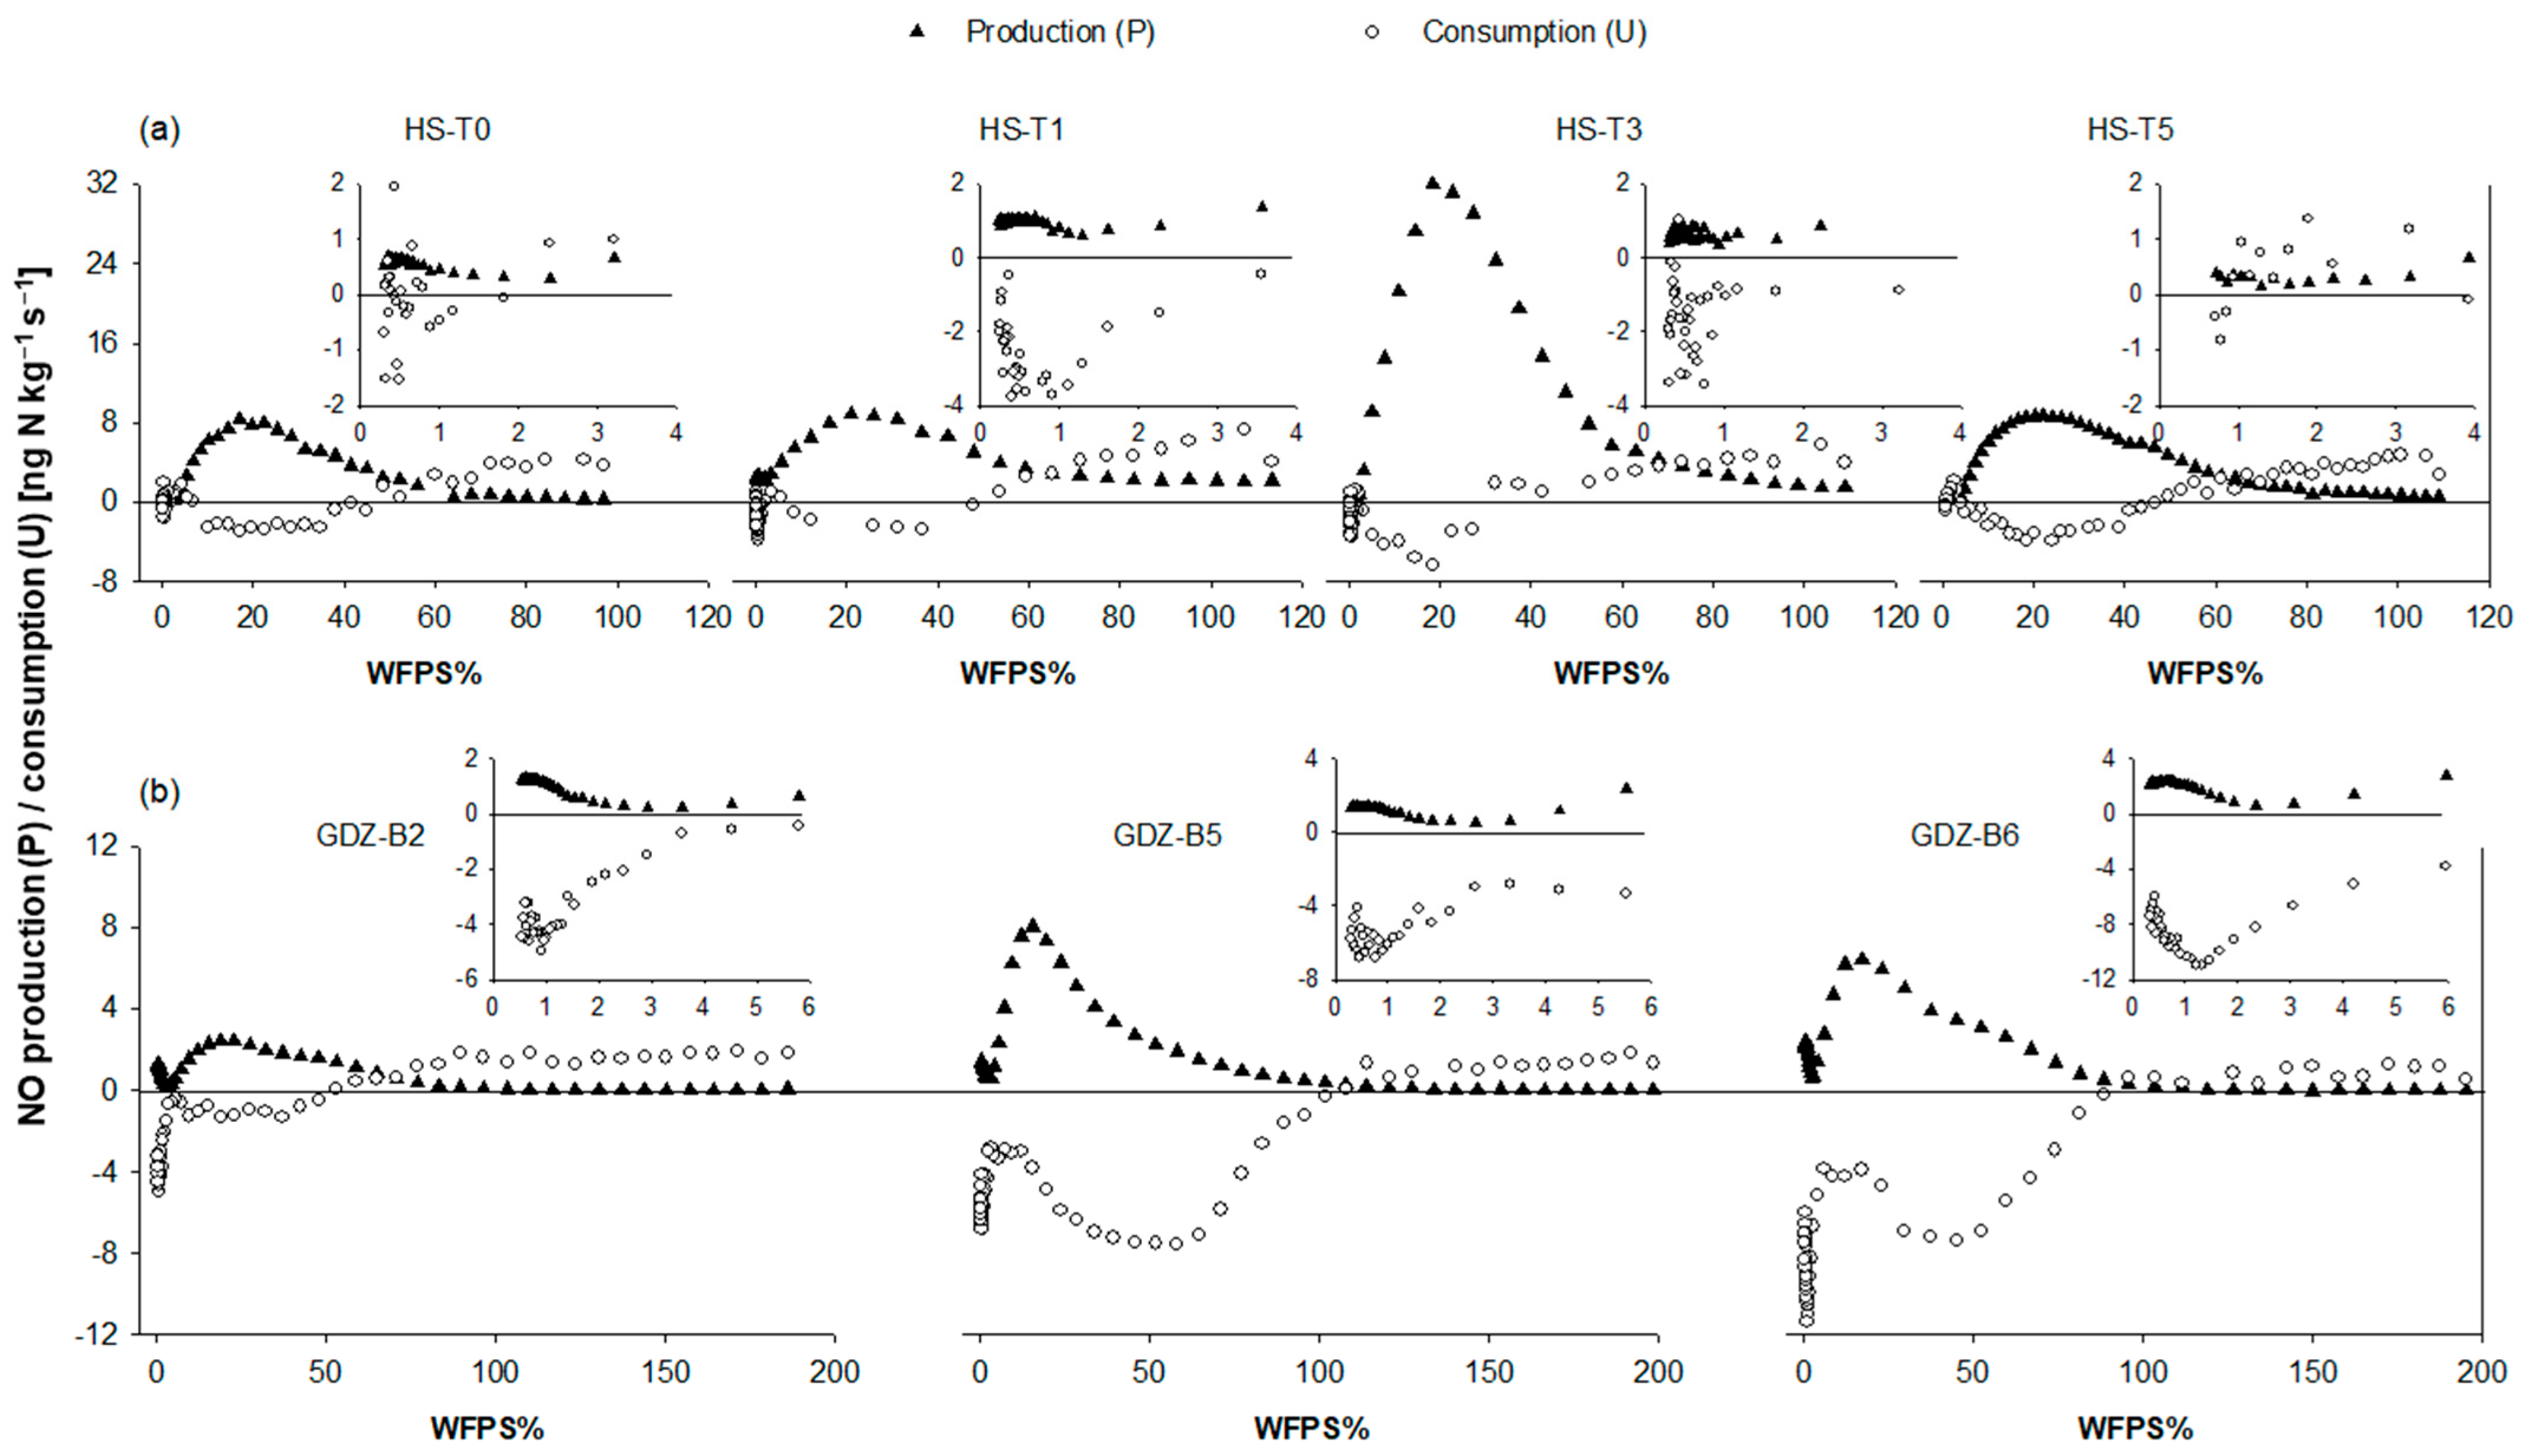
3.2. Dry-Out and Gas Phase Kinetics of NO

Dry-out curves for HS soils differed with GDZ soils in the NO experiment (Figure S1a). In the more organic matter-rich HS soil, complete dry-out was reached after 40 h, while it took 60 h to completely dry the GDZ soil. The difference in dry-out time was more pronounced below 20% WFPS, below which HS soil dried two times faster than GDZ soil (insert in Figure S1a).
Figure 2 presents calculated NO production and consumption rates in HS and GDZ soils as a function of WFPS. No NO production was recorded in flooded GDZ soils, and production was small in saturated HS soils. NO production increased gradually in all soils as WFPS fell below saturation, reaching a maximum in the low soil moisture range. In HS soils, NO production peaked at 21.0 ± 1.8% WFPS (mean and SD; n = 4; Figure 2a), whereas the optimum soil moisture for NO release in GDZ soils was 18.0 ± 2.8% WFPS (mean and SD, n = 3; Figure 2b). The four tested HS soils showed similar NO production kinetics over soil moisture, reaching maximum rates of ~8.0 ng N kg−1 s−1, except for HS-T3, which had a ~4 times larger maximum production rate. Maximum NO production rates of GDZ soils were the same order of magnitude as those of HS soils, albeit more variable.
All soils showed a pronounced maximum in NO consumption at intermediate soil moistures. In HS soils, maximum NO consumption was observed at the same WFPS as maximum NO production (Figure 2a), whereas in GDZ soils, maximum NO uptake occurred at significantly higher WFPS values than maximum production (52.0 ± 0.9% versus 18.0 ± 2.8%). Drying the soils to below 5% WFPS (inserts in Figure 2), resulted in a decline of NO production and consumption, before both processes peaked again at WFPS values below 1%. Under very dry conditions, uptake exceeded production in all soils.
Measured net NO release rates are shown in Figure S2. Surprisingly, at WFPS values above 60%, NO release rates under elevated ambient NO exceeded those measured under NO-free air, resulting in “positive” NO consumption rates (which we defined negative) at high soil moistures (Figure 2). This phenomenon was consistent for all seven incubated soils, both in HS and GDZ, suggesting that NO production in wet soils from TSP was stimulated intermittently by extraneous NO.
Temperature had no effect on the optimum soil moisture for NO net release in neither soil, as can be seen from a comparison NO gas phase kinetics at 20 and 30 °C in HS-T6 and GDZ-B3 (Figure 3). Calculated Q10 values were between 2 and 3, and quite stable over the entire soil moisture range (Figure 3, insert).

3.3. NO Compensation Mixing Ratios

NO compensation mixing ratios (NOC) were calculated from NO net release under zero and elevated NO concentrations by estimating k and solving Equation (2) for net exchange JNO = 0. NOC was dependent on soil moisture (Figure 4). Maxima for NOC were found at 28% WFPS for HS-T3 soil and at 12% WFPS in GDZ-B5 soil (Figure 4). The average NOC between 10% and 40% WFPS was 563 ± 352 ppb (mean ± SD) in HS soils, and 538 ± 170 ppb (mean ± SD) in GDZ soils.

3.4. N2O and CO2 Response to Dry-Out

Emission response of N2O and CO2 during dry-out were studied in a parallel dry-out experiment with the same soils. Dry out dynamics in terms of soil WFPS were similar to those obtained under automated flow-through conditions (Figure S1b). In the N2O experiment, it took a similar time (40 h) to dry HS and GDZ soils from saturation to 2% and 4% WFPS, respectively (Figure S1b). In general, largest N2O release was found at highest WFPS (Figure 5). Maximum N2O release rates for HS soils were quite variable with values around 2 ng N kg−1 s−1 in HS-T1 and HS-T3 and values around 6 ng N kg−1 s−1 in HS-T0 and HS-T5 (Figure 5a). N2O release in HS soils exceeded that in GDZ soils by one order of magnitude (0.2–0.5 ng N kg−1 s−1; Figure 5c). Upon dry-out, N2O release rates declined gradually, somewhat faster in HS than in GDZ soils, before reaching a minimum at the smallest measured WFPS.
The dynamics of CO2 release were similar to those of N2O, with largest release rates at high soil moisture and steady decline towards dry conditions (Figure 5b,d). As with N2O, the magnitude of CO2 release was clearly greater in HS than GDZ soils. However, the release pattern was different from that of N2O (Figure 5a,c). With decreasing WFPS, the CO2 release rates of GDZ soils declined more rapidly, whereas the more active and C-rich HS soils sustained elevated rates of CO2 release until WFPS values fell below 20%, upon which CO2 release dropped sharply (Figure 5b,d).

3.5. Mineral Nitrogen (NH4+ and NO3) during Dry-Out

Mineral N dynamics were measured in two soils, HS-T3 and GDZ-B5 in the NO experiment. In both soils, mineral N was dominated by KCl-extractable NH4+, being 75.3 and 6.0 mg N kg−1 dry soil respectively in HS and GDZ soils (Figure S3). The NH4+ and NO3 pool sizes in HS were significantly greater than that in GDZ soils (Figure S3). Extractable NH4+ did not change significantly during dry-out, except for a slight increase from 6.0 mg N kg−1 dry soil at 149% WFPS to 8.4 mg N kg−1 dry soil at 75% WFPS in the GDZ soil. In contrast, NO3 increased steadily from high to low moistures in both soils, from 28.4 to 39.2 mg N kg−1 dry soil in the HS soil and from 1.2 to 3.9 mg N kg−1 dry soil in the GDZ soil, indicating active net-nitrification in both soils.

3.6. NO/N2O Partitioning

Figure 6 shows the average partitioning of reactive gaseous N exchange between NO and N2O as a function of soil moisture. N2O-N loss accounted for 35% (GDZ) to 65% (HS) of total reactive N loss at saturation but dropped quickly in favor of NO-N loss to <20% as WFPS approached 60%. Integrated over the entire range of measured soil moistures, reactive N gas loss was dominated by NO (73% for HS soils and 85% for GDZ soils).

4. Discussion

4.1. Response of NO Production to Dry-Out

Much of the recent NO literature on soil moisture effects has focused on NO formation triggered by rewetting of predominately arid soils [31,32,33,34,35]. In the present study, we studied the reactive N gas response to dry-out rather than to rewetting of dry soil, because subtropical forest soils do not dry completely between monsoonal rains but undergo periodic, partly rapid soil moisture fluctuations [9,12,22]. Unlike the “pulse” emission in arid soils observed upon rewetting [31,36,37], a “smooth” NO response with decreasing WFPS was observed in our subtropical forest soils (Figure 2), with maximum NO production rates ranging from 3 to 30 ng N kg−1 s−1 (Figure 2), which are larger than previously reported rates for tropical forest soils (2.7 ng N kg−1 s−1) [38] and Chinese temperate forest soil (0.65 ng N kg−1 s−1) [39].
Maximum release rates were similar for soils from the hill slope and the groundwater discharge zone, except for HS-T3, which showed measurable NO production also in the wet range and had the overall largest production rate (Figure 2a). One reason for this could be that HS-T3 has a lower pH than the other hillslope soils (Table 1), probably supporting abiotic formation NO from HNO2 or NO2 also in the wet range. The similar magnitude of NO production rates across soils differing widely in soil organic carbon (SOC) and nitrogen (Table 1) is surprising. Many studies have found significant relationships between SOC content, mineral N availability, and C:N ratio on the one hand and NO emissions on the other [8,40,41,42,43]. However, mineral N availability in laboratory incubations may deviate from field conditions, in incubated soils tend to accumulate mineral N over time during drying-out from high to low soil moisture [35]. As can be seen from the mineral N dynamics in Figure S3, both HS and GDZ soils had considerable NH4+ (75.3 to 82.3 mg N kg−1 dry soil in HS soils and 6.0 to 8.4 mg N kg−1 dry soil in GDZ soils) and accumulated NO3 (28.4 to 39.2 mg N kg−1 dry soil in HS soils and 1.2 to 3.9 mg N kg−1 dry soil in GDZ soils), indicating unrestricted nitrification activity in both soils. Total cumulative NO-N and N2O-N loss in our experiment were 0.9 and 0.5 mg N kg−1 dry soil in HS and GDZ soils, respectively, amounting to 0.9% and 4.5% of the mineral N pools. This suggested that N availability was never limiting NO formation, thus not regulating NO production and consumption in our ex-situ experiment.
Maximum NO production rates were observed at 21 and 18% WFPS in HS and GDZ soils, respectively (Figure 2), which are comparable with WFPS optima for tropical forest soil (27%) [38] and temperate spruce forest soil (25%) [39]. NO production and consumption increased steadily with decreasing WFPS reaching a maximum in the low soil moisture range (Figure 2), which was independent of temperature (Figure 3). Q10 values for NO release ranged from 2 to 3 over the entire soil moisture range (Figure 3), indicating microbial temperature response [44]. Parker and Schimel (2011) [45] and Sullivan et al. (2012) [46] suggest that AOA (ammonia-oxidizing archaea) and AOB (ammonia-oxidizing bacteria) support the bulk of dry-season nitrification at very low soil moistures in drought-susceptible ecosystems. Collectively, this suggests that the NO release peak in our soils was driven by microbial processes, most likely nitrification. A similar conclusion was drawn by Behrendt et al. (2017) [35], who found multiple NO emission peaks when drying fertilized desert soils. In the latter study, the emission peak in the dry range was accompanied by increased transcriptional activity of archaeal amoA, the gene encoding for ammonia monooxygenase.
In general, chemical decomposition of NO2 to NO cannot be discarded in acidic soils. Venterea et al. (2005) [47] observed a strong soil moisture dependency of chemical NO formation in sterilized, NO2 amended soils. NO production increased with decreasing soil moisture, which they attributed to increasing soil acidity caused by the increasing ratio of the interfacial area to soil solution and the increasing importance of mineral and organic colloids for local pH. This may explain the observed maximum of NO release at low soil moisture in our study partly by chemical decomposition of biologically produced NO2.

4.2. Response of NO Consumption to Dry Out

A range of organisms can oxidize NO in soils to NO2 and further to NO3 under aerobic condition [48,49]. Under anaerobic conditions, the potentially most important sink for NO is its reduction to N2O by denitrifiers [50]. When HS soils were fumigated with 130 ppb NO, maximum consumption was observed at 20% WFPS, which coincided with the optimum soil moisture for NO production (Figure 2a). Concurrence of maximum NO production and uptake at the same soil moisture suggests that both fluxes are driven by the same process, most likely nitrification. However, in the wet range (>60% WFPS), net NO release of HS soils under elevated NO (130 ppb) was larger than under NO-free air, suggesting that the NO in the flushing air stimulated the process responsible for NO production in moist soil, i.e., denitrification. It has been shown that NO is an important signaling molecule during the induction of denitrification [51,52], which obviously was important in our experiments. This contradicts the common finding that NO consumption rates under anaerobic condition (i.e., by denitrification) are 1–2 orders of magnitude larger than under aerobic conditions [53]. We confirmed stimulation of denitrification in HS soils by extraneous NO in a separate experiment with anoxic HS soil in which we observed increased N2O and CO2 production upon spiking HS soils with 350 ppm NO (Figure S4).
When GDZ soils (GDZ-B5 and GDZ-B6) were flushed with air containing 300 ppb NO, NO consumption occurred over a wide soil moisture range (0–100% WFPS), with a maximum consumption rate at intermediate soil moisture (~50% WFPS), which was clearly greater than the optimum WFPS for NO production (~18% WFPS) in two out of three tested GDZ soils (Figure 2b), suggesting that NO reduction to N2O by denitrification plays a more important role for NO consumption in GDZ than in HS soils. This matches the evidence from biogeochemical field studies conducted at TSP so far, which unequivocally showed that the GDZ, despite its low microbial carrying capacity, is a “hot spot” for denitrification along the hydrological continuum [13,15].
Compensation mixing ratios (NOC) observed in HS-T3 and GDZ-B5 (Figure 4) were greater than values reported so far for a variety of different soils [39,54,55,56]. Remde et al. (1993) [54] reported a NOC of 121 ppb for a marsh soil, while Yu et al. (2010) [39] found NOC values ranging from 45.2 to 77.6 ppb for mountain forest soils sampled from different landscape zones. High NOC in the present study may be associated with the chronically elevated concentrations of inorganic N in our soils [12]. Johansson (1984) [57], for instance, found NOC to be significantly greater with fertilized (170 ppb) than with unfertilized soils (0.2–2 ppb). In the present study, high NOC values at low to intermediate WFPS in both HS and GDZ soils would mean that these soils are likely to act as a net source for NO throughout most of the summer, since ambient NO concentrations are low (~5.0 ppb) [22].

4.3. N2O Response to Dry-Out

As expected, N2O release rates were largest at high WFPS values (Figure 5a,c), which would suggest denitrification to be the dominant source [58]. The N2O release rates were greatest at around 100% WFPS, which contradicts the common observation that saturated soils emit less N2O, due to the longer residence time of N2O in soil and consequently the greater chance to be reduced to N2. This discrepancy may be explained by absence of diffusion constraint in the thin soil layer in our experiment. By readjusting saturation and flooding conditions right before starting the measurements, denitrification was induced, but rapid drying of the thin soil layer quickly oxygenated the soil and repressed denitrification. Since denitrification occurs as a sequential process [59], N2O reductase was probably never fully expressed, making N2O the dominant gaseous product of denitrification, irrespective of gaseous diffusivity [13].
GDZ soils released significantly less N2O than HS soils (Figure 5a,c), apparently reflecting the smaller NO3 and SOC content in soils of this landscape unit (Table 1). The lower N2O release in the wet range in GDZ as compared to HS soils is consistent with in situ observations which showed that N2O fluxes on HS soils are larger than those in GDZ soils [12], presumably because of a more rapid induction of N2O reductase in GDZ soils [13].

4.4. NO/N2O Partitioning

Figure 6 shows the partitioning of reactive N gas flux between NO and N2O in response to soil moisture, calculated from measured NO (at NO-free air) and N2O net release rates in HS and GDZ soils. NO emission clearly dominated N gas flux at low soil moisture, while in HS soils N2O was dominant at high soil moisture. This finding is consistent with Cheng et al. (2014) [60], who reported NO/N2O ratios > 1 for an acid subtropical coniferous forest soil ranging from 30% to 90% WFPS. As with TSP soils, the NO/N2O ratio increased with decreasing soil moisture. A similar pattern with NO emissions dominating in the dry soil moisture range was observed for field fluxes in a tropical forest [61,62] and for in situ measurements conducted in the TSP watershed [22]. At TSP, typical soil WFPS values throughout the year range from 20% to 70% on the hillslope and 70% to 90% in the groundwater discharge zone [12], leading to dominant NO emission from soils both on HS and in GDZ.

5. Conclusions

The present study investigates reactive N gas partitioning by soil moisture in acid subtropical forest soils from different landscape positions. Maxima for NO release were observed in the dry to intermediate soil moisture range, apparently driven by ammonia oxidation or by NO2 accumulation, supporting the notion that nitrification (or its intermediate NO2) is an important source for NO in acid, subtropical forest soils. Although similar in magnitude, we found distinct maxima for NO production and consumption in groundwater influenced soils, suggesting that denitrification may exert additional control on NO flux depending on landscape position. Below 50% WFPS, apparent compensation mixing ratios for NO exchange were among the highest so far reported for forest soils (180–1580 ppb), illustrating the dominance of NO-producing over NO- consuming processes in N-saturated subtropical forest soils. In contrast, the soil moisture response of N2O emissions appeared to be mainly controlled by the microbial resilience to dry-out, which differed between landscape elements. Considering the full range of soil moisture, soils tended to be a stronger source for NO-N than N2O-N.

Supplementary Materials

The following supporting information can be downloaded at: https://www.mdpi.com/article/10.3390/f13081291/s1, Figure S1: Dry-out curves at 30 °C for soils HS-T3 (filled circles) and GDZ-B5 (open circles) in (a) the NO experiment conducted at MPI Mainz and (b) the N2O experiment conducted in Norway. Figure S2: Net NO-N release rates in (a) HS-T0, HS-T1, HS-T3, HS-T5 and (b) GDZ-B2, GDZ-B5 and GDZ-B6 as a function of WFPS in the dry-out experiment with zero-NO flushing (filled triangles) and elevated NO flushing (at 130 ppb and 300 ppb in HS and GDZ soils, respectively; open circles). Inserts show NO release and uptake rates at WFPS < 6%. The temperature was 30 °C. Note different scales of x and y-axes. Figure S3: 2M KCl extractable NH4+ and NO3− in the dry-out experiment with soils from (a) HS-T3 and (b) GDZ-B5. Values are means and standard deviations (n = 3). Note different scales of x- and y-axes in (a,b). Figure S4: N2O-N, NO-N and CO2-C accumulation with and without spiking 10 g of moist mixed HS soil (60% WFPS) with 350 ppm NO. The soil was incubated anoxically in a crimp-sealed 120 mL serum bottle in a He-atmosphere. Solid lines indicate the treatment with NO addition, whereas dashed lines are the control without NO addition.

Author Contributions

Conceptualization, R.K., T.B. and P.D.; methodology, R.K. and T.B.; formal analysis, R.K.; data analysis, R.K.; writing—original draft preparation, R.K.; writing—review and editing, R.K., T.B., J.M. and P.D.; supervision, J.M. and P.D.; funding acquisition, R.K. and J.M. All authors have read and agreed to the published version of the manuscript.

Funding

This research was funded by the Norwegian Research Council (project 209696/E10) and Hundred Talents Program of Chinese Academy of Sciences (2019000186).

Institutional Review Board Statement

Not applicable.

Informed Consent Statement

The authors declare that the research was conducted in the absence of any commercial or financial relationships that could be construed as a potential conflict of interest.

Data Availability Statement

The data is included in the article.

Conflicts of Interest

The authors declare no conflict of interest.

References

  1. Crutzen, P.J. Role of NO and NO2 in the Chemistry of the Troposphere and Stratosphere. Annu. Rev. Earth Planet. Sci. 1979, 7, 443–472. [Google Scholar] [CrossRef]
  2. Larssen, T.; Lydersen, E.; Tang, D.G.; He, Y.; Gao, J.X.; Liu, H.Y.; Duan, L.; Seip, H.M.; Vogt, R.D.; Mulder, J.; et al. Acid rain in China. Environ. Sci. Technol. 2006, 40, 418–425. [Google Scholar] [CrossRef] [PubMed]
  3. Volk, C.M.; Elkins, J.W.; Fahey, D.W.; Dutton, G.S.; Gilligan, J.M.; Loewenstein, M.; Podolske, J.R.; Chan, K.R.; Gunson, M.R. Evaluation of source gas lifetimes from stratospheric observations. J. Geophys. Res.-Atmos. 1997, 102, 25543–25564. [Google Scholar] [CrossRef]
  4. Ravishankara, A.R.; Daniel, J.S.; Portmann, R.W. Nitrous Oxide (N2O): The Dominant Ozone-Depleting Substance Emitted in the 21st Century. Science 2009, 326, 123–125. [Google Scholar] [CrossRef] [PubMed]
  5. Denman, K.L.; Brasseur, G.; Chidthaisong, A.; Ciais, P.; Cox, P.M.; Dickinson, R.E.; Hauglustaine, D.; Heinze, C.; Holland, E.; Jacob, D.; et al. Couplings Between Changes in the Climate System and Biogeochemistry. In Climate Change 2007: The Physical Science Basis. Contribution of Working Group I to the Fourth Assessment Report of the Intergovernmental Panel on Climate Change; Cambridge University Press: Cambridge, UK, 2007. [Google Scholar]
  6. Steinkamp, J.; Lawrence, M.G. Improvement and evaluation of simulated global biogenic soil NO emissions in an AC-GCM. Atmos. Chem. Phys. 2011, 11, 6063–6082. [Google Scholar] [CrossRef]
  7. Butterbach-Bahl, K.; Gasche, R.; Huber, C.; Kreutzer, K.; Papen, H. Impact of N-input by wet deposition on N-trace gas fluxes and CH4-oxidation in spruce forest ecosystems of the temperate zone in Europe. Atmos. Environ. 1998, 32, 559–564. [Google Scholar] [CrossRef]
  8. Pilegaard, K.; Skiba, U.; Ambus, P.; Beier, C.; Bruggemann, N.; Butterbach-Bahl, K.; Dick, J.; Dorsey, J.; Duyzer, J.; Gallagher, M.; et al. Factors controlling regional differences in forest soil emission of nitrogen oxides (NO and N2O). Biogeosciences 2006, 3, 651–661. [Google Scholar] [CrossRef]
  9. Li, D.; Wang, X.; Mo, J.; Sheng, G.; Fu, J. Soil nitric oxide emissions from two subtropical humid forests in south China. J. Geophys. Res. 2007, 112, 8680. [Google Scholar] [CrossRef]
  10. Huang, Y.; Li, D. Soil nitric oxide emissions from terrestrial ecosystems in China: A synthesis of modeling and measurements. Sci. Rep. 2014, 4, 7406. [Google Scholar] [CrossRef]
  11. Ke, P.; Kang, R.; Avery, L.K.; Zhang, J.; Yu, Q.; Xie, D.; Duan, L. Temporal variations of soil NO and NO2 fluxes in two typical subtropical forests receiving contrasting rates of N deposition. Environ. Pollut. 2022, 295, 118696. [Google Scholar] [CrossRef]
  12. Zhu, J.; Mulder, J.; Wu, L.P.; Meng, X.X.; Wang, Y.H.; Dorsch, P. Spatial and temporal variability of N2O emissions in a subtropical forest catchment in China. Biogeosciences 2013, 10, 1309–1321. [Google Scholar] [CrossRef]
  13. Zhu, J.; Mulder, J.; Solheimslid, S.O.; Dorsch, P. Functional traits of denitrification in a subtropical forest catchment in China with high atmogenic N deposition. Soil Biol. Biochem. 2013, 57, 577–586. [Google Scholar] [CrossRef]
  14. Zhu, J.; Mulder, J.; Bakken, L.; Dorsch, P. The importance of denitrification for N2O emissions from an N-saturated forest in SW China: Results from in situ N-15 labeling experiments. Biogeochemistry 2013, 116, 103–117. [Google Scholar] [CrossRef]
  15. Yu, L.F.; Zhu, J.; Mulder, J.; Dorsch, P. Multiyear dual nitrate isotope signatures suggest that N-saturated subtropical forested catchments can act as robust N sinks. Glob. Chang. Biol. 2016, 22, 3662–3674. [Google Scholar] [CrossRef]
  16. Yu, L.; Mulder, J.; Zhu, J.; Zhang, X.; Wang, Z.; Dorsch, P. Denitrification as a major regional nitrogen sink in subtropical forest catchments: Evidence from multi-site dual nitrate isotopes. Glob. Chang. Biol. 2019, 25, 1765–1778. [Google Scholar] [CrossRef]
  17. Firestone, M.K.; Davidson, E.A. Microbiological Basis of NO and N2O Production and Consumption in Soil. In Exchange of Trace Gases between Terrestrial Ecosystems and the Atmosphere; Andreae, M.O., Schimel, D.S., Eds.; John Wiley & Sons Ltd.: New York, NY, USA, 1989; Volume 47, pp. 7–21. [Google Scholar]
  18. Skopp, J.; Jawson, M.D.; Doran, J.W. Steady-State Aerobic Microbial Activity as a Function of Soil-Water Content. Soil Sci. Soc. Am. J. 1990, 54, 1619–1625. [Google Scholar] [CrossRef]
  19. Oswald, R.; Behrendt, T.; Ermel, M.; Wu, D.; Su, H.; Cheng, Y.; Breuninger, C.; Moravek, A.; Mougin, E.; Delon, C.; et al. HONO Emissions from Soil Bacteria as a Major Source of Atmospheric Reactive Nitrogen. Science 2013, 341, 1233–1235. [Google Scholar] [CrossRef]
  20. VanCleemput, O.; Samater, A.H. Nitrite in soils: Accumulation and role in the formation of gaseous N compounds. Fertil. Res. 1996, 45, 81–89. [Google Scholar] [CrossRef]
  21. Wei, J.; Amelung, W.; Lehndorff, E.; Schloter, M.; Vereecken, H.; Brüggemann, N. N2O and NOx emissions by reactions of nitrite with soil organic matter of a Norway spruce forest. Biogeochemistry 2017, 132, 325–342. [Google Scholar] [CrossRef]
  22. Kang, R.H.; Mulder, J.; Duan, L.; Dorsch, P. Spatial and temporal variability of soil nitric oxide emissions in N-saturated subtropical forest. Biogeochemistry 2017, 134, 337–351. [Google Scholar] [CrossRef]
  23. Chen, X.Y.; Mulder, J. Atmospheric deposition of nitrogen at five subtropical forested sites in South China. Sci. Total Environ. 2007, 378, 317–330. [Google Scholar] [CrossRef] [PubMed]
  24. Huang, Y.M.; Kang, R.H.; Mulder, J.; Zhang, T.; Duan, L. Nitrogen saturation, soil acidification, and ecological effects in a subtropical pine forest on acid soil in southwest China. J. Geophys. Res. Biogeosci. 2015, 120, 2457–2472. [Google Scholar] [CrossRef]
  25. Chen, X.Y.; Mulder, J. Indicators for nitrogen status and leaching in subtropical forest ecosystems, South China. Biogeochemistry 2007, 82, 165–180. [Google Scholar] [CrossRef]
  26. Sorbotten, L.E.; Stolte, J.; Wang, Y.H.; Mulder, J. Hydrological Responses and Flow Pathways in an Acrisol on a Forested Hillslope with a Monsoonal Subtropical Climate. Pedosphere 2017, 27, 1037–1048. [Google Scholar] [CrossRef]
  27. Bargsten, A.; Falge, E.; Pritsch, K.; Huwe, B.; Meixner, F.X. Laboratory measurements of nitric oxide release from forest soil with a thick organic layer under different understory types. Biogeosciences 2010, 7, 1425–1441. [Google Scholar] [CrossRef]
  28. Behrendt, T.; Veres, P.R.; Ashuri, F.; Song, G.; Flanz, M.; Mamtimin, B.; Bruse, M.; Williams, J.; Meixner, F.X. Characterisation of NO production and consumption: New insights by an improved laboratory dynamic chamber technique. Biogeosciences 2014, 11, 5463–5492. [Google Scholar] [CrossRef]
  29. Remde, A.; Slemr, F.; Conrad, R. Microbial-Production and Uptake of Nitric-Oxide in Soil. FEMS Microbiol. Ecol. 1989, 62, 221–230. [Google Scholar] [CrossRef]
  30. Molstad, L.; Dorsch, P.; Bakken, L.R. Robotized incubation system for monitoring gases (O2, NO, N2O N2) in denitrifying cultures. J. Microbiol. Methods 2007, 71, 202–211. [Google Scholar] [CrossRef]
  31. Homyak, P.M.; Sickman, J.O. Influence of soil moisture on the seasonality of nitric oxide emissions from chaparral soils, Sierra Nevada, California, USA. J. Arid Environ. 2014, 103, 46–52. [Google Scholar] [CrossRef]
  32. Werner, C.; Reiser, K.; Dannenmann, M.; Hutley, L.B.; Jacobeit, J.; Butterbach-Bahl, K. N2O, NO, N2 and CO2 emissions from tropical savanna and grassland of northern Australia: An incubation experiment with intact soil cores. Biogeosciences 2014, 11, 6047–6065. [Google Scholar] [CrossRef]
  33. Homyak, P.M.; Blankinship, J.C.; Marchus, K.; Lucero, D.M.; Sickman, J.O.; Schimel, J.P. Aridity and plant uptake interact to make dryland soils hotspots for nitric oxide (NO) emissions. Proc. Natl. Acad. Sci. USA 2016, 113, E2608–E2616. [Google Scholar] [CrossRef] [PubMed]
  34. Homyak, P.M.; Kamiyama, M.; Sickman, J.O.; Schimel, J.P. Acidity and organic matter promote abiotic nitric oxide production in drying soils. Glob. Chang. Biol. 2017, 23, 1735–1747. [Google Scholar] [CrossRef] [PubMed]
  35. Behrendt, T.; Braker, G.; Song, G.; Pommerenke, B.; Dörsch, P. Nitric oxide emission response to soil moisture is linked to transcriptional activity of functional microbial groups. Soil Biol. Biochem. 2017, 115, 337–345. [Google Scholar] [CrossRef]
  36. Song, L.; Drewer, J.; Zhu, B.; Zhou, M.; Cowan, N.; Levy, P.; Skiba, U. The impact of atmospheric N deposition and N fertilizer type on soil nitric oxide and nitrous oxide fluxes from agricultural and forest Eutric Regosols. Biol. Fertil. Soils 2020, 56, 1077–1090. [Google Scholar] [CrossRef]
  37. Krichels, A.H.; Homyak, P.M.; Aronson, E.L.; Sickman, J.O.; Botthoff, J.; Shulman, H.; Piper, S.; Andrews, H.M.; Jenerette, G.D. Rapid nitrate reduction produces pulsed NO and N2O emissions following wetting of dryland soils. Biogeochemistry 2022, 158, 233–250. [Google Scholar] [CrossRef]
  38. van Dijk, S.M.; Meixner, F.X. Production and consumption of NO in forest and pasture soils from the Amazon basin. Water Air Soil Pollut. Focus 2001, 1, 119–130. [Google Scholar] [CrossRef]
  39. Yu, J.B.; Meixner, F.X.; Sun, W.D.; Mamtimin, B.; Xia, C.H.; Xie, W.J. Biogenic Nitric Oxide Emission of Mountain Soils Sampled from Different Vertical Landscape Zones in the Changbai Mountains, Northeastern China. Environ. Sci. Technol. 2010, 44, 4122–4128. [Google Scholar] [CrossRef]
  40. Pilegaard, K.; Hummelshoj, P.; Jensen, N.O. Nitric oxide emission from a Norway spruce forest floor. J. Geophys. Res. Atmos. 1999, 104, 3433–3445. [Google Scholar] [CrossRef]
  41. Gharahi Ghehi, N.; Werner, C.; Cizungu Ntaboba, L.; Mbonigaba Muhinda, J.J.; Van Ranst, E.; Butterbach-Bahl, K.; Kiese, R.; Boeckx, P. Spatial variations of nitrogen trace gas emissions from tropical mountain forests in Nyungwe, Rwanda. Biogeosciences 2012, 9, 1451–1463. [Google Scholar] [CrossRef]
  42. Luo, G.J.; Bruggemann, N.; Wolf, B.; Gasche, R.; Grote, R.; Butterbach-Bahl, K. Decadal variability of soil CO2, NO, N2O, and CH4 fluxes at the Hoglwald Forest, Germany. Biogeosciences 2012, 9, 1741–1763. [Google Scholar] [CrossRef]
  43. Vourlitis, G.L.; DeFotis, C.; Kristan, W. Effects of soil water content, temperature and experimental nitrogen deposition on nitric oxide (NO) efflux from semiarid shrubland soil. J. Arid Environ. 2015, 117, 67–74. [Google Scholar] [CrossRef]
  44. Kirschbaum, M.U.F. The Temperature-Dependence of Soil Organic-Matter Decomposition, and the Effect of Global Warming on Soil Organic-C Storage. Soil Biol. Biochem. 1995, 27, 753–760. [Google Scholar] [CrossRef]
  45. Parker, S.S.; Schimel, J.P. Soil nitrogen availability and transformations differ between the summer and the growing season in a California grassland. Appl. Soil Ecol. 2011, 48, 185–192. [Google Scholar] [CrossRef]
  46. Sullivan, B.W.; Selmants, P.C.; Hart, S.C. New evidence that high potential nitrification rates occur in soils during dry seasons: Are microbial communities metabolically active during dry seasons? Soil Biol. Biochem. 2012, 53, 28–31. [Google Scholar] [CrossRef]
  47. Venterea, R.T.; Rolston, D.E.; Cardon, Z.G. Effects of soil moisture, physical, and chemical characteristics on abiotic nitric oxide production. Nutr. Cycl. Agroecosyst. 2005, 72, 27–40. [Google Scholar] [CrossRef]
  48. Gardner, P.R.; Gardner, A.M.; Martin, L.A.; Salzman, A.L. Nitric oxide dioxygenase: An enzymic function for flavohemoglobin. Proc. Natl. Acad. Sci. USA 1998, 95, 10378–10383. [Google Scholar] [CrossRef] [PubMed]
  49. Gusarov, I.; Gautier, L.; Smolentseva, O.; Shamovsky, I.; Eremina, S.; Mironov, A.; Nudler, E. Bacterial Nitric Oxide Extends the Lifespan of C. elegans. Cell 2013, 152, 818–830. [Google Scholar] [CrossRef] [PubMed]
  50. Gardner, A.M.; Helmick, R.A.; Gardner, P.R. Flavorubredoxin, an inducible catalyst for nitric oxide reduction and detoxification Escherichia coli. J. Biol. Chem. 2002, 277, 8172–8177. [Google Scholar] [CrossRef]
  51. Van Spanning, R.J.M.; Richardson, D.; Ferguson, S. Introduction to the biochemistry and molecular biology of denitrification. In Biology of the Nitrogen Cycle; Bothe, H., Ferguson, S., Newton, W.E., Eds.; Elsevier: Amsterdam, The Netherlands, 2007. [Google Scholar]
  52. Nadeem, S.; Dorsch, P.; Bakken, L.R. Autoxidation and acetylene-accelerated oxidation of NO in a 2-phase system: Implications for the expression of denitrification in ex situ experiments. Soil Biol. Biochem. 2013, 57, 606–614. [Google Scholar] [CrossRef]
  53. Koschorreck, M.; Conrad, R. Kinetics of nitric oxide consumption in tropical soils under oxic and anoxic conditions. Biol. Fertil. Soils 1997, 25, 82–88. [Google Scholar] [CrossRef]
  54. Remde, A.; Ludwig, J.; Meixner, F.X.; Conrad, R. A Study to Explain the Emission of Nitric-Oxide from a Marsh Soil. J. Atmos. Chem. 1993, 17, 249–275. [Google Scholar] [CrossRef]
  55. Otter, L.B.; Yang, W.X.; Scholes, M.C.; Meixner, F.X. Nitric oxide emissions from a southern African savanna. J. Geophys. Res. Atmos. 1999, 104, 18471–18485. [Google Scholar] [CrossRef]
  56. Feig, G.T.; Mamtimin, B.; Meixner, F.X. Soil biogenic emissions of nitric oxide from a semi-arid savanna in South Africa. Biogeosciences 2008, 5, 1723–1738. [Google Scholar] [CrossRef]
  57. Johansson, C. Field-Measurements of Emission of Nitric-Oxide from Fertilized and Unfertilized Forest Soils in Sweden. J. Atmos. Chem. 1984, 1, 429–442. [Google Scholar] [CrossRef]
  58. Wolf, I.; Russow, R. Different pathways of formation of N2O, N2 and NO in black earth soil. Soil Biol. Biochem. 2000, 32, 229–239. [Google Scholar] [CrossRef]
  59. Betlach, M.R.; Tiedje, J.M. Kinetic Explanation for Accumulation of Nitrite, Nitric-Oxide, and Nitrous-Oxide during Bacterial Denitrification. Appl. Environ. Microb. 1981, 42, 1074–1084. [Google Scholar] [CrossRef] [PubMed]
  60. Cheng, Y.; Wang, J.; Wang, S.Q.; Cai, Z.C.; Wang, L. Effects of temperature change and tree species composition on N2O and NO emissions in acidic forest soils of subtropical China. J. Environ. Sci. China 2014, 26, 617–625. [Google Scholar] [CrossRef]
  61. Davidson, E.A.; Nepstad, D.C.; Ishida, F.Y.; Brando, P.M. Effects of an experimental drought and recovery on soil emissions of carbon dioxide, methane, nitrous oxide, and nitric oxide in a moist tropical forest. Glob. Chang. Biol. 2008, 14, 2582–2590. [Google Scholar] [CrossRef]
  62. van Lent, J.; Hergoualc’h, K.; Verchot, L.V. Reviews and syntheses: Soil N2O and NO emissions from land use and land-use change in the tropics and subtropics: A meta-analysis. Biogeosciences 2015, 12, 7299–7313. [Google Scholar] [CrossRef]
Figure 1. (a) The TieShanPing (TSP) forest catchment, Chongqing, China and (b) plot layout along two transects following the hydrological flow path on hillslope (HS-T0 to HS-T5) and the groundwater discharge zone (GDZ-B1 to GDZ-B6). Adapted from Zhu et al. (2013) [12].
Forests 13 01291 g001
Figure 2. NO-N production (filled triangles) and consumption (calculated based on Equation (2)) (open circles) in (a) hillslope soils (HS-T0, HS-T1, HS-T3, HS-T5) and (b) soils from the groundwater discharge zone (GDZ-B2, GDZ-B5, GDZ-B6) as a function of water filled pore space (WFPS) in the dry-out experiment at 30 °C. NO production is positive, while NO consumption is negative. Positive consumption rates denote situations where the NO release rates under elevated NO mixing ratios were larger than under NO-free air. Inserts show NO production and consumption rates at <6% WFPS. Note different scales of x- and y-axes in (a,b). WFPS > 100% indicates flooded soils.
Forests 13 01291 g002
Figure 3. Effect of temperature on net NO-N release of (a) HS-T3 and (b) GDZ-B6. The insert in (a) shows calculated Q10 values for both soils over the entire WFPS range.
Forests 13 01291 g003
Figure 4. NO compensation mixing ratios at 30 °C as a function of WFPS for soils HS-T3 and GDZ-B5 (calculated based on Equation (2)).
Forests 13 01291 g004
Figure 5. N2O-N and CO2-C release rates of (a,b) HS soils HS-T0, HS-T1, HS-T3, HS-T5 and (c,d) GDZ soils GDZ-B2, GDZ-B5 and GDZ-B6 as a function of WFPS in the dry-out experiment at 30 °C. Values are means and standard deviations. Note different scales of y-axes for (a,b) and (c,d).
Forests 13 01291 g005
Figure 6. Partitioning of gaseous N loss between NO and N2O over WFPS in HS and GDZ soils, expressed as mole N percent of NO in total reactive N gas release (N2O + NO). Shown are mean values (bold solid lines) and standard deviations (fine dashed lines) for HS soils (blue line, n = 4) and for GDZ soils (yellow line, n = 2).
Forests 13 01291 g006
Table 1. Chemical and physical soil parameters on the hillslope (HS) and in the groundwater discharge zone (GDZ) in the TieShanPing forest park, Chongqing, China (Figure 1). Means and standard deviations (n = 3).
SitesHorizonDepth
(cm)
NH4+-N
(mg kg−1 dw)
NO3-N
(mg kg−1 dw)
pHH2OTOC
(g kg−1)
TN
(g kg−1)
C/NBulk Density
(kg m−3)
Particle Density
(kg m−3)
HST0
T1
T3
T5
O
(F and H layers)
~0–182.1 (0.4)
63.7 (3.6)
66.8 (1.7)
90.6 (2.8)
17.9 (0.9)
31.6 (1.9)
26.7 (1.0)
14.5 (0.7)
4.4 (0.0)
5.1 (0.0)
4.2 (0.0)
4.3 (0.0)
230
285
250
225
11.6
12.8
12.3
10.0
19.8
22.3
20.3
22.5
300
300
300
370
1600
HS-Mean (SD)75.8 (11.7)22.7 (7.1)4.5 (0.4)248 (27)11.7 (1.2)21.2 (1.4)318 (35)
GDZB2
B5
B6
A~0–222.3 (0.9)
10.2 (0.8)
8.3 (0.6)
<0.01 mg N L−1 ‡
1.2 (0.0)
0.8 (0.0)
5.3 (0.0)
4.6 (0.0)
5.2 (0.0)
29.4
62.5
42.7
2.0
4.7
3.7
14.7
13.3
11.5
1330
920
1000
2600
GDZ-Mean (SD)13.6 (6.6)1.0 (0.2)5.0 (0.3)44.9 (16.7)3.5 (1.4)13.2 (1.6)1083 (217)
for remoulded soils as used in the experiments; detection limit.
Publisher’s Note: MDPI stays neutral with regard to jurisdictional claims in published maps and institutional affiliations.

